Embed Size (px)
Citation preview
Journal of Engineering and Sustainable Development Vol. 21, No. 6, November 2017 www.jeasd.org (ISSN 2520-0917)
39
EXPERIMENTAL VERIFICATION OF STRUT AND TIE METHOD
FOR REINFORCED CONCRETE DEEP BEAMS UNDER
VARIOUS TYPES OF LOADINGS
Dr. Khattab Saleem Abdul-Razzaq
1, *Sarah Farhan Jebur
2
1) Asst. Prof., Civil Engineering Department, Diyala University, Iraq.
2) Civil Engineering Department, Diyala University, Iraq.
Abstract: Strut-and-tie method (STM) is a very useful tool to design the irregular concrete members.
This work presents the results of the experimental tests conducted on three self-compacting reinforced
concrete deep beams that had a constant cross section of 150 mm×400 mm and a total length of 1400 mm.
The beams were subjected to 1-concentrated force, 2-concentrated forces and uniformly distributed load.
Each test beam was analyzed by using the STM that presented by ACI 318M-14 provisions. The cracking
load, failure load, deflection, crack pattern, crack width, steel reinforcement strains, concrete surface
average strains and modes of failure for the tested beams were observed, recorded and discussed. The
experimental results were compared with the STM results. Test results indicated that each beam carried
loads greater than the STM design load. In other words, results showed that the STM is conservative that
gives the designers wide flexibility. More specifically, in case of central single concentrated force, STM
predicted ultimate load was less than the experimental one by 19.2%. While STM predicted ultimate load
was less than the experimental one by 20.4% in the cases of two central concentrated forces and
uniformly distributed load.
Keywords: Deep beams, Various Loadings, Strut-and-tie method.
( في العحبات الخرسانية المسلحة العميقة STMالعملي لطريقة الدعامة ورباط الشد ) الححقق
ذاجية الرص جحث جأثيرأحمال مخحلفة
انخظت. يؼشع هزا انبحذ انخائج هي أداة ليت نخظيى انؼاطش انخشسايت غيش (STM) انذػايت وسباط انشذطشيمت الخالصة:
وبطىل يهى 011× يهى 051 انخخبشيت انخي اجشيج ػهى رالد ػخباث خشسايت يسهحت ػيمت راحيت انشص وانخي نها يمطغ ػشضي رابج
اع ححيم يخخهفت، وهي حم انمىة انشكزة، حم انمىحي انشكزحي وانحم انخششرالد اى إنى خباثانؼ جحؼشض .يهى 0011 كهي
نهخشسات االيشيكي انؼهذ يذوت ي -أ - انهحك في انبي (STM) انشذ وسباط انذػايت ىرجباسخخذاو ػخبت كم ححهيم حى انخظى.
ACI 318M-14انشمىق واالفؼاالث ػشع انشمىق وأاط ويمذاس انهطىل و انفشم محو حم انخشمك . حى سطذ و حسجيم و يالشت
لىسج انخائج انؼهيت يغ خائج طشيمت اخخباسها.نهؼخباث انؼيمت انخي حى انفشم اىاعسطح انخشسات و االفؼاالث ػهىيخىسط في انحذيذ و
STMبأ طشيمت بؼى اخش بيج انخائج .انحم انخظيي ي شأكب حم . خائج انفحض بيج بأ كم ىرج حى اخخباس ػهيا يماوو
STM المركزة كانت النتائج العملية اكبر من النتائج النظرية القوة حالة في انشوت حيذ بمذس كبيش ي نهظى وحسح هي يخحفظت المركزتين والحمل المنتشر المنتظم. القوتين حالتي حمل في٪ 20.4 حين كانت حوالي في٪. 19.2 بحولي
1. Introduction
Reinforced concrete (RC) deep beams were often used and encountered in many
structural applications such as diaphragms, bridges, water tanks, precast and prestressed
Vol. 21, No. 6, November 2017
ISSN 2520-0917
www.jeasd.org
Journal of Engineering and Sustainable Development Vol. 21, No. 6, November 2017 www.jeasd.org (ISSN 2520-0917)
40
construction, foundations, silos, bunkers, offshore structures and tall buildings. With the
rapid development of construction in many countries, deep beam at its behavior
predication is a subject of attention [1, 2]. The ACI 318M-10 Code defines deep beams
as [3]: Members subjected to loads on one face and supported on the reverse face so that
compressive struts can grow between the points of load and the supports. Deep beams
have one or the other:
1) Clear spans , less than or equal to 4 times the whole member depth h; or
2) Concentrated loadings zones within double the depth of the member from the face of
the support.
The shear critical section should be taken into considerations at a distance from face
of support about )0.15 ln ≤ d( for deep beams that loaded uniformly and of )0.5 a ≤ d(
for concentrated loaded deep beams, where (a) represent the shear span, or distance
from concentrated load to center of support and (d) represent the distance from extreme
compressive fiber to the centroid of the tension reinforcement [4].
In the design of concrete structures, there are many limitations in the use of classical
beam theory and classical sectional analysis. In areas where there is a change in loading
or cross section, these typical design techniques often do not produce significant results.
These regions are often called D-regions or disturbed regions [4]. Strut-and-tie models
(STM) can be used to analyze these D-regions. In theory, STM provides lower-bound
and safe designs [5-18]. Strut-and-tie modeling is a very useful tool to design the
unusual or complex reinforced concrete members. It is a fact that there is important
literature on strut-and-tie modeling, but there are not a large number of experimental
validations of it. Therefore, this research is considered here as an attempt to study the
application of this theory experimentally.
2. Experimental Program
To recognize beams designation simply, “Table 1” shows the system followed in
beams designation.
The experimental program consisted of constructing and testing three simply
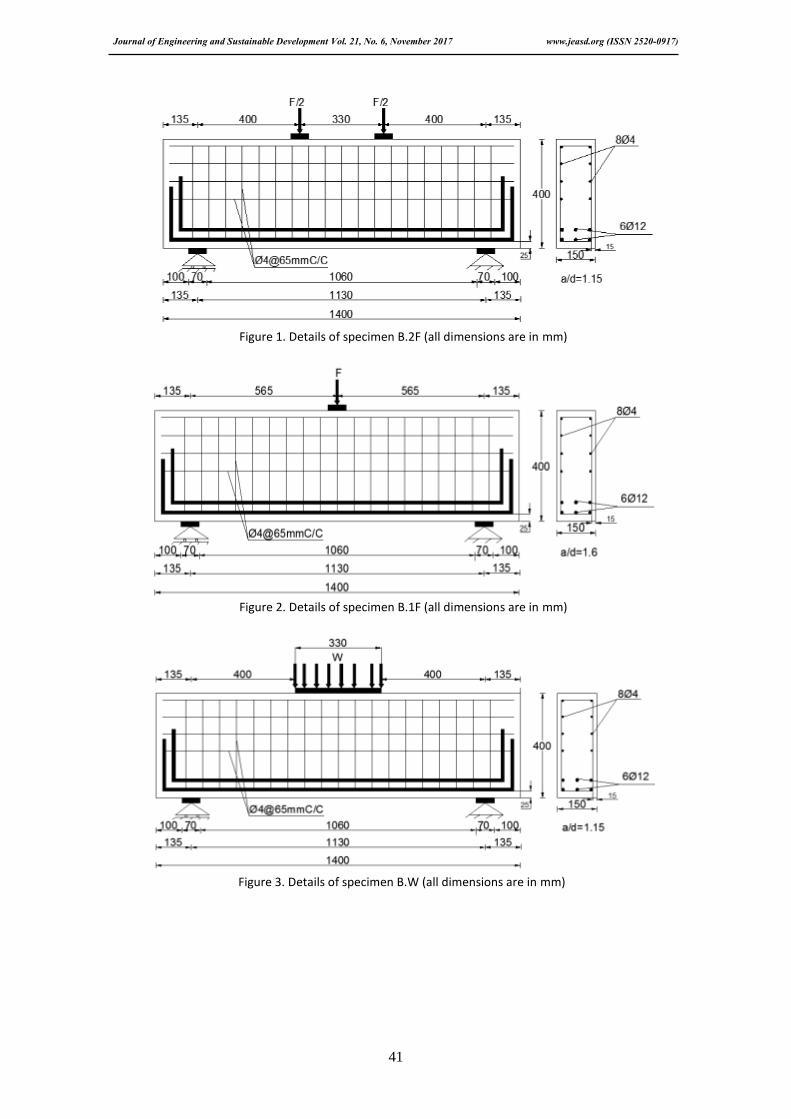
supported SCC deep beams. All beams B.2F, B.1F and B.W had the same dimensions
as shown in "Figures 1, 2 and 3". They had a length of 1400 mm, a height of 400 mm
and a width of 150 mm. The three beams were designed to fail in shear.
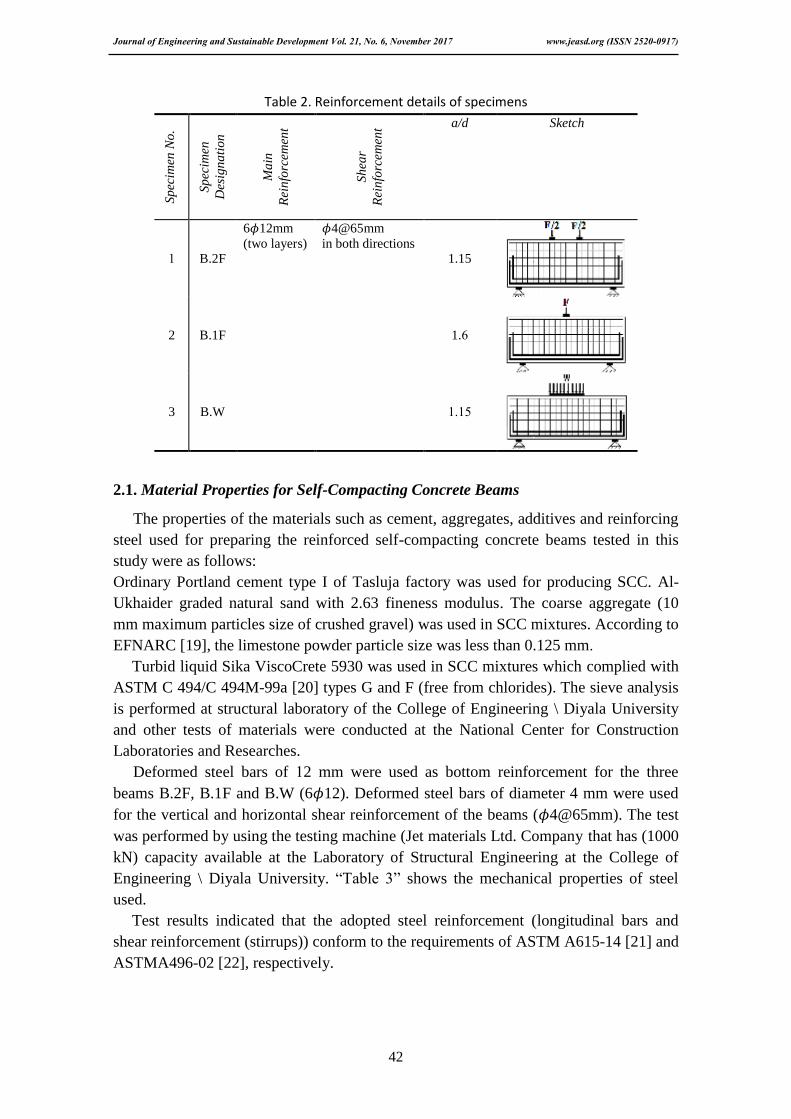
The amount of flexural bottom reinforcement was 6 12mm (ρ 1.100= where ρ is the
reinforcement ratio for flexure), see “Table 2”. The shear reinforcement amount for the
beams was 4mm@65mm. The beams B.2F, B.1F and B.W were tested with a clear
span ( ) of 1060 mm which resulted in a ratio of clear span ( ) to overall depth (h)
equals to ( /h=2.65) which was less than 4 [3].
Table 1. Beams designation way
Letter Meaning
B eamBDeep
1F ) Fconcentrated force (-1Subjected to
2F ), which means actually (2*0.5F)2Fconcentrated forces (-2Subjected to
W )WSubjected to Uniformly Distributed load (
Journal of Engineering and Sustainable Development Vol. 21, No. 6, November 2017 www.jeasd.org (ISSN 2520-0917)
41
Figure 1. Details of specimen B.2F (all dimensions are in mm)
Figure 2. Details of specimen B.1F (all dimensions are in mm)
Figure 3. Details of specimen B.W (all dimensions are in mm)
Journal of Engineering and Sustainable Development Vol. 21, No. 6, November 2017 www.jeasd.org (ISSN 2520-0917)
42
Table 2. Reinforcement details of specimens
Sp
ecim
en N
o.
Sp
ecim
en
Des
ign
ati
on
Ma
in
Rei
nfo
rcem
ent
Sh
ear
Rei
nfo
rcem
ent
a/d Sketch
0 B.2F
6 12mm
(two layers)
4@65mm
in both directions 1.15
2 B.1F 1.6
3 B.W 0.05
2.1. Material Properties for Self-Compacting Concrete Beams
The properties of the materials such as cement, aggregates, additives and reinforcing
steel used for preparing the reinforced self-compacting concrete beams tested in this
study were as follows:
Ordinary Portland cement type I of Tasluja factory was used for producing SCC. Al-
Ukhaider graded natural sand with 2.63 fineness modulus. The coarse aggregate (10
mm maximum particles size of crushed gravel) was used in SCC mixtures. According to
EFNARC [19], the limestone powder particle size was less than 0.125 mm.
Turbid liquid Sika ViscoCrete 5930 was used in SCC mixtures which complied with
ASTM C 494/C 494M-99a [20] types G and F (free from chlorides). The sieve analysis
is performed at structural laboratory of the College of Engineering \ Diyala University
and other tests of materials were conducted at the National Center for Construction
Laboratories and Researches.
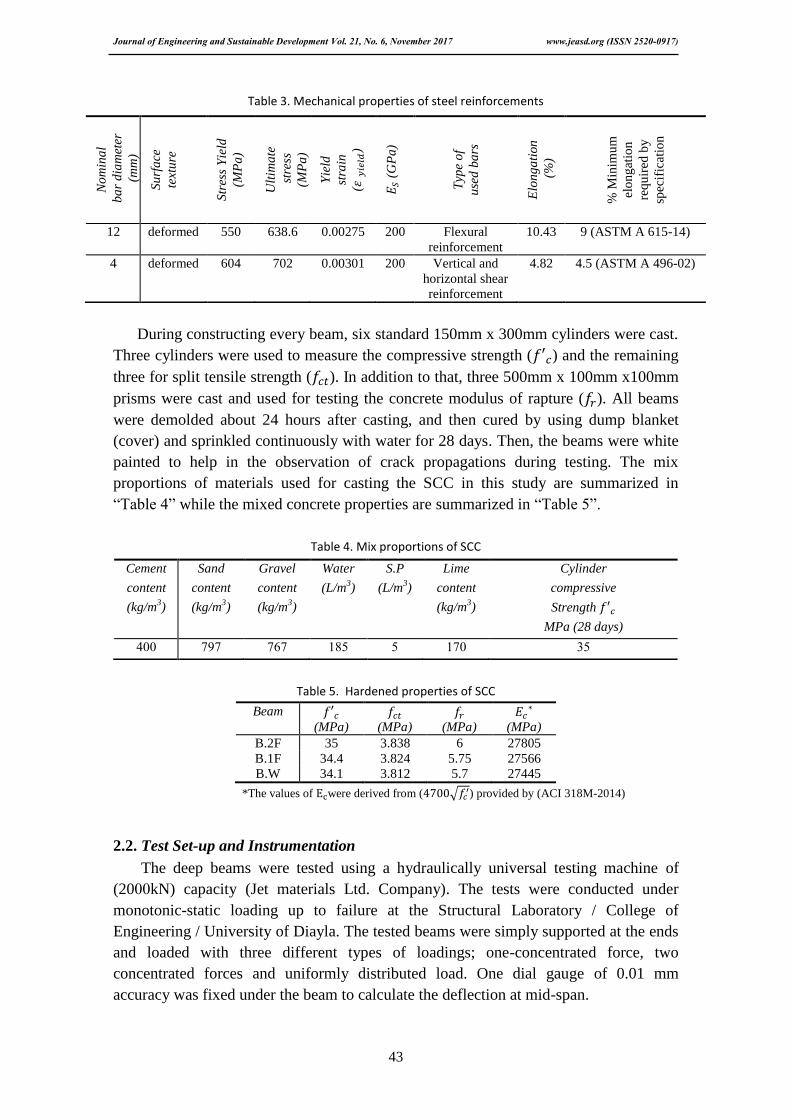
Deformed steel bars of 02 mm were used as bottom reinforcement for the three
beams B.2F, B.1F and B.W (6 12). Deformed steel bars of diameter 4 mm were used
for the vertical and horizontal shear reinforcement of the beams ( 4@65mm). The test
was performed by using the testing machine (Jet materials Ltd. Company that has (1000
kN) capacity available at the Laboratory of Structural Engineering at the College of
Engineering \ Diyala University. “Table 3” shows the mechanical properties of steel
used. Test results indicated that the adopted steel reinforcement (longitudinal bars and
shear reinforcement (stirrups)) conform to the requirements of ASTM A615-14 [21] and
ASTMA496-02 [22], respectively.
Journal of Engineering and Sustainable Development Vol. 21, No. 6, November 2017 www.jeasd.org (ISSN 2520-0917)
43
Table 3. Mechanical properties of steel reinforcements
During constructing every beam, six standard 150mm x 300mm cylinders were cast.
Three cylinders were used to measure the compressive strength ( ) and the remaining
three for split tensile strength ( ). In addition to that, three 500mm x 100mm x100mm
prisms were cast and used for testing the concrete modulus of rapture ( ). All beams
were demolded about 24 hours after casting, and then cured by using dump blanket
(cover) and sprinkled continuously with water for 28 days. Then, the beams were white
painted to help in the observation of crack propagations during testing. The mix
proportions of materials used for casting the SCC in this study are summarized in
“Table 4” while the mixed concrete properties are summarized in “Table 5”.
Table 4. Mix proportions of SCC
Table 5. Hardened properties of SCC
Beam
(MPa)
(MPa)
(MPa)
(MPa)
B.2F 35 3.838 6 27805
B.1F 34.4 3.824 5.75 27566
B.W 34.1 3.812 5.7 27445
*The values of were derived from ( √ ) provided by (ACI 318M-2014)
2.2. Test Set-up and Instrumentation
The deep beams were tested using a hydraulically universal testing machine of
(2011kN) capacity (Jet materials Ltd. Company). The tests were conducted under
monotonic-static loading up to failure at the Structural Laboratory / College of
Engineering / University of Diayla. The tested beams were simply supported at the ends
and loaded with three different types of loadings; one-concentrated force, two
concentrated forces and uniformly distributed load. One dial gauge of 0.01 mm
accuracy was fixed under the beam to calculate the deflection at mid-span.
No
min
al
ba
r d
iam
eter
(m
m)
Su
rfa
ce
text
ure
Yie
ld
Str
ess
(MP
a)
Ult
ima
te
str
ess
(MP
a)
Yie
ld st
rain
(
)
(
GP
a)
Typ
e o
f u
sed
ba
rs E
lon
ga
tion
(%
)
% M
inim
um
elo
ng
atio
n
req
uir
ed b
y
spec
ific
atio
n
12 deformed 550 638.6 0.00275 200 Flexural
reinforcement
10.43 9 (ASTM A 615-14)
4 deformed 604 702 0.00301 200 Vertical and
horizontal shear
reinforcement
4.82 4.5 (ASTM A 496-02)
Cement
content
(kg/m3)
Sand
content
(kg/m3)
Gravel
content
(kg/m3)
Water
(L/m3)
S.P
(L/m3)
Lime
content
(kg/m3)
Cylinder
compressive
Strength
MPa (28 days)
011 797 767 085 5 071 05
Journal of Engineering and Sustainable Development Vol. 21, No. 6, November 2017 www.jeasd.org (ISSN 2520-0917)
44
A micro- crack meter device with an accuracy of 0.02 mm was used to measure first
crack width development at all loading stages for all beams. Strain gauges were
prepared and fixed on each tested beam to measure strains in steel bars and concrete.
The strain gauges used in the experimental program were wire-type PFL-30-11-3L from
TML with a resistance of (+ ), a factor of (2.13 ± 1%), a length of 30 mm
and a width of 2.3 mm in addition to a maximum strain of 2%.
3. Experimental Results
All beams were tested under incremental monotonic-static load up to failure. The
results were analyzed and compared in different stages of loading. The load-deflection
curves were plotted. The first cracking and failure loads were recorded. The crack
propagation, crack patterns (number of cracks and type of cracks), steel reinforcement
strains, concrete surface average strains were observed after each load increment.
3.1. General Behavior of Beams
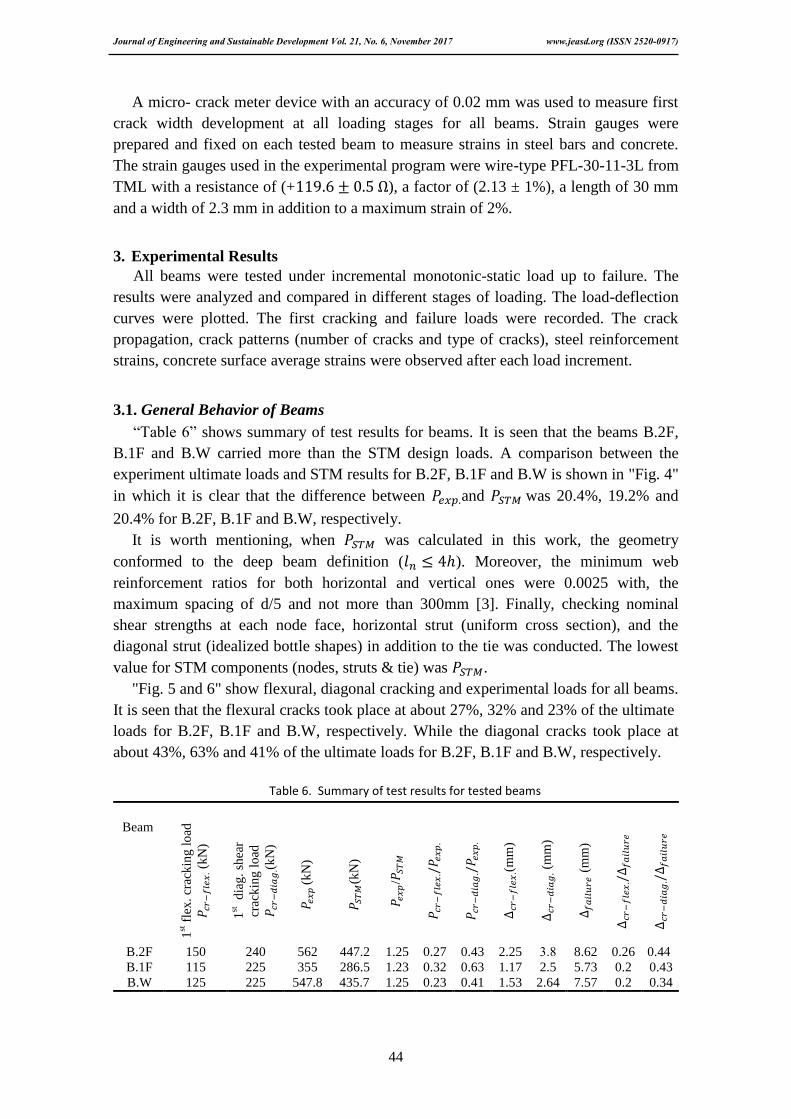
“Table 6” shows summary of test results for beams. It is seen that the beams B.2F,
B.1F and B.W carried more than the STM design loads. A comparison between the
experiment ultimate loads and STM results for B.2F, B.1F and B.W is shown in "Fig. 4"
in which it is clear that the difference between and was 20.4%, 19.2% and
20.4% for B.2F, B.1F and B.W, respectively.
It is worth mentioning, when was calculated in this work, the geometry
conformed to the deep beam definition ( ). Moreover, the minimum web
reinforcement ratios for both horizontal and vertical ones were 0.0025 with, the
maximum spacing of d/5 and not more than 300mm [3]. Finally, checking nominal
shear strengths at each node face, horizontal strut (uniform cross section), and the
diagonal strut (idealized bottle shapes) in addition to the tie was conducted. The lowest
value for STM components (nodes, struts & tie) was .
"Fig. 5 and 6" show flexural, diagonal cracking and experimental loads for all beams.
It is seen that the flexural cracks took place at about 27%, 32% and 23% of the ultimate
loads for B.2F, B.1F and B.W, respectively. While the diagonal cracks took place at
about 43%, 63% and 41% of the ultimate loads for B.2F, B.1F and B.W, respectively.
Table 6. Summary of test results for tested beams
(
mm
)
(
mm
)
(
mm
)
/
(kN
)
(
kN
) 1st
dia
g.
shea
r
crac
kin
g l
oad
(
kN
)
1st f
lex
. cr
ack
ing
lo
ad
(
kN
)
Beam
0.40 0.26 8.62 0.8 2.25 0.43 0.27 1.25 447.2 562 240 150 B.2F
0.43 0.2 5.73 2.5 1.17 0.63 0.32 1.23 286.5 355 225 115 B.1F
0.34 0.2 7.57 2.64 1.53 0.41 0.23 1.25 435.7 547.8 225 125 B.W
Journal of Engineering and Sustainable Development Vol. 21, No. 6, November 2017 www.jeasd.org (ISSN 2520-0917)
45
0
100
200
300
400
500
600
B.2F B.1F B.WLo
ad (
kN)
Pexp.
PSTM
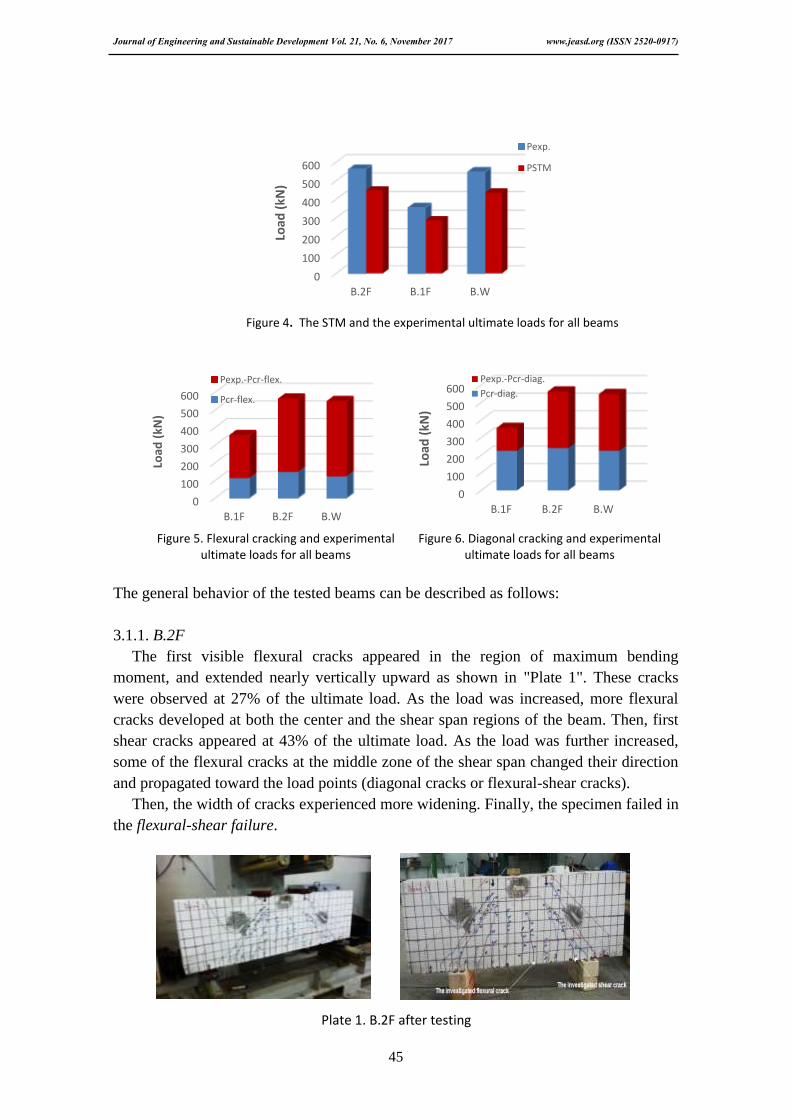
Figure 5. Flexural cracking and experimental
ultimate loads for all beams Figure 6. Diagonal cracking and experimental
ultimate loads for all beams
The general behavior of the tested beams can be described as follows:
3.1.1. B.2F
The first visible flexural cracks appeared in the region of maximum bending
moment, and extended nearly vertically upward as shown in "Plate 1". These cracks
were observed at 27% of the ultimate load. As the load was increased, more flexural
cracks developed at both the center and the shear span regions of the beam. Then, first
shear cracks appeared at 43% of the ultimate load. As the load was further increased,
some of the flexural cracks at the middle zone of the shear span changed their direction
and propagated toward the load points (diagonal cracks or flexural-shear cracks).
Then, the width of cracks experienced more widening. Finally, the specimen failed in
the flexural-shear failure.
0
100
200
300
400
500
600
B.1F B.2F B.W
Load
(kN
)
Pexp.-Pcr-flex.
Pcr-flex.
0
100
200
300
400
500
600
B.1F B.2F B.W
Load
(kN
)
Pexp.-Pcr-diag.
Pcr-diag.
Figure 4. The STM and the experimental ultimate loads for all beams
Plate 1. B.2F after testing
Journal of Engineering and Sustainable Development Vol. 21, No. 6, November 2017 www.jeasd.org (ISSN 2520-0917)
46
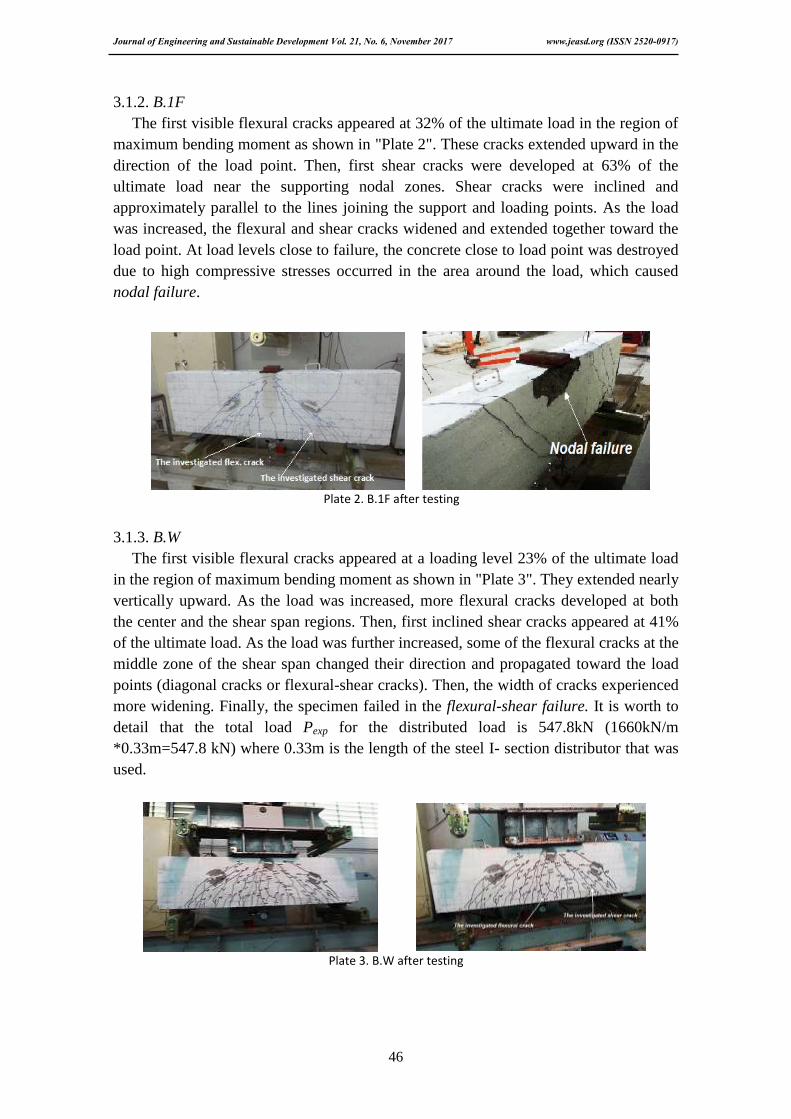
3.1.2. B.1F
The first visible flexural cracks appeared at 32% of the ultimate load in the region of
maximum bending moment as shown in "Plate 2". These cracks extended upward in the
direction of the load point. Then, first shear cracks were developed at 63% of the
ultimate load near the supporting nodal zones. Shear cracks were inclined and
approximately parallel to the lines joining the support and loading points. As the load
was increased, the flexural and shear cracks widened and extended together toward the
load point. At load levels close to failure, the concrete close to load point was destroyed
due to high compressive stresses occurred in the area around the load, which caused
nodal failure.
Plate 2. B.1F after testing
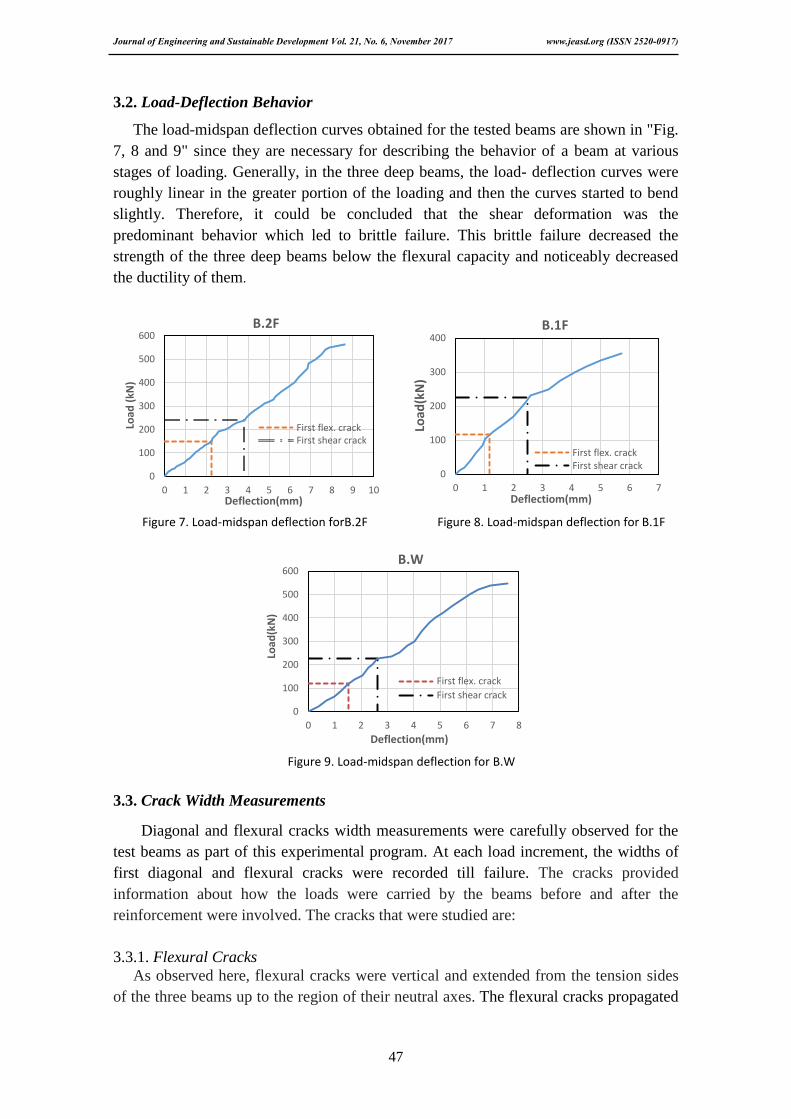
3.1.3. B.W
The first visible flexural cracks appeared at a loading level 23% of the ultimate load
in the region of maximum bending moment as shown in "Plate 3". They extended nearly
vertically upward. As the load was increased, more flexural cracks developed at both
the center and the shear span regions. Then, first inclined shear cracks appeared at 41%
of the ultimate load. As the load was further increased, some of the flexural cracks at the
middle zone of the shear span changed their direction and propagated toward the load
points (diagonal cracks or flexural-shear cracks). Then, the width of cracks experienced
more widening. Finally, the specimen failed in the flexural-shear failure. It is worth to
detail that the total load Pexp for the distributed load is 547.8kN (1660kN/m
*0.33m=547.8 kN) where 0.33m is the length of the steel I- section distributor that was
used.
Plate 3. B.W after testing
Journal of Engineering and Sustainable Development Vol. 21, No. 6, November 2017 www.jeasd.org (ISSN 2520-0917)
47
0
100
200
300
400
500
600
0 1 2 3 4 5 6 7 8
Load
(kN
)
Deflection(mm)
B.W
First flex. crack
First shear crack
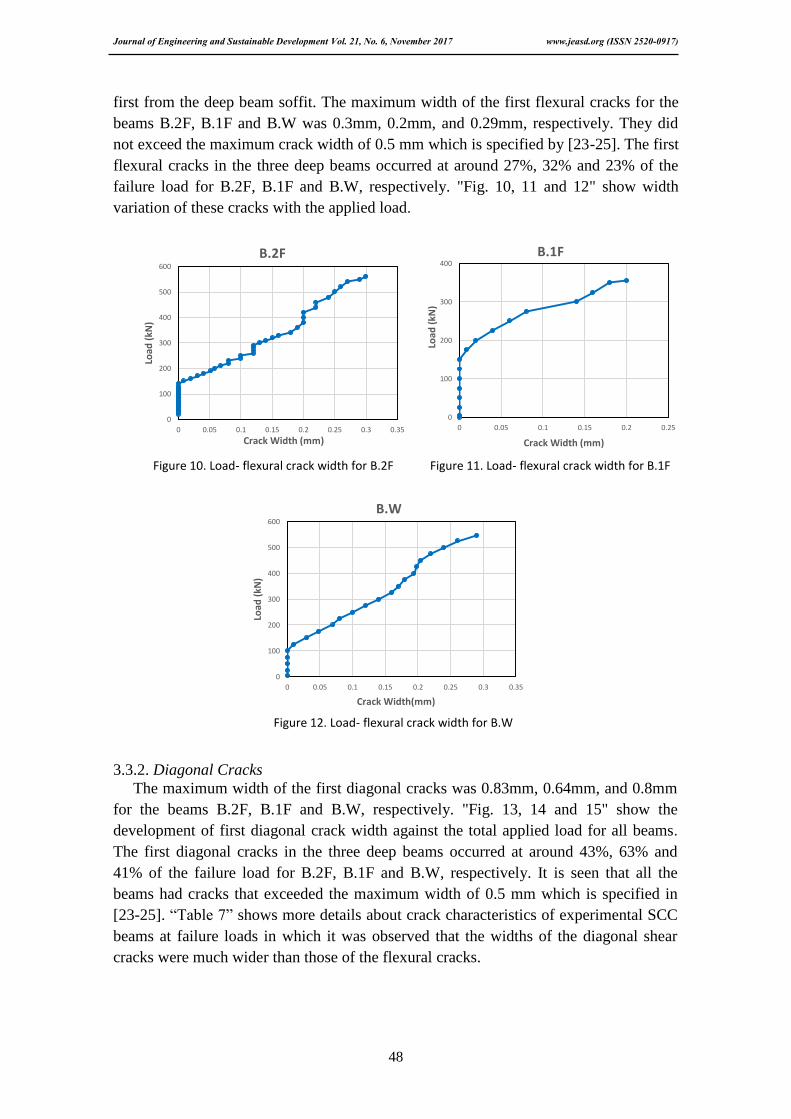
3.2. Load-Deflection Behavior
The load-midspan deflection curves obtained for the tested beams are shown in "Fig.
7, 8 and 9" since they are necessary for describing the behavior of a beam at various
stages of loading. Generally, in the three deep beams, the load- deflection curves were
roughly linear in the greater portion of the loading and then the curves started to bend
slightly. Therefore, it could be concluded that the shear deformation was the
predominant behavior which led to brittle failure. This brittle failure decreased the
strength of the three deep beams below the flexural capacity and noticeably decreased
the ductility of them.
Figure 7. Load-midspan deflection forB.2F Figure 8. Load-midspan deflection for B.1F
3.3. Crack Width Measurements
Diagonal and flexural cracks width measurements were carefully observed for the
test beams as part of this experimental program. At each load increment, the widths of
first diagonal and flexural cracks were recorded till failure. The cracks provided
information about how the loads were carried by the beams before and after the
reinforcement were involved. The cracks that were studied are:
3.3.1. Flexural Cracks As observed here, flexural cracks were vertical and extended from the tension sides
of the three beams up to the region of their neutral axes. The flexural cracks propagated
0
100
200
300
400
500
600
0 1 2 3 4 5 6 7 8 9 10
Load
(kN
)
Deflection(mm)
B.2F
First flex. crackFirst shear crack
0
100
200
300
400
0 1 2 3 4 5 6 7
Load
(kN
)
Deflectiom(mm)
B.1F
First flex. crackFirst shear crack
Figure 9. Load-midspan deflection for B.W
Journal of Engineering and Sustainable Development Vol. 21, No. 6, November 2017 www.jeasd.org (ISSN 2520-0917)
48
first from the deep beam soffit. The maximum width of the first flexural cracks for the
beams B.2F, B.1F and B.W was 0.3mm, 0.2mm, and 0.29mm, respectively. They did
not exceed the maximum crack width of 0.5 mm which is specified by [23-25]. The first
flexural cracks in the three deep beams occurred at around 27%, 32% and 23% of the
failure load for B.2F, B.1F and B.W, respectively. "Fig. 10, 11 and 12" show width
variation of these cracks with the applied load.
Figure 10. Load- flexural crack width for B.2F Figure 11. Load- flexural crack width for B.1F
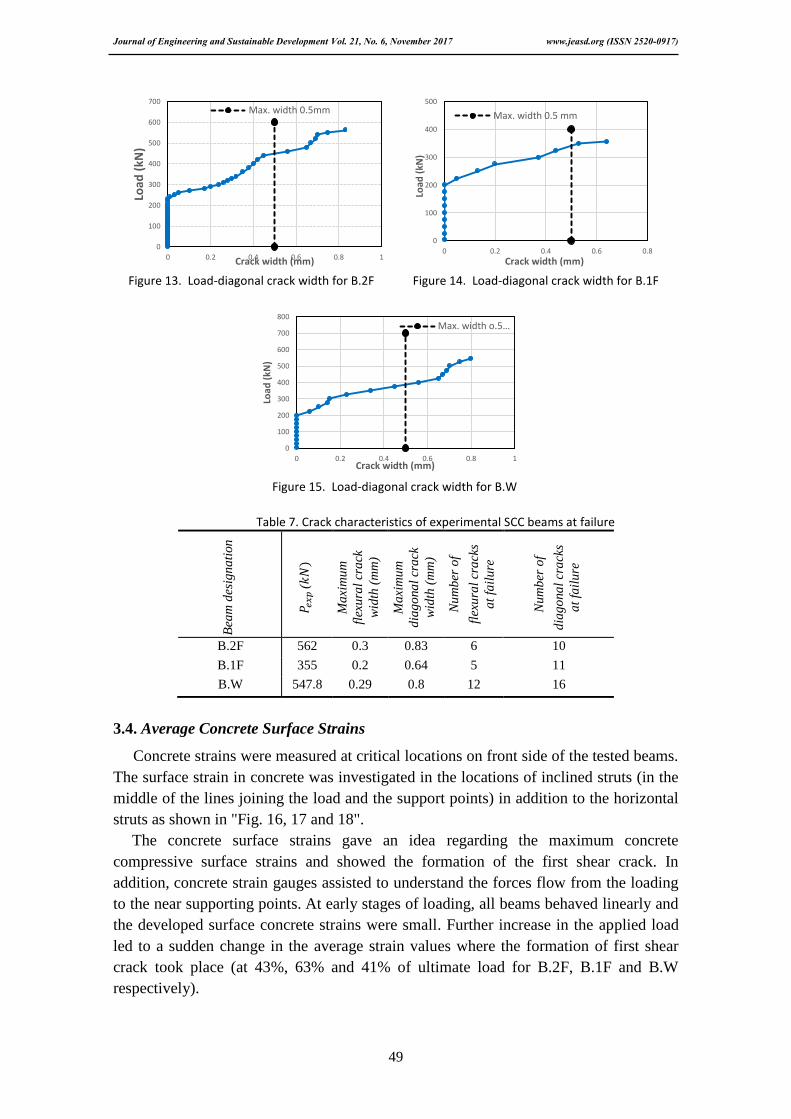
3.3.2. Diagonal Cracks
The maximum width of the first diagonal cracks was 0.83mm, 0.64mm, and 0.8mm
for the beams B.2F, B.1F and B.W, respectively. "Fig. 13, 14 and 15" show the
development of first diagonal crack width against the total applied load for all beams.
The first diagonal cracks in the three deep beams occurred at around 43%, 63% and
41% of the failure load for B.2F, B.1F and B.W, respectively. It is seen that all the
beams had cracks that exceeded the maximum width of 0.5 mm which is specified in
[23-25]. “Table 7” shows more details about crack characteristics of experimental SCC
beams at failure loads in which it was observed that the widths of the diagonal shear
cracks were much wider than those of the flexural cracks.
0
100
200
300
400
500
600
0 0.05 0.1 0.15 0.2 0.25 0.3 0.35
Load
(kN
)
Crack Width (mm)
B.2F
0
100
200
300
400
0 0.05 0.1 0.15 0.2 0.25Lo
ad (
kN)
Crack Width (mm)
B.1F
0
100
200
300
400
500
600
0 0.05 0.1 0.15 0.2 0.25 0.3 0.35
Load
(kN
)
Crack Width(mm)
B.W
Figure 12. Load- flexural crack width for B.W
Journal of Engineering and Sustainable Development Vol. 21, No. 6, November 2017 www.jeasd.org (ISSN 2520-0917)
49
Figure 13. Load-diagonal crack width for B.2F Figure 14. Load-diagonal crack width for B.1F
Bea
m d
esig
na
tion
(
Ma
xim
um
flex
ura
l cr
ack
wid
th (
mm
)
Ma
xim
um
dia
go
na
l cr
ack
wid
th (
mm
)
Nu
mb
er o
f flex
ura
l cr
ack
s
at
fail
ure
Nu
mb
er o
f
dia
go
na
l cr
ack
s
at
fail
ure
B.2F 562 0.3 0.83 6 10
B.1F 355 0.2 0.64 5 11
B.W 547.8 0.29 0.8 12 16
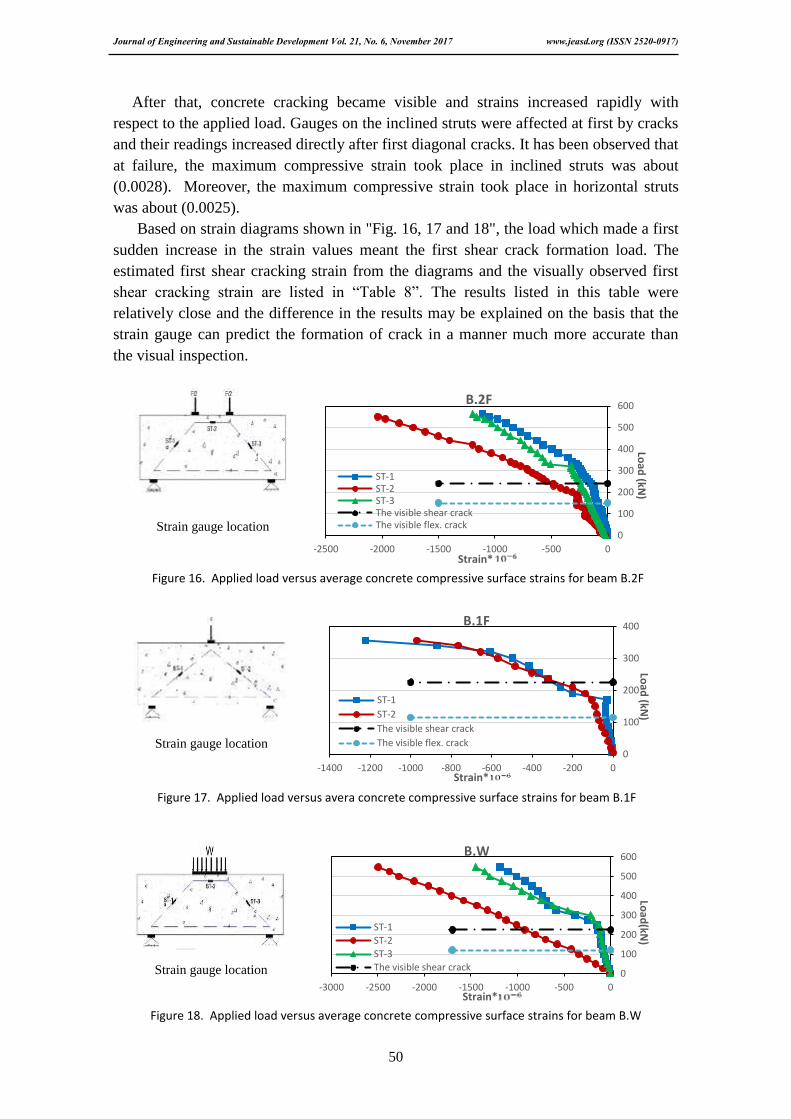
3.4. Average Concrete Surface Strains
Concrete strains were measured at critical locations on front side of the tested beams.
The surface strain in concrete was investigated in the locations of inclined struts (in the
middle of the lines joining the load and the support points) in addition to the horizontal
struts as shown in "Fig. 16, 17 and 18".
The concrete surface strains gave an idea regarding the maximum concrete
compressive surface strains and showed the formation of the first shear crack. In
addition, concrete strain gauges assisted to understand the forces flow from the loading
to the near supporting points. At early stages of loading, all beams behaved linearly and
the developed surface concrete strains were small. Further increase in the applied load
led to a sudden change in the average strain values where the formation of first shear
crack took place (at 43%, 63% and 41% of ultimate load for B.2F, B.1F and B.W
respectively).
0
100
200
300
400
500
600
700
0 0.2 0.4 0.6 0.8 1
Load
(kN
)
Crack width (mm)
Max. width 0.5mm
0
100
200
300
400
500
0 0.2 0.4 0.6 0.8
Load
(kN
)
Crack width (mm)
Max. width 0.5 mm
Table 7. Crack characteristics of experimental SCC beams at failure
0
100
200
300
400
500
600
700
800
0 0.2 0.4 0.6 0.8 1
Load
(kN
)
Crack width (mm)
Max. width o.5…
Figure 15. Load-diagonal crack width for B.W
Journal of Engineering and Sustainable Development Vol. 21, No. 6, November 2017 www.jeasd.org (ISSN 2520-0917)
50
After that, concrete cracking became visible and strains increased rapidly with
respect to the applied load. Gauges on the inclined struts were affected at first by cracks
and their readings increased directly after first diagonal cracks. It has been observed that
at failure, the maximum compressive strain took place in inclined struts was about
(0.0028). Moreover, the maximum compressive strain took place in horizontal struts
was about (0.0025).
Based on strain diagrams shown in "Fig. 16, 17 and 18", the load which made a first
sudden increase in the strain values meant the first shear crack formation load. The
estimated first shear cracking strain from the diagrams and the visually observed first
shear cracking strain are listed in “Table 8”. The results listed in this table were
relatively close and the difference in the results may be explained on the basis that the
strain gauge can predict the formation of crack in a manner much more accurate than
the visual inspection.
Strain gauge location
Figure 16. Applied load versus average concrete compressive surface strains for beam B.2F
Strain gauge location
Figure 17. Applied load versus avera concrete compressive surface strains for beam B.1F
0
100
200
300
400
500
600
-2500 -2000 -1500 -1000 -500 0
Load
(kN)
Strain*
B.2F
ST-1ST-2ST-3The visible shear crackThe visible flex. crack
0
100
200
300
400
-1400 -1200 -1000 -800 -600 -400 -200 0
Load
(kN)
Strain*
B.1F
ST-1
ST-2
The visible shear crack
The visible flex. crack
Strain gauge location
Figure 18. Applied load versus average concrete compressive surface strains for beam B.W
0
100
200
300
400
500
600
-3000 -2500 -2000 -1500 -1000 -500 0
Load
(kN)
Strain*
B.W
ST-1
ST-2
ST-3The visible shear crack
Journal of Engineering and Sustainable Development Vol. 21, No. 6, November 2017 www.jeasd.org (ISSN 2520-0917)
51
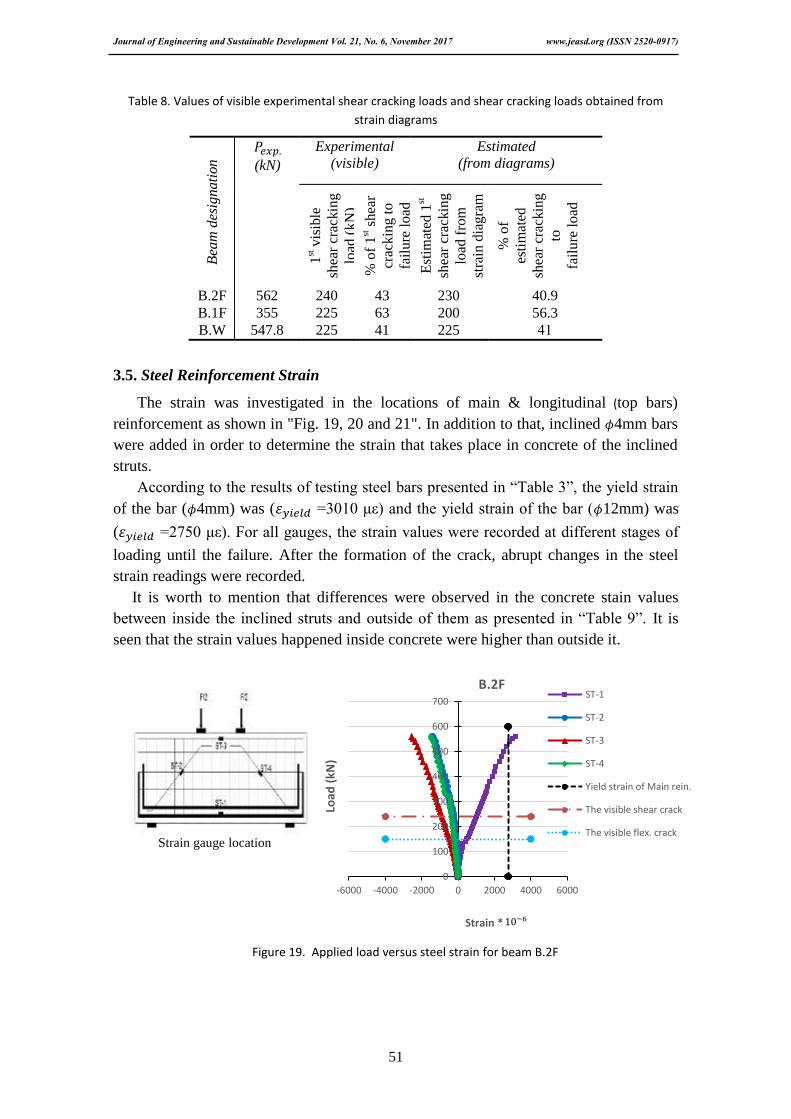
Table 8. Values of visible experimental shear cracking loads and shear cracking loads obtained from
strain diagrams
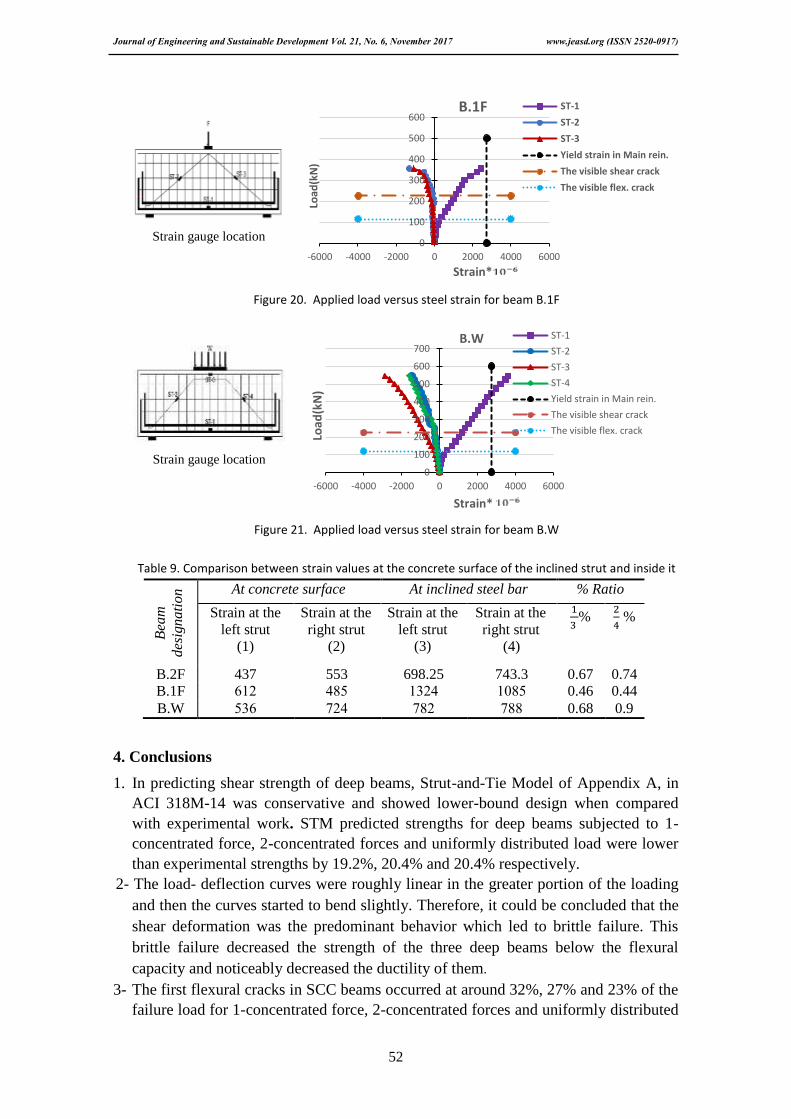
3.5. Steel Reinforcement Strain
The strain was investigated in the locations of main & longitudinal (top bars)
reinforcement as shown in "Fig. 19, 20 and 21". In addition to that, inclined 4mm bars
were added in order to determine the strain that takes place in concrete of the inclined
struts.
According to the results of testing steel bars presented in “Table 3”, the yield strain
of the bar ( 4mm) was ( =3010 με) and the yield strain of the bar ( 12mm) was
( =2750 με). For all gauges, the strain values were recorded at different stages of
loading until the failure. After the formation of the crack, abrupt changes in the steel
strain readings were recorded.
It is worth to mention that differences were observed in the concrete stain values
between inside the inclined struts and outside of them as presented in “Table 9”. It is
seen that the strain values happened inside concrete were higher than outside it.
Strain gauge location
Figure 19. Applied load versus steel strain for beam B.2F
0
100
200
300
400
500
600
700
-6000 -4000 -2000 0 2000 4000 6000
Load
(kN
)
Strain *
B.2F ST-1
ST-2
ST-3
ST-4
Yield strain of Main rein.
The visible shear crack
The visible flex. crack
6
Bea
m d
esig
nati
on
(kN)
Experimental
(visible)
Estimated
(from diagrams)
1st v
isib
le
shea
r cr
ackin
g
load
(k
N)
% o
f 1
st s
hea
r
crac
kin
g t
o fa
ilu
re l
oad
Est
imat
ed 1
st sh
ear
crac
kin
g
load
fro
m
stra
in d
iag
ram
(kN
) %
of
esti
mat
ed
shea
r cr
ackin
g
to
fail
ure
lo
ad
B.2F 562 240 43 230 40.9
B.1F 355 225 63 200 56.3
B.W 547.8 225 41 225 00
Journal of Engineering and Sustainable Development Vol. 21, No. 6, November 2017 www.jeasd.org (ISSN 2520-0917)
52
Strain gauge location
Figure 20. Applied load versus steel strain for beam B.1F
Strain gauge location
Figure 21. Applied load versus steel strain for beam B.W
Table 9. Comparison between strain values at the concrete surface of the inclined strut and inside it
Bea
m
des
ignati
on At concrete surface At inclined steel bar % Ratio
Strain at the
left strut
(1)
Strain at the
right strut
(2)
Strain at the
left strut (3)
Strain at the
right strut
(4)
%
%
B.2F 437 553 698.25 743.3 0.67 0.74
B.1F 606 085 0060 0185 0.46 0.44
B.W 506 760 786 788 0.68 0.9
4. Conclusions
1. In predicting shear strength of deep beams, Strut-and-Tie Model of Appendix A, in
ACI 318M-14 was conservative and showed lower-bound design when compared
with experimental work. STM predicted strengths for deep beams subjected to 1-
concentrated force, 2-concentrated forces and uniformly distributed load were lower
than experimental strengths by 19.2%, 20.4% and 20.4% respectively.
2- The load- deflection curves were roughly linear in the greater portion of the loading
and then the curves started to bend slightly. Therefore, it could be concluded that the
shear deformation was the predominant behavior which led to brittle failure. This
brittle failure decreased the strength of the three deep beams below the flexural
capacity and noticeably decreased the ductility of them.
3- The first flexural cracks in SCC beams occurred at around 32%, 27% and 23% of the
failure load for 1-concentrated force, 2-concentrated forces and uniformly distributed
0
100
200
300
400
500
600
-6000 -4000 -2000 0 2000 4000 6000
Load
(kN
)
Strain*
B.1F ST-1
ST-2
ST-3
Yield strain in Main rein.
The visible shear crack
The visible flex. crack
0
100
200
300
400
500
600
700
-6000 -4000 -2000 0 2000 4000 6000
Load
(kN
)
Strain*
B.W ST-1
ST-2
ST-3
ST-4
Yield strain in Main rein.
The visible shear crack
The visible flex. crack
Journal of Engineering and Sustainable Development Vol. 21, No. 6, November 2017 www.jeasd.org (ISSN 2520-0917)
53
load, respectively. While the first diagonal cracks in SCC beams occurred at around
63%, 43% and 41% of the failure load for 1-concentrated force, 2-concentrated
forces and uniformly distributed load, respectively. It is worth to mention that the
experimental results showed that the first flexural cracks in deep beams were not
critical and they did not exceed the maximum width limits in all beams. While the
first diagonal cracks were more critical and they exceeded the maximum width
limits.
4- First visible shear cracking load and estimated first shear cracking load from strain
diagram were relatively close and the difference in the results may be explained on
the basis that the strain gauge can predict the formation of crack in a manner much
more accurate than the visual inspection.
5- Compressive strain behavior for deep beams subjected to 1-concentrated force, 2-
concentrated forces and uniformly distributed load were almost similar. It has been
observed that at failure, the maximum compressive strain at an inclined strut was
(0.00255), while (0.00289) was the maximum strain that was recorded at a horizontal
strut.
6- The average strains in tension reinforcement of the tested beams in cases of 2-
concentrated forces and uniformly distributed load exceeded the yield strain. While
in case of 1-concentrated force, the average strains in tension reinforcement was less
than the yield strain. Therefore, it is clear that these strain values depended on the
type of failure. In addition, it has seen that from the observed differences in the
concrete stain values between inside the inclined struts and outside of them, that the
strain values occurred inside concrete were higher than outside it.
Abbreviations
Notations
a Shear span measured from center of load to center of support, mm
Experimental load, kN
Theoretical load according to STM method, kN
Uniformly distributed load, kN/m
First flexural cracking load, kN
First diagonal cracking load, kN
Displacement corresponding to the 1st flexural crack load, mm
Displacement corresponding to the 1st diagonal crack load, mm
Displacement corresponding to the ultimate of deep beam, mm
Width of beam, mm
d Effective depth of beam, distance from extreme compression fiber to
centroid of longitudinal tension reinforcement, mm
150mm*300mm Cylinder compressive strength of concrete, MPa
Modulus of rapture, MPa
Indirect tensile strength (splitting tensile strength), MPa
h Total depth of deep beam, mm
Moment arm, mm
Clear span measured face to face of supports, mm
Beam span center to center of supports, mm
L Overall length of deep beam, mm
Journal of Engineering and Sustainable Development Vol. 21, No. 6, November 2017 www.jeasd.org (ISSN 2520-0917)
54
Length of load bearing block, mm
Length of support bearing block, mm
Strain
Modulus of elasticity of concrete, MPa
Modulus of elasticity of steel reinforcement, MPa
Diameter of bar, mm
ρ Flexural reinforcement ratio
5. References
1. Selvam, V. K. M. (1976). “Shear strength of reinforced concrete deep beams”.
Building and environment, Vol. 11, No, 3, pp. 211-214.
2. Soliman, S. M. (2003). "Behavior and Analysis of Reinforced Concrete Deep
Beams". Doctoral dissertation, PhD Thesis, Menoufiya University, Egypt.
3. ACI Committee, American Concrete Institute. (2014). “Building Code Requirements
for Structural Concrete (ACI 318-14) and Commentary”. American Concrete
Institute.
4. Merritt, F. S., and Ricketts, J. T. (2001). "Building Design and Construction
Handbook". Vol. 13, New York, NY: McGraw-Hill.
5. Schlaich, J., Schäfer, K., and Jennewein, M. (1987). “Toward a consistent design of
structural concrete”. PCI Journal, Vol. 32, No. 3, pp. 74-150.
6. Muttoni, A., Schwartz, J., and Thurlimann, B. (1997). "Design of Concrete
Structures with Stress Fields". Springer Science and Business Media.
7. Ley, M. T., Riding, K. A., Bae, S., and Breen, J. E. (2007). “Experimental
verification of strut-and-tie model design method”. ACI Structural Journal, Vol. 104,
No. 6, pp. 749.
8. Brown, M. D., and Bayrak, O. (2007). “Investigation of deep beams with various
load configurations”. ACI Structural Journal, Vol. 104, No. 5, pp. 611.
9. Ashour, A. F., and Yang, K. H. (2008). "Application of Plasticity Theory to
Reinforced Concrete Deep Beams". A Review. Magazine of Concrete Research, Vol.
60, No. 9, pp. 657-664.
10. Wu, T., and Li, B. (2009). “Experimental verification of continuous deep beams
with openings designed using strut-and-tie modeling”. The IES Journal Part A:
Civil & Structural Engineering, Vol. 2, No. 4, pp. 282-295.
11. Hassan, S. A. (2012). "Behavior of Reinforced Concrete Deep Beams Using Self
Compacting Concrete". Doctoral dissertation, PhD Thesis, University of Baghdad,
Civil Department, Baghdad, Iraq.
12. Abdul-Razzaq, K. S. (2013). “Effect of heating on simply supported reinforced
concrete deep beams”. Diyala Journal of Engineering Sciences, Vol. 08, No. 02, pp.
661-611.
13. Al-Khafaji, A. P. D. J., Al-Shaarbaf, A. P. D. I., and Sultan, A. L. W. H. (2014).
“Shear behavior of fibrous self compacting concrete deep beams”. Journal of
Engineering and Development, Vol. 18, No. 6.
Journal of Engineering and Sustainable Development Vol. 21, No. 6, November 2017 www.jeasd.org (ISSN 2520-0917)
55
14. Garber, D. B., Gallardo, J. M., Huaco, G. D., Samaras, V. A., and Breen, J. E.
(2014). “Experimental evaluation of strut-and-tie model of indeterminate deep
beam”. ACI Structural Journal, Vol. 111, No. 4, pp. 873.
15. Kassem, W. (2015). “Strength prediction of corbels using strut-and-tie model
analysis”. International Journal of Concrete Structures and Materials, Vol. 9, No. 2,
pp. 255-266.
16. Abdul-Razzaq, K. S., Abed, A. H., & Ali, H. I. (2016). “Parameters affecting load
capacity of reinforced self-compacted concrete deep beams”. International Journal
of Engineering, Vol. 5, No. 05.
17. El-Sayed, A. K., and Shuraim, A. B. (2016). “Size effect on shear resistance of high
strength concrete deep beams”. Materials and Structures, Vol. 49, No. 5, pp. 1871-
1882.
18. Jebur, S. F. (2017). "Behavior of self- Compacted Concrete Deep Beams with
Reinforced Compressive Struts". M.Sc. Thesis, University of Diyala, Civil
Engineering Department, Diyala, Iraq.
19. EFNARC, S. (2002). "Guidelines for Self-Compacting Concrete". London, UK:
Association House, pp. 32-34.
20. ASTM, C. 494 (1999). "Standard Specification for Chemical Admixtures for
Concrete", pp. 4.
21. ASTM A615/A615M-14 (2014). "Standard Specification for Deformed and Plain
Carbon-Steel Bars for Concrete Reinforcement". ASTM Committee A01 on Steel,
Stainless Steel, and Related Alloys, West Conshohocken, PA 19428-2959, United
States, pp. 5.
22. ASTM A496-02 (2002). "Standard Specification for Steel Wire, Deformed, for
Concrete Reinforcement". ASTM Committee A-1 on Steel, Stainless Steel, and
Related Alloys, West Conshohocken, PA 19428-2959, United States, pp. 5.
23. Machida, A. (1997). "Recommendation for Design and Construction of Concrete
Structures using Continuous Fiber Reinforcing Materials". Tokyo: Research
Committee on Continuous Fiber Reinforcing Materials, Japan Society of Civil
Engineers.
24. Canadian Standards Association. (2012). "Design and Construction of Building
Components with Fibre-Reinforced Polymers". Toronto: Canadian Standards
Association.
25. Canadian Standards Association. (2014). "Canadian Highway Bridge Design Code"
CSA Group and Canadian Standards Association.