Embed Size (px)
Citation preview
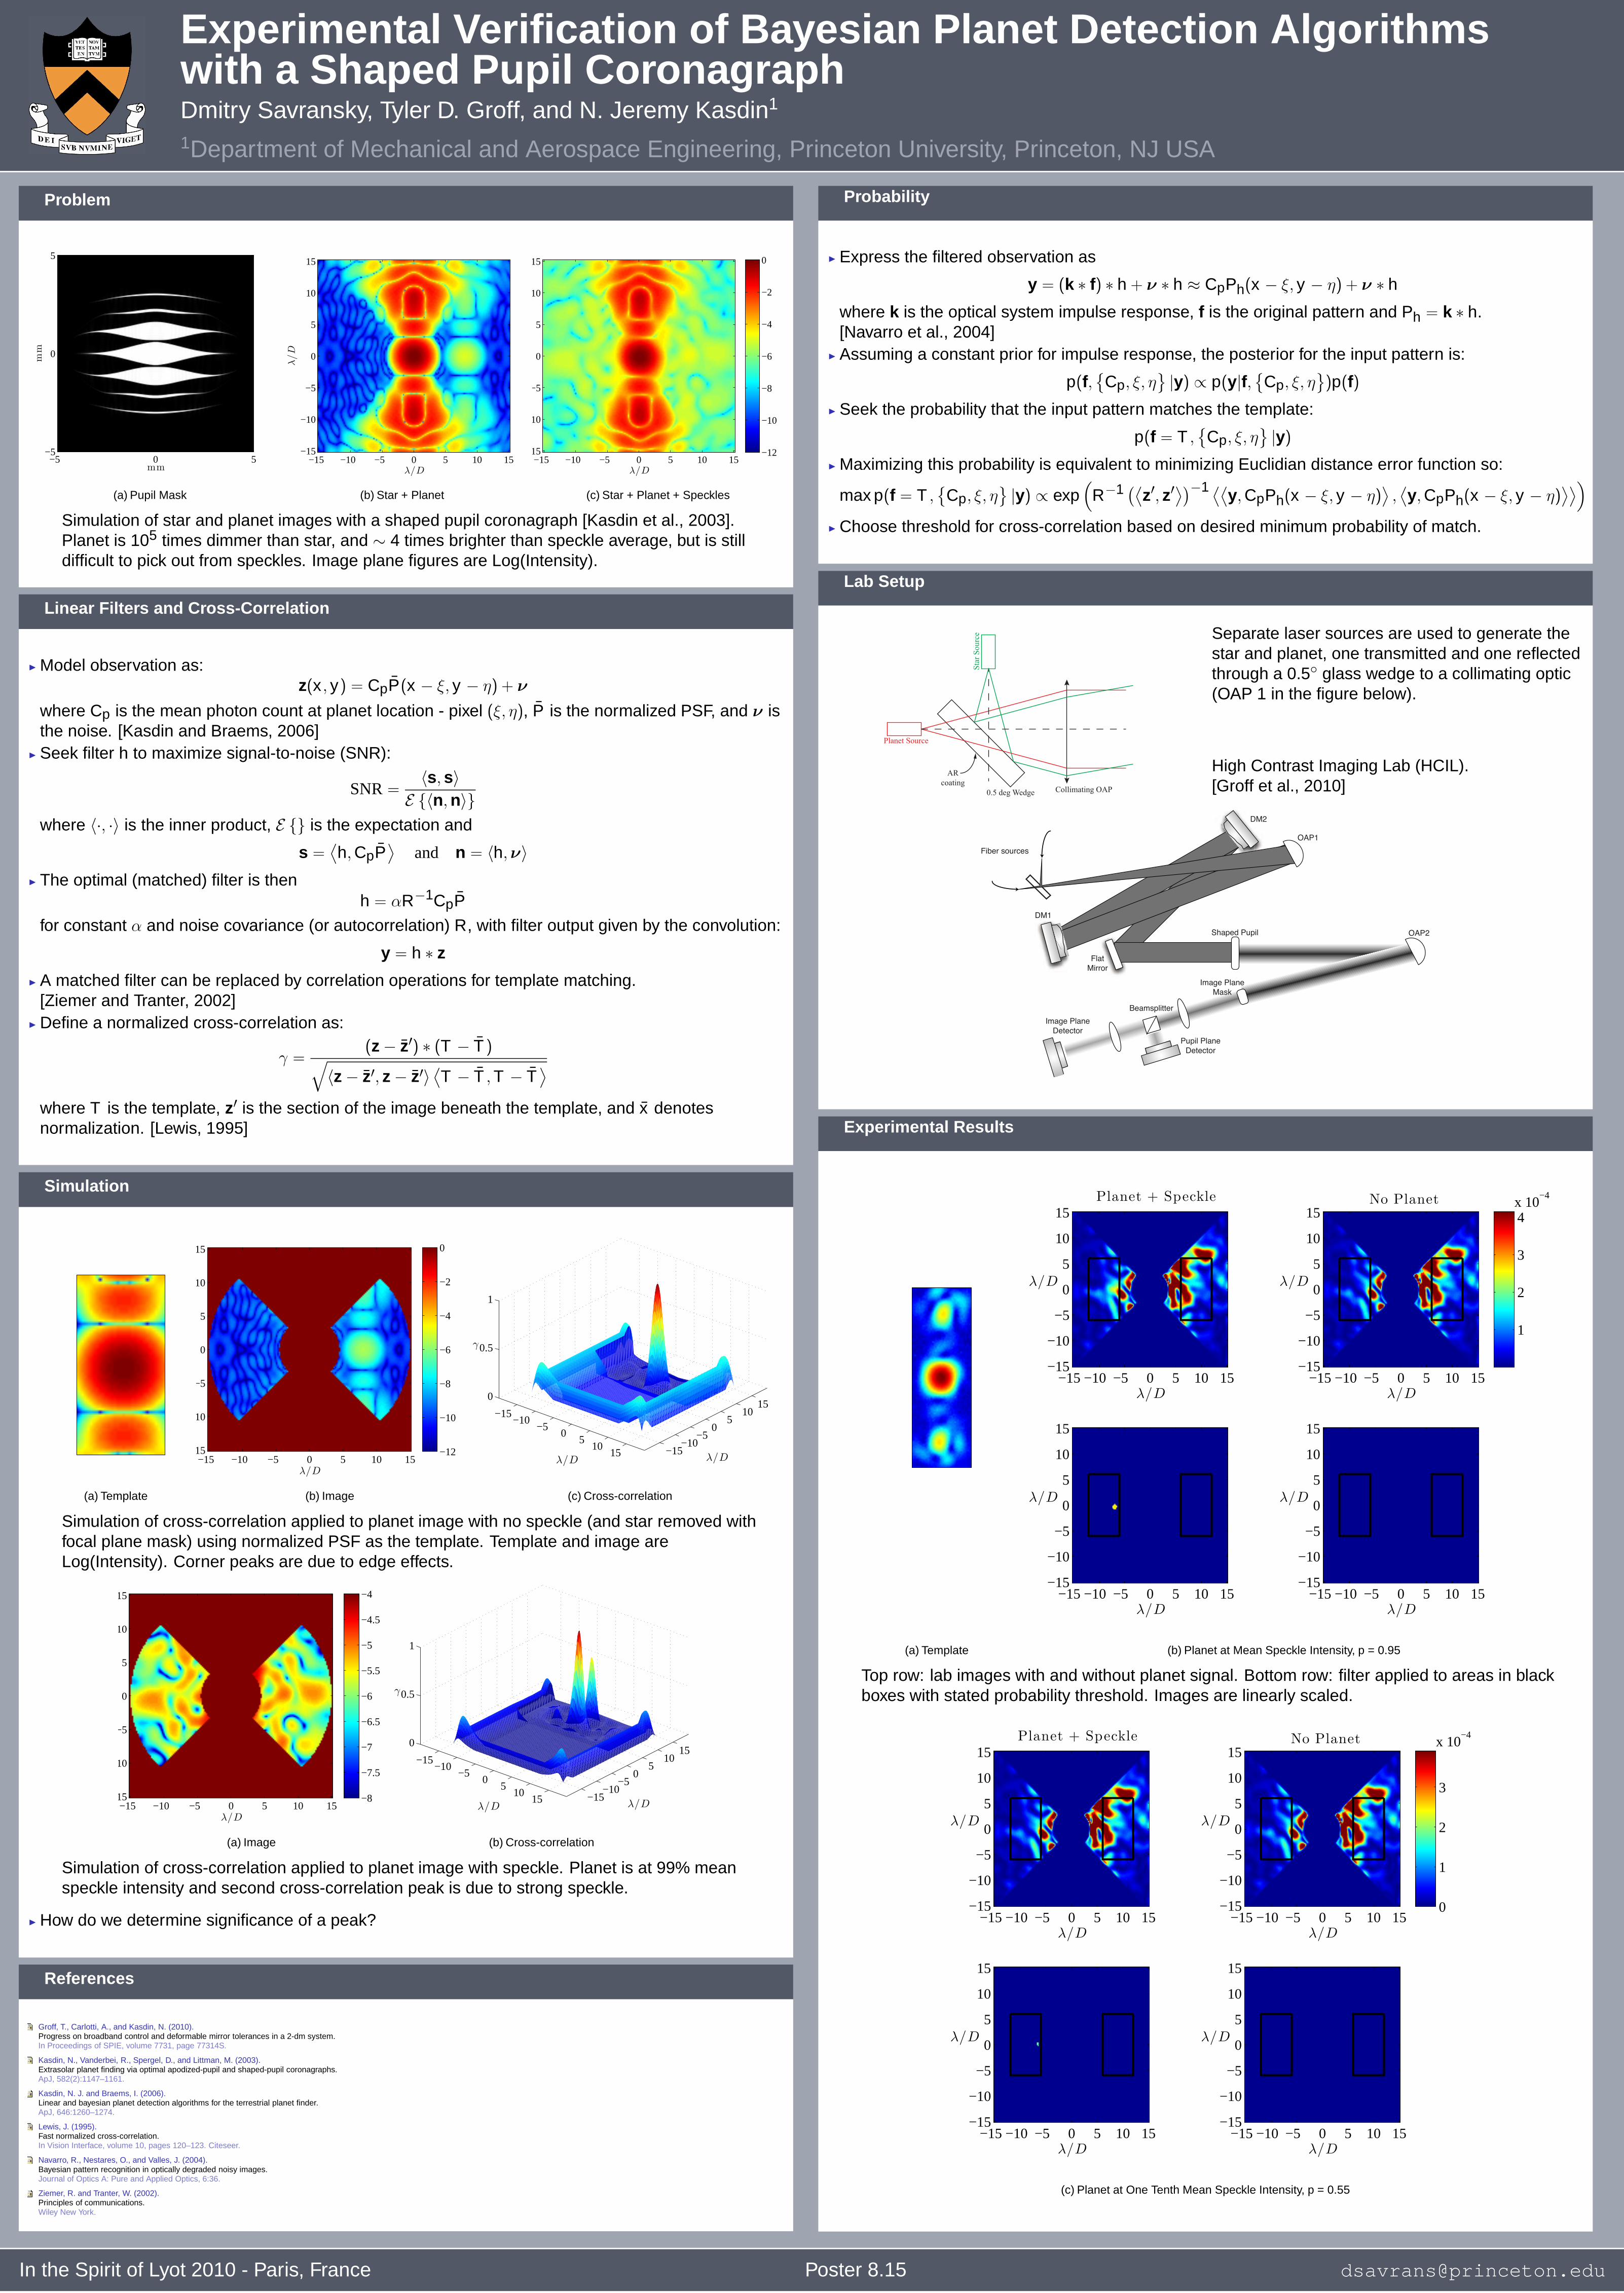
Experimental Verification of Bayesian Planet Detection Alg orithmswith a Shaped Pupil CoronagraphDmitry Savransky, Tyler D. Groff, and N. Jeremy Kasdin1
1Department of Mechanical and Aerospace Engineering, Princeton University, Princeton, NJ USA
Problem
mm
mm
−5 0 5
5
0
−5
(a) Pupil Mask
λ/D
λ/D
−15 −10 −5 0 5 10 15
15
10
5
0
−5
−10
−15
(b) Star + Planet
λ/D
−15 −10 −5 0 5 10 15
15
10
5
0
−5
−10
−15 −12
−10
−8
−6
−4
−2
0
(c) Star + Planet + Speckles
Simulation of star and planet images with a shaped pupil coronagraph [Kasdin et al., 2003].Planet is 105 times dimmer than star, and ∼ 4 times brighter than speckle average, but is stilldifficult to pick out from speckles. Image plane figures are Log(Intensity).
Linear Filters and Cross-Correlation
◮ Model observation as:z(x , y) = CpP̄(x − ξ, y − η) + ν
where Cp is the mean photon count at planet location - pixel (ξ, η), P̄ is the normalized PSF, and ν isthe noise. [Kasdin and Braems, 2006]
◮ Seek filter h to maximize signal-to-noise (SNR):
SNR=〈s, s〉
E {〈n,n〉}where 〈·, ·〉 is the inner product, E {} is the expectation and
s =⟨
h,CpP̄⟩
and n = 〈h,ν〉
◮ The optimal (matched) filter is thenh = αR−1CpP̄
for constant α and noise covariance (or autocorrelation) R, with filter output given by the convolution:
y = h ∗ z
◮ A matched filter can be replaced by correlation operations for template matching.[Ziemer and Tranter, 2002]
◮ Define a normalized cross-correlation as:
γ =(z − z̄′) ∗ (T − T̄ )
√
〈z − z̄′, z − z̄′〉⟨
T − T̄ ,T − T̄⟩
where T is the template, z′ is the section of the image beneath the template, and x̄ denotesnormalization. [Lewis, 1995]
Simulation
(a) Template
λ/D
−15 −10 −5 0 5 10 15
15
10
5
0
−5
−10
−15 −12
−10
−8
−6
−4
−2
0
(b) Image
−15−10
−50
510
15
15 10
5 0
−5−10
−15
0
0.5
1
λ/Dλ/D
γ
(c) Cross-correlation
Simulation of cross-correlation applied to planet image with no speckle (and star removed withfocal plane mask) using normalized PSF as the template. Template and image areLog(Intensity). Corner peaks are due to edge effects.
λ/D
−15 −10 −5 0 5 10 15
15
10
5
0
−5
−10
−15 −8
−7.5
−7
−6.5
−6
−5.5
−5
−4.5
−4
(a) Image
−15−10
−50
510
15
15 10
5 0
−5−10
−15
0
0.5
1
λ/Dλ/D
γ
(b) Cross-correlation
Simulation of cross-correlation applied to planet image with speckle. Planet is at 99% meanspeckle intensity and second cross-correlation peak is due to strong speckle.
◮ How do we determine significance of a peak?
References
Groff, T., Carlotti, A., and Kasdin, N. (2010).Progress on broadband control and deformable mirror tolerances in a 2-dm system.In Proceedings of SPIE, volume 7731, page 77314S.
Kasdin, N., Vanderbei, R., Spergel, D., and Littman, M. (2003).Extrasolar planet finding via optimal apodized-pupil and shaped-pupil coronagraphs.ApJ, 582(2):1147–1161.
Kasdin, N. J. and Braems, I. (2006).Linear and bayesian planet detection algorithms for the terrestrial planet finder.ApJ, 646:1260–1274.
Lewis, J. (1995).Fast normalized cross-correlation.In Vision Interface, volume 10, pages 120–123. Citeseer.
Navarro, R., Nestares, O., and Valles, J. (2004).Bayesian pattern recognition in optically degraded noisy images.Journal of Optics A: Pure and Applied Optics, 6:36.
Ziemer, R. and Tranter, W. (2002).Principles of communications.Wiley New York.
Probability
◮ Express the filtered observation as
y = (k ∗ f) ∗ h + ν ∗ h ≈ CpPh(x − ξ, y − η) + ν ∗ h
where k is the optical system impulse response, f is the original pattern and Ph = k ∗ h.[Navarro et al., 2004]
◮ Assuming a constant prior for impulse response, the posterior for the input pattern is:
p(f,{
Cp, ξ, η}
|y) ∝ p(y|f,{
Cp, ξ, η}
)p(f)
◮ Seek the probability that the input pattern matches the template:
p(f = T ,{
Cp, ξ, η}
|y)
◮ Maximizing this probability is equivalent to minimizing Euclidian distance error function so:
max p(f = T ,{
Cp, ξ, η}
|y) ∝ exp(
R−1 (⟨z′, z′⟩)−1 ⟨⟨y,CpPh(x − ξ, y − η)
⟩
,⟨
y,CpPh(x − ξ, y − η)⟩⟩
)
◮ Choose threshold for cross-correlation based on desired minimum probability of match.
Lab Setup
Planet Source
Sta
r S
ourc
e
0.5 deg Wedge Collimating OAP
AR
coating
Separate laser sources are used to generate thestar and planet, one transmitted and one reflectedthrough a 0.5◦ glass wedge to a collimating optic(OAP 1 in the figure below).
High Contrast Imaging Lab (HCIL).[Groff et al., 2010]
Image Plane
Mask
Beamsplitter
Image Plane
Detector
DM1
OAP2
e
Shaped Pupil
OAP1
DM2
Flat
Mirror
Pupil Plane
Detector
Fiber sources
Experimental Results
(a) Template
Planet + Speckle
λ/D
λ/D
−15−10 −5 0 5 10 15
15
10
5
0
−5
−10
−15
λ/D
λ/D
−15−10 −5 0 5 10 15
15
10
5
0
−5
−10
−15
No Planet
λ/D
λ/D
−15−10 −5 0 5 10 15
15
10
5
0
−5
−10
−15
1
2
3
4x 10
−4
λ/D
λ/D
−15−10 −5 0 5 10 15
15
10
5
0
−5
−10
−15
(b) Planet at Mean Speckle Intensity, p = 0.95
Top row: lab images with and without planet signal. Bottom row: filter applied to areas in blackboxes with stated probability threshold. Images are linearly scaled.
Planet + Speckle
λ/D
λ/D
−15−10 −5 0 5 10 15
15
10
5
0
−5
−10
−15
λ/D
λ/D
−15−10 −5 0 5 10 15
15
10
5
0
−5
−10
−15
No Planet
λ/D
λ/D
−15−10 −5 0 5 10 15
15
10
5
0
−5
−10
−15 0
1
2
3
x 10−4
λ/D
λ/D
−15−10 −5 0 5 10 15
15
10
5
0
−5
−10
−15
(c) Planet at One Tenth Mean Speckle Intensity, p = 0.55
In the Spirit of Lyot 2010 - Paris, France Poster 8.15 [email protected]