Embed Size (px)
Citation preview

Experimental Validation and Application of a Phased ArrayUltrasonic Testing Model on Sound Field Optimization
Downloaded from: https://research.chalmers.se, 2021-12-04 03:22 UTC
Citation for the original published paper (version of record):Lei, X., Wirdelius, H., Rosell, A. (2021)Experimental Validation and Application of a Phased Array Ultrasonic Testing Model on SoundField OptimizationJournal of Modern Physics, 12(4): 391-407http://dx.doi.org/10.4236/jmp.2021.124028
N.B. When citing this work, cite the original published paper.
research.chalmers.se offers the possibility of retrieving research publications produced at Chalmers University of Technology.It covers all kind of research output: articles, dissertations, conference papers, reports etc. since 2004.research.chalmers.se is administrated and maintained by Chalmers Library
(article starts on next page)

Journal of Modern Physics, 2021, 12, 391-407 https://www.scirp.org/journal/jmp
ISSN Online: 2153-120X ISSN Print: 2153-1196
DOI: 10.4236/jmp.2021.124028 Mar. 3, 2021 391 Journal of Modern Physics
Experimental Validation and Application of a Phased Array Ultrasonic Testing Model on Sound Field Optimization
Xiangyu Lei1*, Håkan Wirdelius1, Anders Rosell2
1Department of Industrial and Materials Science, Chalmers University of Technology, Gothenburg, Sweden 2GKN Aerospace Sweden AB, Flygmotorvägen 1, Trollhättan, Sweden
Abstract In safety dominant industries, nondestructive evaluation (NDE) is crucial in quality assurance and assessment. Phased array ultrasonic testing (PAUT) as one of the NDE methods is more promising compared with conventional ul-trasonic testing (UT) method in terms of inspection speed and flexibility. To incorporate PAUT, the techniques should be qualified, which traditionally is performed by extensive physical experiments. However, with the develop-ment of numerical models simulating UT method, it is expected to comple-ment or partly replace the experiments with the intention to reduce costs and operational uncertainties. The models should be validated to ensure its con-sistency to reality. This validation work can be done by comparing the model with other validated models or corresponding experiments. The purpose of current work focuses on the experimental validation of a numerical model, simSUNDT, developed by the Chalmers University of Technology. Validation is conducted by comparing different data presentations (A-, B- and C-scan) from experimental and simulated results with some well-defined artificial de-fects. Satisfactory correlations can be observed from the comparisons. After the validation, sound field optimization work aiming at retrieving maximized echo amplitude on a certain defect can be started using the model. This also reveals the flexibility of parametric studies using simulation models.
Keywords Experiments, Simulation, Validation, Sound Field Optimization
1. Introduction
In safety prioritized industries such as aerospace industry, newly adopted and
How to cite this paper: Lei, X., Wirdelius, H. and Rosell, A. (2021) Experimental Vali-dation and Application of a Phased Array Ultrasonic Testing Model on Sound Field Optimization. Journal of Modern Physics, 12, 391-407. https://doi.org/10.4236/jmp.2021.124028 Received: February 1, 2021 Accepted: February 28, 2021 Published: March 3, 2021 Copyright © 2021 by author(s) and Scientific Research Publishing Inc. This work is licensed under the Creative Commons Attribution International License (CC BY 4.0). http://creativecommons.org/licenses/by/4.0/
Open Access

X. Lei et al.
DOI: 10.4236/jmp.2021.124028 392 Journal of Modern Physics
advanced technologies of Additive Manufacturing (AM) enable innovative de-signs of complex-shaped components and have the potential to broaden the manufacturing possibilities. Since the safety aspect is crucial and must not be compromised, these new manufacturing approaches demand even higher accu-racy and reliability in quality assessments. Nondestructive evaluation (NDE) is used to ensure the quality and integrity of the manufactured components and among others, conventional ultrasonic testing (UT) has been widely used in in-dustries [1]. Within this area, the phased array ultrasonic testing (PAUT) tech-nique has many possible advantages over conventional single-element UT me-thods in terms of operational flexibility and increased inspection speed [2]. However, the complexity and flexibility of PAUT raise the need of understand-ing the technique in qualification and evaluation procedures. There is also a need of adjustment for AM-specific defect characteristics and geometrical con-straints of specific parts.
The traditional approach to qualification work is associated with extensive and expensive physical experiments. However, with the development of mathe-matical modelling of NDE methods in the last decades, the experimental work can be supported or partly replaced by the model-based data, provided that the model itself has been validated [3]. The validation of the mathematical model can be done by comparing it with other already validated models, but it should ultimately be compared with physical experiments in all perspectives to ensure its accuracy. Some works had been devoted to experimental validation of a si-mulation model in terms of PAUT, see for example [4] and [5].
The phased array (PA) probe model implemented in a UT simulation soft-ware, simSUNDT, developed by the Chalmers University of Technology, had been validated to some extent in terms of maximum echo amplitude towards well-defined artificial defects, i.e. side-drilled holes (SDHs) [6]. In the current paper, the model is to be further validated by comparing the data presentations (A-, B- and C-scan). These are retrieved from both experiments and corres-ponding simulations, which address some well-defined artificial defects in noise-free test specimens. Satisfactory correlations can be observed from the comparisons and the model can be concluded as an alternative to the corres-ponding experiments. The generated sound fields towards a certain type of de-fect, i.e. surface breaking crack, are optimized with the help of this validated model as an applied practice. The optimization in this work aims at retrieving a maximized echo amplitude by adjusting the combination of probe angle and fo-cusing distance, which is easy and essential to change in the phased array confi-guration. The possibility and procedure of using the simulation model in sound field optimization work is hereby investigated.
2. simSUNDT Software
The simSUNDT software, developed at Chalmers University of Technology, composes of a Windows-based processor for simulation definition and result
X. Lei et al.
DOI: 10.4236/jmp.2021.124028 393 Journal of Modern Physics
analysis. A mathematical kernel, UTDefect, which conducts the actual mathe-matical modelling [7] [8] [9] [10], has been validated by comparing with pre-vious done and in literature available experiments [7] [8] [9] [11]. The 3D elas-todynamic wave equation that defines the wave propagation in a homogeneous half space is solved by using vector wave functions [10]. The modelled geometry can be described as a plate bounded by the scanning surface, on which rectan-gular mesh is used to define the scanning sequence. Scattering by defects is solved using analytical or semi-analytical methods.
The simSUNDT can simulate the entire NDE inspection. In order to accom-plish this, calibration option with reference reflector is available. These reflectors include side-drilled hole (SDH) [12] and flat-bottom hole (FBH), which is represented by a cylindrical cavity and an open circular crack, respectively.
The volumetric and crack-like defects are available types of defect to be simu-lated. The volumetric ones include a spherical/spheroid cavity (pore), a spherical inclusion (isotropic material differing from the surrounding material, i.e. slag) and a cylindrical cavity (SDH). Crack-like ones include rectangular/circular crack (lack of fusion) and strip-like crack (fatigue crack). Tilting planar back surface could also be modelled for the strip-like crack, but it is otherwise as-sumed parallel to the scanning surface. The surface-breaking strip-like crack and rectangular crack close to the back surface can be used to model the corres-ponding defects in the test piece.
The conventional contact probe is represented as the boundary conditions representing a plane wave in the far-field at a certain angle. Different traction conditions represent different probe types under the effective area and are as-sumed to be zero elsewhere. This enables the possibilities of simulating any types of the probe available on the market, by specifying related parameters such as wave types, crystal size and shape, angles, frequency ranges, contact conditions, etc. In addition, it is also possible to suppress the mode-converted wave compo-nent in the simulation to eventually facilitate the analysis of the received signal. By modelling the receiver, a reciprocity argument [13] is applied. The arrange-ment of the probe can be chosen among pulse-echo, separate with fixed trans-mitter and tandem configuration (TOFD).
Above principles are the same for the PA probe model, i.e. the individual ele-ment is represented by the corresponding boundary conditions. The individual boundary conditions are translated into the main coordinate system and a PA wave front with certain nominal angle is formulated by constructive phase in-terference.
3. Experiments 3.1. Experimental Instruments and Test Specimens
The data acquisition hardware TOPAZ64 is a portable 64-channel PAUT device. It is connected to a computer with data communication through Gigabyte Ethernet cable. Operations are monitored on software UltraVision, which pro-

X. Lei et al.
DOI: 10.4236/jmp.2021.124028 394 Journal of Modern Physics
vides real-time data presentation and visualization. The linear PA probe con-nected to TOPAZ64 is labelled as LM-5MHz, which contains 64 elements that generate longitudinal waves. As indicated by its nomination, the nominal center frequency is 5 MHz and bandwidth (−6 dB) is 74%. Table 1 lists some key speci-fications of this probe. In addition, two plastic wedges with and without angle labelled as LM-55SW and LM-0LW, respectively, are incorporated in all experi-ments to protect the probe surface and to facilitate fixation of the probe on the mechanized gantry system. This gantry system is motor-controlled in horizontal (x-y) plane while the vertical position (z-axis) is manually adjusted at this mo-ment. The bottom end of the z-axis has a spring load fork that can clamp the wedge with probe. The motors are embedded with encoders so that the horizon-tal position of the probe can be obtained and read by UltraVision to present po-sition-related visualizations.
There are two stainless-steel test specimens with different artificial defects (SDH and surface breaking crack) included in this work, see Figure 1. The first specimen (#1) has 6 SDHs (2 mm in diameter) at depth from 10 mm to 60 mm with increment of 10 mm. The second one (#2) has 5 vertical surface breaking cracks (tilt angle of 0-degree) with height of 0.5 mm, 2 mm, 5 mm, 10 mm and 15 mm. Table 2 summarizes the overall dimension and acoustic properties of
Table 1. Specification of the linear PA probe used in the experiment.
Specification Value
Total elements 64
Total length (mm) 38.3
Elevation (mm) 10
Pitch (mm) 0.6
Kerf 0.1
Center frequency (MHz) 5
Relative bandwidth (%) 74
Figure 1. Sketch profiles of the test specimens.

X. Lei et al.
DOI: 10.4236/jmp.2021.124028 395 Journal of Modern Physics
Table 2. Dimensions and acoustic properties of specimens.
No. Length (mm)
Height (mm)
Width (mm)
L-wave speed (m/s)
T-wave speed (m/s)
#1 250 65 39 5640 3110
#2 500 35 50 5573 3150
these specimens and all these defects span through the entire width of each spe-cimen.
3.2. Experimental Configurations
The validations presented in the current work aim at comparing different data presentations (A-scan from the maximum echo amplitude, B- and C-scans) be-tween physical experiments and corresponding simulations. Data acquisition is performed in pulse-echo mode and the probe inspects a test specimen with one-line scan on the specimen surface to obtain the signals from all involved de-fects at once.
On the first test specimen (#1), only the SDH at 50 mm depth is studied under four inspection cases, i.e. (a) non-angled sound beam without focusing effect; (b) non-angled sound beam with focusing at 50 mm depth; (c) 45-degree angled sound beam without focusing effect and (d) 45-degree angled sound beam with focusing at 50 mm depth. The direct echo from the SDH is stored as received signal.
On the second test specimen (#2), all cracks except the largest one (height of 15 mm) are studied under two general inspection cases, i.e. (a) 45-degree angled sound beam without focusing effect and (b) 45-degree angled sound beam with focusing at 35 mm depth. The surface breaking cracks are positioned so that the openings are on the bottom surface and corner echoes are the received signals.
Within all these inspection cases, only the central 16 elements are activated in non-focusing cases to prevent ghost images, whereas all 64 elements are acti-vated to generate proper focusing effect.
4. Simulation Configuration
To compare with experimental data presentations, the corresponding one-line scan simulations must cover a certain scan interval. This is to ensure that the maximum echo amplitude from the defect of interest can be retrieved to be pre-sented in A-scan, and that sufficient amount of scan positions can be covered to visualize the defect in B-scan and echo dynamic curve in C-scan. Furthermore, the sampling time steps of A-scan signals should be small enough to ensure the accuracy of detailed comparisons. Under above reasons, all simulations for vali-dation purpose are conducted in large scan and time intervals with scan incre-ment of 0.1 mm and time step of 0.005 μs. These simulation parameters were determined in such a way that the resulted data presentations have a decent res-olution to be compared with experiments. Parameters related to the PA probe
X. Lei et al.
DOI: 10.4236/jmp.2021.124028 396 Journal of Modern Physics
are set in accordance with the physical probe as in Table 1. As expected, the simulation time is positively correlated with the amount of
scan and time positions, as well as the complexity of studied defect and inspec-tion scenario. The simulation times of cracks with height of 5 mm and 10 mm involving focusing effect were observed to be extensively long using above men-tioned simulation configurations. To avoid this, only certain scan and time in-tervals where the maximum echo amplitudes are expected were simulated for these two cracks with focusing effect, while still keeping the scan increment of 0.1 mm and time step of 0.005 μs unchanged. For this reason, the B-scan com-parisons are neglected for these two cases due to insufficient scan positions.
5. Probe Skew Angle Sensitivity
For the physical experiments, there could be some practical uncertainties in the system affecting the results, one example is the probe skew angle. In order to ex-plore if the minor variation of the probe skew angle can influence the received data, some parametric studies were performed with a set of probe skew angles, ranging from −5˚ to 5˚ with an increment of 0.5˚. The simulations were per-formed towards the SDH at 50 mm depth in test specimen #1 under the inspec-tion case of 45-degree angled beam with 50 mm focus depth, just as the case (d) on test specimen #1 in the experimental configurations. These simulated results are compared with available experimental data.
6. Optimization of Received Signal
It is noted that the optimization of the received signal is equivalent to the sound field in this pulse-echo situation. With the help of this simulation model and its flexibility of parametric studies, the generated sound field from a PA probe is explored to be optimized in order to receive a maximized echo amplitude to-wards a crack, which has a specific character, i.e. size and tilt angle. The consi-dered decision variables to this optimization problem are the probe (beam) angle and focus distance in this work.
The optimization algorithm considered in this work is heuristic Nelder-Mead based Simplex method [14] [15] that solves non-linear single-objective optimi-zation problems. This method compares the objective values at each chosen simplex vertex and moves the next simplex vertex accordingly based on the re-sult evaluations using different operation strategies, i.e. reflection, expansion, contraction and shrink.
The optimization procedure using Simplex algorithm is conducted using software modeFrontier (2020R1), in which the decision variables to an optimiza-tion problem are explored. Simulation outputs from simSUNDT can be im-ported into modeFrontier to help with optimization evolution according to the chosen algorithm.
As mentioned earlier, the simulation towards a large crack where the focusing effect is involved takes extensive simulation time. It is therefore inefficient and

X. Lei et al.
DOI: 10.4236/jmp.2021.124028 397 Journal of Modern Physics
unfeasible to conduct the actual optimization work based on the simulation con-figuration (large scan interval, small scan increment, nominal probe bandwidth of 74%, etc.) described in simulation configuration for validation purpose. Based on previous simulation experiences, the simulation time depends positively on the number of involved wave frequencies. Therefore, variations of probe band-width are investigated in Table 3 in terms of simulation time and the influence on interested simulation output, i.e. the maximum echo amplitude. The simu-lated defect is a surface breaking crack (opening at bottom surface) with 10 mm height and 0-degree tilt angle, corresponds to the 10 mm height crack in test specimen #2. Simulation scenario is 45-degree probe angle and 49.49 mm focus distance (corresponds to 35 mm focus depth). The scan interval is chosen so that within which the maximum echo amplitude is expected to appear. Scan posi-tions are uniformly distributed inside this interval.
The maximum echo amplitude of 76.8 dB in investigation No.1 obtained with nominal probe bandwidth of 74% is taken as a standard value to upcoming va-riants (No.2 and 3). Investigation No.2 where bandwidth changes to only 0.02% gives its maximum echo amplitude of 76.9 dB, which differs only 0.1% from the standard value but reduces the simulation time significantly up to 91% if keeping all other parameters unchanged. Moreover, monochromatic frequency spectrum (bandwidth of 0%, only a center frequency content) simulated in investigation No.3 reduces almost 99% of standard simulation time, but the maximum echo amplitude of interest changed 8% to the standard value. These three investigated cases show that the second simulation scheme (bandwidth of 0.02%) could be considered reasonable and should be used in the later optimizations.
7. Results and Discussion 7.1. Validity of Simulation Model
The model is validated in this work by comparing experiments and simulations in terms of data presentations (A-, B- and C-scans), see Figures 2-10, where all signals are normalized to their corresponding maximum values for easy com-parison purposes. All simulated results are presented in black colour and expe-rimental ones are in red colour. In A-scans, the experimental peaks (red dotted lines) are shifted in time so that they coincide with simulated peaks (black solid lines) for comparison purpose. The amount of shifted time could be correlated to e.g. experimental condition and setup, etc. In B-scans, the simulated and ex-perimental results are ordered to the left and right, respectively. In C-scans, the
Table 3. Optimization condition investigations.
No. BW. (%) Scan pos. Time pos. Max. amp. (dB) Time (h)
1 74 35 14,448 76.8 64
2 0.02 35 14,448 76.9 6
3 0 35 - 83 0.13
X. Lei et al.
DOI: 10.4236/jmp.2021.124028 398 Journal of Modern Physics
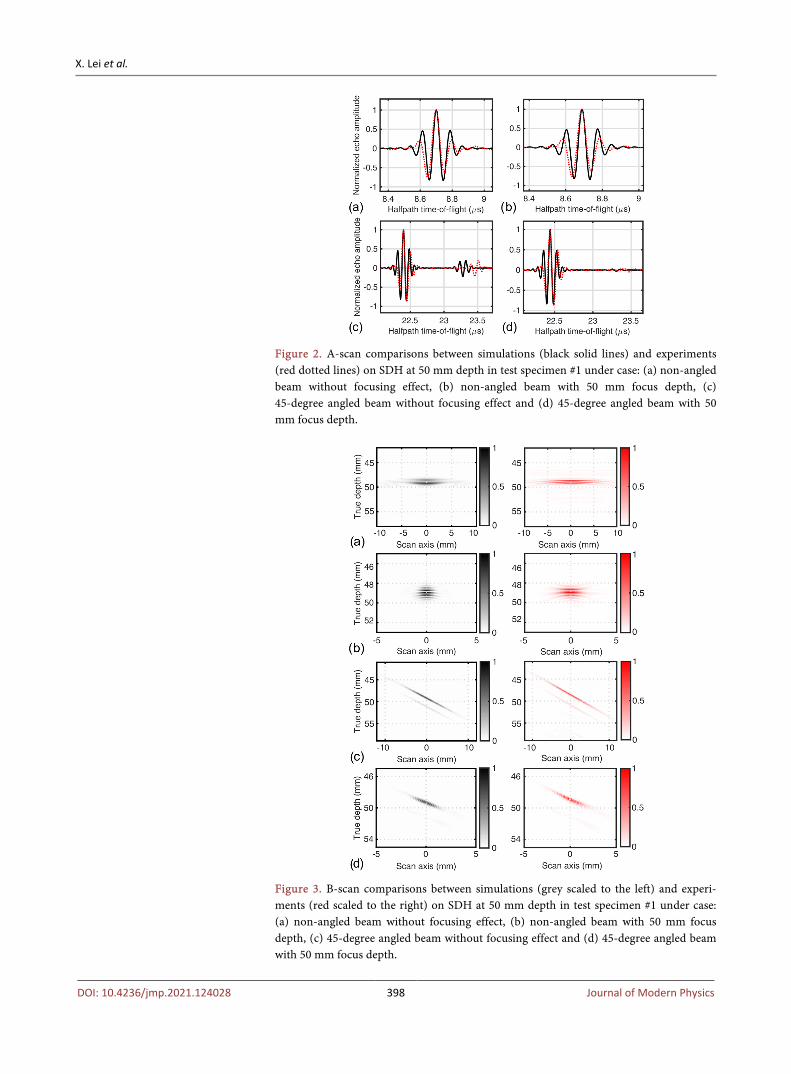
Figure 2. A-scan comparisons between simulations (black solid lines) and experiments (red dotted lines) on SDH at 50 mm depth in test specimen #1 under case: (a) non-angled beam without focusing effect, (b) non-angled beam with 50 mm focus depth, (c) 45-degree angled beam without focusing effect and (d) 45-degree angled beam with 50 mm focus depth.
Figure 3. B-scan comparisons between simulations (grey scaled to the left) and experi-ments (red scaled to the right) on SDH at 50 mm depth in test specimen #1 under case: (a) non-angled beam without focusing effect, (b) non-angled beam with 50 mm focus depth, (c) 45-degree angled beam without focusing effect and (d) 45-degree angled beam with 50 mm focus depth.

X. Lei et al.
DOI: 10.4236/jmp.2021.124028 399 Journal of Modern Physics
Figure 4. C-scan (echo dynamic curve) comparisons between simulations (black solid lines) and experiments (red dotted lines) on SDH at 50 mm depth in test specimen #1 under case: (a) non-angled beam without focusing effect, (b) non-angled beam with 50 mm focus depth, (c) 45-degree angled beam without focusing effect and (d) 45-degree angled beam with 50 mm focus depth.
peaks (respective amplitude of 0 dB corresponds to the scan position where the maximum echo amplitude is detected) are also shifted to facilitate the comparisons.
Comparisons for the SDH at 50 mm depth in test specimen #1 are shown in Figures 2-4. The experimental A-scans are shifted by (a) 0.01 μs, (b) −0.001 μs, (c) 0.29 μs and (d) 0.2 μs. Good correlations can be seen in all A- and C-scan comparisons. In one of the A-scans, case (c), a second somewhat weaker pulse can be observed. This is identified as a satellite pulse correlated to the surface wave traveling round the SDH. The mismatch of this weaker wave between si-mulation and experiment could then be explained by inaccuracy of actual SDH diameter in the test specimen. This weaker pulse in case (d) diminishes since the wave energy is focused and mostly reflected. B-scans show indifferentiable shapes except for the second case, which could be caused by a variation in con-tact-condition affected beam divergence, but the overall comparisons show good consistency. The echo dynamic curves above −10 dB correlate well.
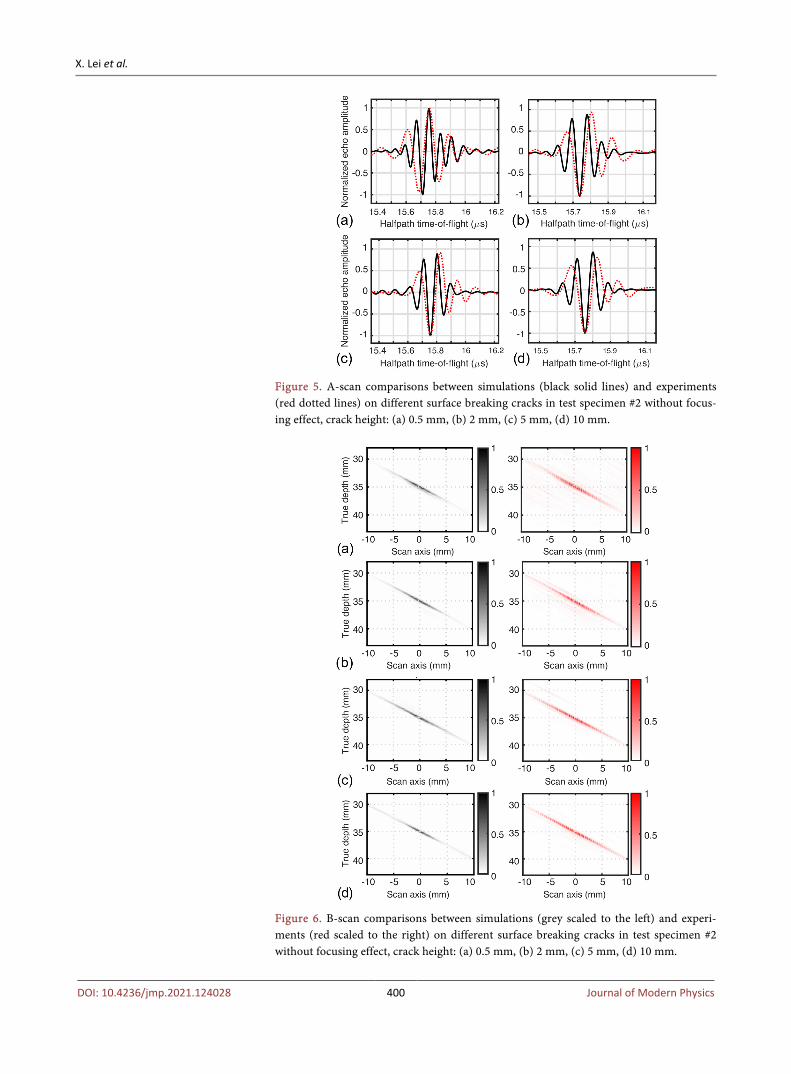
Comparisons for the four surface breaking cracks (height of 0.5 mm, 2 mm, 5 mm and 10 mm) in test specimen #2 without focusing effect are shown in Fig-ures 5-7. The experimental A-scans are shifted by (a) 0.06 μs, (b) 0.04 μs, (c) 0.01 μs and (d) 0.05 μs. The wave form of the smallest crack (height 0.5 mm) does not correlate as good as others and the reason might be that the smallest crack stands more for a volumetric defect than a crack, which was actually mod-elled and simulated. All B-scans show indifferentiable shapes.
Comparisons for the four surface breaking cracks (height of 0.5 mm, 2 mm, 5 mm and 10 mm) in test specimen #2 with 35 mm focus depth are shown in Fig-ures 8-10. The experimental A-scans are shifted by (a) −0.27 μs, (b) −0.27 μs, (c) −0.14 μs and (d) −0.12 μs. As mentioned in simulation configuration that only a certain scan and time interval where the corresponding maximum echo ampli-tude is expected was simulated for cracks with height of 5 mm and 10 mm, their
X. Lei et al.
DOI: 10.4236/jmp.2021.124028 400 Journal of Modern Physics
Figure 5. A-scan comparisons between simulations (black solid lines) and experiments (red dotted lines) on different surface breaking cracks in test specimen #2 without focus-ing effect, crack height: (a) 0.5 mm, (b) 2 mm, (c) 5 mm, (d) 10 mm.
Figure 6. B-scan comparisons between simulations (grey scaled to the left) and experi-ments (red scaled to the right) on different surface breaking cracks in test specimen #2 without focusing effect, crack height: (a) 0.5 mm, (b) 2 mm, (c) 5 mm, (d) 10 mm.

X. Lei et al.
DOI: 10.4236/jmp.2021.124028 401 Journal of Modern Physics
Figure 7. C-scan (echo dynamic curve) comparisons between simulations (black solid lines) and experiments (red dotted lines) on different surface breaking cracks in test spe-cimen #2 without focusing effect, crack height: (a) 0.5 mm, (b) 2 mm, (c) 5 mm, (d) 10 mm.
Figure 8. A-scan comparisons between simulations (black solid lines) and experiments (red dotted lines) on different surface breaking cracks in test specimen #2 with 35 mm focus depth, crack height: (a) 0.5 mm, (b) 2 mm, (c) 5 mm, (d) 10 mm
Figure 9. B-scan comparisons between simulations (grey scaled to the left) and experi-ments (red scaled to the right) on different surface breaking cracks in test specimen #2 with 35 mm focus depth, crack height: (a) 0.5 mm, (b) 2 mm, (c) 5 mm, (d) 10 mm.
X. Lei et al.
DOI: 10.4236/jmp.2021.124028 402 Journal of Modern Physics
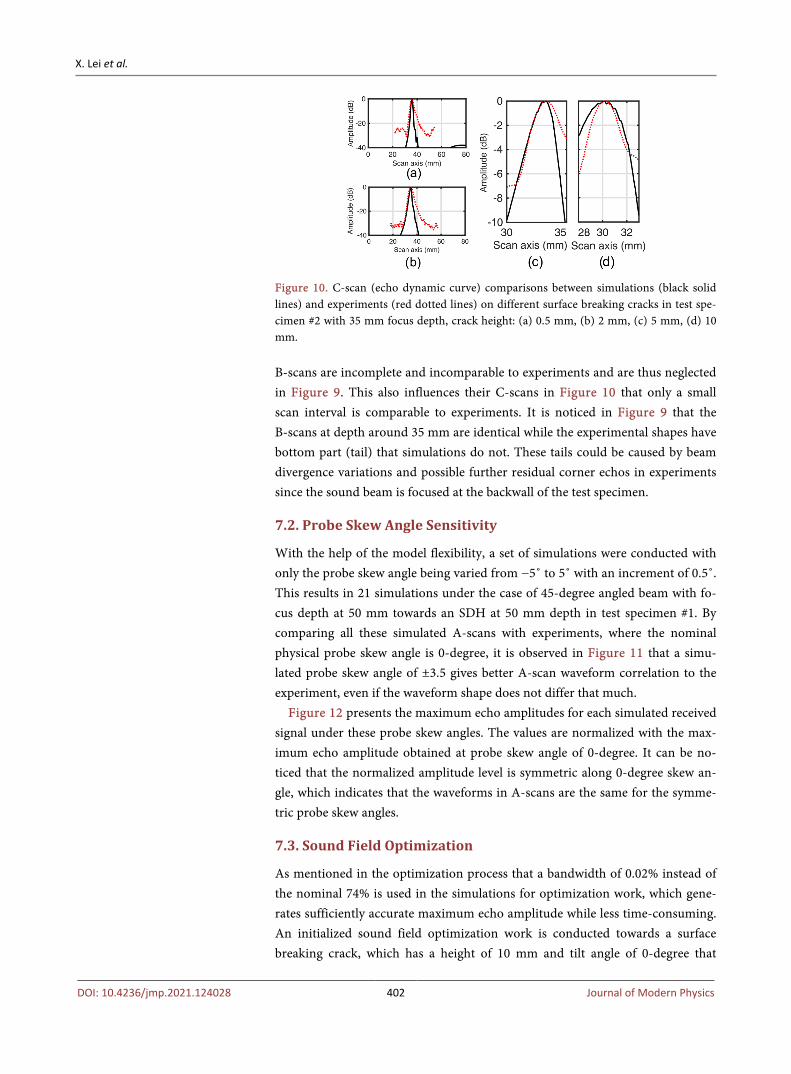
Figure 10. C-scan (echo dynamic curve) comparisons between simulations (black solid lines) and experiments (red dotted lines) on different surface breaking cracks in test spe-cimen #2 with 35 mm focus depth, crack height: (a) 0.5 mm, (b) 2 mm, (c) 5 mm, (d) 10 mm.
B-scans are incomplete and incomparable to experiments and are thus neglected in Figure 9. This also influences their C-scans in Figure 10 that only a small scan interval is comparable to experiments. It is noticed in Figure 9 that the B-scans at depth around 35 mm are identical while the experimental shapes have bottom part (tail) that simulations do not. These tails could be caused by beam divergence variations and possible further residual corner echos in experiments since the sound beam is focused at the backwall of the test specimen.
7.2. Probe Skew Angle Sensitivity
With the help of the model flexibility, a set of simulations were conducted with only the probe skew angle being varied from −5˚ to 5˚ with an increment of 0.5˚. This results in 21 simulations under the case of 45-degree angled beam with fo-cus depth at 50 mm towards an SDH at 50 mm depth in test specimen #1. By comparing all these simulated A-scans with experiments, where the nominal physical probe skew angle is 0-degree, it is observed in Figure 11 that a simu-lated probe skew angle of ±3.5 gives better A-scan waveform correlation to the experiment, even if the waveform shape does not differ that much.
Figure 12 presents the maximum echo amplitudes for each simulated received signal under these probe skew angles. The values are normalized with the max-imum echo amplitude obtained at probe skew angle of 0-degree. It can be no-ticed that the normalized amplitude level is symmetric along 0-degree skew an-gle, which indicates that the waveforms in A-scans are the same for the symme-tric probe skew angles.
7.3. Sound Field Optimization
As mentioned in the optimization process that a bandwidth of 0.02% instead of the nominal 74% is used in the simulations for optimization work, which gene-rates sufficiently accurate maximum echo amplitude while less time-consuming. An initialized sound field optimization work is conducted towards a surface breaking crack, which has a height of 10 mm and tilt angle of 0-degree that

X. Lei et al.
DOI: 10.4236/jmp.2021.124028 403 Journal of Modern Physics
Figure 11. A-scan comparisons between simulations (black solid lines) and experiments (red dotted lines) on SDH at 50 mm depth in test specimen #1 under the case of 45-degree angled beam with 50 mm focus depth, simulated probe skew angle of 0-degree in (a) and ±3.5-degree in (b).
Figure 12. Maximum echo amplitude (normalized at 0-degree probe skew angle, ex-pressed in percentage) for each simulated probe skew angle under the inspection of SDH at 50 mm depth in test specimen #1 in the case of 45-degree angled beam with 50 mm focus depth.
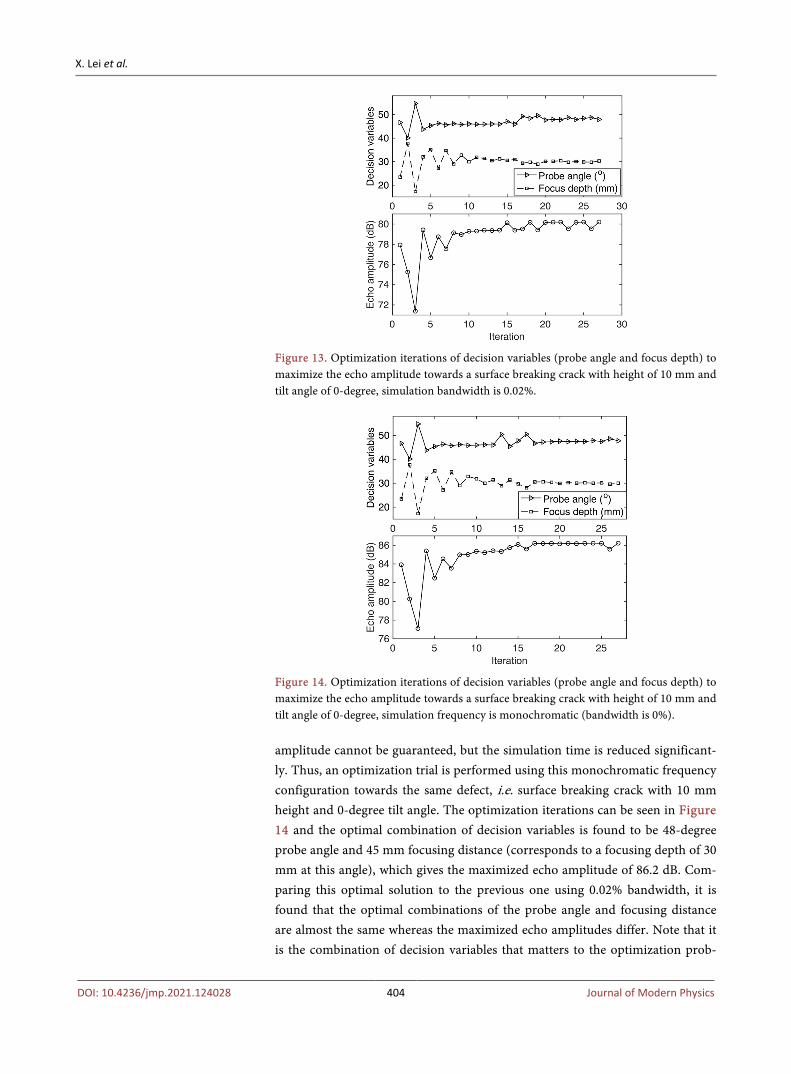
corresponds to the 10 mm height crack on test specimen #2. The crack opening is on the bottom surface of the test specimen, so the received signal (maximum echo amplitude) is the corner echo from the crack. The decision variables are the probe (beam) angle and focusing distance. Figure 13 shows the iteration processes of the optimization for this crack. It can be seen that after around 20 iterations, a maximized (optimal) echo amplitude of around 80.2 dB can be found under an optimal combination of 48-degree probe angle and 45.2 mm focusing distance (corresponds to a focusing depth of 30.2 mm at this angle), i.e. the optimal solu-tion. Comparing with the second case in Table 3, where the same crack is simu-lated but with an original combination of 45-degree probe angle and 49.49 mm focusing distance, it is obvious that the received maximum echo amplitude is larger using the optimal solution, i.e. 80.2 dB > 76.9 dB.
Noticing the third investigation case in Table 3 where the unique monochro-matic frequency spectrum is simulated, the accuracy of obtained maximum echo
X. Lei et al.
DOI: 10.4236/jmp.2021.124028 404 Journal of Modern Physics
Figure 13. Optimization iterations of decision variables (probe angle and focus depth) to maximize the echo amplitude towards a surface breaking crack with height of 10 mm and tilt angle of 0-degree, simulation bandwidth is 0.02%.
Figure 14. Optimization iterations of decision variables (probe angle and focus depth) to maximize the echo amplitude towards a surface breaking crack with height of 10 mm and tilt angle of 0-degree, simulation frequency is monochromatic (bandwidth is 0%).
amplitude cannot be guaranteed, but the simulation time is reduced significant-ly. Thus, an optimization trial is performed using this monochromatic frequency configuration towards the same defect, i.e. surface breaking crack with 10 mm height and 0-degree tilt angle. The optimization iterations can be seen in Figure 14 and the optimal combination of decision variables is found to be 48-degree probe angle and 45 mm focusing distance (corresponds to a focusing depth of 30 mm at this angle), which gives the maximized echo amplitude of 86.2 dB. Com-paring this optimal solution to the previous one using 0.02% bandwidth, it is found that the optimal combinations of the probe angle and focusing distance are almost the same whereas the maximized echo amplitudes differ. Note that it is the combination of decision variables that matters to the optimization prob-

X. Lei et al.
DOI: 10.4236/jmp.2021.124028 405 Journal of Modern Physics
lem, therefore, it is reasonable to believe that a monochromatic frequency con-figuration can be used in the further similar optimization processes.
The increase in received signal amplitude from the surface breaking crack with 10 mm height and 0-degree tilt angle by using optimal parameter set is visi-ble in Table 4. The optimal solution using nominal 74% bandwidth are com-pared with the original one (i.e. nominal bandwidth of 74% and the parameter combination of 45-degree beam angle with 35 mm focus depth). A 4.1 dB in-creased amplitude than original is observed. Besides, the experimental echo am-plitude comparison using the original combination and the optimal one is also presented in Table 4 to verify that the optimal solution ensures an improvement of the received echo amplitude. Note that these amplitude results in the table are normalized by the one using the original combination, i.e. 76.8 dB with band-width of 74%.
After the above observations, Figure 15 presents an optimization case towards a surface breaking crack with height of 10 mm and tilt angle of 5-degree using monochromatic frequency configuration. After around 20 iterations, the optimal combination (optimal solution) of probe angle of 56-degree and focusing dis-tance of 46.3 mm (corresponds to a focusing depth of 26 mm at this angle) is
Table 4. Normalized comparisons of received signal amplitude using original and optim-al combinations of decision variables and with different simulated bandwidth, normaliza-tion reference is 76.8 dB.
Simulated amplitude delta (dB) Experimental amplitude delta (dB)
Original (BW74%) 0 0
Optimal (BW74%) +4.1 +1.4
Optimal (BW0.02%) +3.4 -
Optimal (BW0%) +9.4 -
Figure 15. Optimization iterations of decision variables (probe angle and focus depth) to maximize the echo amplitude towards a surface breaking crack with height of 10 mm and tilt angle of 5-degree, simulation frequency is monochromatic (bandwidth is 0%).

X. Lei et al.
DOI: 10.4236/jmp.2021.124028 406 Journal of Modern Physics
found, which gives the maximized echo amplitude of 87.1 dB. This optimal solu-tion is also verified afterwards by using 0.02% bandwidth, which gives the max-imized echo amplitude of 81.4 dB under probe angle of 56-degree and focusing distance of 46.9 mm.
8. Conclusions
Numerical models in UT have many potential benefits to be a complement of physical experimental work and to the understanding of the techniques. To en-sure the validity of these models, validation is essential, either by comparison to other validated models or to corresponding experimental scenarios. In the cur-rent work, the PA probe model included in the UT simulation software sim-SUNDT is further validated experimentally in terms of data presentation com-parisons, i.e. A-, B- and C-scans. These data presentations under different in-spection scenarios show satisfactory correlations to corresponding experiments in general, and confirm the validity of the simulation model.
After the model is validated, it is further used in exploring the optimized sound field generated by a PA probe. The sound field optimization aims at re-trieving the maximized echo amplitude as a function of the defect characteristics (size and tilt angle) by adjusting a combination of decision variables, i.e. probe angle and focusing distance, of PA probe. A surface breaking crack with certain height and tilt angle is considered as the targeted defect. It is observed before the optimization work that, instead of using the nominal probe parameter (i.e. band-width), a change of this parameter not only maintains the echo amplitude level, but also significantly reduces the simulation time. Thus, this is used as an ap-proach in the optimization process. It is then found by comparing this optimiza-tion result with the one obtained using monochromatic frequency configuration that, the latter configuration ends up with the same optimal combination of de-cision variables as the first one, even if the obtained maximized echo amplitudes differ. In other words, the monochromatic configuration can reduce the simula-tion time significantly while still results in a set of reasonable optimal decision va-riables. A brief experimental verification of the optimal solution is presented accor-dingly and the improvement of sound field, i.e. the received signal amplitude in current situation, using the optimal solution is clearly observed. Thus, this optimi-zation scheme can be used in optimization work with other defect characteristics.
Acknowledgements
This work was supported by the Swedish innovation agency VINNOVA under Grant 2017-04856. It is performed in collaboration with GKN Aerospace Engine System and Chalmers University of Technology. The national aeronautical re-search program (NFFP7) is greatly acknowledged.
Conflicts of Interest
The authors declare no conflicts of interest regarding the publication of this paper.

X. Lei et al.
DOI: 10.4236/jmp.2021.124028 407 Journal of Modern Physics
References [1] Hagemaier, D. (1974) SAE Transactions, 83, 2767-2796.
https://doi.org/10.4271/740811
[2] Drinkwater, B.W. and Wilcox, P.D. (2006) NDT & E International, 39, 525-541. https://doi.org/10.1016/j.ndteint.2006.03.006
[3] Holmer, G., Daniels, W. and Zettervall, T. (2017) Evaluation of the Simulation Software CIVA for Qualification Purpose. https://www.stralsakerhetsmyndigheten.se/publikationer/rapporter/sakerhet-vid-karnkraftverken/2017/201729
[4] Lopez, A.B., Santos, J., Sousa, J.P., Santos, T.G. and Quintino, L. (2019) Journal of Nondestructive Evaluation, 38, 1-11. https://doi.org/10.1007/s10921-019-0600-y
[5] Chatillon, S., Robert, S., Calmon, P., Daniel, G., Cartier, F., et al. (2015) AIP Confe-rence Proceedings, 1650, 1847-1855. https://doi.org/10.1063/1.4914810
[6] Lei, X., Wirdelius, H. and Rosell, A. (2020) Ultrasonics, 108, Article ID: 106217. https://doi.org/10.1016/j.ultras.2020.106217
[7] Jansson, P.A. (2000) AIP Conference Proceedings, 509, 57-64. https://doi.org/10.1063/1.1306034
[8] Boström, A. and Eriksson, A.S. (1993) Proceedings of the Royal Society of London. Series A: Mathematical and Physical Sciences, 443, 183-201. https://doi.org/10.1098/rspa.1993.0139
[9] Bövik, P. and Boström, A. (1997) The Journal of the Acoustical Society of America, 102, 2723-2733. https://doi.org/10.1121/1.420326
[10] Boström, A. and Wirdelius, H. (1995) The Journal of the Acoustical Society of America, 97, 2836-2848. https://doi.org/10.1121/1.411850
[11] Wirdelius, H. (2007) Experimental validation of the UTDefect simulation software. Proceedings of 6th International Conference on NDE in Relation to Structural In-tegrity for Nuclear and Pressurized Components, Budapest, 8-10 October 2007.
[12] Boström, A. and Bövik, P. (2003) International Journal of Solids and Structures, 40, 3493-3505. https://doi.org/10.1016/S0020-7683(03)00150-1
[13] Auld, B.A. (1979) Wave Motion, 1, 3-10. https://doi.org/10.1016/0165-2125(79)90020-9
[14] Grešovnik, I. (2007) Simplex Algorithms for Nonlinear Constraint Optimization Problems.
[15] Poles, S. (2003) The Simplex Method.