Embed Size (px)
Citation preview
EXPERIMENTAL STUDY ON THE NOISE REDUCTION
OF HYDRAULIC BENCH
MUHAMMAD SAUFI BIN ABDUL
Thesis submitted as partial fulfilment of the requirements for the award of the degree of Bachelor of Mechanical Engineering
Faculty of Mechanical EngineeringUNIVERSITI MALAYSIA PAHANG
6 DECEMBER 2010
ii
SUPERVISOR’S DECLARATION
I hereby declare that I have checked this project and in my opinion, this project is
adequate in terms of scope and quality for the award of the degree of Bachelor of
Mechanical Engineering.
Signature
Name of Supervisor: Mr. MOHD HAFIZI BIN ZOHARI
Position: SUPERVISOR
Date:

iii
STUDENT’S DECLARATION
I hereby declare that the work in this project is my own except for quotations and
summaries which have been duly acknowledged. The project has not been accepted for
any degree and is not concurrently submitted for award of other degree.
Signature : ...........................................
Name : MUHAMMAD SAUFI BIN ABDUL
ID Number
Date : 6 DECEMBER 2010
: MA07078
v
ACKNOWLEDGEMENTS
I am grateful and would like to express my sincere gratitude to my supervisor
Mohd Hafizi bin Zohari for his germinal ideas, invaluable guidance, continuous
encouragement and constant support in making this research possible. He has always
impressed me with his outstanding professional conduct, his strong conviction for
science, and his belief that a degree program is only a start of a life-long learning
experience. I appreciate his consistent support from the first day I applied to graduate
program to these concluding moments. I am truly grateful for his progressive vision
about my training in science, his tolerance of my naive mistakes, and his commitment to
my future career.
I acknowledge my sincere indebtedness and gratitude to my parents for their
love, dream, sacrifice, patience and understanding that were inevitable throughout my
life to make this possible. I cannot find the appropriate words that could properly
describe my appreciation for their devotion, support and faith in my ability to attain my
goals. Special thanks should be given to my committee members. I would like to
acknowledge their comments and suggestions, which was crucial for the successful
completion of this study.
vi
ABSTRACT
This report is the result of a research on undergraduate project of Experimental Study
on the Noise Reduction of Hydraulic Bench. The hydraulic bench is used to study the
performance of fluids and the hydraulic theory. This report presents the noise source
identification and noise reduction at hydraulic bench. The identification of the main
source of noise must be done first before the noise reduction is done at hydraulic bench
because the noise reduction will do based on the part that produce the main source of
noise at hydraulic bench. Many method can be use for noise reduction process but in
this research, the egg tray and fibre is used as material to reduce noise from hydraulic
bench. The egg tray is use only for shaped the fibre to get more surface absorption. In
this project, the result is achieved by using PULSE LABSHOP (Intensity Mapping).
In intensity mapping, the colour contour represents the sound power. Comparison of
result before and after noise reduction was conducted. The result from the experiment
show that the main source of noise is at hydraulic pump and the noise from the
hydraulic bench can be reduce up to 15 dB.
vii
ABSTRAK
Laporan ini merupakan hasil kajian dalam projek sarjana muda tentang Kajian
Eksperimen Pengurangan Hingar pada Bangku Hidrolik. Bangku hidrolik digunakan
untuk mempelajari prestasi cecair dan teori hidrolik. Laporan ini menunujukkan tentang
pengenalan sumber hingar dan pengurangan hingar di bangku hidrolik. Pengenalan
sumber utama hingar harus dilakukan terlebih dahulu sebelum pengurangan hingar
dilakukan pada bangku hidrolik kerana pengurangan hingar akan dilakukan berdasarkan
pada bahagian yang menghasilkan sumber utama hingar di bangku hidrolik. Banyak
kaedah boleh digunakan untuk proses pengurangan hingar tetapi dalam kajian ini,
dulang telur dan serat digunakan sebagai bahan untuk mengurangkan hingar dari
bangku hidrolik. Dulang telur digunakan hanya untuk membentuk serat untuk
mendapatkan penyerapan permukaan yang lebih banyak. Dalam projek ini, hasil yang
dicapai dengan menggunakan PULSE LABSHOP (Pemetaan Intensiti). Dalam
pemetaan intensiti, kontur warna merupakan kekuatan bunyi. Perbandingan hasil
sebelum dan selepas hingar dikurangkan telah dilakukan. Hasil dari kajian ini
menunjukkan bahawa sumber utama hingar adalah di bahagian hidrolik pam dan hingar
dari bangku hidrolik boleh dikurangkan sehingga 15 dB.
viii
TABLE OF CONTENTS
Page
SUPERVISOR’S DECLARATION ii
STUDENT’S DECLARATION iii
ACKNOWLEDGEMENTS v
ABSTRACT vi
ABSTRAK vii
TABLE OF CONTENTS viii
LIST OF TABLES xi
LIST OF FIGURES xii
LIST OF SYMBOLS
LIST OF ABBREVIATIONS
xiv
xvi
CHAPTER 1 INTRODUCTION
1.1 Introduction 1
1.2 Problem statement 2
1.3 Objectives of the project 2
1.4 Project Scope 2
CHAPTER 2 LITERATURE REVIEW
2.1 Introduction 3
2.2 Hydraulic Bench 3
2.3 Sound 4
2.3.1 Sound Power 5
2.3.2 Sound Intensity 6
2.4 Characteristics of Sound 6
2.4.1 Wavelength and Frequency 7
2.4.2 Longitudinal Wave 7
2.4.3 Beat Frequency 8
2.5 Superposition Wave 9
2.6 Infrasonic and Ultrasonic Sound 10
2.7 The Decibel scale 11
ix
2.8 Bandwidth 11
2.9 Character of noise 12
2.10 Source of noise 13
2.10.1 Misalignment 13
2.10.2 Unbalance rotor 13
2.10.3 Pressure pulsation and hydraulics effects 13
2.11 Noise measurement 14
2.12 Sound power measurement in an anechoic chamber 14
2.13 Noise reduction method 16
2.14 Vibration isolation 16
2.14.1 Spring mounts 16
2.14.2 Elastomeric isolation 17
2.14.3 Rubber pads 18
2.15 Damping 19
2.16 Level of noise 20
CHAPTER 3 METHODOLOGY
3.1 Introduction 22
3.2 Flow Chart Methodology 22
3.2.1 Flow Chart 23
3.3 Fabrication of Rig 24
3.4 Testing Procedure 25
3.5 Experiment Procedure 26
3.6 Calibration of Sound Intensity Probe 28
3.7 Data Analysis 29
3.8 Noise Reduction Method 29
3.8.1 Pump Enclosure 30
CHAPTER 4 RESULT AND DISCUSSIONS
4.1 Introduction 31
4.2 Data Analysis before Noise Reduction 31
4.3 Data Analysis after Noise Reduction 36
x
4.4 Comparison before and after Noise Reduction 41
CHAPTER 5 CONCLUSION AND RECOMMENDATIONS
5.1 Introduction 44
5.2 Conclusion 44
5.3 Recommendations 45
REFERENCES 46
APPENDIX A1 47
APPENDIX A2 48
APPENDIX B 49
xi
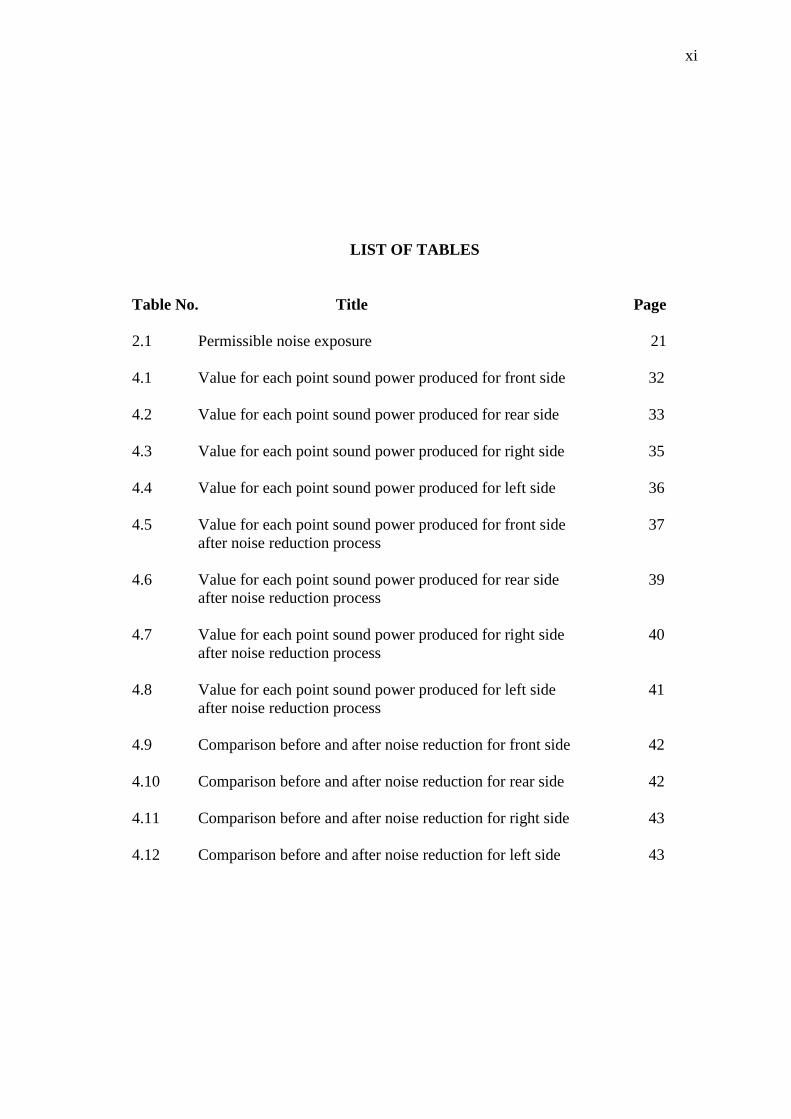
LIST OF TABLES
Table No. Title Page
2.1 Permissible noise exposure 21
4.1 Value for each point sound power produced for front side 32
4.2 Value for each point sound power produced for rear side 33
4.3 Value for each point sound power produced for right side 35
4.4 Value for each point sound power produced for left side 36
4.5 Value for each point sound power produced for front side 37
after noise reduction process
4.6 Value for each point sound power produced for rear side 39
after noise reduction process
4.7 Value for each point sound power produced for right side 40
after noise reduction process
4.8 Value for each point sound power produced for left side 41
after noise reduction process
4.9 Comparison before and after noise reduction for front side 42
4.10 Comparison before and after noise reduction for rear side 42
4.11 Comparison before and after noise reduction for right side 43
4.12 Comparison before and after noise reduction for left side 43
xii
LIST OF FIGURES
Figure No. Title Page
2.1 Hydraulic bench 4
2.2 Longitudinal or compression wave for sound 8
2.3 Superposition of two waves of slightly different in frequency
but same amplitude
8
2.4 Superposition of two waves of different amplitude 9
2.5 Superposition wave 10
2.6 -3dB bandwidth. 12
2.7 Room acoustics at UMP campus Pekan 15
2.8 Room acoustics wall at UMP campus Pekan 15
2.9 Examples of commercial available springs mounts 17
2.10 Examples of commercially available elastomeric isolator 18
2.11 Examples of commercially available rubber isolator 19
3.1 Drawing of rig stand for intensity mapping 24
3.2 Rig stand for intensity mapping 25
3.3 Instrument setup 26
3.4 Connecting the front-end 27
3.5 Power on button 27
3.6 The calibration of perpendicular sound intensity probe 28
3.7 The calibration of parallel sound intensity probe 39
3.8 Combination fibre and egg tray 30
4.1
Sound intensity mapping for front side
32
xiii
4.2 Sound intensity mapping for rear side 33
4.3 Sound intensity mapping for right side 34
4.4 Sound intensity mapping for left side
35
4.5 Sound intensity mapping for front side after noise reduction
process
37
4.6 Sound intensity mapping for rear side after noise reduction
process
38
4.7 Sound intensity mapping for right side after noise reduction
process.
39
4.8 Sound intensity mapping for left side after noise reduction
process
40
xiv
LIST OF SYMBOLS
WL Sound power level
W Sound power of the source
Wre
Reference sound power
I Sound intensity
A Surface area
Wavelength
c Speed of sound
f Frequency
Hz Hertz
PL Level
P Sound pressure
Po Reference sound pressure
1f Lower band-edge frequency
2f Upper band –edge frequency
N Speed of impeller
Z Number of blades
Loss factor
D Energy dissipation per cycle of vibration
W Average total energy of the vibrating system
Decay rate
Damping ratio
C Viscous damping coefficient
C c Critical damping coefficient
xv
F(e) Equivalent noise exposure factor
T Period of noise exposure
L Duration of the permissible noise exposure at the constant level

xvi
LIST OF ABBREVIATIONS
SPL Sound power level
dB Decibel scale
ISO International standard
CHAPTER 1
INTRODUCTION
1.1 INTRODUCTION
The World Health Organization has recognized noise as the most significant
health hazard to the working population in terms of the number of people affected. In
many industries, there is much method to avoid harmful noise. The most insidious
aspect of noise induced hearing loss is that in most cases damage accumulates over time
and is only recognized as a problem when it is too late to do anything about it (Hansen,
C. 2005).
Noise also can affect our daily living away from the work place. This type of
problem is called environmental noise pollution. Environmental noise pollution can
affect our physical health. In this context, noise can be defined as sound that is
unwanted by one or more individual even though it may be wanted by someone else.
When considering noise control, it is well known that the most cost effective
solution to a problem is often to control the noise generating mechanism right at its
source. This often has the benefit of making the process more efficient in addition to
being less noisy. Commonly, the method that used to reduce noise is considered about
barriers, enclosure, mufflers, absorbing and vibration isolation. It is referred to as add-
on noise control technology (Hansen, C. 2005).
In order to reduce noise at hydraulic bench, firstly must to identify the main
source of noise and the amount of sound power. The sound power of the hydraulic
2
bench can be identified by measuring sound intensity. The sound intensity is measured
in a specified direction. It is the average rate at which sound energy is transmitted
thought a unit area perpendicular to the specific direction. The sound pressure in a
medium is naturally related to the power of the medium. The sound pressure in a
medium is naturally related to the power of the source of sound. The sound power of a
source is the rate at which acoustic energy is transferred from a vibrating source to a
medium. If the source of noise can be identified, the noise of hydraulic bench may be
able to be reduced.
1.2 PROBLEM STATEMENTS
The hydraulic bench will produce noise while it operating. The noise produced
will cause disruption to the environment. A way should be taken to overcome the noise
problem in the hydraulic bench to find the main source of noise and the appropriate way
to solve the noise problem in hydraulic bench.
1.3 OBJECTIVES OF THE PROJECT
(i) To identify the main source of noise at hydraulic bench
(ii) To reduce the noise at hydraulic bench
1.4 PROJECT SCOPE
To identify the main source of noise at hydraulic bench. The test will run at
anechoic chamber. After the main source of noise is identified, the noise reduction
method will use to reduce the noise according to the main source of noise at hydraulic
bench.
3
CHAPTER 2
LITERATURE REVIEW
2.1 INTRODUCTION
This chapter will briefly explain about the basic characteristic of sound, basic
characteristic of noise, source of noise, noise measurement, noise reduction method, and
level of noise. All this information is needed to complete this research.
2.2 HYDRAULIC BENCH
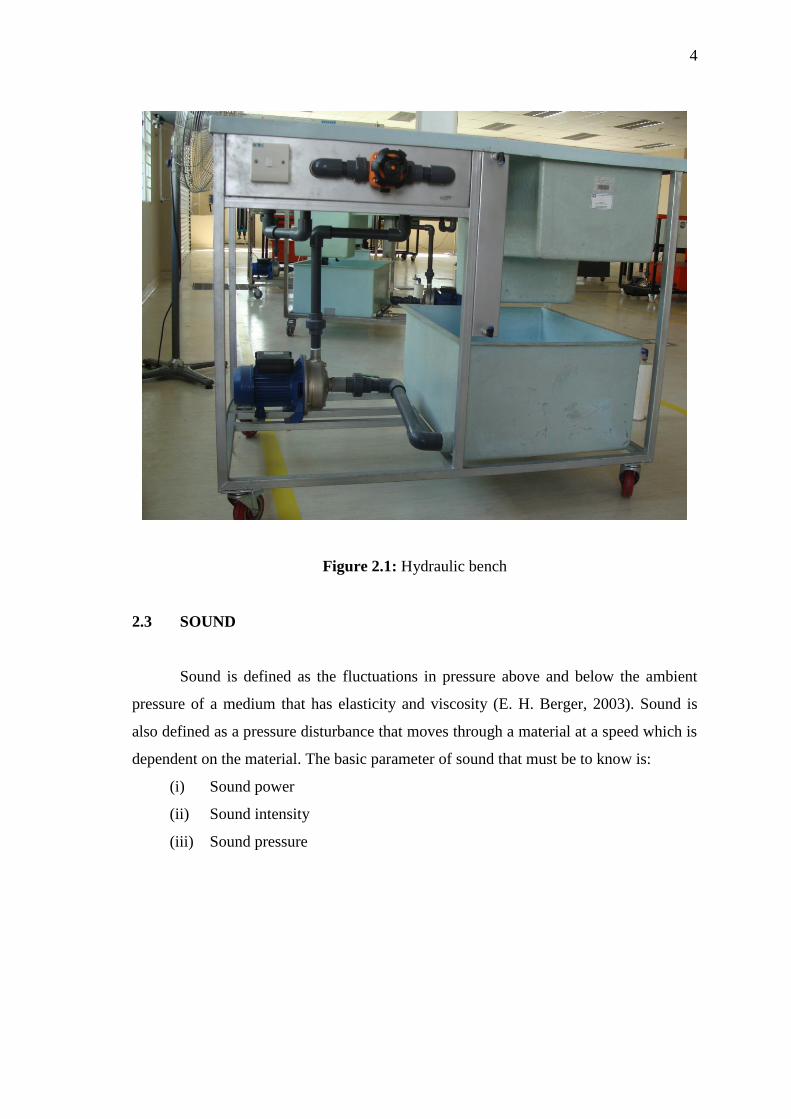
In fluid mechanic lab, the hydraulic bench is used to study the performance of
fluids and the hydraulic theory. The upper part of the bench consists of an open channel
and two tanks that we known the volume for a volume measurement of flow rate. An
external view tube with scale enables to read the water level inside these tanks. A dump
valve is installed in the bottom of the volumetric tank, this valve allows the water flows
into the supply tank available at the base of the hydraulic bench. The water is drawn to
the top of the bench by a centrifugal pump, whereas the flow rate is adjusted through a
control valve. A variable area flow meter enables to compare the flow rate read on the
instrument to the flow rate measured through the measuring tanks (Veneta, S.P.A.
1999). Hydraulic bench is show in Figure 2.1.
4
Figure 2.1: Hydraulic bench
2.3 SOUND
Sound is defined as the fluctuations in pressure above and below the ambient
pressure of a medium that has elasticity and viscosity (E. H. Berger, 2003). Sound is
also defined as a pressure disturbance that moves through a material at a speed which is
dependent on the material. The basic parameter of sound that must be to know is:
(i) Sound power
(ii) Sound intensity
(iii) Sound pressure
5
2.3.1 Sound Power
The Sound Power is the total radiated acoustical energy in Watt. The Sound
Power Level ( WL ) is the Sound Power relative to a reference Sound Power level of 1
Pico Watt (Bruel & Kjaer, 2000). The sound output of a source is expressed in terms of
its sound power level ( WL ).
Wre
WLW log10 (2.1)
W represents the sound power of the source in watts. Wre
represent the reference sound
power defines as 10ˉ¹² watt (Bell, L.H. 1994; Bell, D.H. 1994). The sound power
standard is:
(i) No requirement for the measurement room
(ii) No requirement for the size of the source
(iii) No requirement for the shaped and size of the measurement surface
(iv) No requirement for background noise level
(v) Quality of the measurement is controlled by a number of field indicators
Sound power levels are useful for:
(i) Calculation of sound pressure levels around a machinein a specific
environments
(ii) Comparing the noise radiated by machines of the same type and size or
different types and sizes
(iii) Planning noise reduction treatments to reduce noise levels in the adjacent
environment produced by a machine.
(iv) Engineering design or development work to reduce noise radiated by a
particular machine.
6
2.3.2 Sound Intensity
Sound intensity, I is the acoustical power passing through a unit area. Unit for
sound intensity is W/m2. It can be representing as:
A
WI (2.2)
Where W represent the acoustical sound power of the source in watt. A represent the
surface area in meter square(m2). When sound is radiated from a point source into free
space, the acoustic power is evenly distributed over a sphere (Ostergaard, P.B. 2003).
Sound intensity is generally depends on distance from the source (Bell, L.H. 1994; Bell,
D.H. 1994). The advantages of the Sound Intensity are:
(i) Can measure in any room
(ii) Can identified noise source location
(iii) Can use for near and far field measurements
(iv) Eliminates stationary background noise source
(v) Partial sound power measurements
(vi) Physically correct method for determination of sound power
The useful of sound intensity is:
(i) Sound power determination
(ii) Noise source location
(iii) Building acoustics
(iv) Sound reduction work
2.4 CHARACTERISTICS OF SOUND
Sound is the quickly varying pressure wave traveling through a medium. When sound
travels through air, the atmospheric pressure varies periodically. There are two
important characteristics of sound. It is frequency and wavelength.
7
2.4.1 Wavelength and Frequency
The number of pressure variations per second is called the frequency of sound,
and is measured in Hertz (Hz) which is defined as cycles per second. The higher the
frequency, the more high-pitched a sound is perceived. The wavelength of sound wave
is use for determine the behaviour of sound wave. The wavelength is the distance
between peak to peak of the wave (Barron, R.F. 2003). The wavelength can be
described in term:
f
c (2.3)
Where represent the wavelength in meter, c represents the speed of sound in meter
per second and f represent the frequency in hertz (Barron, R.F. 2003). The value of
frequency can be calculated from:
tf
1 (2.4)
Where t represent the period to complete one cycle in second.
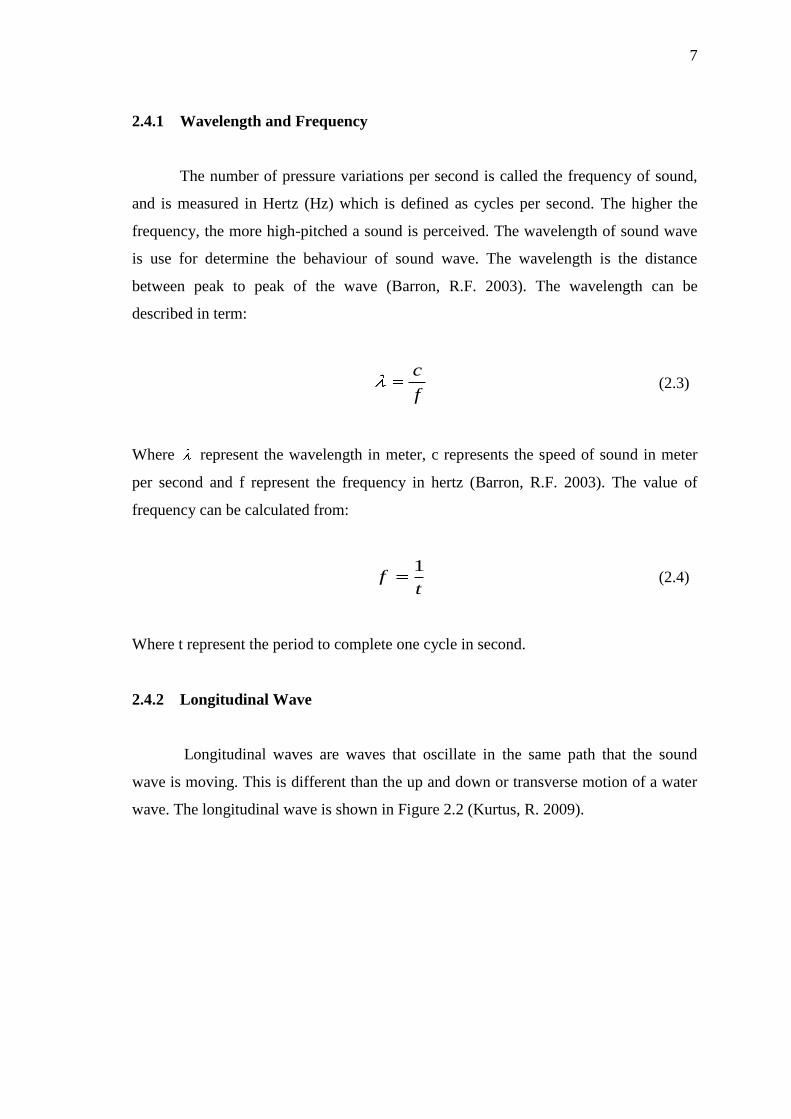
2.4.2 Longitudinal Wave
Longitudinal waves are waves that oscillate in the same path that the sound
wave is moving. This is different than the up and down or transverse motion of a water
wave. The longitudinal wave is shown in Figure 2.2 (Kurtus, R. 2009).
8
Figure 2.2: Longitudinal or compression wave for sound
Source: Kurtus, R. 2009
A sound wave has the same characteristics as any other type of waveform. It has
wavelength, frequency and amplitude.
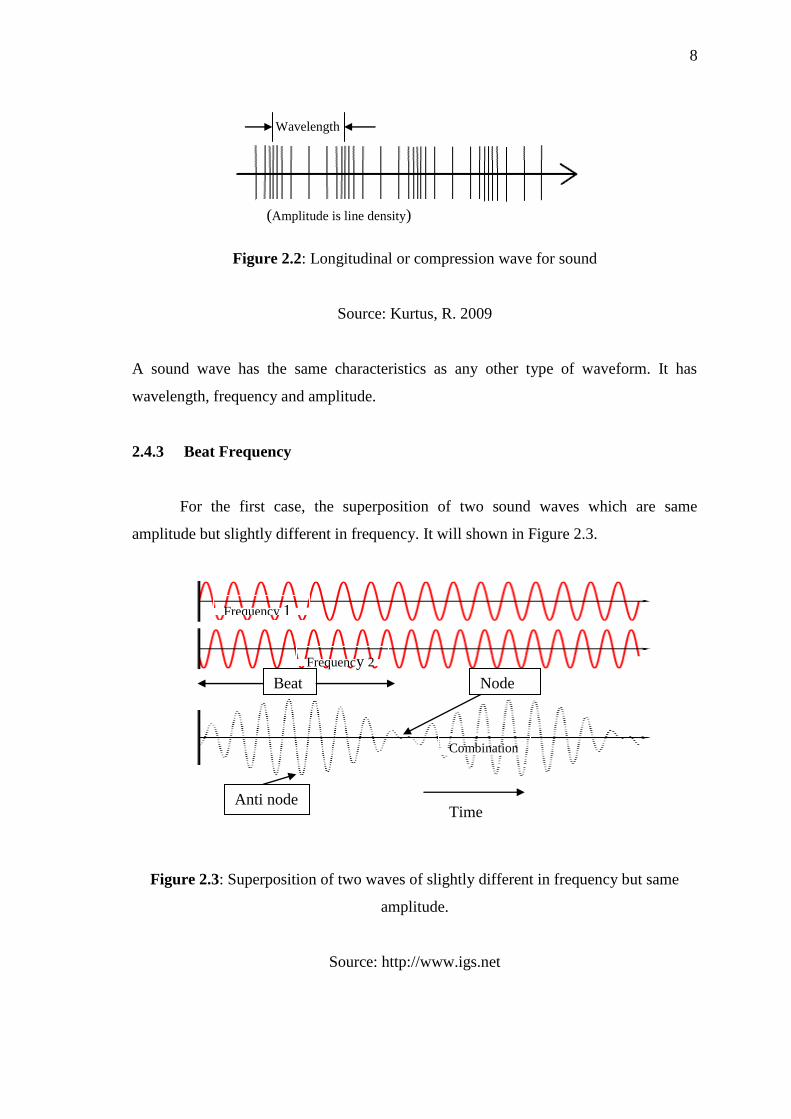
2.4.3 Beat Frequency
For the first case, the superposition of two sound waves which are same
amplitude but slightly different in frequency. It will shown in Figure 2.3.
Figure 2.3: Superposition of two waves of slightly different in frequency but same
amplitude.
Source: http://www.igs.net
Wavelength
(Amplitude is line density)
Frequency 1
Frequency 2
Combination
Time Anti node
Node Beat
9
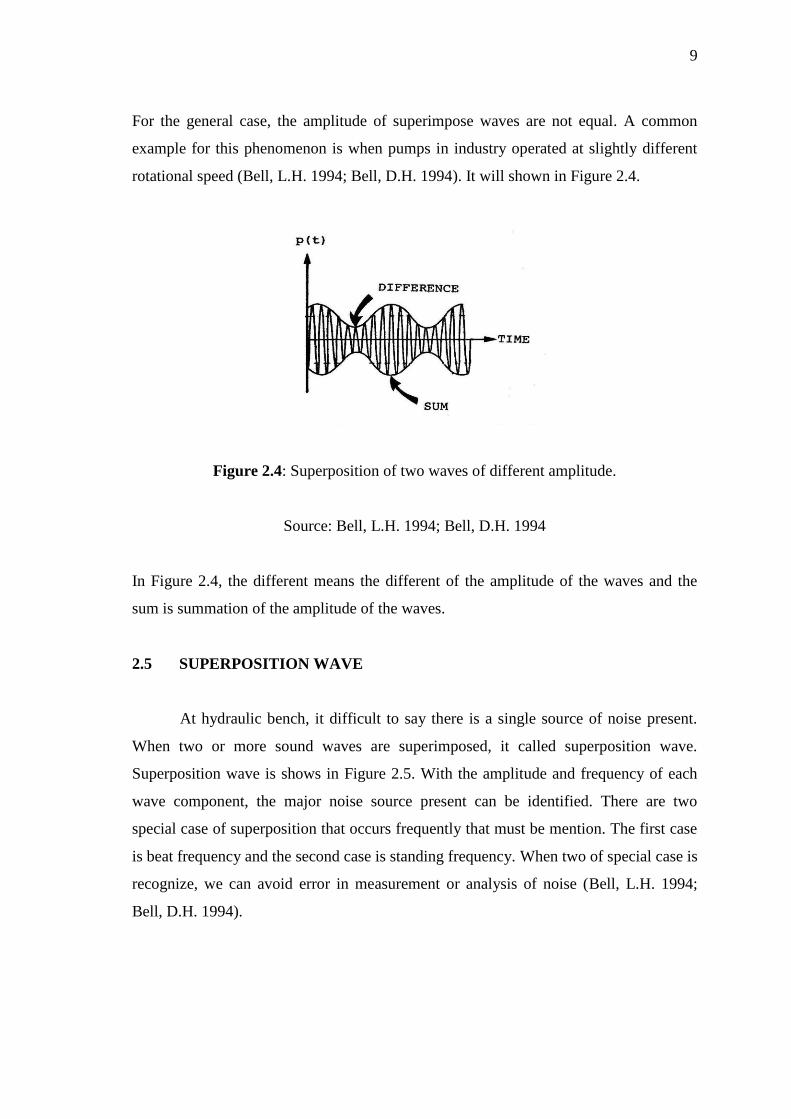
For the general case, the amplitude of superimpose waves are not equal. A common
example for this phenomenon is when pumps in industry operated at slightly different
rotational speed (Bell, L.H. 1994; Bell, D.H. 1994). It will shown in Figure 2.4.
Figure 2.4: Superposition of two waves of different amplitude.
Source: Bell, L.H. 1994; Bell, D.H. 1994
In Figure 2.4, the different means the different of the amplitude of the waves and the
sum is summation of the amplitude of the waves.
2.5 SUPERPOSITION WAVE
At hydraulic bench, it difficult to say there is a single source of noise present.
When two or more sound waves are superimposed, it called superposition wave.
Superposition wave is shows in Figure 2.5. With the amplitude and frequency of each
wave component, the major noise source present can be identified. There are two
special case of superposition that occurs frequently that must be mention. The first case
is beat frequency and the second case is standing frequency. When two of special case is
recognize, we can avoid error in measurement or analysis of noise (Bell, L.H. 1994;
Bell, D.H. 1994).