Embed Size (px)
Citation preview
Applied Energy 118 (2014) 100–113
Contents lists available at ScienceDirect
Applied Energy
journal homepage: www.elsevier .com/ locate/apenergy
Experimental study of the relationship between injection rate shapeand Diesel ignition using a novel piezo-actuated direct-acting injector
0306-2619/$ - see front matter � 2013 Elsevier Ltd. All rights reserved.http://dx.doi.org/10.1016/j.apenergy.2013.12.025
⇑ Corresponding author at: CMT Motores Térmicos, Universitat Politècnica deValència, Camino de Vera, Ed 6D, 46022, Valencia, Spain. Tel.: +34 963879658; fax:+34 961826236.
E-mail address: [email protected] (R. Payri).
Vicente Macian a, Raul Payri a,⇑, Santiago Ruiz a, Michele Bardi a, Alejandro H. Plazas b
a CMT- Motores Térmicos, Universitat Politècnica de València, Spainb GM R&D, Warren, MI, USA
h i g h l i g h t s
� The relationship between injection rate shape and ignition event is studied experimentally at real engine conditions.� Injection rate shaping affects significantly the premixed phase of the combustion.� A direct-acting injector prototype is tested in a high temperature/pressure chamber.� Simultaneous CH*/OH* chemiluminescence imaging is performed under a wide range of test conditions.
a r t i c l e i n f o
Article history:Received 24 September 2013Received in revised form 29 November 2013Accepted 16 December 2013Available online 8 January 2014
Keywords:Rate-shapingDirect-actingDiesel ignitionPartial needle-liftChemiluminescence
a b s t r a c t
Injection rate shaping is one of the most attractive alternatives to multiple injection strategies; however,its implementation has been for long time impeded by limitations in the injector technology and there-fore, the experimental information available in the literature about this topic is lacking.
In this work, a novel prototype common-rail injector featuring direct control of the nozzle needle bymeans of a piezo-stack (direct-acting) allowed a fully flexible control on the nozzle needle movementand enabled the implementation of alternative injection rate shapes typologies. This state of the art injec-tor, fitted with a 7-hole nozzle, was tested at real engine conditions studying the spatial-temporal evo-lution of CH* and OH* chemiluminescence intensity produced by the fuel combustion. A wide test matrixwas performed in an optically accessible hot-spray test rig to understand the influence that partial needlelift and alternative injection rate shapes have on the Diesel ignition
The results showed that alternative injection rate profiles have a substantial impact on the ignitionevent affecting the premixed phase of the combustion and the location where the ignition takes place.Moreover, the results proved that the modifications in the internal flow caused by the partial needle liftare reflected on the ignition timing: although partial needle lift and injection pressure have similar effectson the mass flow rate, in the first case, the ignition delay is reduced, while in the second, the combustionis delayed as a consequence of a different spray development.
� 2013 Elsevier Ltd. All rights reserved.
1. Introduction
Fuel-air mixing process, combustion and emission phenomenaare necessarily linked together in direct injection Diesel engines[1–5]. In a scenario where the global emission standards requirehigher engine performances in terms of combustion efficiencyand emissions reduction, all the efforts by the engine communityto improve the understanding of the fuel atomization, spray devel-opment and combustion are largely justified.
Over the past decades, many studies have been carried out todevelop a better understanding of the mixing process [6–8] andof the fuel ignition [9–12]. Experimental facilities, such as opticallyaccessible engines [13] and test rig cells [11,14] combined withimaging techniques [5,15], have become the most common toolsused in spray research. Throughout the years, the efforts put inplace in these studies generated an accurate and deep understand-ing of the injection combustion event in Diesel engines.
On the other hand, several activities have been performed to ad-vance the flexibility of the fuel injection system, achieving signifi-cant improvements [2]. Most of these systems are operated withelectro-hydraulic actuation, where the fuel injector is activatedusing either a solenoid or a piezo-stack; however, the opening ofthe injector itself is produced by the pressure difference at thetwo sides of the needle limiting the injection control to an on-off

Notation
Symbol DescriptionASOI after the start of the injection (ls)BP back pressure (MPa)Ch voltage level applied to the piezo-stack (charge) (–)CPF constant pressure Flow (–)D0 nominal diameterECN Engine Combustion Network (–)EGR exhaust gas recirculation (–)k-factor nozzle orifice conicity factor, defined as
k-factor ¼ 100 Di�D0L (–)
ICCD intensified CCD sensor (–)LOL lift-off length (mm)Mignition fuel mass injected at the moment of second stage
ignition (mg)O2% oxygen content (vol.) (%)OHpeak OH* chemiluminescence intensity peak (see Section
2.6.2) (a.u)
prail injection pressure (MPa)SoCH first-stage ignition delay (ls)SoOH second-stage ignition delay (ls)SSI second stage ignition (–)Tamb ambient temperature (K)thsOH intensity threshold for ignition delay (see Section 2.6.2)
(–)k parameter defined in Section 4.2 (–)kfoot parameter defined in Section 4.2 (–)qamb ambient density (kg m-3)_m average mass flow rate (g s�1)_mf :n:l: average mass flow rate at full needle lift (g s�1)_mfoot average mass flow rate at the first part of a boot shaped
injection(g s�1)
Table 1Injector features.
Injector features
Brand ContinentalNozzle seat type Micro-sacNumber of orifices 7Spray included angle 156�Outlet diameter 0.156 mmk-Factor* 1.5Discharge coefficient 0.81
* k-Factor definition is defined in [19].
V. Macian et al. / Applied Energy 118 (2014) 100–113 101
mode. As a consequence of that, multiple injection strategies arethe most employed tool to control the Diesel combustion, althoughthey show strong limitations in minimum dwell-time, and pooratomization during the opening/closing transient [1,3].
The last development of piezo-actuated injectors is the so calleddirect-acting system, where a piezo actuator (stack) is mechanicallycoupled with the injector needle, having direct control on its posi-tion: this technologic achievement enables a fast and precise con-trol of the fuel flow through the injector nozzle [16]. Althoughmany researches have been oriented to the study of the injectionevent using conventional servo-hydraulic injectors, only a feware discussing the effect of the partial needle lift on injection pro-cess [17,20,21] and, to the author knowledge, none of them hasbeen tested at real engine conditions.
In the present work, a prototype multi-hole injector featuringthe direct control of the nozzle needle by a piezo-stack, has beenused to investigate the effect of partial needle-lift and injectionrate shaping on Diesel combustion in a wide range of conditionstypical of a real Diesel engine varying rail pressure, ambient tem-perature and oxygen concentration.
The chemiluminescence signals emitted during the differentstages of the combustion have been studied using filtered intensi-fied cameras. In particular, the development of the cool flames hasbeen investigated imaging the emissions of the CH* radical (filter-ing at 430 nm) while for the second stage ignition the attention hasbeen focused on the OH* radical emissions (filtering at 310 nm)[10,13,18]. A novel optical accessible high temperature – high pres-sure test rig has been employed to mimic the real in-cylinder Die-sel-engine thermodynamic conditions [11]. The test rig wasmodified in order to enable variations in ambient oxygen concen-tration and to simulate EGR conditions.
The combustion of the 7 spray plumes produced by the multi-hole nozzle have been imaged globally using a large visualizationfield (�100 mm � 100 mm) centered on the injector nozzle, andthe relationship between CH* and OH* emissions has been carefullyinvestigated performing a simultaneous image with two synchro-nized ICCD cameras.
Finally, the images captured have been processed using a pur-pose-made Matlab routine, developed to present in comprehensivecolor-maps the data related to each test and to compare the timeevolution of the event under different test conditions. Finally, thecombustion-related characteristics parameters (e.g. ignition delayand location) have been measured and analyzed.
2. Material and methods
2.1. Injection system
The fuel supplied to the injector is provided by a common railsystem constituted by a high pressure pump and a conventionalrail with a pressure regulator. The system allows fuel injectionsat high and relatively constant pressure (up to 200 MPa). All theinjection system is electronically controlled by a ECU and all thesettings are introduced digitally.
The prototype piezoelectric direct-acting injector is fitted with a7-hole nozzle: the orifices are equally separated and oriented with156� opening angle; the orifice outlet diameter is D0 ¼ 156 lm andk-factor ¼ 1:5 [19]. All the nominal features of the injector arelisted in Table 1. In this study, the injector body temperature iscontrolled at 343 K [11], and commercial Diesel fuel (EU standardEN590) was used with 812 kg/m3 density and 1.9 mm2/s kinematicviscosity (at 343 K).
The injector used in the present work has the piezo-actuator di-rectly coupled with the injector needle and thus, the voltage ap-plied to the piezo-stack (in this work, also called charge or Ch)controls the needle position: the needle lift increases with the volt-age applied. Since it was not possible to measure the actual needlelift, a hydraulic characterization was performed to study the rela-tionship between mass flow rate and the voltage applied [17].Although an important and highly-repetitive reduction in the massflow rate is achieved by needle throttling (reducing the voltage orcharge applied), the relationship between mass flow rate andcharge is complex since other parameters, like injection pressureand injector temperature, are affecting the injector behavior.

102 V. Macian et al. / Applied Energy 118 (2014) 100–113
Therefore, in order to have a more quantitative description of theneedle lift, it was preferred to use the mass flow rate and thehydraulic parameters available from [17] for the same injector.The direct-acting injector features also a very rapid response ofthe needle movement with respect to the voltage applied: this factenables the possibility of performing injection rate shaping, that is,to inject fuel with variable mass flow rate (see Section 2.4).
The liquid- and vapor-phase penetration of the same injectorhave been characterized in previous works [20,21] and it was high-lighted an important relationship between needle-lift and sprayspreading angle (and consequently liquid length): in particular,when the needle is throttling the fuel flow, liquid length is reducedand spreading angle is increased, as possible effects of changes inthe nozzle internal flow behavior.
2.2. The facility
A novel optically accessible test chamber, capable of simulatingthe in-cylinder thermo-dynamic conditions of Diesel engines at thetime of injection, was used. Following the convention presented in[22], the test rig is classified as a constant-pressure flow (CPF) facil-ity: the high-pressure high-temperature gas (an adjustable mix-ture of atmospheric air and nitrogen depending on the specificcondition tested) enters the chamber from a 30 kW electric heatingsystem and continuously flows through the test section, obtainingtypical Diesel in-cylinder conditions. Compared to other facilities[24,28], this test rig has the unique feature of obtaining nearly qui-escent and steady thermo-dynamic conditions within the chamber,providing thus high repeatability and an important reduction inthe time required for the tests.
The facility is basically composed of four parts: compressors,heaters, test vessel and control system (Fig. 1 left). The gas, storedby volumetric compressors in high pressure reservoirs, flows con-tinuously through the test chamber. The temperature and pressurewithin the test chamber are set to the desired values respectivelyadjusting the power of the electrical heaters and the setpoint ofthe pressure regulator placed upstream of the chamber. The regu-lation is performed automatically by a closed loop PID system.
The test rig can work in open or close loop in order to test eitherwith air or air/nitrogen mixtures: the chemical composition of thegas in the chamber is permanently monitored by a Horiba systemand can be adjusted adding either air or Nitrogen through a reinte-gration system. In this way, the recirculation of exhaust gas (EGR)can be simulated by decreasing the oxygen content of the charge inthe test chamber [24].
The big total volume of the high pressure gas tanks, pipe linesand combustion chamber, guaranteed a negligible increase inH2O content and other combustion products along the test session.
Fig. 1. Test rig. Left: global scheme of the facility. Right: scheme of the test chamb
The gas-flow through the test chamber has been optimized inorder to obtain the best compromise in terms of temperaturehomogeneity, exhaust (or fuel vapor) scavenging and spray-gasinteraction (Fig. 1 right). To improve the temperature homogeneitywithin the chamber the velocities of the gas have to be high in or-der to limit the wall boundary layer and maintain the whole testsection at high temperature. On the other hand, to study the sprayin free-field-like conditions, the velocities have to be low and, toease the exhaust scavenging, the flow has to be organized. InFig. 1 right, a sketch of the chamber is shown: the gas inlet is a re-verse-cone diffuser placed in the bottom; due to their lower den-sity and the inertia, the gas from the inlet goes toward the upperpart of the chamber; then, due to the heat exchange with the sur-rounding walls, the gas gets cold and it is forced to move towardthe only available outlets, which are placed close to the walls inthe bottom of the chamber. The position of the outlets in the bot-tom of the chamber improves heating efficiency, since extracts thegas in a position where they are relatively colder. The completedescription of the facility is provided in [11,20].
2.3. Methodology and optical arrangement
Chemiluminescence is a chemical phenomenon consisting in alight emission due to the decay of a molecule from an excited stateto a lower energy level. OH* and CH* decay to ground state radicalshave a well-defined chemiluminescence spectrum that permitsidentifying the emitting molecule [18,23].
Dec and Espey [23] showed that CH* is an excellent marker forthe characterization of the first phase of Diesel combustion. Its tim-ing and location can give valuable information on Diesel coolflames development and in their experiments, CH* chemilumines-cence appeared to be the fair witness of auto-ignition. The naturalemission of light of the CH* radicals (432 nm) has been studiedusing the methodology described in [23]. The combustion processensues with fuel breakdown following the first significant heat re-lease and an eventual first soot formation occurring on the peak ofpremixed flame. This chemiluminescence lasts in rich areas of thejet during the whole combustion event but it is soon hidden by thisearly soot radiation that is about three orders of magnitude bright-er. The methodology used in this work, proposed by Dec and Espeyin [23] and followed by many other authors [11,13] takes its standon the acquisition of filtered images (at 430 ± 5 nm) with an inten-sified camera.
Studies in the literature related high-temperature Diesel reac-tions to the formation of OH* radicals and showed that OH* formsin nearly stoichiometric regions [9,25]; the start of these reactionsare related to the first significant heat release and, for this reason,the OH* formation is normally studied to determine the ignition
er. The gas inlet and outlet together with the injector position are indicated.

Fig. 2. Optical arrangement. Scheme and details of the optical set-up and the synchronization system.
Table 2Test matrix.
Parameters Values Unit
Fuel Commercial Diesel –Injected fuel mass 50 mgCoolant temperature (Tf) 343 KGas pressure (BP) 2.0–3.5–5.0–6.5 MPaGas temperature (Tamb) 870–935 KInjection pressure (prail) 60–150 MPaPiezo-stack charge (Ch) Low–med–high –Injection rate shape Square–boot–ramp –O2 concentration (O2%) 12–16–21 % (vol.)
V. Macian et al. / Applied Energy 118 (2014) 100–113 103
delay [9,13]. Gaydon demonstrated that the spectrum emitted byOH* decay has an important peak at 306 nm [18]. Therefore, OH*
emissions can be observed using 310 ± 5 nm interferometric filterthat guarantees to exclude nearly the totality of the soot incandes-cence emissions dominating the spectrum at higher wavelengths,combined with an acquisition system efficient in this part of thespectrum (ICCD camera and U.V. lens) [13,14].
To image CH* and OH* radicals’ chemiluminescence two ICCDcameras have been employed simultaneously: hereafter, the cam-eras will be referred as CH camera, the camera devoted to imagethe CH* emission and OH camera the other one. The details of theconfigurations are described in Fig. 2 and its related table.
A delay generator has been used for the camerasynchronization:
� to compensate the different internal delay of the cameras,acquiring the two images simultaneously;� to acquire images at different instants from the start of injec-
tion, performing a time sweep along the injection event (stillimaging).
The time step used to increase the delay setting of the delaygenerator was adjusted to improve the time resolution of the testswhen it was considered convenient. During the ignition phase,time steps as short as 20 ls were employed while during the diffu-sive flame the time steps were increased with a maximum of200 ls. The intensifier gating time was fixed for the two camerasat 20 ls to improve the accuracy of the data in the time domain
and five test repetitions for each instant were performed to aver-age the statistic shot-to-shot variation and to have an understand-ing of the precision (repeatability) of the tests.
The low emissions of the CH* radical together with the need ofcatching the very beginning of the cool flames have made light effi-ciency a primary issue. For this reason the two cameras were posi-tioned to visualizing directly the combustion, avoiding the use of abeam splitter or a chromatic mirror that would reduce the lightefficiency of the system. Therefore, a small angle had to be in-cluded between the camera’s and the injector’s axes (Fig. 2) requir-ing a geometrical correction of the images that has been includedin the image processing. In order to make sure to capture the firstradical emissions, cameras’ intensifiers gain were set to theirmaximum.

104 V. Macian et al. / Applied Energy 118 (2014) 100–113
As mentioned before, after second stage ignition, soot incandes-cence generally leads the CH* camera sensor to saturation: beingthe signal acquired not related to CH* chemiluminescence any-more, the acquisition of the CH camera was stopped to avoid over-charging the intensifier. Due to the shorter wave length recordedby the OH camera, the overlap of the signal filtered and soot incan-descence is limited [18] allowing to study the OH* chemilumines-cence during the whole injection event.
2.4. Test matrix
The main objective of the test plan (Table 2) is to investigate thepotentialities of injection rate shaping understanding its impact onthe combustion event. In order to obtain reliable results, a compar-ison between different injection typologies was replicated underdifferent thermodynamic conditions typical of a real Diesel engine.For each ambient condition (oxygen content, ambient temperatureand ambient density), the test was repeated modifying injectionpressure, needle lift and injection rate shape.
The tests at 21% oxygen concentration were performed usingatmospheric air, while exhaust gas recirculation (EGR) was simu-lated closing the gas-circuit and recirculating the gases (Fig. 1);either nitrogen or air were added to the system in order to reachthe desired oxygen concentration (O2% = 12–16%). Ambient tem-perature and pressure were controlled directly by a closed loopPID (see Section 2.2), while the ambient density was derived usingPeng–Robinson equations [26].
The injected mass was fixed at 50 mg adjusting the total ener-gizing time, in order to limit the pressure wave within the testchamber; however, injections were long enough to assure the igni-tion to happen before the end of the injection at all the conditionstested, excluding the effect of the closing transient from the study.
In this work, the boundary conditions will be divided in twogroups: ambient parameters, referring to the conditions withinthe chamber (ambient density, ambient temperature and oxygenconcentration) and injection parameters referring to the settingsof the injection system (rail pressure, piezo-stack charge and injec-tion rate shape).
Even if the needle lift is controlled adjusting the piezo-stackvoltage (charge) [17], its position could not be measured experi-mentally and the relationship between charge applied and needleposition involves also other quantities (like injection pressureand piezo-stack temperature). Therefore, the three charges testedare qualitatively referred as low, med and high charge. High chargecorresponds to the full needle lift case, that is, when injector needle
Fig. 3. Injection rate shape typologies. Mass flow rate measurement for different injectioand prail = 150 MPa (right).
effect on fuel flow is considered to be negligible; at med and lowcharge the needle lift is progressively reduced, and, consequently,the related mass flow rate. A quantitative description of the differ-ent charge levels will be performed basing on the measured massflow rate (see Section 4.2).
In order to understand the effect of rate shaping on Diesel com-bustion, three different injection rate profiles have been tested (de-picted in Fig. 3): square (conventional top-hat injection), boot andramp injections. The related mass flow rate profiles were measuredvia Bosch method [17] and are presented in Fig. 3 for two differentinjection pressures.
In order to avoid confusion, in this work, if not specified, the re-sults presented are related to square shaped injections at highcharge: when either the injection rate shape or the charge level isvaried, it will be always indicated.
2.5. Raw images description
Figs. 4 and 5 present the image-sequences recorded by the twocameras for a sample test condition in order to give an overalldescription of the features captured in the measurements, as wellas to point out the technical approach to the results analysis.
CH* emissions arise earlier and are evenly distributed in thesprays region. The shape of the area where CH* chemiluminescenceis observed recalls the shape of the sprays, and, as observed byother authors, it overlaps the regions where fuel is vaporized[13,23]. However, the CH* intensity is very low and it is right abovethe camera sensor noise level. The CH* chemiluminescence inten-sity increases progressively up to the second stage ignition (SSI),when intensity suddenly rises of about three order of magnitude;afterward, it is not possible to relate the signal recorded withCH* emissions anymore, because they are disguised by broadbandhigh temperature chemiluminescence and soot incandescence[23].
On the other hand, the onset of OH* radicals shows different fea-tures: the OH* emissions start growing from separated nuclei andthe intensity of the signal rises sharply and stabilizes at a certainlevel. The nuclei are observed at the same time and in the sameareas where the CH camera detects the abrupt increase in theintensity confirming OH* chemiluminescence as a good markerfor high temperature reactions but also the broad spectrum ofthe light emissions arising after the SSI [18]. Finally, the diffusivephase of the flame take place and the flame front stabilizes at a cer-tain distance from the nozzle outlet (lift of length or LOL) [9].
n rate shapes: square (Ch = high), boot and ramp type injections at prail = 60 MPa (left)

Fig. 4. CH* and OH* formation. Time-sequence of images captured simultaneouslyby the two intensified cameras. O2% = 16%, Tamb = 935 K, BP = 5 MPa, prail = 60 MPa,Ch = high. The injector nozzle is indicated by a white spot.
Fig. 5. CH* and OH* formation. Time-sequence of images captured simultaneouslyby the two intensified cameras. Square, O2% = 16%, prail = 60 MPa, Tamb = 935 K,Ch = high. The injector nozzle is indicated by a white spot.
Fig. 6. Steps to obtain the contour maps. Sectors delimitation (left) and Max. Arc.Int. for the sector indicated by the arrow (right). The light color lines represent thesingle-shot profiles while the solid lines indicate the average over the repetitions.
V. Macian et al. / Applied Energy 118 (2014) 100–113 105
The camera intensifier tends to increase its noise level when thesignal intensity gets stronger: in the images presented in Figs. 4and 5 the combustion causes an increment of the noise level inthe entire image. The same effect is caused by the backgroundreflections that, in the same way, falsely increase the signal insome areas of the images. This fact has to be taken into accountto understand correctly the results and to avoid wrong interpreta-tion of the data.
2.6. Data processing
Due to the number of conditions tested and the amount ofinformation contained in each single image, it is necessary to de-velop a processing technique capable of condensing the informa-tion and simplifying the analysis of the results. In the followingsection, the approach used and the variables introduced in the dataanalysis are described.
2.6.1. Contour mapsThree-variables plots have been created by drawing contour
maps on time – radial position axes. This graphic illustration ofthe results consists in the simultaneous presentation of the inten-sity recorded (color map) together with the radial position (Y-axis)and temporal data (X-axis), so that an entire image sequence can bepresented on a single plot.
The intensity contour maps are obtained following a well-de-fined procedure:
� Average filter: in order to reduce the noise caused by the cameraintensifier a mean-filter (8 � 8 pixels) is applied to the rawimage.
� Sectorization: the spray-sectors are delimited (Fig. 6 left) andanalyzed separately;� Arc maximum intensity profile: a radial intensity profile is
obtained for each spray sector seeking the pixel with the high-est intensity (counts number) at each radial position (Fig. 6right);� Repetition average: the intensity profiles obtained (one per
spray) are averaged over the 5 repetitions (Fig. 6 right), obtain-ing a characteristic profile per spray per time step;

Fig. 8. OH* Max. Int. versus time for the different conditions tested. Each linecorresponds to a different test condition. Different oxygen concentration andtemperature are shifted on the x-axis to separate the different groups and show thedifferent behaviors.
106 V. Macian et al. / Applied Energy 118 (2014) 100–113
� Spray average: the intensity profiles obtained by the differentsprays are averaged and one characteristic average intensityprofile is obtained for each time step (Max. Arc. Int.);� Contour map: the Max. Arc. Int. obtained for each time step are
put together in a single contour map indicating in color the finalaverage radial intensity, on X-axis time after the start of theinjection (ASOI) and Y-axis the radial position (Fig. 7).
Due to the time-costing image acquisition method, the imagesare acquired starting right before the ignition until the end of injec-tion: the time domain of the acquisition period is represented onthe contour maps by vertical black lines (Fig. 7).
2.6.2. SoCH, SoCH and OHpeak
The first- and the second-stage ignition have been defined bas-ing on the appearance of respectively CH* and OH* radicals. Due tothe very low intensity of the CH* chemiluminescence, the fisrt-stage ignition, named in this work start of CH* or SoCH has been de-fined as the first instant at which the signal recorded is above thesensor noise level. On the other hand, the start of OH* signal (SoOH)has been defined following the observations by Lillo et al. [27] andthe guidelines from the Engine Combustion Network (ECN) [28].SoOH is representative of the second-stage ignition and it corre-sponds to the parameter that in other studies is indicated asignition delay [11,13].
A criterion based on the intensity time evolution during thecombustion is adopted: in Fig. 8 the parameter Max. Int. (that isthe maximum of the Max. Arc. Int. for each instant) obtained forall the tests performed are presented on the same plot: the time-axis for each case is shifted arbitrarily in order separate thedifferent groups. The plot shows clearly that the curves are always
Fig. 7. Steps to obtain the contour maps. Comparison between contour maps and raw imthe camera acquisition period.
characterized by a steep increase followed by a peak and then, anearly-steady period. Even if oxygen concentration is the main dri-ver for the value of this peak in OH* chemiluminescence intensity(OHpeak), other authors showed that it is related also to otherboundary conditions and it is representative of the premixed phaseof the Diesel combustion [29].
In order to obtain coherent results, the differences in peakintensity observed have been taken into account calculating a spe-cific threshold for each test condition and using as a reference theintensity at the peak (OHpeak). Finally, the threshold used for SoOHcalculation, thsOH is defined as
ages. The vertical black lines on the contour map represent the start and the end of

V. Macian et al. / Applied Energy 118 (2014) 100–113 107
thsOH ¼OHpeak
2ð1Þ
Summarizing, for a datum test condition the following defini-tions are given:
� First-stage ignition delay (SoCH): instant at which the firstdetectable CH* chemiluminescence signal is recorded.� OHpeak: OH* chemiluminescence intensity peak value reached
right after the OH* signal appearance.� Second-stage ignition delay (SoOH): instant at which the
variable Max. Int. exceeds thsOH.� MOH: fuel mass injected before the SoOH and thus a central
parameter for the premixed phase of the combustion. Thisparameter is derived crossing the data from mass flow ratemeasurement and SoOH.
Moreover the radial distance corresponding to the OHpeak hasbeen determined to complete the information of the ignition event.
3. Results
The results’ session is divided into two main parts: the first, pre-senting the relationship between the ignition event and the ambi-ent parameters, and the second studying the effect of the injectionparameters with special focus on the unique features of the di-rect-acting injector and evaluating its capabilities of controllingthe fuel ignition.
3.1. Effect of ambient conditions
As described earlier, the images obtained in the tests have beenre-elaborated and condensed into maps relating the intensity ofthe radiation obtained in the images with the time ASOI and its ra-dial position. Liquid and vapor phase penetration data of the testedinjector are available from previous test campaigns [20,21] and areplotted on the contour maps: these data are a valuable referencefor a global understanding of the results. The test matrix studiedin liquid and vapor phase measurement campaigns is identical to
Fig. 9. Effect of oxygen concentration. Contours maps for CH* (left) and OH* (right) chemvapor-phase penetration are indicated respectively by the dashed and solid lines. Tamb =
the one tested in this work except for temperature and ambientgas composition:
� the tests were performed at Tamb = 870 and 950 K (in this studyTamb = 870 and 935 K); therefore, the cases tested in this work atTamb = 935 K will be compared to the data of the former exper-iments at Tamb = 950 K being the most similar temperature;� the injection were performed in nitrogen atmosphere in order
to prevent the combustion.
However, the bias introduced in the data by the differencesmentioned above is considered negligible, especially for the pur-pose of this comparison.
In Fig. 9, CH* and OH* chemiluminescence contour-maps ob-tained at different oxygen concentration are presented. The differ-ences between the CH* and OH* chemiluminescence onsetdescribed in Section 2.5 is confirmed: CH* emissions appearssmoothly (note the color scale on the left) and distributed over awide region starting close to the spray tip. Even if the backgroundreflections combined with the intensifier noise (see Section 2.5)avoids an accurate detection of the boundaries of the chemilumi-nescence emission region, the map highlights a relationship be-tween the CH* emissions and the region included between thevapor and the liquid phase penetration; on the other hand, theOH* chemiluminescence appears later, and the transition of the sig-nal intensity from its appearance to its maximum is faster. Ambi-ent oxygen contempt has a different impact on the OH* and CH*
development: reminding that CH* measurement can be related tothis radical only before the onset of high temperature reactions(OH* apparition), the timing and the position of its detection isbarely affected by the oxygen concentration; differently, passingfrom 12% to 21% oxygen concentration causes a faster apparitionof the OH* radicals and moves the reaction region closer to the noz-zle tip; Moreover a higher oxygen concentration causes an impor-tant increase in the OH* chemiluminescence intensity.
Fig. 10 shows the impact of the ambient temperature on the mea-sured variables. As in the previous case CH* chemiluminescence ap-pears close to the spray tip, while OH* signal appears well behind thevapor penetration boundary. A reduction in the ambient tempera-ture delays the apparition of OH* radicals but in this case (differently
iluminescence emissions at different oxygen concentration. The related liquid- and935 K, BP = 5 MPa, prail = 60 MPa, Ch = high.

Fig. 10. Effect of Tamb. Contours maps for CH* (left) and OH* (right) chemiluminescence emissions at different ambient temperatures. The related liquid- and vapor-phasepenetration are indicated respectively by the dashed and solid lines. O2% = 16%, BP = 5 MPa, prail = 60 MPa, Ch = high.
Fig. 11. Effect of prail and Ch. Contours maps for CH* (left) and OH* (right) chemiluminescence emissions at different injection conditions. The related liquid- and vapor-phasepenetration are indicated respectively by the dashed and solid lines. O2% = 16%, Tamb = 935 K, BP = 5 MPa.
108 V. Macian et al. / Applied Energy 118 (2014) 100–113
from the effect of oxygen concentration) the CH* chemilumines-cence apparition is delayed in a similar way. No significant changesare observed in the intensity of both chemiluminescence signals. Thecolor-maps presented in Fig. 10 show also another important fea-ture: right after its first apparition the OH* chemiluminescenceshows a local maximum in the intensity. This feature observed alsoby other authors [10,11] is related to the premixed phase of combus-tion: the location and the magnitude of this local maximum in thenext sections will be related to the test conditions.
3.2. Effect of injection parameters
The dependence of the ignition process on the injection param-eters has been studied focusing on two points:
� the comparison of the effect of a reduction in mass flow rate dueto a reduction in prail and a reduction in mass flow rate due tothe partial needle lift (needle throttling);� the effect of a modification of the mass flow rate in the first part
of the injection fixing the final mass flow rate performing rateshaping.
In the first comparison, a reduction in mass flow rate from a ref-erence test condition (prail = 150 MPa, Ch = high, Fig. 11-top) hasbeen obtained in two different ways: the first reducing the injec-tion pressure, maintaining the maximum needle lift (prail = 60 MPa,Ch = high, Fig. 11-middle) and the second reducing the needle liftbut maintaining the injection pressure (prail = 150 MPa, Ch = low,Fig. 11-bottom). The comparison shows that the main effect onthe measured variables of a decrease in mass flow rate is reductionof the radial position of the emissions. The CH* emissions, as dis-cussed before, are strongly related to the spray penetration, thatdepends on spray momentum and then mass flow rate [30,31].However, the radial position of the first CH* detection is similarin the three cases compared, while the first OH* detection movesfarther from the nozzle tip when the mass flow rate is increased.The gas-jet theory [32,33] can offer a path to understand this phe-nomenon: following this interpretation of the Diesel spray a mod-ification in the mass flow rate does not affect the spatial domain ofthe mixing field, but it only contracts or dilates the time scale; inother words, even changing the mass flow rate, at a datum spraypenetration the mixing field is identical (this is true if the spread-ing angle is not changing, but at this degree of approximation, it

Fig. 12. Effect of injection rate shape. Contours maps for CH* (left) and OH* (right) chemiluminescence emissions at different injection conditions. The related liquid- andvapor-phase penetration are indicated respectively by the dashed and solid lines. O2% = 16%, Tamb = 935 K, BP = 5 MPa, prail = 60 MPa.
V. Macian et al. / Applied Energy 118 (2014) 100–113 109
can be considered constant). The fact that the CH* radicals locationis not affected by injection parameters links this measurement tothe mixing field. On the other hand, OH* chemiluminescence hasto be intended as the final stage of the pre-reactions: the timeneeded for the pre-reactions to be completed mainly depends onthe chemical/physical condition of the mixture: this lapse of time,approximately constant for the different injection cases shown inFig. 11, causes a farther location of the ignition for spray penetrat-ing faster (at higher mass flow rate).
In the following comparison the injection rate shape has beenmodified changing the mass flow rate during the first part of theinjection but reaching the same level during the final stage. The re-lated injection rate profiles have been presented in Fig. 3. Apart ofthe modification in the liquid and vapor phase penetration associ-ated with the injection rate shaping and already described in[20,21] the main differences caused by the alternative injectionrate shapes concern the location and the intensity of the peak inthe OH* emissions observed at the ignition (see Fig. 12).
Therefore, this feature on the contour map suggests that injec-tion rate shaping affects the premixed phase of the combustion:this phase is very important since it is responsible for the peak inthe rate of heat release normally observed at the ignition thatcauses the typical Diesel engine noise problems, and the formationof NOx [3,4]. The reduction of the intensity peak observed is anencouraging insight of the effectiveness of these injectionstrategies.
In the next section, the data showed in the color maps will besummarized in some key parameters, enabling the presentationof a global picture of the results.
4. Discussion
The results presented in the previous section helped under-standing the details of the modifications taking place in the igni-tion process when a single test condition was modified. However,the contour-maps are effective to compare only a limited numberof cases. In this section, the parameters describing the salient fea-tures of the contour maps are presented in order to observe theglobal trends of the results. Due to the huge amount of information
gathered in the tests, this section will focus only on the most sig-nificant parameters obtained.
4.1. Effect of ambient parameters
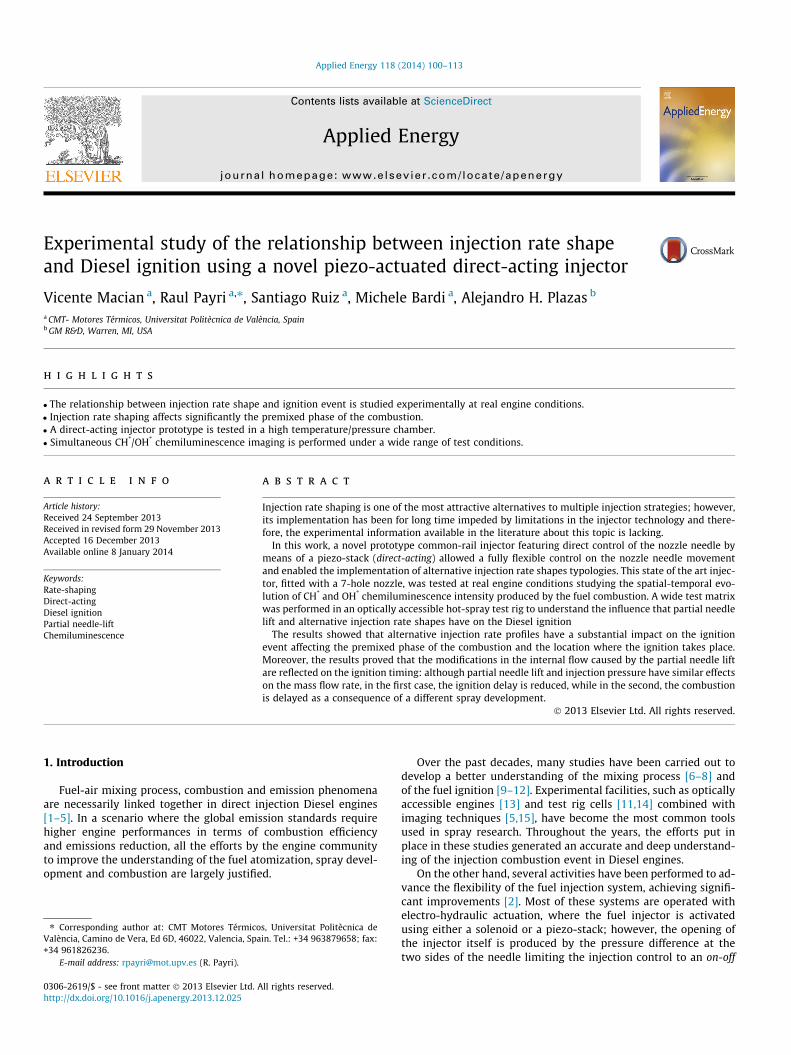
The first parameters of interest are SoCH and SoOH which, aspreviously discussed, are representative of the time at which,respectively, first- and second-stage ignition begin. The plots pre-sented in Fig. 13 show and relate with them the effect that O2%,Tamb, and BP fixing the injection parameters. The comparison con-firms and extends the observations done before:
� an increase in ambient temperature and backpressure causes anincrease equally in SoCH and as in SoOH;� oxygen concentration affects mainly SoOH while it has a only
second order effect on SoCH.
The dwell time between SoCH and SoOH in Fig. 14 is coherentwith the previous observations but offers a different point ofview: O2% and BP are the main drivers for this parameter whilea variation in ambient temperature appears to have only a secondorder effect. These observations are deeply related to the physicaland chemical processes taking place in the Diesel spray and are inaccordance with what found in other works [10,29]. The resultspresented achieve two goals: (i) confirms what found in otherworks adding new information related to the specific conditionstested; (ii) proves the reliability of the techniques employedand gives a further support to the evaluation of the direct-actinginjector capabilities, that is the main objective of the presentwork.
4.2. Effect of injection parameters
In this section, the most important findings of this work con-cerning the effect of injection parameters on the ignition processare presented.
In order to compensate the lack of quantitative informationabout the needle lift, following the approach used in [20], thenon-dimensional parameter k has been introduced to quantifythe throttling effect of the needle:
Fig. 13. SoCH and SoOH at different test conditions. On the left plot the data are plotted versus ambient temperature at fixed back pressure (BP = 5 MPa) while in the rightplot the ambient temperature and the oxygen content are fixed (O2% = 21%, Tamb = 935 K). In all the cases the same injection has been tested: prail = 60 MPa, Ch = high.
Fig. 14. SoCH/SoOH dwell time at different test conditions. On the left plot the data are plotted versus ambient temperature at fixed back pressure (BP = 5 MPa) while in theright plot the ambient temperature and the oxygen content are fixed (O2% = 21%, Tamb = 935 K). In all the cases the same injection parameters have been kept: prail = 60 MPa,Ch = high.
Fig. 15. SoOH at different test conditions. Each plot presents the effect of the injection parameters at different ambient conditions. BP = 5 MPa.
110 V. Macian et al. / Applied Energy 118 (2014) 100–113
k ¼_m
_mf :n:l:ð2Þ
where _m is the average mass flow rate for a specific charge level and_mf :n:l: is the average mass flow rate at same injection pressure but at
full needle lift (high charge level). For the boot shaped injection thesame parameter has been similarly defined as
k ¼_mfoot
_mf :n:l:ð3Þ
where _mfoot is the average mass flow rate during the first part of aboot shaped injection, the so called foot.
This parameter is used to compare the conventional injectionsat different charge levels together with the boot type injection con-sidering that in most of the cases ignition delays are lower than1 ms, that means that the ignition is related only to the foot partof the injection; the results related to the ramp shaped injection,will be included on the same plot for reference, with an indicationon the x-axis.

V. Macian et al. / Applied Energy 118 (2014) 100–113 111
The effect of injection parameter on SoOH (Fig. 15) is limited,and the variations observed fall within the limit of the experimen-tal accuracy. However, in the conventional square injections someslight trends can be captured:
� injection pressure tends to reduce the SoOH due to his enhanc-ing effect on the mixing process; this effect has already beenobserved in other works [23,29,34];� the needle fuel throttling shows a small effect in reducing the
SoOH.
Even if this second effect is small, it is interesting to underlinethat this effect can be explained only assuming that reducing theneedle lift the spray development is modified. In fact, if the spraydevelopment at the different needle lifts was the same, the effectof the fuel throttling should be similar to the effect of a reductionin the injection pressure and therefore the SoOH should be longerat lower values of k. However, the trend observed is the opposite.This fact can be explained by the observations presented in theprevious studies carried out on this injector [17,20,21]: in thisworks it has been observed that the fuel throttling operated bythe nozzle needle has consequences on the fuel flow through theorifices that are eventually reflected on the spray development asan increase of the spray spreading angle. Indeed, the increase inthe spreading angle enhances the mixing process and it is in accor-dance to the reduction in the SoOH observed.
Another interesting feature appearing in the contour maps isthe peak in the intensity that has been observed right after the sec-ond stage ignition. As mentioned in Section 3.1, this characteristicis linked to the premixed phase of the Diesel combustion and injec-tion parameters that control the amount ignitable mixture formedat the moment of the ignition. The measurement of the OHpeak ismeaningful only in the case that the premixed combustion takesplace entirely in the field of view: analyzing the images of the testsit has been observed that for some combination of test conditions(e.g. Tamb = 870 K and prail = 150 MPa) the premixed combustionwas partially out of the field of view, and the results related tothese tests were not reliable. For this reason they have not been in-cluded in the plot below.
The results in Fig. 16 confirmed that a reduction in the massflow rate (either by reducing the injection pressure or by partialneedle lift) causes a reduction in OHpeak. Moreover, it is importantto observe that for all the ambient conditions presented in the plot,the lowest OHpeak is achieved using the non-conventional injectionrate shapes (boot and ramp). Therefore, profiling the mass flow ratereducing the fuel flow before the ignition has interesting
Fig. 16. OHpeak at different test conditions. Each plot presents the effect of
consequences on the ignition event. This observation is also sus-tained by the calculation of the mass injected at the moment ofthe ignition (Mignition): this parameter, obtained comparing theSoOH with the mass flow rate measurements performed in [17],shows the same behavior of OHpeak and therefore confirms the rela-tionship between OHpeak and the premixed combustion (Fig. 17).
Summarizing, the analysis of SoOH, OHpeak and Mignition revealsthat none of the injection parameters has substantial effects on theignition timing (SoOH); on the other hand, the analysis of OHpeak
and Mignition suggests that the introduction of injection rate shapinghelps reducing the amount of heat released during the premixedphase; many studies showed that reducing the fuel burnt duringthis phase of the combustion brings benefits in terms of reductionof the combustion noise and NOx production [2,3].
Another fundamental measurement when evaluating the Die-sel ignition is the radial location where the ignition takes place: infact, in a real engine the location of the ignition can determineradical changes in the thermodynamic conditions of the mixture,especially when it occurs in the proximity of the piston bowl. Inthis case, even if the fuel sprays are injected in free field condi-tions (the test chamber is big compared to the spray), this param-eter helps investigating the combustion-control capabilities ofthese injection typologies. The radial distance of the ignition loca-tion increases with the mass flow rate (Fig. 18): either a decreasein injection pressure or in piezo-stack charge causes the fuel toignite closer to the injector tip; however, the most significant im-pact on the ignition location is achieved with the alternativeinjection rate profile, allowing a substantial reduction in the ra-dial ignition location without modifying neither the injectionpressure nor the mass flow rate at the end of the injection. Thisfact is particularly important for the typical low load engine con-ditions (i.e. low ambient density/temperature/oxygen content)where ignition takes place far from the injection nozzle and theinteraction with the piston bowl becomes an issue (i.e. wallimpingement, quenching). Again, injection rate shaping showedpromising results as regards as capabilities in the control of thecombustion event.
As commented for the previous graphics, modifying either theinjection pressure or the needle lift has similar effect on the massflow rate, and this effect is evenly reflected on the OHpeak and itslocation. However, it has been demonstrated [20,21] that the fuelthrottling operated when the needle lift is reduced (low values ofk), the spray development is modified enhancing the mixing pro-cess. SoOH results confirmed these observations even if the differ-ences observed fall in the range of the measurement uncertainties.Fig. 19 compares the Mignition and OHpeak radial position data,
the injection parameters at different ambient conditions. BP = 5 MPa.

Fig. 17. Mignition at different test conditions. Each plot presents the effect of the injection parameters at different ambient conditions. BP = 5 MPa.
Fig. 18. OHpeak radial location at different test conditions. Each plot presents the effect of the injection parameters at different ambient conditions. BP = 5 MPa.
Fig. 19. Mignition (left) and OHpeak radial position (right) at different test conditions. On the left plot the value at O2% = 21% have been scaled to ease comparison of the results;the dashed lines connect the results related to the tests at full needle lift. BP = 5 MPa, Tamb = 935 K.
112 V. Macian et al. / Applied Energy 118 (2014) 100–113
basing on the average mass flow rate. In this way, the effect of theinjection pressure and of the needle lift can be compared directly.The plots show that the driving parameter for these magnitudes isthe average mass flow rate; however, at a closer look, the points atpartial needle lift (low and med piezo-stack charge) are not alignedto the line connecting the points at full needle lift (dashed lines inFig. 19): this fact remarks that reducing the mass flow rate eitherby lowering the injection pressure or by needle throttling has a dif-ferent impact on the ignition, as a consequence of differences in thespray development.
5. Summary and conclusions
For the first time, the relationship between injection rate shapeand Diesel ignition has been studied experimentally. This work hasbeen carried out using a novel piezo-actuated direct-acting injectorprototype and imaging the CH*/OH* chemiluminescence under awide range of test conditions.
The test plan carried out allowed a characterization of the first-and second-stage ignition under a wide range of test conditions,assessing the impact of the different parametric variations:

V. Macian et al. / Applied Energy 118 (2014) 100–113 113
� the timing of the first- and second-stage ignition is stronglydependent on the ambient conditions;� the fisrt-stage ignition timing mainly depends on the mixture
temperature and therefore only on ambient temperature andambient density, while the duration of the transition to the sec-ond-stage ignition is driven primarily by the chemistry of themixture involving therefore also the oxygen concentration;� the partial needle lift causes a slight shortening of the second-
stage ignition delay (SoOH) as a consequence of the modifica-tions of the increase in the spray spreading angle observed forthese conditions [20];� non-conventional injection rate profiles (boot and ramp) have a
significant impact on the premixed phase of the combustion(reducing OHpeak and MOH) and on the ignition location (reduc-ing the radial position of the ignition) without varying neitherthe injection pressure nor the final fuel mass flow rate;� as a consequence of that, the direct acting injector is particu-
larly attractive from the engine point of view;� the alternative injection rate profiles improve significantly the
control on the combustion event and the flexibility of the injec-tion system since the mass flow rate is not dependent anymoreon injection pressure and, therefore, the injection conditionscan be changed instantaneously from one cycle to the followingone;� a valuable alternative to multiple injection strategies is avail-
able to control the premixed phase of the combustion whichis among the main causes for combustion noise and the NOx
production;� the possibility of controlling the ignition location maintaining
constant the final mass flow rate (e.g. performing boot or rampshaped injections), is very useful at low-load engine conditions:at these working points (typically at low ambient temperature/density and oxygen content) the ignition location moves fartherfrom the injector nozzle, making of wall impingement andflame quenching an issue.
Acknowledgments
This work was sponsored by General Motors R&D, Warren, MI.The authors would like to thank Jose Enrique del Rey, Moises Fer-randez Hermosilla and Juan Pablo Viera for their precious help inthe laboratory during the tests.
References
[1] Han PS, Hyun YS, Sik LC. Effects of multiple-injection strategies on overallspray behavior, combustion, and emissions reduction characteristics ofbiodiesel fuel. Appl. Energy 2011;88:88–98.
[2] Catania AE, Ferrari A. Development and performance assessment of the new-generation CF fuel injection system for diesel passenger cars. Appl. Energy2012;91:483–95.
[3] Dober G, Tullis S, Greeves G, Milovanovic N, Hardy M, Zuelch S. The impact ofinjection strategies on emissions reduction and power output of future dieselengines. SAE Int. 2008. 01-0941.
[4] Rollbusch C. Effects of hydraulic nozzle flow rate and high injection pressureon mixture formation, combustion and emissions on a single-cylinder DI light-duty diesel engine. Int. J. Engine Res. 2011;13:323–39.
[5] Mosburger M, Sick V, Drake MC. Quantitative high-speed imaging of burnedgas temperature and equivalence ratio in internal combustion engines usingalkali metal fluorescence. Int. J. Eng. Res. 2013.
[6] Pickett LM, Manin J, Genzale CL, Siebers DL, Musculus MPB, Idicheria CA.Relationship between diesel fuel spray vapor penetration/dispersion and localfuel mixture fraction. SAE Int. J. Eng. 2011;4:764–99.
[7] Bruneaux G. Development of optical diagnostic techniques to correlate mixingand auto-ignition processes in high pressure Diesel jets. Oil & Gas Sci.Technol.– Revue de l’IFP 2008;63:461–77.
[8] Zhu J, Kuti OA, Nishida K. An investigation of the effects of fuel injectionpressure, ambient gas density and nozzle hole diameter on surrounding gasflow of a single Diesel spray by laer-induced fluorescence-particle imagevelocimetry technique. Int. J. Eng. Res. 2012.
[9] Dec JE. A conceptual model of DI diesel combustion based on laser-sheetimaging. Warrendale, PA: Society of Automotive Engineers; 1997.
[10] Higgins B, Siebers D, Aradi A. Diesel-Spray ignition and premixed-burnbehavior. SAE Int. 2000:2000–01-0940.
[11] Payri R, García-Oliver JM, Bardi M, Manin J. Fuel temperature influence onDiesel sprays in inert and reacting conditions. Appl. Therm. Eng.2012;35:185–95.
[12] Zigan L, Shi J-M, Krotow I, Schmitz I, Wensing M, Leipertz A, et al. Fuel propertyand fuel temperature effects on internal nozzle flow, atomization and cyclicspray fluctuations of a direct injection spark ignition–injector. Int. J. Eng. Res.2013.
[13] Payri R, Salvador FJ, Gimeno J, De la Morena J. Effects of nozzle geometry ondirect injection diesel engine combustion process. Appl. Therm. Eng.2009;29:2051–60.
[14] Pickett LM, Genzale C, Bruneaux G, Malbec L-M, Hermant L, Christiansen C,et al. Comparison of Diesel spray combustion in different high-temperature,high pressure, facilities. SAE Int. 2010. 2010-05-01.
[15] Hampai D, Marchitto L, Dabagov SB, Allocca L, Alfuso S, Innocenti L. Desktop X-ray tomography for low contrast samples. Nucl. Instrum. Methods Phys. Res.,Sect. B 2013;309:264–7.
[16] O. Kastner, F. Atzler, C. Juvenelle, R. Rotondi, A. Weigand, Directly actuatedpiezo injector for advanced injection strategies towards cleaner diesel engines,in: 7th Int symposium towards cleaner diesel engine TDCE2009.
[17] R. Payri, J. Gimeno, O. Venegas, A. Plazas, Effect of partial needle lift on thenozzle flow in Diesel fuel injectors, in: SAE Technical Paper 2011, 2011, pp. 01-1827.
[18] Gaydon AG. The Spectroscopy of Flames. London: Chapman & Hall; 1957.[19] Macián V, Bermúdez V, Payri R, Gimeno J. New technique for determination of
internal geometry of a diesel nozzle with the use of silicone methodology. Exp.Techniques 2003;27:39–43.
[20] Payri R, Gimeno J, Bardi M, Plazas AH. Study liquid length penetration resultsobtained with a direct acting piezo electric injector. Appl. Energy2013;106:152–62.
[21] Payri R, Gimeno J, Viera JP, Plazas AH. Needle lift profile influence on the vaporphase penetration for a prototype diesel direct acting piezoelectric injector.Fuel 2013;113:257–65.
[22] R.S.G. Baert, P.J.M. Frijters, B. Somers, C.C.M. Luijten, W. de Boer, Design andoperation of a high pressure, high temperature cell for HD diesel spraydiagnostics: guidelines and results, in: SAE paper 2009, 2009, pp. 01-0649.
[23] Dec JE, Espey C. Chemiluminescence imaging of autoignition in a DI dieselengine. SAE Int. 1998:982685.
[24] Meijer M, Somers LMT, Johnson J, Lee SY, Malbec L-M, Bruneaux G, et al. EngineCombustion Network (ECN): characterization and comparison of boundaryconditions for different combustion vessels. Atomization Sprays2012;22:777–806.
[25] Dec JE, Coy EB. OH radical imaging in a DI diesel engine and the structure ofthe early diffusion flame. SAE Int. 1996:960831.
[26] Peng DY, Robinson DBA. New two-constant equation of state. Ind. Eng. Chem.Fundam. 1976;15:59–64.
[27] Lillo PM, Pickett LM, Persson H, Andersson O, Kook S. Diesel spray ignitiondetection and spatial/temporal correction. SAE Int. J. Eng. 2012;5:1330–46.
[28] Bardi M, Payri R, Malbec L-M, Bruneaux G, Pickett LM, Manin J, et al. Enginecombustion network: comparison of spray development, vaporization andcombustion in different combustion vessels. Atomization Sprays2012;22:807–42.
[29] Benajes J, Payri R, Bardi M, Martí-Aldaraví P. Experimental characterization ofDiesel ignition and lift-off length using a single-hole ECN injector. Appl.Therm. Eng. 2013;58:554–63.
[30] Naber JD, Siebers DL. Effects of gas density and vaporization on penetrationand dispersion of diesel sprays. SAE paper 1996:960034.
[31] Desantes JM, Pastor JV, Payri R, Pastor JM. Experimental characterization ofinternal nozzle flow and diesel spray behavior. Part II: evaporative conditions.Atomization Sprays 2005;15:517–43.
[32] Musculus MPB, Kattke K. Entrainment waves in diesel jets. SAE Int. J. Eng.2009;2:1170–93.
[33] Pastor JV, López JJ, García JM, Pastor JM. A 1D model for the description ofmixing-controlled inert diesel sprays. Fuel 2008;87:2871–85.
[34] Payri R, Salvador FJ, Gimeno J, De la Morena J. Influence of injector technologyon injection and combustion development – part 2: combustion analysis. Appl.Energy 2011;88:1130–9.


![Untitled-2 [3.imimg.com]3.imimg.com/data3/XO/OC/MY-1810869/crdi-test-bench.pdfPUMPSINJECTOR & RAIL TESTER WITH PIEZO INJECTOR TESTING. SALIENT FEATURES AC FREQUENCY INVERTOR DRIVE,](https://img.pdfslide.us/doc/110x75/61049a7472ea0c0c58250194/untitled-2-3imimgcom3imimgcomdata3xoocmy-1810869crdi-test-benchpdf-pumpsinjector.jpg)


![[DESIGN] Piezo-Piezo to Pie](https://img.pdfslide.us/doc/110x75/5571f8bb49795991698df909/design-piezo-piezo-to-pie.jpg)