Embed Size (px)
Citation preview
CSIRO EARTH SCIENCE AND RESOURCE ENGINEERING
Experimental study of the flow behaviour of a gas hydrate system in the Hytra Loop
Mauricio Di Lorenzo and Gerardo Sanchez
EP-12-07-12-37
11 July, 2012
Citation
Di Lorenzo M and Sanchez G (2012) Experimental study of the flow behaviour of a gas hydrate system in
the Hytra Loop. CSIRO, Australia.
Copyright and disclaimer
© 2012 CSIRO To the extent permitted by law, all rights are reserved and no part of this publication
covered by copyright may be reproduced or copied in any form or by any means except with the written
permission of CSIRO.
Important disclaimer
CSIRO advises that the information contained in this publication comprises general statements based on
scientific research. The reader is advised and needs to be aware that such information may be incomplete
or unable to be used in any specific situation. No reliance or actions must therefore be made on that
information without seeking prior expert professional, scientific and technical advice. To the extent
permitted by law, CSIRO (including its employees and consultants) excludes all liability to any person for
any consequences, including but not limited to all losses, damages, costs, expenses and any other
compensation, arising directly or indirectly from using this publication (in part or in whole) and any
information or material contained in it.

Experimental study of the flow behaviour of a gas hydrate system in the Hytra Loop | i
ii | Report Title
Contents
Acknowledgments ............................................................................................................................................. iv
Executive summary............................................................................................................................................. v
1 Introduction .......................................................................................................................................... 1
2 The Hytra Loop ...................................................................................................................................... 2
3 Materials and Method .......................................................................................................................... 5
3.1 Data processing ........................................................................................................................... 6
4 Results ................................................................................................................................................... 8
4.1 Flow behaviour in the hydrate-free region ................................................................................. 8
4.2 Flow behaviour in the hydrate region ........................................................................................ 9
5 Discussion ............................................................................................................................................ 19
6 Conclusions ......................................................................................................................................... 21
7 References ........................................................................................................................................... 22
Experimental study of the flow behaviour of a gas hydrate system in the Hytra Loop | iii
Figures
Figure 1 Simplified layout of the Hytra Loop ...................................................................................................... 2
Figure 2. Photograph of the test section of the Hytra loop ............................................................................... 4
Figure 3. Hydrate dissociation curve for the city gas-water system (the test region is highlighted) ................ 6
Figure 4. Pressure drop trace across the test section in the absence of hydrates ............................................ 8
Figure 5. Temperatures at the inlet and outlet section as a function of the coolant temperature ................... 9
Figure 6. Pressure drop across consecutive sections of the flow loop at 8618 KPa and low subcooling ........ 10
Figure 7. Temperature at consecutive sections of the flow loop at 8618 KPa and low subcooling................. 11
Figure 8. Temperature at consecutive sections of the flow loop at 10342 KPa and low subcooling............... 11
Figure 9. Pressure drop across consecutive sections of the flow loop at 10342 KPa and low subcooling ...... 12
Figure 10. Snapshots from viewing window VW1 during a test at 10342 KPa and low subcooling ................ 13
Figure 11. Pressure drop across consecutive sections of the flow loop at 8618 KPa and intermediate
subcooling ......................................................................................................................................................... 14
Figure 12. Pressure drop across consecutive sections of the flow loop at 10342 KPa and intermediate
subcooling ......................................................................................................................................................... 15
Figure 13. Pressure drop across consecutive sections of the flow loop at 10342 KPa and high subcooling ... 16
Figure 14. Sequence of snapshots showing the passage of a hydrate slug through the exit window ............. 16
Figure 15. Pressure readings at the separator at initial pressures around 8618 KPa and different degrees
of subcooling .................................................................................................................................................... 17
Figure 16. Average formation rate as a function of the average subcooling in each experiment ................... 18
Tables
Table 1 Technical specifications of the Hytra loop ............................................................................................. 2
Table 2. City-gas composition ............................................................................................................................. 5
Table 3. Physical properties of natural gas and water at 8618 KPa, 8 °C ........................................................... 8

iv | Report Title
Acknowledgments
The authors thank CSIRO for funding this work

Experimental study of the flow behaviour of a gas hydrate system in the Hytra Loop | v
Executive summary
Hydrate behaviour in gas pipelines has been investigated using the Hytra loop, a one inch flow loop
operating in a gas dominated flow regime at high pressure, low temperature conditions. In these
experiments gas from the city network was circulated at high velocity through the test section of the loop
and deionised water was injected at constant flow rate to simulate steady-state production of natural gas
with low water content. Temperatures and pressures in the loop were varied in a range of 6 to 18 °C and
6895 KPa to 10342 KPa, respectively, to produce a wide range of subcoolings. The pressure drop evolution
across consecutive sections of the loop was analysed. At low subcoolings the pressure drop-time records
were observed to steadily increase over time, while at high subcoolings they exhibited a series of
pronounced pulses. This behaviour was interpreted in terms of a stenosis build-up mechanism at low
subcooling conditions and deposition of wet hydrate particles with sloughing at higher subcoolings.

Experimental study of the flow behaviour of a gas hydrate system in the Hytra Loop | 1
1 Introduction
Hydrate formation is one of the most relevant flow assurance problems to be considered when developing
new offshore fields [1, 2]. The use of long tiebacks in this scenario is a challenge; low temperatures in deep
water and complex seabed topographies with steep slopes enhance the possibility of liquid accumulation
and thermal changes, especially during shutdown and start-up operations. There is an imperative need for
reliable tools to predict the most probable locations and critical conditions in which hydrate blockages may
develop and to test the most suitable preventive methods.
Some researchers [3, 4] have experimentally studied hydrate formation in liquid dominant flow loops and
preliminary models have been developed for liquid dominant pipelines and gas condensate systems [5].
When the liquid is the prevailing phase, the hydrodynamic conditions and the distribution of fluids are such
that hydrate formation is often limited by mass and heat transfer effects. The results obtained in this case
cannot be not directly used to describe hydrates behaviour in gas dominant pipelines, where the gas is the
continuous phase and mass and heat transfer rates are usually larger.
A one-inch hydrate flow loop, The Hytra loop, has been built at CSIRO for the investigation of hydrate
behaviour in natural gas pipelines. In this work the test rig is described and the results from experiments
conducted under constant water and gas flow in a wide range of loop temperatures (4-18 °C) and pressures
(6895-10342 KPa) are presented. A description of the phenomena related to hydrate formation and flow
behaviour observed in this work is provided as a basis for developing predictive models applicable to gas-
dominated conditions.
2 | Report Title
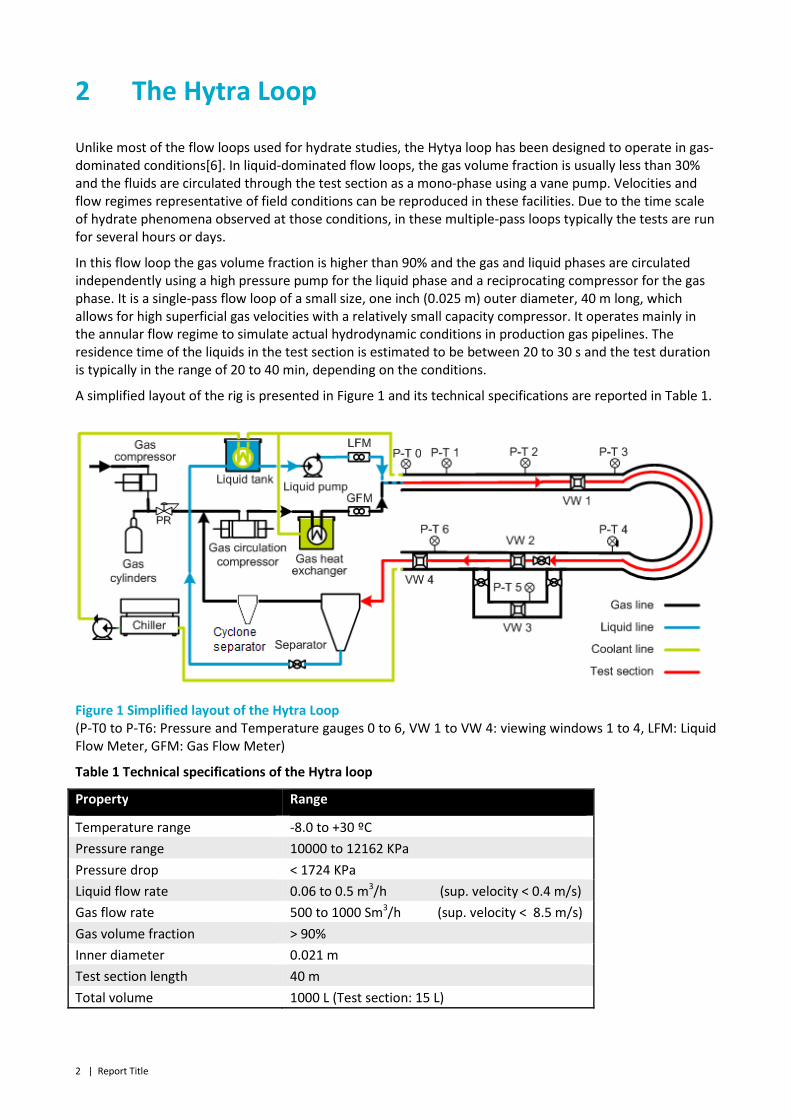
2 The Hytra Loop
Unlike most of the flow loops used for hydrate studies, the Hytya loop has been designed to operate in gas-
dominated conditions[6]. In liquid-dominated flow loops, the gas volume fraction is usually less than 30%
and the fluids are circulated through the test section as a mono-phase using a vane pump. Velocities and
flow regimes representative of field conditions can be reproduced in these facilities. Due to the time scale
of hydrate phenomena observed at those conditions, in these multiple-pass loops typically the tests are run
for several hours or days.
In this flow loop the gas volume fraction is higher than 90% and the gas and liquid phases are circulated
independently using a high pressure pump for the liquid phase and a reciprocating compressor for the gas
phase. It is a single-pass flow loop of a small size, one inch (0.025 m) outer diameter, 40 m long, which
allows for high superficial gas velocities with a relatively small capacity compressor. It operates mainly in
the annular flow regime to simulate actual hydrodynamic conditions in production gas pipelines. The
residence time of the liquids in the test section is estimated to be between 20 to 30 s and the test duration
is typically in the range of 20 to 40 min, depending on the conditions.
A simplified layout of the rig is presented in Figure 1 and its technical specifications are reported in Table 1.
Figure 1 Simplified layout of the Hytra Loop
(P-T0 to P-T6: Pressure and Temperature gauges 0 to 6, VW 1 to VW 4: viewing windows 1 to 4, LFM: Liquid
Flow Meter, GFM: Gas Flow Meter)
Table 1 Technical specifications of the Hytra loop
Property Range
Temperature range -8.0 to +30 ºC
Pressure range 10000 to 12162 KPa
Pressure drop < 1724 KPa
Liquid flow rate 0.06 to 0.5 m3/h (sup. velocity < 0.4 m/s)
Gas flow rate 500 to 1000 Sm3/h (sup. velocity < 8.5 m/s)
Gas volume fraction > 90%
Inner diameter 0.021 m
Test section length 40 m
Total volume 1000 L (Test section: 15 L)
Experimental study of the flow behaviour of a gas hydrate system in the Hytra Loop | 3
The flow loop can handle non-corrosive gases, pure water and brines and model oils with water or oil-
soluble additives. The system can be pressurized up to 12066 KPa using high pressure cylinders with the gas
to be tested in the experiments. A gas storage system is available to supply high pressure gas from the city
network. The gas is continuously circulated by using a high pressure 15 HP reciprocating compressor with
maximum capacity of 1000 Sm3/h and maximum allowed pressure drop of 1724 KPa. The gas flow rates can
be varied in the range of 500 to 1000 Sm3/h. Warm gas from the compressor can be partially cooled down
before entering the test section using a heat exchanger.
Two 500 L tanks are available for the injection of liquids: one for water and aqueous solutions; the other is
a stirred vessel which can be used for oil and water mixtures. The water tank operates at atmospheric
pressure while the oil-water tank can be pressurized up to 689 KPa. Both tanks are provided with heat
exchangers to cool down the liquids before injection. The liquids are injected into the flow loop from the
test section inlet at flow rates in the range of 0.06 to 0.5 m3/h using a high pressure liquid pump. At this
flow rates liquid volume fractions of up to 10% are expected in the test section. An insulated four inch pipe-
in-pipe system connected to a chiller unit is used to cool-down the test section to the target temperature,
allowing the flow loop to operate at temperature and pressure conditions where most natural gas hydrates
form.
The mixture of fluids and hydrates, that are eventually produced during the experiments, is collected at the
test section outlet in a two phase separator with capacity for 550 Litres, connected in series with a smaller
80 Litre cyclone separator. The gas free of hydrate particles and liquid droplets is then pumped back into
the flow line by the compressor.
At the end of the test, once the hydrates are fully dissociated, the liquids are flushed into the large
separator. Afterwards the system is fully emptied by discharging all the liquids collected at the bottom of
the separator for disposal or recycling.
A “U” shaped by-pass deviation, 2 meters long and 0.9 meter deep, not used in this work, is available to
simulate a low point in the flow line.
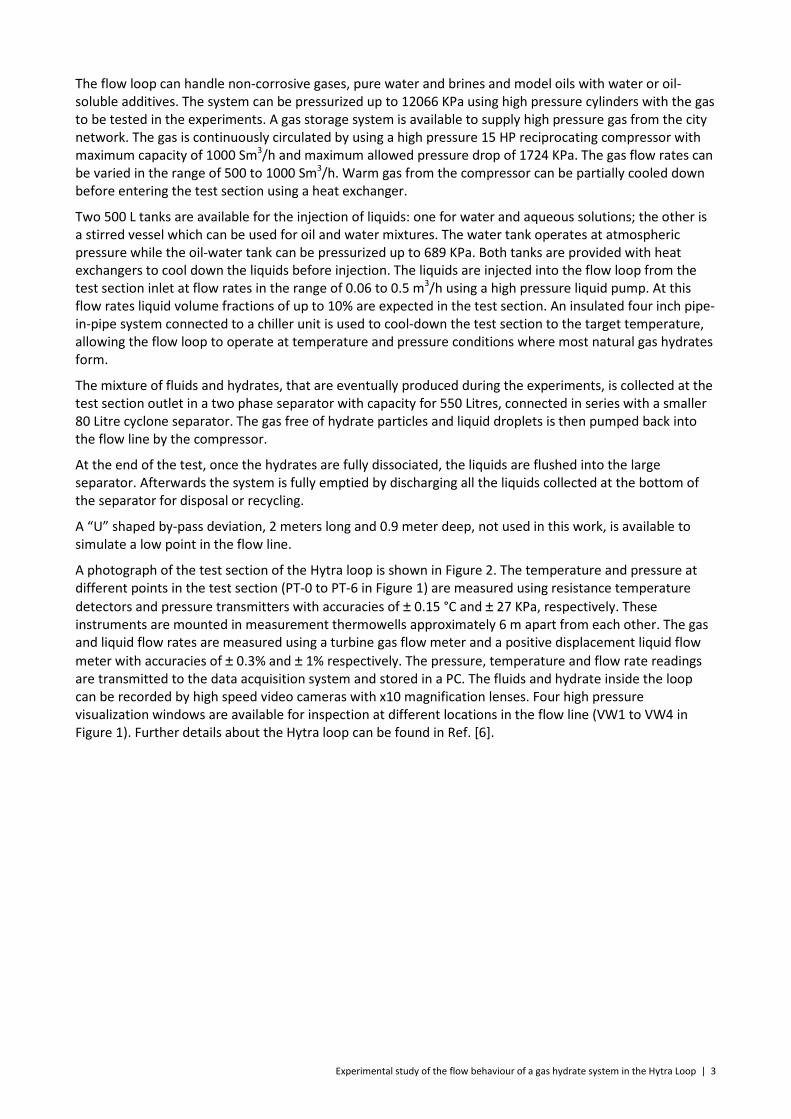
A photograph of the test section of the Hytra loop is shown in Figure 2. The temperature and pressure at
different points in the test section (PT-0 to PT-6 in Figure 1) are measured using resistance temperature
detectors and pressure transmitters with accuracies of ± 0.15 °C and ± 27 KPa, respectively. These
instruments are mounted in measurement thermowells approximately 6 m apart from each other. The gas
and liquid flow rates are measured using a turbine gas flow meter and a positive displacement liquid flow
meter with accuracies of ± 0.3% and ± 1% respectively. The pressure, temperature and flow rate readings
are transmitted to the data acquisition system and stored in a PC. The fluids and hydrate inside the loop
can be recorded by high speed video cameras with x10 magnification lenses. Four high pressure
visualization windows are available for inspection at different locations in the flow line (VW1 to VW4 in
Figure 1). Further details about the Hytra loop can be found in Ref. [6].
4 | Report Title
Figure 2. Photograph of the test section of the Hytra loop
Experimental study of the flow behaviour of a gas hydrate system in the Hytra Loop | 5
3 Materials and Method
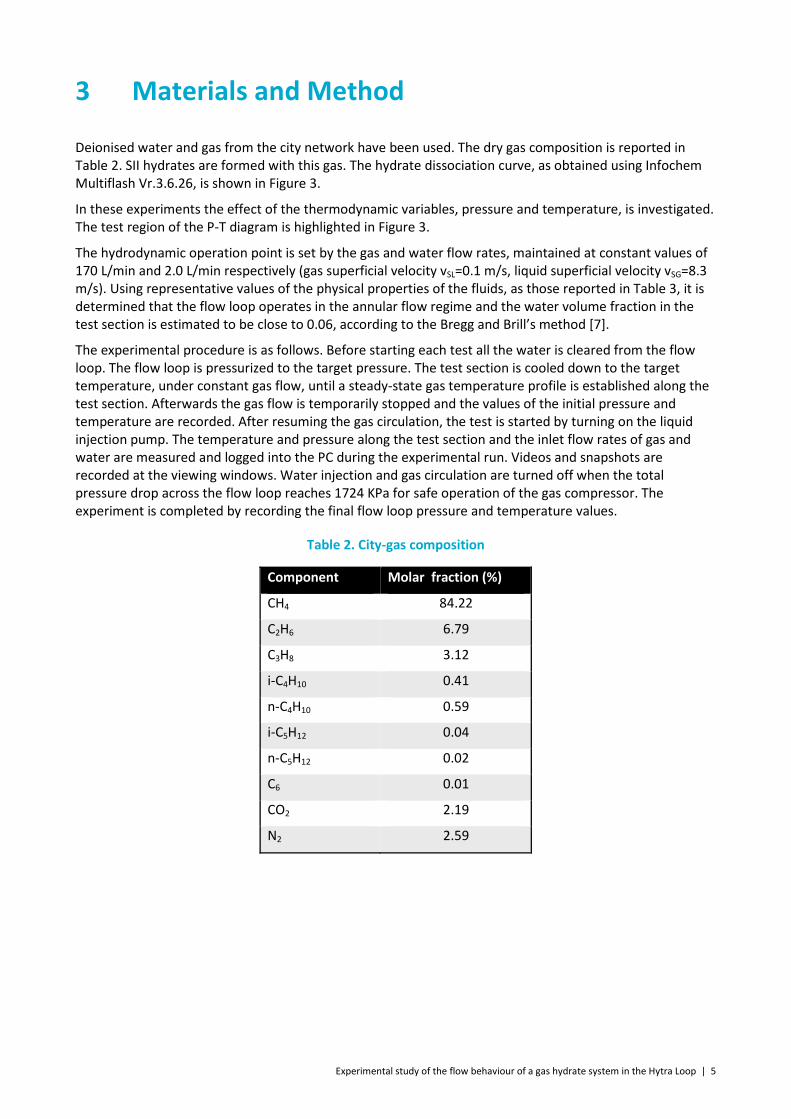
Deionised water and gas from the city network have been used. The dry gas composition is reported in
Table 2. SII hydrates are formed with this gas. The hydrate dissociation curve, as obtained using Infochem
Multiflash Vr.3.6.26, is shown in Figure 3.
In these experiments the effect of the thermodynamic variables, pressure and temperature, is investigated.
The test region of the P-T diagram is highlighted in Figure 3.
The hydrodynamic operation point is set by the gas and water flow rates, maintained at constant values of
170 L/min and 2.0 L/min respectively (gas superficial velocity vSL=0.1 m/s, liquid superficial velocity vSG=8.3
m/s). Using representative values of the physical properties of the fluids, as those reported in Table 3, it is
determined that the flow loop operates in the annular flow regime and the water volume fraction in the
test section is estimated to be close to 0.06, according to the Bregg and Brill’s method [7].
The experimental procedure is as follows. Before starting each test all the water is cleared from the flow
loop. The flow loop is pressurized to the target pressure. The test section is cooled down to the target
temperature, under constant gas flow, until a steady-state gas temperature profile is established along the
test section. Afterwards the gas flow is temporarily stopped and the values of the initial pressure and
temperature are recorded. After resuming the gas circulation, the test is started by turning on the liquid
injection pump. The temperature and pressure along the test section and the inlet flow rates of gas and
water are measured and logged into the PC during the experimental run. Videos and snapshots are
recorded at the viewing windows. Water injection and gas circulation are turned off when the total
pressure drop across the flow loop reaches 1724 KPa for safe operation of the gas compressor. The
experiment is completed by recording the final flow loop pressure and temperature values.
Table 2. City-gas composition
Component Molar fraction (%)
CH4 84.22
C2H6 6.79
C3H8 3.12
i-C4H10 0.41
n-C4H10 0.59
i-C5H12 0.04
n-C5H12 0.02
C6 0.01
CO2 2.19
N2 2.59
6 | Report Title
Figure 3. Hydrate dissociation curve for the city gas-water system (the test region is highlighted)
3.1 Data processing
The test section can be discretised in consecutive intervals according to the distribution of measurement
points for pressure and temperature from PT-0 to PT-6, as indicated in Figure 1. The pressure readings of
the section extreme points, Pi, Pj are used to determine the pressure drop, ∆Pij, at different sections of the
loop flow line as:
∆Pij = Pi - Pj (1)
The pressure, Pij, and temperature, Tij, of each section are calculated as the arithmetic mean of the pressure
and temperature values at the section extremes, Pi , Pj and Ti, Tj, respectively:
Pij = ( Pi + Pj )
Tij = ( Ti + Tj )
(2-a)
(2-b)
The subcooling at each section, Subij, is defined as the difference between the hydrate dissociation
temperature at the section pressure Pij, Th(Pij) and the section temperature, Tij:
Subij = Th(Pij) - Tij (3)
The volume of hydrate, Vh, formed in these tests is not measured directly, but it can be estimated from the
total moles of gas consumed by hydrates, ng. This is calculated from the gas equation of state and the
volume of water, using equations (4-5)
g
h
h
h nM
Vρ
= (4)
ff
wf
gRTz
VVP
RTz
VPn
)( 0
00
00−
−= (5)

Experimental study of the flow behaviour of a gas hydrate system in the Hytra Loop | 7
In equation 4, Mh and ρh are the hydrate molecular weight and density, respectively. In equation 5, P, T,
and z indicate the hydrostatic pressure, temperature and gas compressibility, with subscripts “0” and “f”
referring to the values at the beginning and at the end of the experiment The physical properties of the
fluids and hydrates are calculated using Infochem Multiflash Vr.3.6.26. V0 is the volume of the empty flow
loop (V0=1045 L), Vw is the total volume of water injected during the test, as measured by the water flow
meter, and R is the Boltzmann’s constant.
An estimation of the experimental average formation rate, α, can be obtained by dividing the total volume
of hydrates by the test duration, ∆t.
t
Vh
∆=α (6)

8 | Report Title
4 Results
The pressure drop along the pipeline is considered to be one of the most common indicators of hydrate
formation. In gas pipes the appearance of pressure spikes during production at hydrate formation
conditions has been associated with hydrate accumulation at specific locations in the flow line [8, 9]. In this
work the pressure drop behaviour, at different sections of the flow loop and different degrees of
subcooling, has been examined in detail.
4.1 Flow behaviour in the hydrate-free region
At temperatures above 19 °C in the range of pressures investigated in this work, the city-gas/water system
is in the hydrate free region. At these conditions and under constant flow of gas and water, the pressure
drop per unit length along the pipe is expected to be constant. Its value can be estimated using available
correlations or mechanistic models. According to the Beggs and Brill’s method [7] and the values for the
physical properties of the fluids reported in Table 3, the pressure drop gradient in the flow loop is 4.55
KPa/m at a pressure of 8618 KPa. Therefore total pressure drop across the test section, ∆P06, is 164 KPa
(the distance between P0 and P6 is 36 m). Figure 4 shows the experimental trace for ∆P06 as a function of
time obtained at 8618 KPa in the absence of hydrates. The value predicted by theory is also shown for
comparison. As expected, the pressure drop is fairly constant over the duration of the experiment with a
value close to the prediction from the Beggs and Brill’s method.
Table 3. Physical properties of natural gas and water at 8618 KPa, 8 °C
Property Reference value
Gas density 100 kg/m3
Gas viscosity 1.5 10-3
Pa s
Water density 1000 kg/m3
Water viscosity 1.0 10-5
Pa s
Gas-water interfacial tension 60 mN/m
Figure 4. Pressure drop trace across the test section in the absence of hydrates
Experimental study of the flow behaviour of a gas hydrate system in the Hytra Loop | 9
4.2 Flow behaviour in the hydrate region
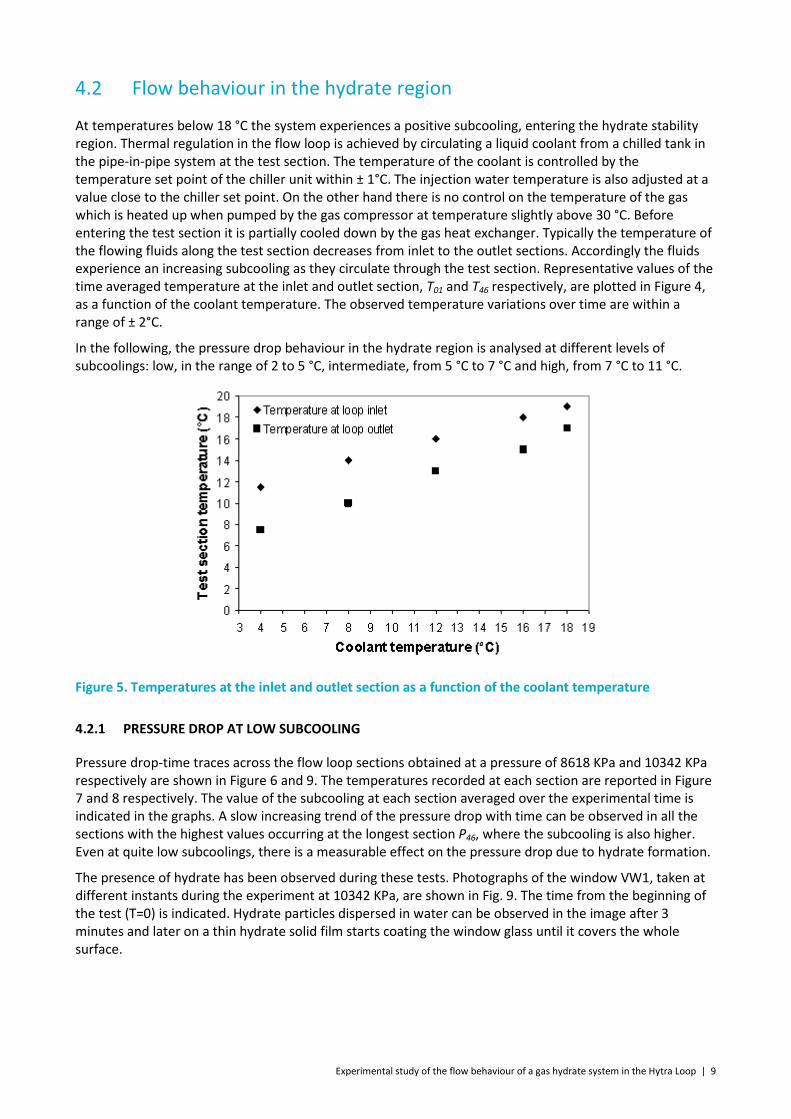
At temperatures below 18 °C the system experiences a positive subcooling, entering the hydrate stability
region. Thermal regulation in the flow loop is achieved by circulating a liquid coolant from a chilled tank in
the pipe-in-pipe system at the test section. The temperature of the coolant is controlled by the
temperature set point of the chiller unit within ± 1°C. The injection water temperature is also adjusted at a
value close to the chiller set point. On the other hand there is no control on the temperature of the gas
which is heated up when pumped by the gas compressor at temperature slightly above 30 °C. Before
entering the test section it is partially cooled down by the gas heat exchanger. Typically the temperature of
the flowing fluids along the test section decreases from inlet to the outlet sections. Accordingly the fluids
experience an increasing subcooling as they circulate through the test section. Representative values of the
time averaged temperature at the inlet and outlet section, T01 and T46 respectively, are plotted in Figure 4,
as a function of the coolant temperature. The observed temperature variations over time are within a
range of ± 2°C.
In the following, the pressure drop behaviour in the hydrate region is analysed at different levels of
subcoolings: low, in the range of 2 to 5 °C, intermediate, from 5 °C to 7 °C and high, from 7 °C to 11 °C.
Figure 5. Temperatures at the inlet and outlet section as a function of the coolant temperature
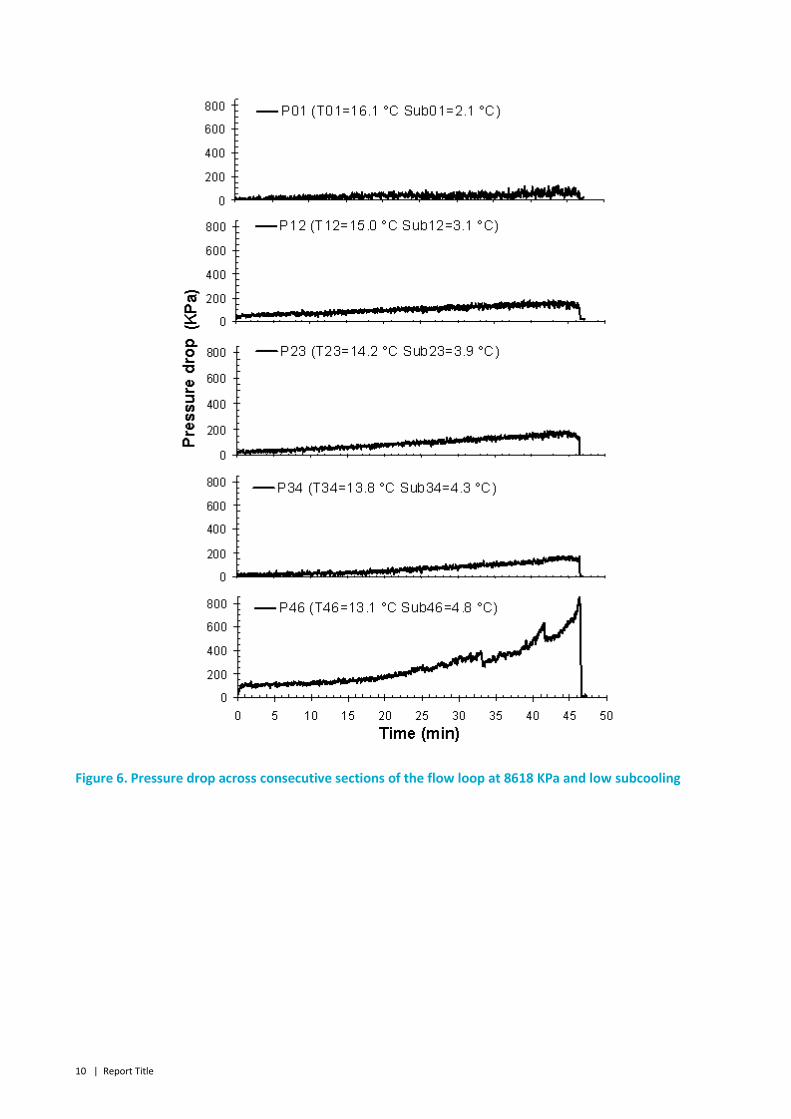
4.2.1 PRESSURE DROP AT LOW SUBCOOLING
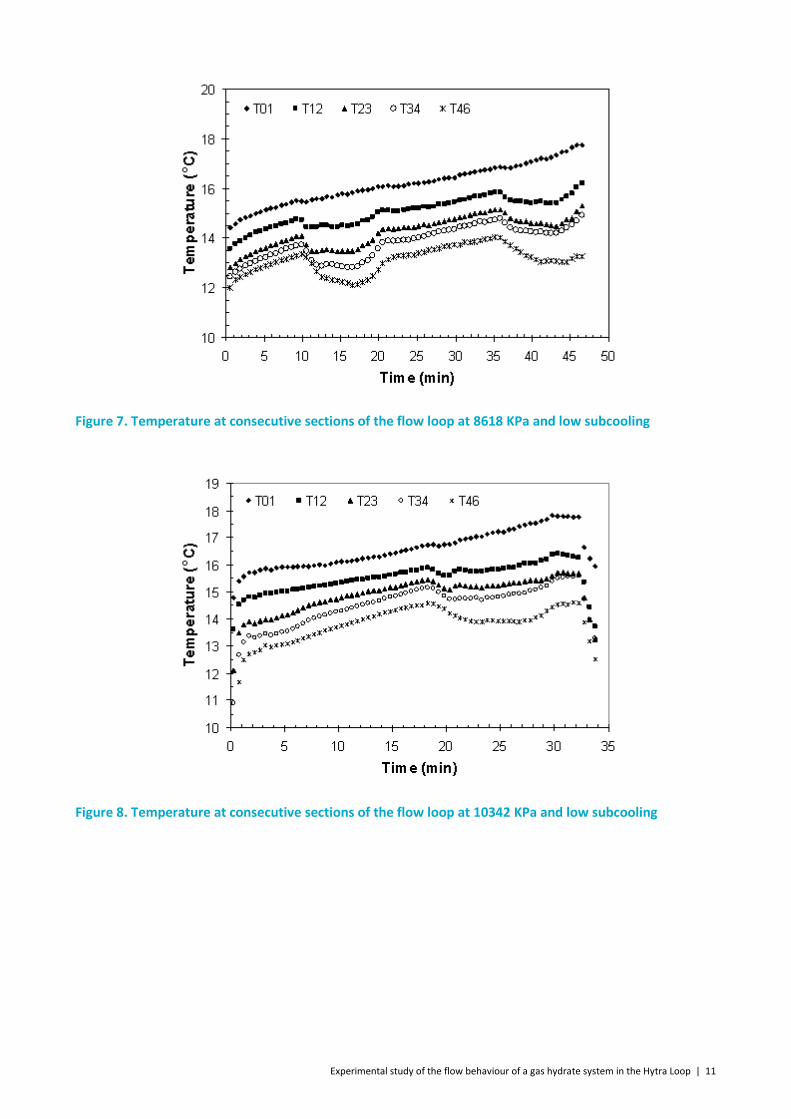
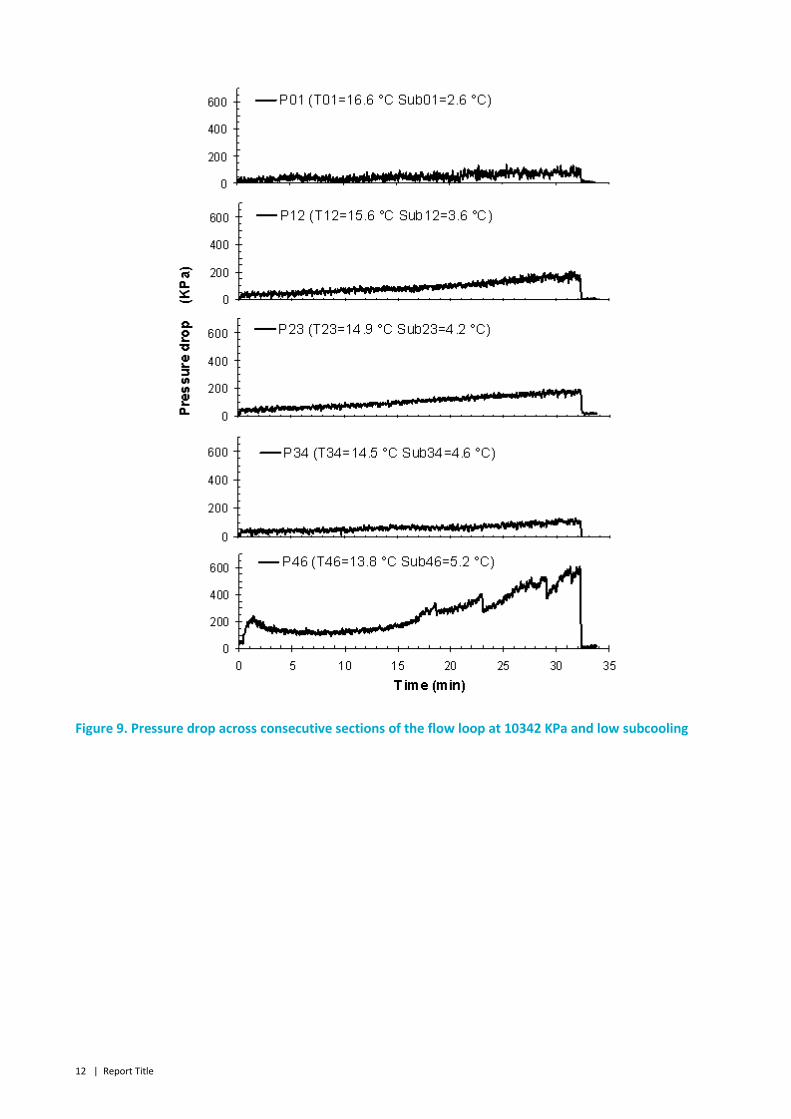
Pressure drop-time traces across the flow loop sections obtained at a pressure of 8618 KPa and 10342 KPa
respectively are shown in Figure 6 and 9. The temperatures recorded at each section are reported in Figure
7 and 8 respectively. The value of the subcooling at each section averaged over the experimental time is
indicated in the graphs. A slow increasing trend of the pressure drop with time can be observed in all the
sections with the highest values occurring at the longest section P46, where the subcooling is also higher.
Even at quite low subcoolings, there is a measurable effect on the pressure drop due to hydrate formation.
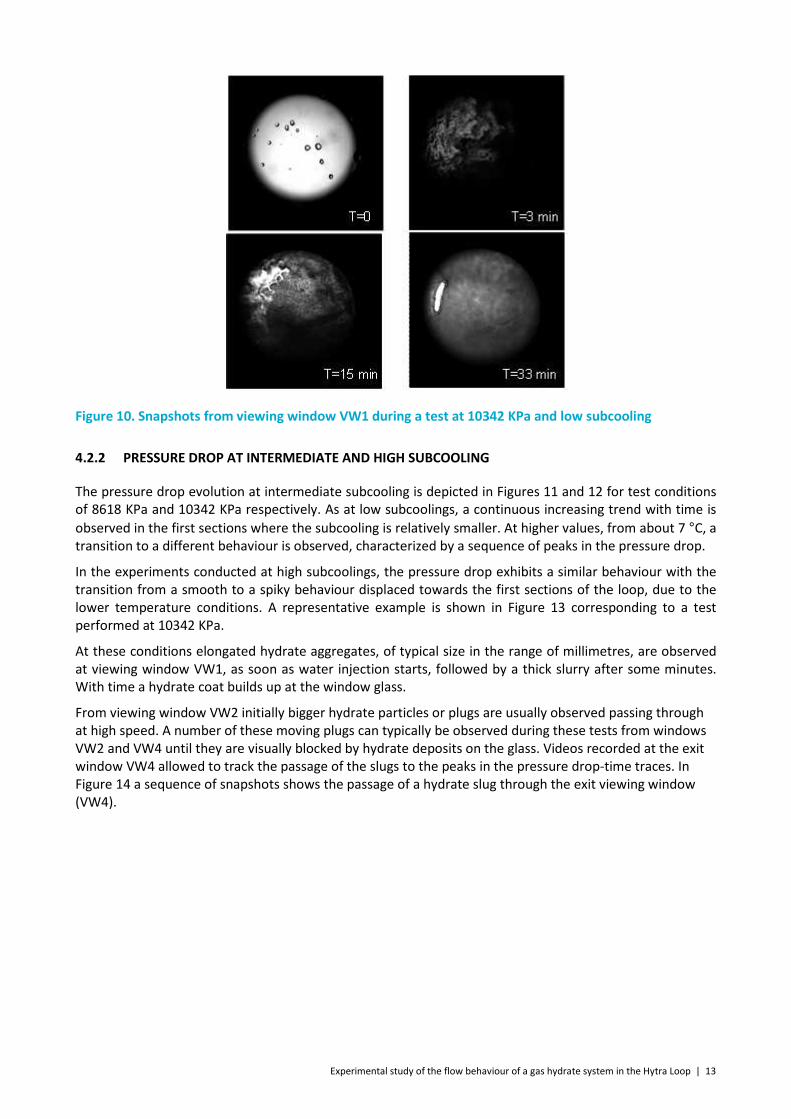
The presence of hydrate has been observed during these tests. Photographs of the window VW1, taken at
different instants during the experiment at 10342 KPa, are shown in Fig. 9. The time from the beginning of
the test (T=0) is indicated. Hydrate particles dispersed in water can be observed in the image after 3
minutes and later on a thin hydrate solid film starts coating the window glass until it covers the whole
surface.
10 | Report Title
Figure 6. Pressure drop across consecutive sections of the flow loop at 8618 KPa and low subcooling
Experimental study of the flow behaviour of a gas hydrate system in the Hytra Loop | 11
Figure 7. Temperature at consecutive sections of the flow loop at 8618 KPa and low subcooling
Figure 8. Temperature at consecutive sections of the flow loop at 10342 KPa and low subcooling
12 | Report Title
Figure 9. Pressure drop across consecutive sections of the flow loop at 10342 KPa and low subcooling
Experimental study of the flow behaviour of a gas hydrate system in the Hytra Loop | 13
Figure 10. Snapshots from viewing window VW1 during a test at 10342 KPa and low subcooling
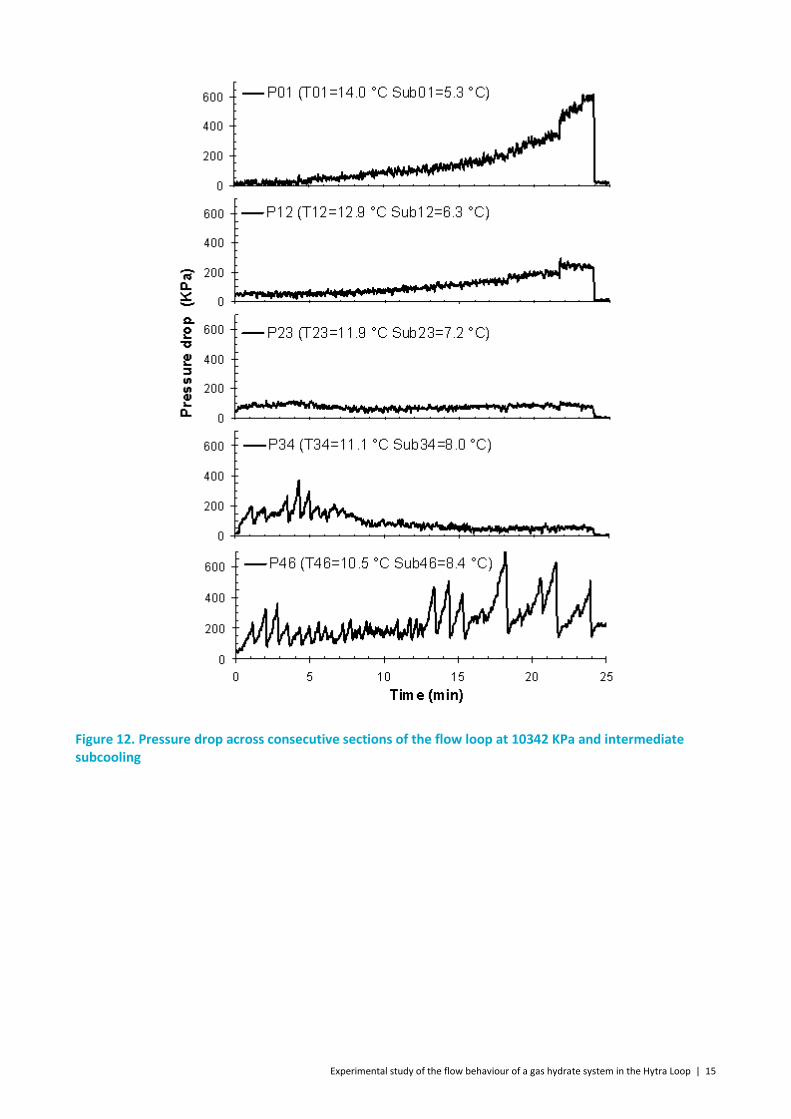
4.2.2 PRESSURE DROP AT INTERMEDIATE AND HIGH SUBCOOLING
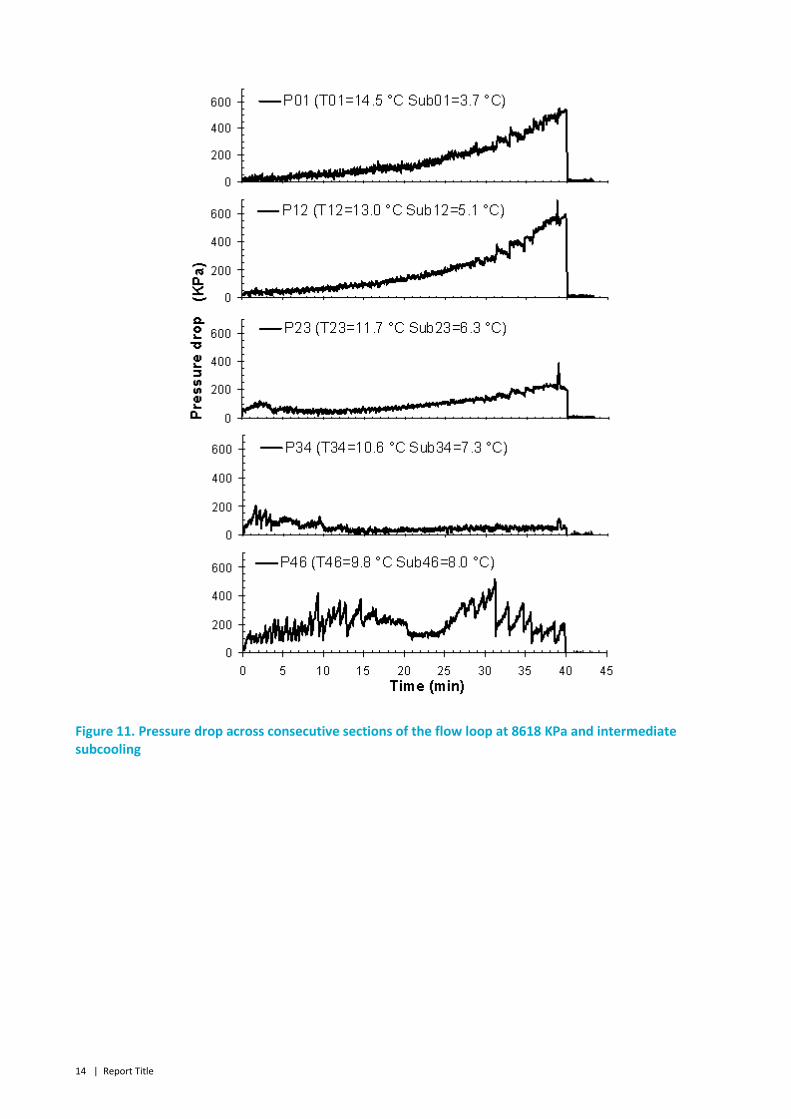
The pressure drop evolution at intermediate subcooling is depicted in Figures 11 and 12 for test conditions
of 8618 KPa and 10342 KPa respectively. As at low subcoolings, a continuous increasing trend with time is
observed in the first sections where the subcooling is relatively smaller. At higher values, from about 7 °C, a
transition to a different behaviour is observed, characterized by a sequence of peaks in the pressure drop.
In the experiments conducted at high subcoolings, the pressure drop exhibits a similar behaviour with the
transition from a smooth to a spiky behaviour displaced towards the first sections of the loop, due to the
lower temperature conditions. A representative example is shown in Figure 13 corresponding to a test
performed at 10342 KPa.
At these conditions elongated hydrate aggregates, of typical size in the range of millimetres, are observed
at viewing window VW1, as soon as water injection starts, followed by a thick slurry after some minutes.
With time a hydrate coat builds up at the window glass.
From viewing window VW2 initially bigger hydrate particles or plugs are usually observed passing through
at high speed. A number of these moving plugs can typically be observed during these tests from windows
VW2 and VW4 until they are visually blocked by hydrate deposits on the glass. Videos recorded at the exit
window VW4 allowed to track the passage of the slugs to the peaks in the pressure drop-time traces. In
Figure 14 a sequence of snapshots shows the passage of a hydrate slug through the exit viewing window
(VW4).
14 | Report Title
Figure 11. Pressure drop across consecutive sections of the flow loop at 8618 KPa and intermediate
subcooling
Experimental study of the flow behaviour of a gas hydrate system in the Hytra Loop | 15
Figure 12. Pressure drop across consecutive sections of the flow loop at 10342 KPa and intermediate
subcooling

16 | Report Title
Figure 13. Pressure drop across consecutive sections of the flow loop at 10342 KPa and high subcooling
Figure 14. Sequence of snapshots showing the passage of a hydrate slug through the exit window
a) before, b) during and c) after the event
Experimental study of the flow behaviour of a gas hydrate system in the Hytra Loop | 17
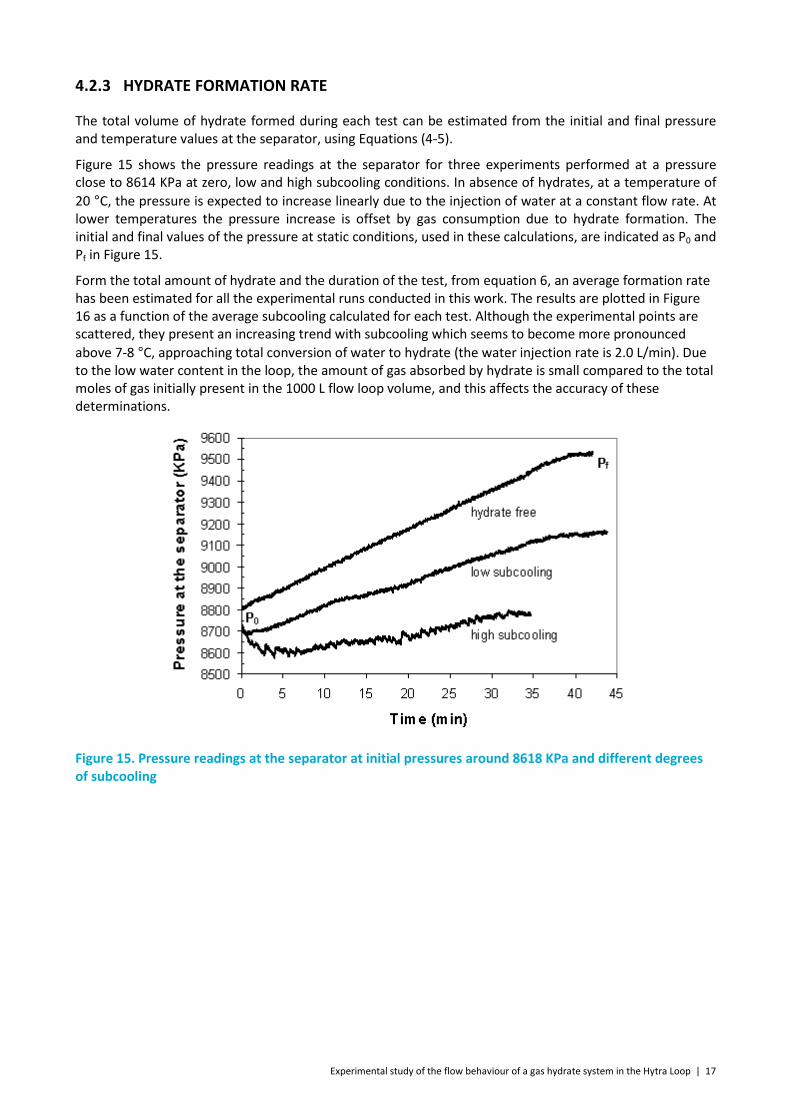
4.2.3 HYDRATE FORMATION RATE
The total volume of hydrate formed during each test can be estimated from the initial and final pressure
and temperature values at the separator, using Equations (4-5).
Figure 15 shows the pressure readings at the separator for three experiments performed at a pressure
close to 8614 KPa at zero, low and high subcooling conditions. In absence of hydrates, at a temperature of
20 °C, the pressure is expected to increase linearly due to the injection of water at a constant flow rate. At
lower temperatures the pressure increase is offset by gas consumption due to hydrate formation. The
initial and final values of the pressure at static conditions, used in these calculations, are indicated as P0 and
Pf in Figure 15.
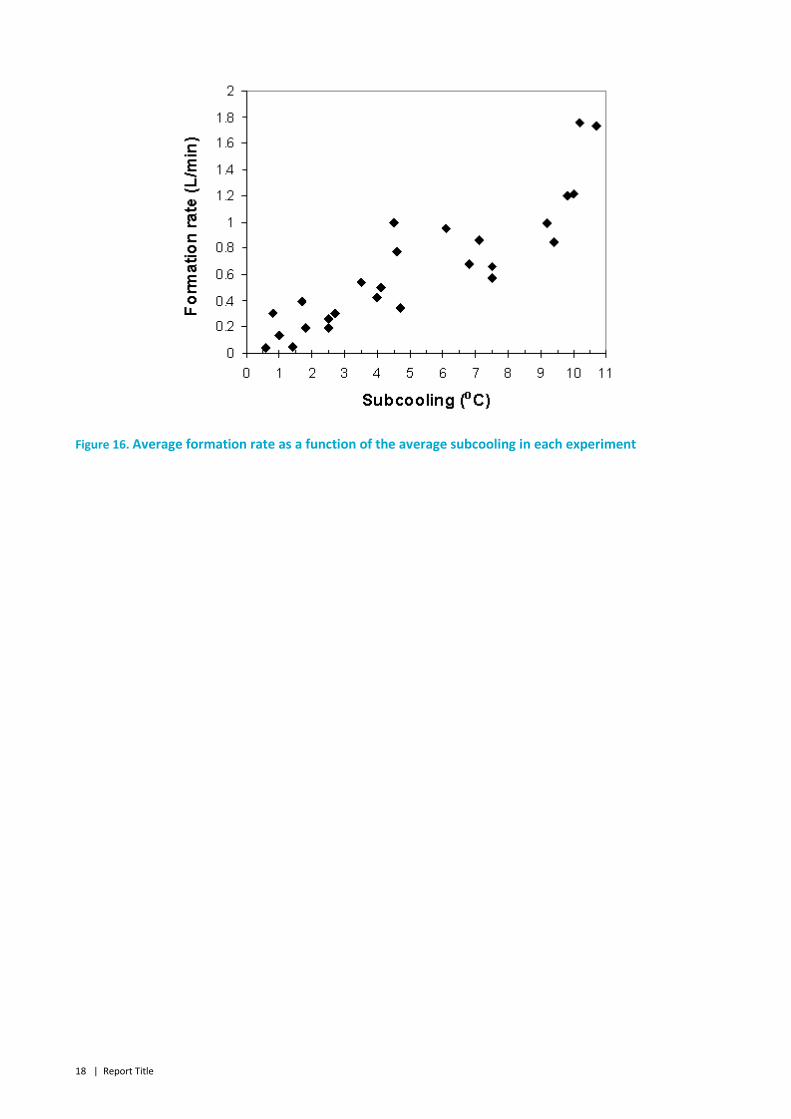
Form the total amount of hydrate and the duration of the test, from equation 6, an average formation rate
has been estimated for all the experimental runs conducted in this work. The results are plotted in Figure
16 as a function of the average subcooling calculated for each test. Although the experimental points are
scattered, they present an increasing trend with subcooling which seems to become more pronounced
above 7-8 °C, approaching total conversion of water to hydrate (the water injection rate is 2.0 L/min). Due
to the low water content in the loop, the amount of gas absorbed by hydrate is small compared to the total
moles of gas initially present in the 1000 L flow loop volume, and this affects the accuracy of these
determinations.
Figure 15. Pressure readings at the separator at initial pressures around 8618 KPa and different degrees
of subcooling
18 | Report Title
Figure 16. Average formation rate as a function of the average subcooling in each experiment
Experimental study of the flow behaviour of a gas hydrate system in the Hytra Loop | 19
5 Discussion
Several phenomena must be considered when describing the mechanisms of gas pipeline blockage due to
hydrates. Hydrate formation depends mainly on the pressure and temperature conditions, which
determine the subcooling as driving force for crystallization. Hydrodynamics plays also an important role by
affecting the gas-water interfacial area, the rate of gas transfer into the water phase and the heat
exchanges in the fluids and the pipe. The flow condition is a determining factor in the distribution of fluids
and solids in the pipeline and in the processes leading to plug formation such as particle agglomeration,
deposition and sticking to the walls.
The results obtained in this work show that there is significant risk in operating a gas pipeline in the region
of the pressure-temperature diagram where hydrates are stable. Even though the effect of the
hydrodynamic conditions are not investigated here, it is considered that the high gas phase fraction and
superficial velocity, simulated in this flow loop, produce much higher hydrate formation rates than those
found in oil producing pipelines. In oil dominated flow loops the typical time scale for detection of hydrates
is in the order of hours or days and subcoolings of 3 to 4 °C are usually required [4].
The low subcooling tests, which have been conducted around and below this temperature threshold, have
shown that hydrates are present and produce a gradual increase of the pressure drop. Such behaviour can
be attributed to the “stenosis build-up” effect which has been proposed by several authors to describe
hydrate blockages in condensate pipelines [11]. This refers to the progressive reduction of the hydraulic
diameter of the flow line due to the formation of a solid deposit stuck at the pipe walls. The exact
mechanisms by which the stenosis build-up process occurs are unknown. Some authors have suggested
that a hydrate coat covering the wetted perimeter of the pipe wall can form and grow inward over time
[11]. During the experiments at low and intermediate subcooling conditions, a hydrate crystalline coat is
observed to form over time on the glass window wetted by a water layer (see Figure 9). The power law
shape of some pressure drop-time traces also supports the stenosis mechanism. Under turbulent
conditions the friction factor for the gas flowing at high velocity in the pipeline depends on the Reynolds
number, Re, according to
( ) 4/1Re0791.0
−⋅=f (7)
Using the Darcy-Weisbach’s law, the pressure loss, ∆P, can be written in terms of the coat thickness, s, as
follows:
4/19
02
−⋅∆=∆
sD
DPP
(8)
where D and ∆P0 are the pipe diameter and the pressure drop in the absence of the coat respectively [11].
Assuming a constant radial growth rate, θ, for the hydrate coat over a given section of the flow loop, the
pressure drop-time traces are expected to follow the same power law
4/19
02
⋅−⋅∆=∆
tD
DPP
θ
(9)
Equation 9 has been used to interpolate the experimental data from Figure 10, section 1-2. The result is
shown in Figure 16 for a value of θ=1.27 10-4
m/min. The experimental data seem to follow the 19/4 power
law remarkably well, despite the simplifying assumptions.
The pressure drop behaviour at high subcoolings is more complex and it is characterized by a sequence of
pressure spikes. At these conditions, the injected water is quickly converted into hydrate, as the presence
of thick hydrate slurries or wet solids observed from the viewing windows suggests. Hydrate wet particles

20 | Report Title
are likely to aggregate and deposit at the pipe wall producing a severe flow restriction and, as a result, a
fast increase in pressure drop is observed. The subsequent abrupt decrease of this pressure drop could be
due to the release of a thick hydrate deposit which is peeled off the pipe wall and transported by the gas to
downstream sections of the loop. A conceptual model for hydrate wall growth and sloughing has been
formulated for water saturated condensate pipelines [12]. It is suggested that flow induced vibrations
(wake shedding past a cavity) could resonate with the natural frequency of the hydrate solid stuck at the
pipe wall, causing the sloughing process. In these flow loop experiments the high velocity gas shear against
the walls could be high enough to peel off hydrates chunks from the wall deposits.
Experimental study of the flow behaviour of a gas hydrate system in the Hytra Loop | 21
6 Conclusions
In this work the Hytra loop has been used to investigate the flow behaviour of natural gas-water systems at
temperatures and pressures where hydrates form. The experiments have been conducted at constant flow
rates in the annular flow regime to simulate gas production in a deep water gas pipeline. At these
conditions hydrates were observed in the entire investigated region of the pressure-temperature phase
diagram where hydrates are stable. At low subcoolings, hydrate crystallization was limited with hydrate
particles suspended in water forming a diluted slurry. The pressure drop across different section of the loop
was observed to rise steadily with time according to a stenosis build-up mechanism. At higher subcoolings
water conversion to hydrates was faster and a thick slurry or wet hydrate particles were recorded at the
viewing windows at different points in the flow line. A sequence of pressure spikes appeared in the
pressure drop-time traces under these conditions. This complex behaviour could be due to a fast deposition
of wet particles at the pipe walls followed by sloughing of the thick deposits transported downstream by
the gas flow. Efforts are underway to model the experimental results and to evaluate experimentally the
effect of the presence of oil and hydrate inhibitors in the system.
22 | Report Title
7 References
1. Minami K, Kurban APA, Khalil CN, Kuchpil C. Ensuring Flow and Production in Deepwater
Environments.Offshore Technology Conference, Houston Texas. 1999; OTC 11035.
2. Cochran S. Hydrate Control and Remediation Best Practices in Deepwater Oil Developments. Offshore
Technology Conference, Houston Texas. 2003; OTC 15255.
3. Reed RL, Neumann DL, Oelfke RH, Young ND. Some Preliminary Results from a Pilot-Size Hydrate Flow
Loop. Annals of the New York Academy of Sciences. 1994; 175: 430-446.
4. Matthews PN, Notz PK, Widener MW, Prukop G. Flow Loop Experiments Determine Hydrate Plugging
Tendencies in the Field. Annals of the New York Academy of Sciences. 2000; 912: 330-338.
5. Sloan D. Natural Gas Hydrates in Flow Assurance. Amsterdam Elsevier 2011: 13-35.
6. Di Lorenzo M, Seo Y, Sanchez G. The CSIRO’s hydrates flow loop as a tool to investigate hydrate
behaviour in gas dominant flows. Proceedings of the 7th International Conference on Gas Hydrates,
Edinburgh, Scotland, UK, 2011.
7. Beggs HD, Brill JP. A study of two phase flow in inclined pipes. Journal of Petroleum Technology,
Transactions 1973; 25: 607-617.
8. Sloan D. Natural Gas Hydrates in Flow Assurance. Amsterdam Elsevier 2011: 22-31.
9. Ballard AL. Flow-Assurance Lessons: The Mica Tieback. Offshore Technology Conference, Houston
Texas, 2006; OTC 18384.
10. Lingelem MN, Majeed AI, Stange E. Industrial Experience in Evaluation of Hydrate Formation,
Inhibition and Dissociation in Pipeline Design and Operation. Annals of New York Academy of
Sciences. 1994; 715: 75-93.
11. Dorstewitz F, Mewes D. The Influence of Heat Transfer on the Formation of Hydrate Layers in Pipes.
Int. J. Heat Mass Transfer 1994; 37: 2131-2137.
12. Nicholas J.W. A modelling approach to hydrate wall growth and sloughing in a water saturated gas
pipeline. Proceedings of the 6th International Conference on Gas Hydrates Vancouver, British
Columbia, Canada, 2008.


24 | Report Title
CONTACT US
t 1300 363 400
+61 3 9545 2176
w www.csiro.au
YOUR CSIRO
Australia is founding its future on
science and innovation. Its national
science agency, CSIRO, is a powerhouse
of ideas, technologies and skills for
building prosperity, growth, health and
sustainability. It serves governments,
industries, business and communities
across the nation.
FOR FURTHER INFORMATION
Division/Unit Name
Jonathan Bates
t +61 3 9123 4567
w www.csiro.au/businessunit-flagshipname
Division/Unit Name
Jonathan Bates
t +61 3 9123 4567
w www.csiro.au/businessunit-flagshipname
Division/Unit Name
Jonathan Bates
t +61 3 9123 4567
w www.csiro.au/ businessunit-flagshipname