Embed Size (px)
Citation preview

1
EXPERIMENTAL STUDY OF THE EFFECTS OF TEMPERATURE VARIATION ON DROPLET SIZE AND WETNESS FRACTION IN
A LOW PRESSURE MODEL STEAM TURBINE
Timo Eberle, Markus Schatz, Jörg Starzmann, Marius Grübel and Michael Casey*
Institute of Thermal Turbomachinery and Machinery Laboratory (ITSM), University of Stuttgart, Pfaffenwaldring 6, 70569 Stuttgart, Germany
[email protected] *Also at PCA Engineers, Lincoln, England
ABSTRACT The three stage low pressure model steam turbine at the Institute of Thermal
Turbomachinery (ITSM) was used to study the impact of three different steam inlet temperatures on the homogeneous condensation process and the resulting wetness topology. The droplet spectrum as well as the particle number concentration was measured in front of the last stage using an optical-pneumatic probe.
At design load, condensation starts inside the stator of the second stage. A change in the steam inlet temperature is able to shift the location of condensation onset within the blade row up- or downstream and even into adjoining blade passages, which leads to significantly different local droplet sizes and wetness fractions due to different local expansion rates.
The measured results are compared to steady 3-D CFD calculations. The predicted nucleation zones could be largely confirmed by the measurements. Although the trend of measured and calculated droplet size across the span is satisfactory, there are considerable differences between the measured and computed droplet spectrum and wetness fractions.
NOMENCLATURE 𝑐 absolute velocity (m/s) 𝑐𝑁 rel. number concentration (-) 𝑐𝑉 rel. volume concentration (-) 𝐷 droplet diameter (m) ℎ specific enthalpy (J/kg) 𝐼 light intensity (counts) �̇� mass flow (kg/s) 𝑝 pressure (Pa) �̇� expansion rate = −(1 𝑝⁄ ) ∙ (d𝑝 d𝑡⁄ ) 𝑠 specific entropy (J/kgK) 𝑇 temperature (K) 𝑦 liquid mass fraction (-) Greek symbols 𝜌 density (kg/m³)
Subscr ipts 0 reference 1 case 1(TDL2 case 2 (T
+10K) DL
3 case 3 (T)
DL20 upstream of stator 2
-10K) nd
21 upstream of rotor 2 stage
nd
30 upstream of stator 3 stage
rd
32 Sauter mean stage
𝐶𝐹𝐷 from CFD results 𝑐𝑜𝑛 condenser 𝐷𝐿 design load 𝐸 plane 𝑖ℎ isenthalpic 𝑖𝑛 inlet 𝑟𝑒𝑓 reference 𝑠 static (pressure) 𝑠𝑎𝑡 saturation 𝑡𝑜𝑡 stagnation (pressure)
Proceedings of
10th European Conference on Turbomachinery Fluid dynamics & Thermodynamics
ETC10, April 15-19, 2013, Lappeenranta, Finland
OPEN ACCESS
Downloaded from www.euroturbo.eu Copyright © by the Authors
2
INTRODUCTION In almost all low pressure steam turbines dry superheated steam is expanded below saturation
conditions leading to wetness fractions of 8% to 16% at the turbine outlet. The wetness formation and the emerging two-phase flow cause additional energy dissipation, the so-called wetness losses. The main wetness losses are the thermodynamic relaxation loss due to irreversible heat transfer between the phases especially in the Wilson-zone, the kinematic relaxation loss due to friction between the vapor phase and the droplets and the braking loss due to large primary droplets and coarse water droplets. Baumann (1912) was the first who attempted to correlate the additional losses to the steam wetness, stating that the turbine efficiency decreases by one percent for each one percent variation in wetness. However, more detailed theoretical investigations, such as the still outstanding work of Gyarmathy (1962) or the more recent work of Laali (1991) show that the magnitude of these losses is not only dependent on the mean wetness but also on the size of the droplets generated. This result is confirmed by current numerical studies, e.g. by Starzmann et al. (2012).
The size and number of droplets formed strongly depends on the expansion rate and the subcooling at the Wilson-point. This is the thermodynamic state where enough stable nuclei are formed resulting in rapid condensation and break-down of the subcooling.
For turbine designers it is difficult to exactly determine in advance the location of condensation onset during the expansion process, and thus the efficiency loss caused by droplet formation and successive growth, especially when the turbine is operated at different operating points. Changing the turbine inlet conditions, especially turbine inlet temperature, affects the course of steam subcooling and hence the location as well as the thermodynamic state at which condensation sets in. This in turn directly influences the thermodynamic relaxation loss occurring. In addition, the size and number of the droplets formed can also change, resulting in different kinematic and braking losses. In order to predict these losses, numerical modeling of nucleating and condensing steam flow becomes more and more important. However, the validation of the results is generally based on data from nozzle experiments which do not show highly unsteady phenomena such as trailing edge wakes, secondary and corner flows or boundary layer transition which are commonly found in steam turbines.
From this point of view it is quite obvious that different turbine designs with different expansion rates will lead to different wetness loss characteristics for the same steam wetness at the turbine outlet.
The objective of the research presented in this paper is to investigate how strong the variation of steam temperature at the inlet at constant mass flow and condenser pressure affects the nucleation and condensation process and the resulting droplet sizes under real conditions in a low pressure model steam turbine and to provide validation data for CFD-simulations. For this reason wetness and droplet size have been measured in front of the last stage using a miniature optical-pneumatic probe developed at ITSM which is based on the light extinction method. With the help of the experimental data the location of condensation onset for three different inlet temperatures is assessed. In addition, the results are compared to numerical steady-state calculations of non-equilibrium steam flow which have been carried out using the same mass flow rate, inlet temperatures and condenser pressure.
The paper first introduces the model steam turbine test rig and describes the inlet conditions that have been investigated. This is followed by the characterization of the optical-pneumatic probe used for the measurements and the description of the experimental and numerical setup. The last section discusses the results and attempts to put them into the context of nucleating steam in LP turbines.
MODEL STEAM TURBINE TEST RIG The steam turbine operated at ITSM is a three stage low pressure turbine whose last stage
blading is a 1:4.2-scale model of a last stage blading used in power plants. For a more detailed description of the test rig, see e.g. Sigg et al. (2009) or Heinz et al. (2010). A sectional view of the
3
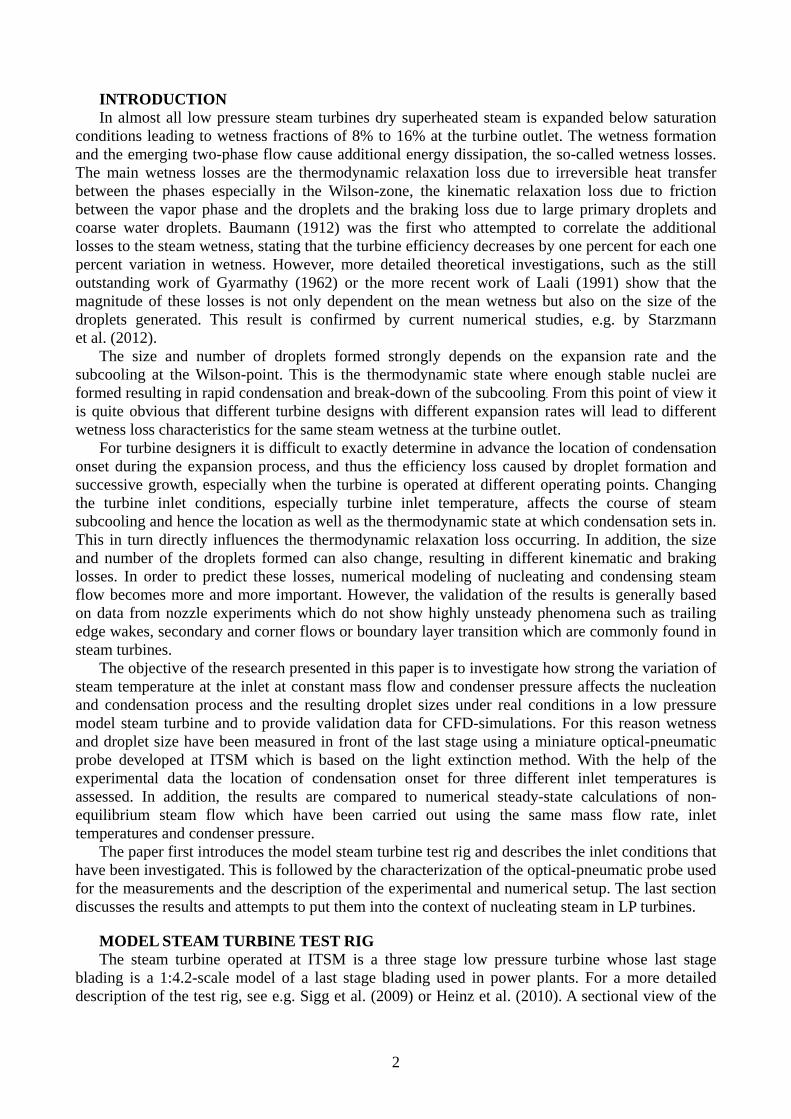
test rig is given in Figure 1. For the work presented, the measurements have been done in plane E30 in front of the last stage guide vane.
The live steam is supplied by the university cogeneration plant. In order to get inlet steam conditions typical of that present in full scale low pressure turbines, the superheated steam is throttled to obtain the desired total pressure and then cooled down by water injection to control the inlet temperature. Both installations are sufficiently distant from the turbine inlet to en-sure that the overall injected water is completely evaporated in front of the first stage. The turbine inlet steam conditions can be controlled in a temperature range from T = 393 K to 523 K and a pressure range from p = 0.15 MPa to 0.6 MPa at mass flow rates of �̇� = 1.7 kg/s to 12.5 kg/s. All aerodynamic and thermodynamic conditions of the flow through the turbine correspond to those present in large LP turbines except for the different Reynolds-numbers and expansion rates. The latter differ by the scale factor and thus are higher in model steam turbines.
OPTICAL-PNEUMATIC PROBE For measurements in the model steam turbine, a miniature optical-pneumatic probe which
allows to determine droplet size, steam quality and flow field at the same time was developed and qualified at ITSM (Schatz 2012). The optical measurement is based on the light extinction method
which has become established for measurements in wet steam flow of low pressure turbines over the last decades. The method was first used in the early 1970s by Walters (1973) in wet steam flows and has been continuously improved and modified by Walters and other researchers ever since (Walters and Skingley, 1979; Petr and Kolovratnik, 1997; Seibold and Stetter, 2001). In a previous paper by the authors (Schatz and Eberle, 2012) the reliability of the measurements in the LP model steam turbine using the miniature probe was demonstrated and the limitations of the probe and the method were discussed. Whereas the optical measurements give information about the droplet sizes and their number concentration, the pressure measurements are necessary to obtain the thermodynamic state and flow
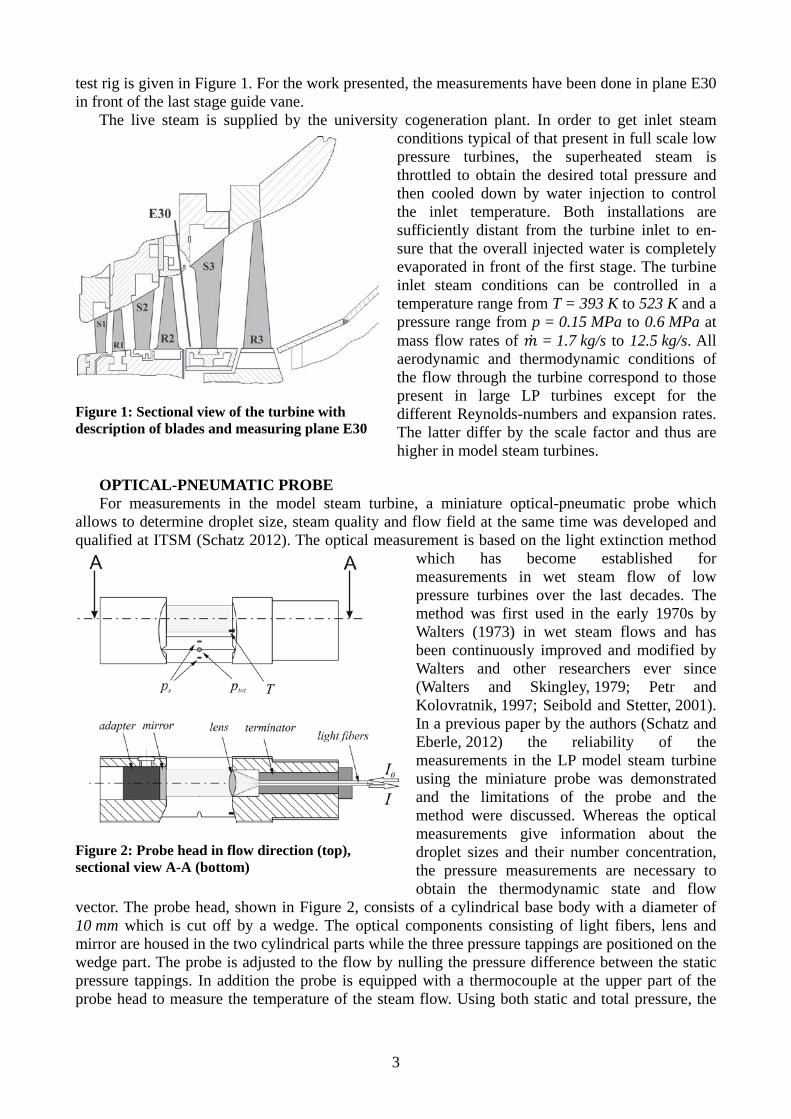
vector. The probe head, shown in Figure 2, consists of a cylindrical base body with a diameter of 10 mm which is cut off by a wedge. The optical components consisting of light fibers, lens and mirror are housed in the two cylindrical parts while the three pressure tappings are positioned on the wedge part. The probe is adjusted to the flow by nulling the pressure difference between the static pressure tappings. In addition the probe is equipped with a thermocouple at the upper part of the probe head to measure the temperature of the steam flow. Using both static and total pressure, the
Figure 1: Sectional view of the turbine with description of blades and measuring plane E30
Figure 2: Probe head in flow direction (top), sectional view A-A (bottom)

4
local absolute flow velocity c and thus the local Mach number can be determined. In this respect it has to be mentioned that the measured total pressure and hence the local Mach number are considered to correspond to the “frozen” state, i.e. referring to the vapor conditions and not to equilibrium conditions. Based on the calculations of Guha (1998) the corresponding error occurring due to this assumption has been estimated to be less than 2% for total pressure and less than 4% in terms of Mach number for a droplet size of 0.2 µm at a local wetness y of up to 5% within the Mach number range encountered at the measurement location (Schatz 2012). The contribution of the liquid phase to the measured total conditions becomes less for larger droplets.
For the optical measurements, a wavelength range of 400 - 600 nm has been used, which allows to resolve droplets reliably down to diameters of about 0.15 - 0.2 µm. The integration time of the spectrometer used was about 10-2
EXPERIMENTAL AND NUMERICAL SETUP
s, thus spanning approximately 2 - 4 rotor revolutions.
Regarding the blade height in plane E30 and the dimensions of the optical volume of the probe, it is possible to measure at 14 radial positions equally spaced from about 10% to 94% span. At design load the turbine inlet temperature is TDL
Table 1
. In the course of the study the inlet temperature has been increased by 10 K and 20 K and decreased by 10 K at constant mass flow and condenser pressure. An overview of the test days and the average main operating parameters together with the maximum deviations during the measurements is given in in the appendix. The condenser pressure is in the range of pressures usually encountered in steam power plants. Every traverse has been done at least twice for every temperature variation and the measurements have been carried out on at least two different days except for the measurements at the lower temperature. In the next section the experimental results are presented. Due to reasons of confidentiality, all results of pressure and temperature measurements are normalized in this paper.
The test rig has been used for extensive numerical studies of the non-equilibrium condensing steam flow. The numerical model that has been applied is part of the commercial Euler-Euler multi-phase flow solver ANSYS CFX and has been enhanced by different user defined nucleation and droplet growth models. Detailed information about the conservation equations for the gaseous and liquid phases can be found in Starzmann et al. (2012). With respect to the conclusions of Starzmann et al. (2011) pure homogeneous nucleation is assumed. For droplet growth modeling the well known model of Young (1982) is used. From calculations of different 1D and 2D test cases it was found that the best agreement with measured droplet sizes can be obtained with a value of 𝛼 = 9 for the correction factor used in the model. Droplet slip is neglected; hence turbulence modeling (SST-model) is only applied to the vapor phase.
A special feature of the ANSYS non-equilibrium steam (NES) approach is the possibility to define several liquid phases that nucleate in a specific simulation domain. This kind of droplet modeling is called “source specific droplet representation” because the information about the origin of a mono-dispersed droplet class and its growing in size is retained. In the present model of the ITSM three-stage turbine the liquid phase P1 represents all droplets which emerge in the domains S1 to S2 and phase P2 contains only droplets formed in R2 (see Figure 1). Droplets of both phases continue to grow in the downstream blade rows.
The numerical grid has already been used in previous studies and comprises about 1.6 million hexahedral elements with an O-grid topology around the blades. It was found that such a grid resolution is enough for a correct prediction of the circumferentially averaged flow field (see Starzmann et al., 2011). The CFD results presented in the present paper are obtained by steady 3D calculations with mixing planes between the stators and the rotors.
RESULTS AND DISCUSSION Figure 3 shows the measured static (a) and total (b) pressure for the inlet temperature at design
load TDL (referred to as case 2) and the modified cases with TDL +10K (case 1) and TDL -10K (case 3). The results of the measurements at an inlet temperature of TDL +20K will not be shown here, as the steam is still superheated behind the second stage in plane E30. The results of the
5
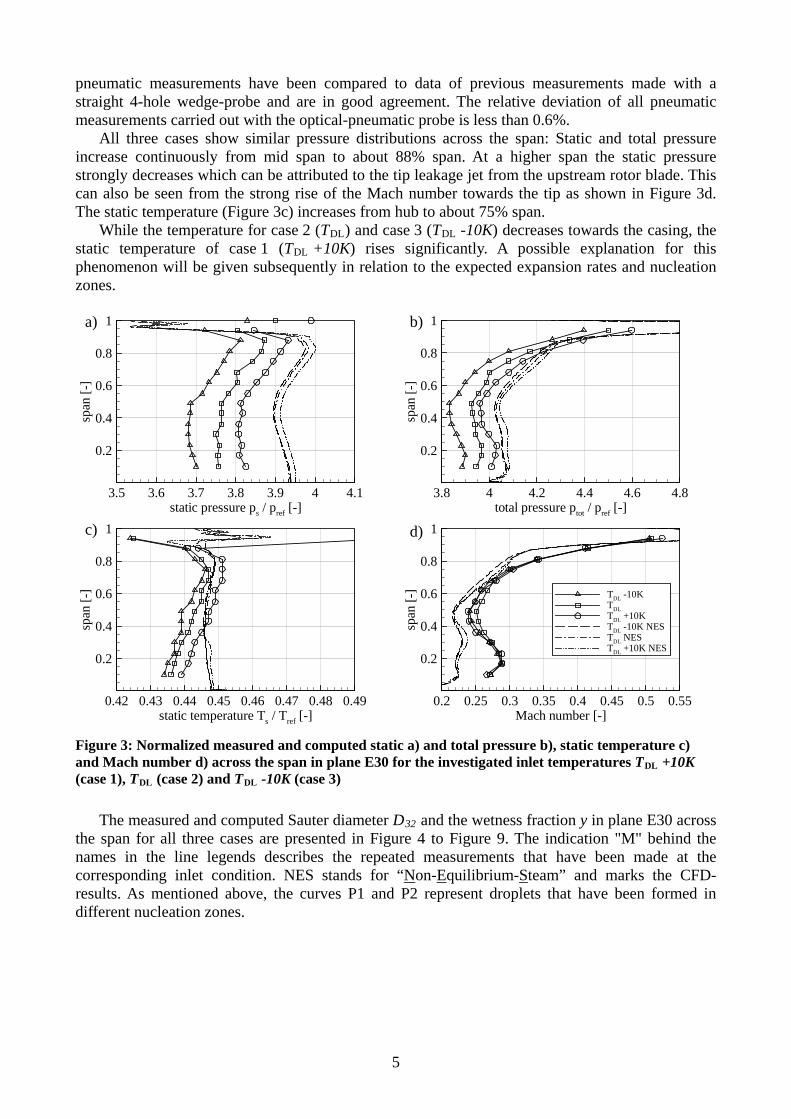
pneumatic measurements have been compared to data of previous measurements made with a straight 4-hole wedge-probe and are in good agreement. The relative deviation of all pneumatic measurements carried out with the optical-pneumatic probe is less than 0.6%.
All three cases show similar pressure distributions across the span: Static and total pressure increase continuously from mid span to about 88% span. At a higher span the static pressure strongly decreases which can be attributed to the tip leakage jet from the upstream rotor blade. This can also be seen from the strong rise of the Mach number towards the tip as shown in Figure 3d. The static temperature (Figure 3c) increases from hub to about 75% span.
While the temperature for case 2 (TDL) and case 3 (TDL -10K) decreases towards the casing, the static temperature of case 1 (TDL
+10K) rises significantly. A possible explanation for this phenomenon will be given subsequently in relation to the expected expansion rates and nucleation zones.
Figure 3: Normalized measured and computed static a) and total pressure b), static temperature c) and Mach number d) across the span in plane E30 for the investigated inlet temperatures TDL +10K (case 1), TDL (case 2) and TDL
-10K (case 3)
The measured and computed Sauter diameter D32Figure 4
and the wetness fraction y in plane E30 across the span for all three cases are presented in to Figure 9. The indication "M" behind the names in the line legends describes the repeated measurements that have been made at the corresponding inlet condition. NES stands for “Non-Equilibrium-Steam” and marks the CFD- results. As mentioned above, the curves P1 and P2 represent droplets that have been formed in different nucleation zones.
static pressure ps / pref [-]
span
[-]
3.5 3.6 3.7 3.8 3.9 4 4.1
0.2
0.4
0.6
0.8
1
total pressure ptot / pref [-]
span
[-]
3.8 4 4.2 4.4 4.6 4.8
0.2
0.4
0.6
0.8
1
static temperature Ts / Tref [-]
span
[-]
0.42 0.43 0.44 0.45 0.46 0.47 0.48 0.49
0.2
0.4
0.6
0.8
1
Mach number [-]
span
[-]
0.2 0.25 0.3 0.35 0.4 0.45 0.5 0.55
0.2
0.4
0.6
0.8
1
TDL -10KTDLTDL +10KTDL -10K NESTDL NESTDL +10K NES
a) b)
c) d)

6
Results of case 1 (TDLThe measured droplet sizes for case 1 show different distributions across the span (
+10K) Figure 4 a).
While measurement M1 and M3 yield Sauter diameters between 0.3 µm and 0.4 µm, the diameter for measurement M2 and M4 (which have been measured at the same day as M3) is much larger around mid span and achieves values up to 0.7 µm which is also predicted by CFD for P1 (Figure 4c). In contrast to this, there is hardly any variation in wetness between the measurements except for minor variations near the hub, as can be seen in Figure 4b. The wetness fraction at 10% span is about 3% (except for M1, which is at about 5%), decreases towards mid span to very low values of about 0.5% and does not get above 1.5% up to the casing. The mass-flow averaged wetness for this case is y1 = 1.1%, compared to a predicted wetness of y1,CFD
= 2.87%. Comparing the experimental results to numerical data, it can be seen that there is good agreement in terms of wetness for the wetness computed within P1 (i.e. the wetness formed up to S2). The wetness predicted to be formed in R2 (NES P2) cannot be identified from the measurements.
Although it is to be expected that measurements made at the same inlet conditions feature the
same radial distribution of wetness as the thermodynamic state of the wet steam must be the same, this very good match is quite surprising with regard to the different Sauter diameters measured. As a consequence, the variation of the measured D32
In order to investigate the differences in the measured Sauter diameters, the droplet size distribution of M1 and M2 measured at 62% span is plotted in
can definitely not be attributed to erroneous measurements; instead there must have been different droplet spectra during the measurements.
Figure 5 as an example. Both distributions include small droplets with diameters of about 0.3 µm but while the droplet spectrum of M1 is monomodal, that of M2 also shows large droplets with 0.9 µm in diameter. Although small in relative number concentration, this leads to a significantly larger relative volume concentration (about cV
= 0.82), giving a larger Sauter mean diameter for M2.
Figure 4: a) Variation of measured Sauter diameter 𝑫𝟑𝟐 across the span in plane E30 for the inlet temperature TDL
droplet diameter D32 [µm]
span
[-]
0.2 0.4 0.6 0.8
0.2
0.4
0.6
0.8
1.0
+10K (case 1) b) Measured and computed wetness fraction c) Comparison of measured Sauter diameters of measurement M1 and M2 and computed droplet size (NES)
wetness y [-]
span
[-]
0.00 0.02 0.04 0.06 0.08 0.10
0.2
0.4
0.6
0.8
1.0
TDL +10K M1TDL +10K M2TDL +10K M3TDL +10K M4NES P1NES P2
droplet diameter D32 [µm]
span
[-]
0.0 0.2 0.4 0.6 0.8 1.0
0.2
0.4
0.6
0.8
1.0
a) b)
c)

7
It seems that the steam is at least partly already supersaturated near the trailing edge of S2 and
minor nucleation starts generating only a small number of large droplets before further expansion at high expansion rates takes place in R2. This leads to sufficient subcooling to reach the Wilson-point
at which the large number of smaller droplets is formed. Considering the good match of experimental and numerical data with regard to P1 in Figure 4c, it has to be kept in mind that P1 actually describes a monomodal distribution instead of the bimodal distribution that has been measured. As can be seen from the measure-ments, there is hardly any wetness near the casing (Figure 4b). In this context, the high temperature at the casing for case 1 (Figure 3c), which has been mentioned earlier, can be explained by the fact that the tip jet across R2 is still superheated as condensation towards the tip first starts inside the blade row of R2. The course of expansion is shown in Figure 6. While the expansion across the blade row of rotor R2 leads to the saturation temperature Tsat, the expansion of the tip jet is
isenthalpic and causes a higher temperature Tih
Results of case 2 (T
in plane E30. What can be deduced from this is that the nucleation onset for case 2 and case 3, which show a lower temperature at saturation conditions towards the casing, takes place earlier in an upstream blade passage. This assumption can be confirmed in the following discussion.
DLFor the design inlet temperature five measurements and the results of the numerical calculations
are shown in
)
Figure 7. Again, there are two different distributions of Sauter diameter across the span. While the measurements M3 to M5 show Sauter diameters of 0.45 µm to 0.4 µm from 17% to 50% span, measurements M1 and M2 have smaller Sauter diameters (0.3 µm) in the same span range. As for case 1, there is very good agreement between the measured wetness up to about 80% span despite the differences in Sauter diameter. However, towards the casing there are some considerable differences between the measured local wetness values. Especially measurements M3 to M5 (all made at the same day) show an enormous increase of wetness and Sauter diameter towards the tip which cannot be explained by condensation. As a matter of fact, the span height at which the differences become noticeable coincides with the extent of the backward facing step across R2 directly upstream of the measurement location (see Figure 1). This indicates an interaction between condensation and the recirculation zone due to the backward facing step and possibly with the tip jet across S2, which appears to be a very complex phenomenon.
Figure 5: Relative number concentration of droplets as a function of the droplet diameter for M1 and M2 of case 1 at 62% span
Figure 6: Schematic course of expansion in the second stage for case 1 inside the blade row (solid) and across the tip clearance (dashed)
droplet diameter [µm]
rel.
num
berc
once
ntra
tion
c N[-
]
0.0 0.2 0.4 0.6 0.8 1.0
0.2
0.4
0.6
0.8
1.0TDL +10K M1TDL +10K M2
62% span
pE20
pE21
pE30
+10K S 2
R 2
x = 1
h
s
Tih
Tsat
tip jet
8
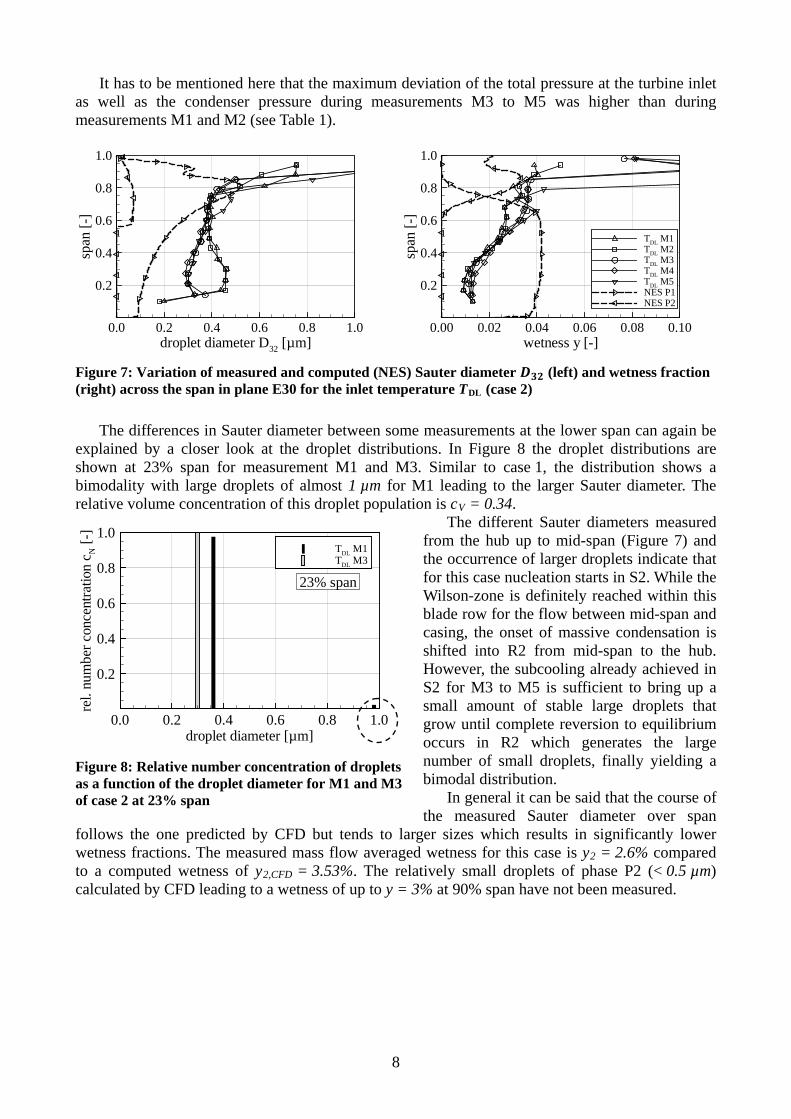
It has to be mentioned here that the maximum deviation of the total pressure at the turbine inlet as well as the condenser pressure during measurements M3 to M5 was higher than during measurements M1 and M2 (see Table 1).
Figure 7: Variation of measured and computed (NES) Sauter diameter 𝑫𝟑𝟐 (left) and wetness fraction (right) across the span in plane E30 for the inlet temperature TDL
(case 2)
The differences in Sauter diameter between some measurements at the lower span can again be explained by a closer look at the droplet distributions. In Figure 8 the droplet distributions are shown at 23% span for measurement M1 and M3. Similar to case 1, the distribution shows a bimodality with large droplets of almost 1 µm for M1 leading to the larger Sauter diameter. The relative volume concentration of this droplet population is cV
The different Sauter diameters measured from the hub up to mid-span (
= 0.34.
Figure 7) and the occurrence of larger droplets indicate that for this case nucleation starts in S2. While the Wilson-zone is definitely reached within this blade row for the flow between mid-span and casing, the onset of massive condensation is shifted into R2 from mid-span to the hub. However, the subcooling already achieved in S2 for M3 to M5 is sufficient to bring up a small amount of stable large droplets that grow until complete reversion to equilibrium occurs in R2 which generates the large number of small droplets, finally yielding a bimodal distribution.
In general it can be said that the course of the measured Sauter diameter over span
follows the one predicted by CFD but tends to larger sizes which results in significantly lower wetness fractions. The measured mass flow averaged wetness for this case is y2 = 2.6% compared to a computed wetness of y2,CFD
= 3.53%. The relatively small droplets of phase P2 (< 0.5 µm) calculated by CFD leading to a wetness of up to y = 3% at 90% span have not been measured.
droplet diameter D32 [µm]
span
[-]
0.0 0.2 0.4 0.6 0.8 1.0
0.2
0.4
0.6
0.8
1.0
wetness y [-]
span
[-]
0.00 0.02 0.04 0.06 0.08 0.10
0.2
0.4
0.6
0.8
1.0
TDL M1TDL M2TDL M3TDL M4TDL M5NES P1NES P2
Figure 8: Relative number concentration of droplets as a function of the droplet diameter for M1 and M3 of case 2 at 23% span
droplet diameter [µm]
rel.
num
berc
once
ntra
tion
c N[-
]
0.0 0.2 0.4 0.6 0.8 1.0
0.2
0.4
0.6
0.8
1.0TDL M1TDL M3
23% span

9
Results of case 3 (TDLThe results of the measurements carried out at an inlet temperature of T
-10K) DL
Figure 9 -10K (case 3) are
shown in . In contrast to the other cases, the measurements were done on the same day. For this case, the measured Sauter diameters from hub to about 70% span confirm the calculated results, however, the mass flow averaged wetness measured (y3 = 3.3%) is definitely lower as the calculated wetness, which is y3,CFD
= 4.1%.
Figure 9: Variation of measured and computed (NES) Sauter diameter 𝑫𝟑𝟐 (left) and wetness fraction (right) across the span in plane E30 for the inlet temperature TDL
-10K (case 3)
The reason for this is the droplet concentration measured which is about 40 to 50 times lower than the droplet concentration predicted by CFD. This seems to be a lot, but, with regard to the
formulation of the nucleation rate (see e.g. Frenkel, 1955), a slight variation in the supersaturation leads to significantly different nucleation rates and thus droplet concentrations. In addition, the critical droplet radius changes as well. As a consequence, the Wilson-zone must have been reached at lower subcooling compared to the numerical simulations. Furthermore, the CFD results seem to underrate the losses throughout the upstream turbine stages which is reflected in the higher static pressure and higher wetness computed.
The match between the wetness of both measurements is quite good, although not as good as for case 1 and 2. Again, there are larger differences towards the tip, which
coincides with the increase of Sauter diameter. Both measurements feature monomodal droplet spectra as shown in Figure 10 at 81% span. This indicates that the subcooling state as well as the Wilson-zone was reached within S2 across the whole span.
droplet diameter D32 [µm]
span
[-]
0.0 0.2 0.4 0.6 0.8 1.0
0.2
0.4
0.6
0.8
1.0
wetness y [-]sp
an[-
]
0.00 0.02 0.04 0.06 0.08 0.10
0.2
0.4
0.6
0.8
1.0
TDL -10K M1TDL -10K M2NES P1NES P2
Figure 10: Relative number concentration (left) and volume concentration (right) of droplets as a function of the droplet diameter for M1 and M3 of case 3 at 23% span
droplet diameter [µm]
rel.
num
berc
once
ntra
tion
c N[-
]
0.0 0.2 0.4 0.6 0.8 1.0
0.2
0.4
0.6
0.8
1.0TDL -10K M2TDL -10K M1
81% span

10
CONCLUSIONS The LP model steam turbine at ITSM has been operated at three different inlet steam
temperatures. The flow field as well as the droplet spectrum and the wetness fraction have been measured behind the second stage using an optical-pneumatic probe. It was found that for an inlet temperature of 20 K above design temperature TDL
, the steam is still superheated after the second stage so that condensation onset is expected in the last stage. An inlet temperature of 10 K above design temperature (case 1) supposedly leads to a beginning of nucleation inside the stator blade row S2 roughly from mid-span towards the hub while the Wilson-zone is then reached within R2 across the whole span; however, higher wetness is formed near the hub. At design load temperature nucleation is expected to start entirely in the stator S2.
While the Wilson-zone is also located in S2 for the flow between about mid-height and casing, massive condensation starts in R2 for the lower part of the flow channel. However, droplets already formed within S2 grow up to this point and lead to the bimodal droplet spectra shown. A further decrease of the inlet temperature to 10 K below design load temperature apparently moves the beginning of condensation completely into S2 across the whole span. From the droplet diameters measured for case 3 it can be concluded that the Wilson-zone is located at higher expansion rates which are responsible for the formation of smaller droplets.
The fact that repeated measurements – some even at the same day – yield the same thermodynamic state of the steam flow at the measurement location, while the corresponding droplet spectra show distinct differences such as the appearance of a population of large droplets indicates that the process of nucleation and subsequent condensation is very sensitive to even small disturbances.
The measured course of expansion and the nucleation zones deduced from the measurements are shown in Figure 11 and Figure 12. With regard to the results of the investigated inlet temperatures of case 1 and case 2, it cannot be excluded that the relatively small droplets predicted by CFD for the liquid phase originating upstream of rotor R2 actually do exist. If they appear only in low number concentrations, it is quite possible that they are masked by larger droplets and thus cannot be detected by the light extinction method.
ACKNOWLEDGEMENTS AND REMARKS The authors would like to thank Dipl.-Ing. Fabian Müller for his help during the measurements
at the model steam turbine as well as all ITSM laboratory staff for their outstanding work.
Figure 11: Schematic course of expansion of all investigated cases in the enthalpy-entropy-diagram
Figure 12: Axial cross section with assumed locations of nucleation onset for case 1 (light grey), case 2 (grey) and case 3 (dark grey)
pin tot DL
pE20
pE30 DL
pkon
+20K+10K
DL-10Ksta
ge 1
stage
2
stage
3
x = 1
h
s
11
REFERENCES Baumann, K., (1912), Recent developments in steam turbine practice, J. Inst. Electr. Eng.,
Vol . 48(213), pp. 768-842 Frenkel, J., (1955), Kinetic theory of liquids, Dover Publications, New York Guha, A., (1998), A unified theory for the interpretation of total pressure and temperature in
two-phase flows at subsonic and supersonic speeds, Proc. R. Soc. Lond. A., Vol. 454, pp. 671-695 Gyarmathy, G., (1962), Grundlagen einer Theorie der Naßdampfturbine, in German, Doctoral
Thesis, ETH Zürich, Juris Verlag Zürich Heinz, C., Schatz, M., Casey, M. V. and Stüer, H., (2010), Experimental and analytical
investigations of a low pressure model steam turbine during forced response excitation, Proc. of ASME Turbo Expo 2010, GT2010-22146
Laali A. R., (1991), A new approach for assessment of the wetness losses in steam turbines, IMechE paper C423/014
Petr, V. and Kolovratnik, M., (1997), Contribution to the wet steam flow problems in LP steam turbines, Proc. 2nd
Schatz, M. and Casey, M. V., (2006), Design and testing of a new miniature combined optical/pneumatic wedge probe for the measurement of steam wetness, Proc. AIP Conf., Vol. 914, pp. 464-479
ETC, Antwerpen
Schatz, M. (2012), Determination of the composition of the two-phase-flow in low-pressure steam turbines based on the light extinction method, in German, Doctoral Thesis, University of Stuttgart
Schatz, M. and Eberle, T., (2012), Experimental study of steam wetness in a model steam turbine rig – presentation of results and comparison to CFD-data, Baumann Centenary Conf., Cambridge
Seibold, A. and Stetter, H., (2001), Investigating condensation process in low pressure turbines with an improved optical probe, Proc. Int. Joint Power Gen. Conf., Vol. 2, pp. 291-300
Sigg, R., Heinz, C., Casey, M. V. and Sürken, N., Numerical and experimental investigation of a low-pressure steam turbine during windage, Proc. IMechE, Vol. 223 Part A, JPE826
Starzmann, J., Casey, M. V., Mayer, J. F. and Sieverding, F., (2012), Wetness Loss Prediction for a Low Pressure Stream Turbine using CFD, Baumann Centenary Conf., Cambridge
Starzmann, J., Schatz, M., Casey, M. V., Mayer, J. F. and Sieverding, F., (2011), Modelling and validation of wet steam flow in a low pressure steam turbine, Proc. of ASME Turbo Expo 2011
Tatsuno, K. and Nagao, S., (1986), Water droplet size measurements in an experimental steam turbine using and optical fiber droplet sizer, J. Heat Trans., Vol. 108, pp. 939-945
Walters, P. T., (1973), Optical measurements of water droplets in wet steam flows, IMechE Conf. Publ., ‘Wet Steam 4’, Warwick
Walters, P. T. and Skingley, P. C., (1979), An optical instrument for measuring the wetness fraction and droplet size of wet steam flows in LP turbines, Proc. IMechE, Part C, Vol. 141(79), pp. 337-348
Young, J. B. (1982), The spontaneous condensation of steam in supersonic nozzles, Physic-Chemical Hydrodynamics, Vol. 3(1), pp. 57–82

12
APPENDIX: Table 1: Overview of test days, average main operating parameters and maximum deviations during the measurements
Figure 13: Simplified expansion rates along a streamline starting backwards from the trailing edge of S2 at 20%, 50% and 80% span
streamwise location [-]
expa
nsio
nra
teP
[1/s
]
-5000
0
5000
10000
1500080% span
S2 R2R1
streamwise location [-]
expa
nsio
nra
teP
[1/s
]
-5000
0
5000
10000
1500050% span
streamwise location [-]
expa
nsio
nra
teP
[1/s
]
-5000
0
5000
10000
1500020% span