Embed Size (px)
Citation preview
Received: 18 October 2017 Revised: 6 August 2018 Accepted: 21 August 2018
DOI: 10.1002/fam.2676
R E S E A R CH AR T I C L E
Experimental study of tenability during a full‐scale motorcoachtire fire
Erik L. Johnsson | Jiann C. Yang
Engineering Laboratory, National Institute of
Standards and Technology, Gaithersburg,
Maryland
Correspondence
Erik Johnsson, Engineering Laboratory,
National Institute of Standards and
Technology, 100 Bureau Drive, Gaithersburg,
MD 20899.
Email: [email protected]
Funding information
National Highway Traffic Safety
Administration
Official contribution of the National Institute of St
subject to copyright in the United States.
Fire and Materials. 2019;43:131–143.
Summary
Full‐scale fire experiments were conducted at the National Institute of Standards and
Technology (NIST) to investigate tire fire interactions with the passenger compart-
ment of a motorcoach. A single full‐scale experiment with a partially furnished interior
was conducted to investigate tire fire growth within the passenger compartment and
the onset of untenable conditions. A tire fire was initiated using a burner designed to
imitate the frictional heating of hub and wheel metal caused by failed axle bearings,
locked brakes, or dragged blown tires. Measurements of interior and exterior temper-
atures, interior heat flux, heat release rate, toxic gases, and visibility were performed.
Standard and infrared videos and still photographs were also recorded. The results of
this single experiment showed that after fire penetration into the passenger compart-
ment, the tenability limits were reached within 8 minutes near the fire and within
11 minutes throughout the passenger compartment.
KEYWORDS
bus fire, compartment tenability, fire growth, flame spread, motorcoach fire, tire fire, transportation
fires, vehicle fire
1 | INTRODUCTION
Research concerning vehicle fires is important for the prevention of
life and property losses, especially for those vehicles that carry a large
number of passengers. Motorcoaches, which can carry several dozen
passengers, have been of particular interest in the United States since
a motorcoach fire inTexas killed 23 occupants being evacuated from a
nursing home during 2005 Hurricane Rita. Many of the occupants
were not mobile and could not escape before being overcome by
smoke and flames.1 While typically motorcoach and bus fires do not
result in fatalities, they often cause complete loss of the coach and
passenger property.2
The National Highway Traffic Safety Administration (NHTSA)
sponsored the National Institute of Standards and Technology (NIST)
to conduct research to support NHTSA's effort on improving
motorcoach fire safety based on National Transportation Safety Board
andards and Technology not
wileyonlinelibrary.com
(NTSB) recommendations.1 Earlier articles described experimental
research efforts addressing passenger compartment penetration by
tire fires3,4 and potential fire hardening methods.5 The research
described here was intended to assess tenability within the passenger
compartment in the event of a wheel‐well fire.
A full‐scale experiment was conducted to investigate the fire
growth within the passenger compartment after penetration by a tire
fire and to determine the onset of untenable conditions due to the
cumulative effects of heat and toxic gases. For this experiment, the
original rear of the motorcoach was complemented by a constructed
front to recreate a realistic passenger compartment volume, and the
interior was partially furnished to provide fuel for fire spread.
To put the current research in historical context, previous studies
related to bus and motorcoach fires and tenability were presented as a
detailed literature review.3 Although our study focused on wheel‐well
fires, the literature review also covered research related to other types
of bus and motorcoach fires. Understanding of motorcoach fire
development and spread enables the development of an overall fire
mitigation strategy.
© 2018 John Wiley & Sons, Ltd./journal/fam 131
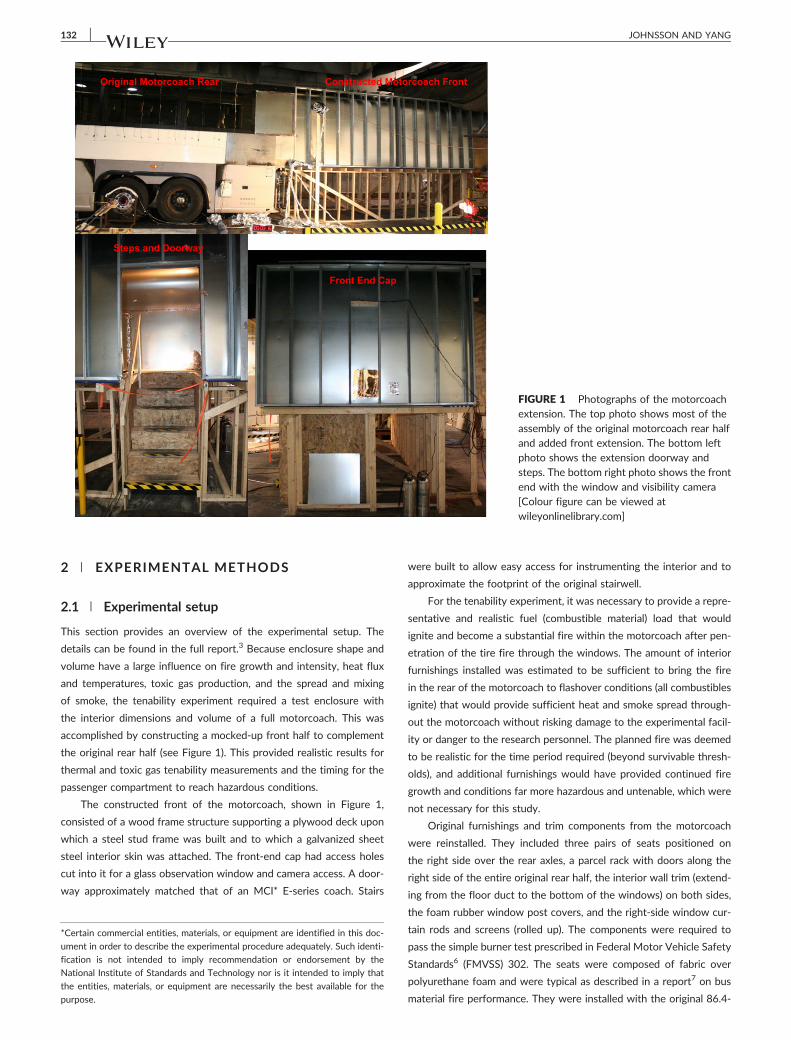
FIGURE 1 Photographs of the motorcoachextension. The top photo shows most of theassembly of the original motorcoach rear halfand added front extension. The bottom leftphoto shows the extension doorway andsteps. The bottom right photo shows the frontend with the window and visibility camera[Colour figure can be viewed atwileyonlinelibrary.com]
132 JOHNSSON AND YANG
2 | EXPERIMENTAL METHODS
2.1 | Experimental setup
This section provides an overview of the experimental setup. The
details can be found in the full report.3 Because enclosure shape and
volume have a large influence on fire growth and intensity, heat flux
and temperatures, toxic gas production, and the spread and mixing
of smoke, the tenability experiment required a test enclosure with
the interior dimensions and volume of a full motorcoach. This was
accomplished by constructing a mocked‐up front half to complement
the original rear half (see Figure 1). This provided realistic results for
thermal and toxic gas tenability measurements and the timing for the
passenger compartment to reach hazardous conditions.
The constructed front of the motorcoach, shown in Figure 1,
consisted of a wood frame structure supporting a plywood deck upon
which a steel stud frame was built and to which a galvanized sheet
steel interior skin was attached. The front‐end cap had access holes
cut into it for a glass observation window and camera access. A door-
way approximately matched that of an MCI* E‐series coach. Stairs
*Certain commercial entities, materials, or equipment are identified in this doc-
ument in order to describe the experimental procedure adequately. Such identi-
fication is not intended to imply recommendation or endorsement by the
National Institute of Standards and Technology nor is it intended to imply that
the entities, materials, or equipment are necessarily the best available for the
purpose.
were built to allow easy access for instrumenting the interior and to
approximate the footprint of the original stairwell.
For the tenability experiment, it was necessary to provide a repre-
sentative and realistic fuel (combustible material) load that would
ignite and become a substantial fire within the motorcoach after pen-
etration of the tire fire through the windows. The amount of interior
furnishings installed was estimated to be sufficient to bring the fire
in the rear of the motorcoach to flashover conditions (all combustibles
ignite) that would provide sufficient heat and smoke spread through-
out the motorcoach without risking damage to the experimental facil-
ity or danger to the research personnel. The planned fire was deemed
to be realistic for the time period required (beyond survivable thresh-
olds), and additional furnishings would have provided continued fire
growth and conditions far more hazardous and untenable, which were
not necessary for this study.
Original furnishings and trim components from the motorcoach
were reinstalled. They included three pairs of seats positioned on
the right side over the rear axles, a parcel rack with doors along the
right side of the entire original rear half, the interior wall trim (extend-
ing from the floor duct to the bottom of the windows) on both sides,
the foam rubber window post covers, and the right‐side window cur-
tain rods and screens (rolled up). The components were required to
pass the simple burner test prescribed in Federal Motor Vehicle Safety
Standards6 (FMVSS) 302. The seats were composed of fabric over
polyurethane foam and were typical as described in a report7 on bus
material fire performance. They were installed with the original 86.4‐
JOHNSSON AND YANG 133
cm (34‐in) spacing in positions corresponding to the second to last row
and the next two rows in front of it. This centered the three pairs of
seats in the anticipated fire breakthrough area. The parcel rack was
installed approximately 12 cm (4 ¾ in) forward of its original position.
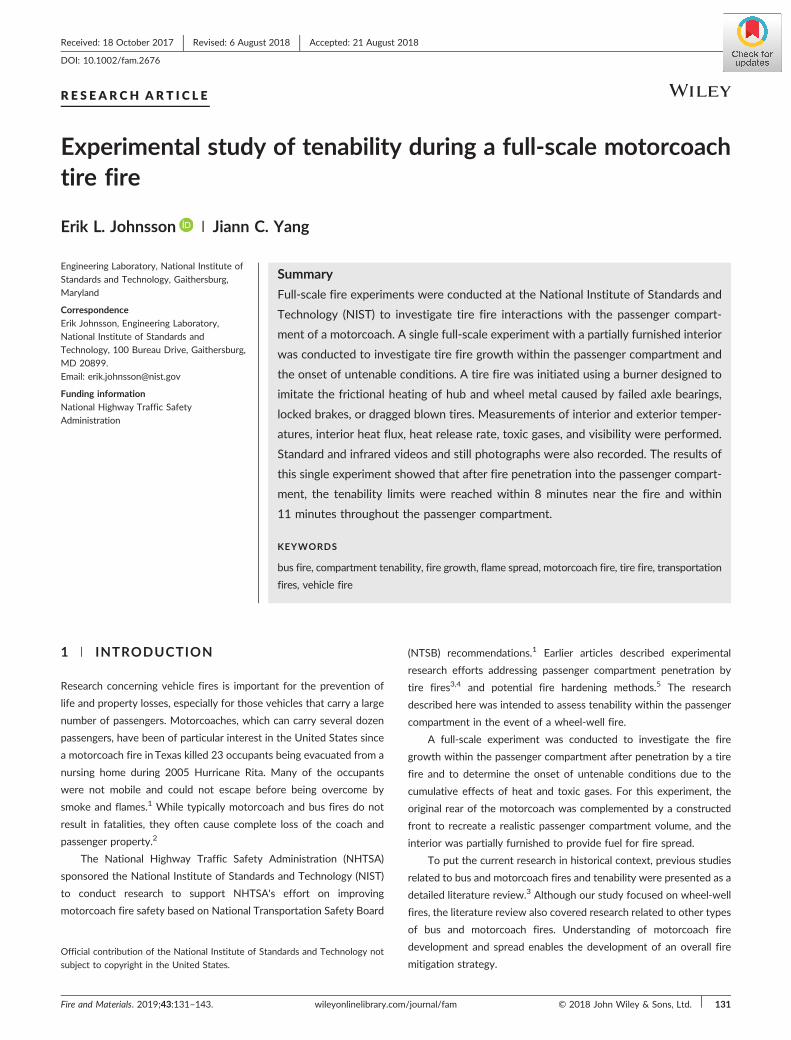
Figure 2 shows a view of the seats installed in the motorcoach, and
Figure 3 shows a parcel rack.
2.2 | Temperature measurements
Thermocouples were positioned inside and around the motorcoach to
monitor structural temperatures as well as to track the tenability of
gas temperatures. Four thermocouples were located behind the exte-
rior side panel to ascertain the thermal penetration through the exte-
rior panel and to help determine if the foam material behind the panel
was at risk for burning. Vertical thermocouple arrays of five thermo-
couples each (180, 150, 120, 60, and 30 cm above the floor) were
installed at rear, middle, and front locations, shown in Figure 4.
Thermocouples were also attached to the top center positions of
the headrests of each of the three aisle seats. Photographs of the
seats and an example of the thermocouple installation are shown in
Figure 2. Thermocouples were attached (with tape) to the parcel rack
doors above each of these headrest thermocouple positions. A
FIGURE 2 Two photographs showing thethree pairs of seats installed for theexperiment. The right photograph shows oneof the thermocouples installed on the top ofan aisle seat headrest [Colour figure can beviewed at wileyonlinelibrary.com]
FIGURE 3 A photograph showing the rightside parcel rack installed for the experiment.Three thermocouples are shown attachedabout half way up the doors [Colour figurecan be viewed at wileyonlinelibrary.com]
photograph of the thermocouples installed on the parcel rack is also
shown in Figure 3.
2.3 | Heat flux measurements
Five heat flux gauges were arranged to monitor wide areas of the pas-
senger compartment. Four gauges were located in the original rear of
the motorcoach at 1, 2, 3, and 4 m from the rear of the interior as
defined by the lavatory door. Their height was 1.5 m, and each faced
the right‐side windows. The lateral location was 69 cm toward the
driver's side from the centerline of the motorcoach. The fifth heat flux
gauge was at the same height, but near the middle gas sampling and
thermocouple array location, and it faced rearward. Its location was
8 cm from the centerline and 5.66 m from the rear of the motorcoach.
Table 1 details the heat flux gauge locations, and Figure 4 shows their
locations relative to other features of the motorcoach.
2.4 | Gas volume fractions
Three 9.5‐mm (0.375‐in) OD stainless steel probes were installed at
rear, middle, and front positions to sample the gas and measure vol-
ume fractions of carbon monoxide (CO), carbon dioxide (CO2), oxygen
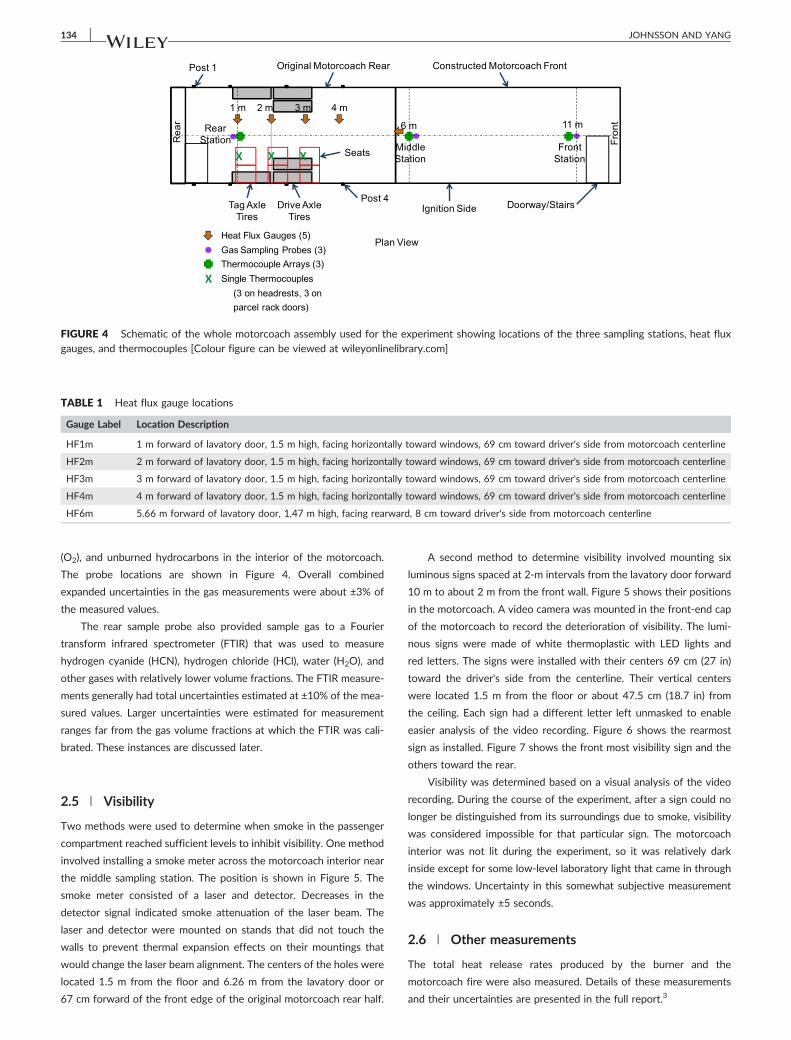
FIGURE 4 Schematic of the whole motorcoach assembly used for the experiment showing locations of the three sampling stations, heat fluxgauges, and thermocouples [Colour figure can be viewed at wileyonlinelibrary.com]
TABLE 1 Heat flux gauge locations
Gauge Label Location Description
HF1m 1 m forward of lavatory door, 1.5 m high, facing horizontally toward windows, 69 cm toward driver's side from motorcoach centerline
HF2m 2 m forward of lavatory door, 1.5 m high, facing horizontally toward windows, 69 cm toward driver's side from motorcoach centerline
HF3m 3 m forward of lavatory door, 1.5 m high, facing horizontally toward windows, 69 cm toward driver's side from motorcoach centerline
HF4m 4 m forward of lavatory door, 1.5 m high, facing horizontally toward windows, 69 cm toward driver's side from motorcoach centerline
HF6m 5.66 m forward of lavatory door, 1.47 m high, facing rearward, 8 cm toward driver's side from motorcoach centerline
134 JOHNSSON AND YANG
(O2), and unburned hydrocarbons in the interior of the motorcoach.
The probe locations are shown in Figure 4. Overall combined
expanded uncertainties in the gas measurements were about ±3% of
the measured values.
The rear sample probe also provided sample gas to a Fourier
transform infrared spectrometer (FTIR) that was used to measure
hydrogen cyanide (HCN), hydrogen chloride (HCl), water (H2O), and
other gases with relatively lower volume fractions. The FTIR measure-
ments generally had total uncertainties estimated at ±10% of the mea-
sured values. Larger uncertainties were estimated for measurement
ranges far from the gas volume fractions at which the FTIR was cali-
brated. These instances are discussed later.
2.5 | Visibility
Two methods were used to determine when smoke in the passenger
compartment reached sufficient levels to inhibit visibility. One method
involved installing a smoke meter across the motorcoach interior near
the middle sampling station. The position is shown in Figure 5. The
smoke meter consisted of a laser and detector. Decreases in the
detector signal indicated smoke attenuation of the laser beam. The
laser and detector were mounted on stands that did not touch the
walls to prevent thermal expansion effects on their mountings that
would change the laser beam alignment. The centers of the holes were
located 1.5 m from the floor and 6.26 m from the lavatory door or
67 cm forward of the front edge of the original motorcoach rear half.
A second method to determine visibility involved mounting six
luminous signs spaced at 2‐m intervals from the lavatory door forward
10 m to about 2 m from the front wall. Figure 5 shows their positions
in the motorcoach. A video camera was mounted in the front‐end cap
of the motorcoach to record the deterioration of visibility. The lumi-
nous signs were made of white thermoplastic with LED lights and
red letters. The signs were installed with their centers 69 cm (27 in)
toward the driver's side from the centerline. Their vertical centers
were located 1.5 m from the floor or about 47.5 cm (18.7 in) from
the ceiling. Each sign had a different letter left unmasked to enable
easier analysis of the video recording. Figure 6 shows the rearmost
sign as installed. Figure 7 shows the front most visibility sign and the
others toward the rear.
Visibility was determined based on a visual analysis of the video
recording. During the course of the experiment, after a sign could no
longer be distinguished from its surroundings due to smoke, visibility
was considered impossible for that particular sign. The motorcoach
interior was not lit during the experiment, so it was relatively dark
inside except for some low‐level laboratory light that came in through
the windows. Uncertainty in this somewhat subjective measurement
was approximately ±5 seconds.
2.6 | Other measurements
The total heat release rates produced by the burner and the
motorcoach fire were also measured. Details of these measurements
and their uncertainties are presented in the full report.3
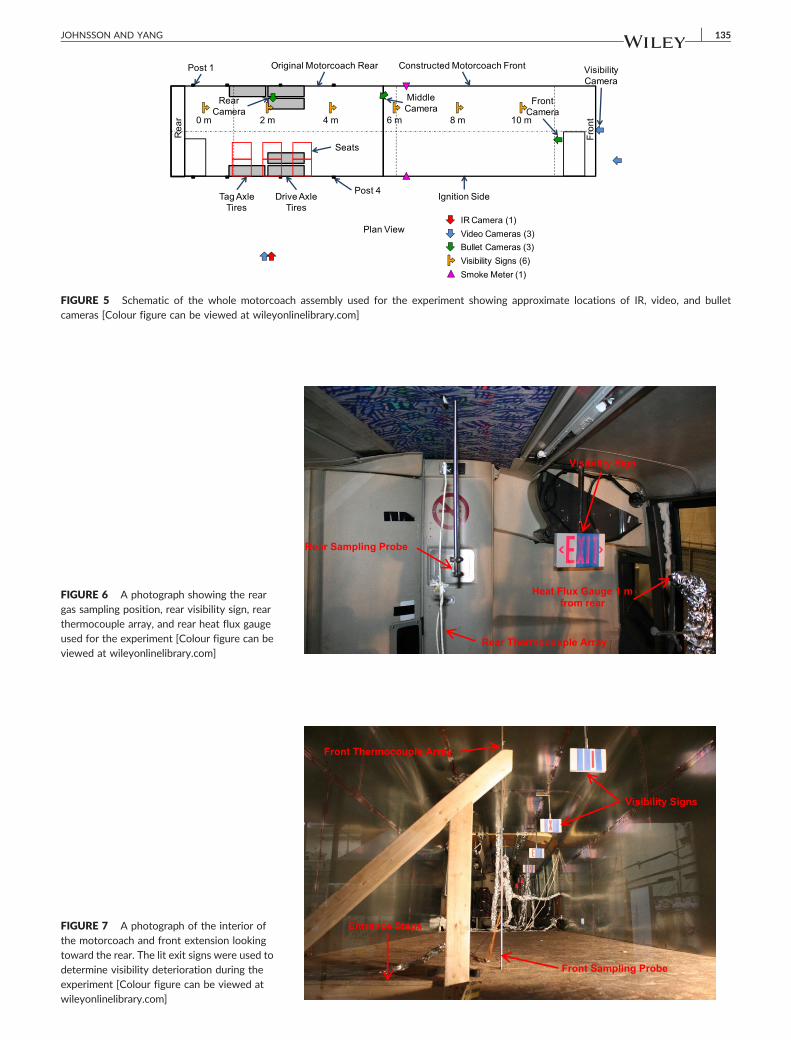
FIGURE 5 Schematic of the whole motorcoach assembly used for the experiment showing approximate locations of IR, video, and bulletcameras [Colour figure can be viewed at wileyonlinelibrary.com]
FIGURE 6 A photograph showing the reargas sampling position, rear visibility sign, rearthermocouple array, and rear heat flux gaugeused for the experiment [Colour figure can beviewed at wileyonlinelibrary.com]
FIGURE 7 A photograph of the interior ofthe motorcoach and front extension lookingtoward the rear. The lit exit signs were used todetermine visibility deterioration during theexperiment [Colour figure can be viewed atwileyonlinelibrary.com]
JOHNSSON AND YANG 135
136 JOHNSSON AND YANG
Video recordings were made with one infrared (IR) camera, three
standard cameras, and three standard bullet cameras. Figure 5 is a sche-
matic showing the approximate locations or viewing directions of the
various interior and exterior cameras. Three digital still cameras were
used to acquire a sufficient number of images from multiple views.
2.7 | Experimental procedure
Detailed experimental procedure can be found in the full report.3
Briefly described, a fire was initiated on the tag (rearmost) axle tire
using a burner designed to imitate the frictional heating of wheel
metal. The tire fire then spread into the passenger compartment
through a window and ignited the installed compartment contents.
Measurements and observations were then made. The fire was
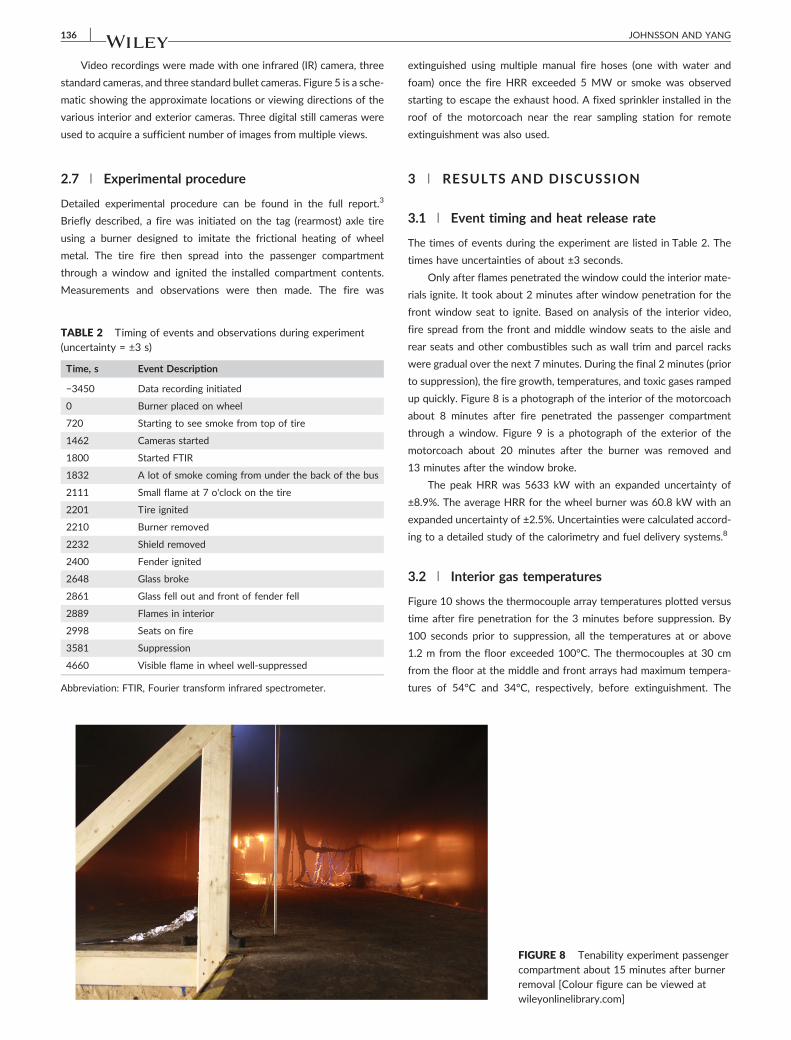
TABLE 2 Timing of events and observations during experiment(uncertainty = ±3 s)
Time, s Event Description
−3450 Data recording initiated
0 Burner placed on wheel
720 Starting to see smoke from top of tire
1462 Cameras started
1800 Started FTIR
1832 A lot of smoke coming from under the back of the bus
2111 Small flame at 7 o'clock on the tire
2201 Tire ignited
2210 Burner removed
2232 Shield removed
2400 Fender ignited
2648 Glass broke
2861 Glass fell out and front of fender fell
2889 Flames in interior
2998 Seats on fire
3581 Suppression
4660 Visible flame in wheel well‐suppressed
Abbreviation: FTIR, Fourier transform infrared spectrometer.
extinguished using multiple manual fire hoses (one with water and
foam) once the fire HRR exceeded 5 MW or smoke was observed
starting to escape the exhaust hood. A fixed sprinkler installed in the
roof of the motorcoach near the rear sampling station for remote
extinguishment was also used.
3 | RESULTS AND DISCUSSION
3.1 | Event timing and heat release rate
The times of events during the experiment are listed in Table 2. The
times have uncertainties of about ±3 seconds.
Only after flames penetrated the window could the interior mate-
rials ignite. It took about 2 minutes after window penetration for the
front window seat to ignite. Based on analysis of the interior video,
fire spread from the front and middle window seats to the aisle and
rear seats and other combustibles such as wall trim and parcel racks
were gradual over the next 7 minutes. During the final 2 minutes (prior
to suppression), the fire growth, temperatures, and toxic gases ramped
up quickly. Figure 8 is a photograph of the interior of the motorcoach
about 8 minutes after fire penetrated the passenger compartment
through a window. Figure 9 is a photograph of the exterior of the
motorcoach about 20 minutes after the burner was removed and
13 minutes after the window broke.
The peak HRR was 5633 kW with an expanded uncertainty of
±8.9%. The average HRR for the wheel burner was 60.8 kW with an
expanded uncertainty of ±2.5%. Uncertainties were calculated accord-
ing to a detailed study of the calorimetry and fuel delivery systems.8
3.2 | Interior gas temperatures
Figure 10 shows the thermocouple array temperatures plotted versus
time after fire penetration for the 3 minutes before suppression. By
100 seconds prior to suppression, all the temperatures at or above
1.2 m from the floor exceeded 100°C. The thermocouples at 30 cm
from the floor at the middle and front arrays had maximum tempera-
tures of 54°C and 34°C, respectively, before extinguishment. The
FIGURE 8 Tenability experiment passengercompartment about 15 minutes after burnerremoval [Colour figure can be viewed atwileyonlinelibrary.com]
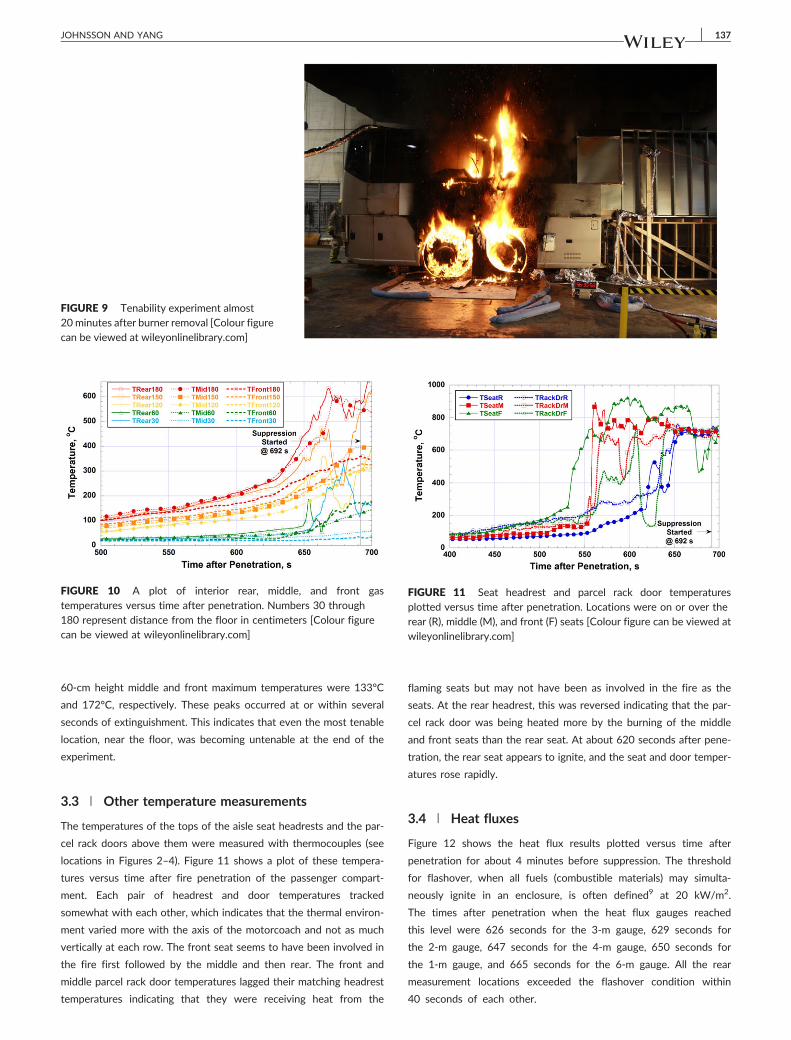
FIGURE 9 Tenability experiment almost20 minutes after burner removal [Colour figurecan be viewed at wileyonlinelibrary.com]
FIGURE 10 A plot of interior rear, middle, and front gastemperatures versus time after penetration. Numbers 30 through180 represent distance from the floor in centimeters [Colour figurecan be viewed at wileyonlinelibrary.com]
FIGURE 11 Seat headrest and parcel rack door temperaturesplotted versus time after penetration. Locations were on or over therear (R), middle (M), and front (F) seats [Colour figure can be viewed atwileyonlinelibrary.com]
JOHNSSON AND YANG 137
60‐cm height middle and front maximum temperatures were 133°C
and 172°C, respectively. These peaks occurred at or within several
seconds of extinguishment. This indicates that even the most tenable
location, near the floor, was becoming untenable at the end of the
experiment.
3.3 | Other temperature measurements
The temperatures of the tops of the aisle seat headrests and the par-
cel rack doors above them were measured with thermocouples (see
locations in Figures 2–4). Figure 11 shows a plot of these tempera-
tures versus time after fire penetration of the passenger compart-
ment. Each pair of headrest and door temperatures tracked
somewhat with each other, which indicates that the thermal environ-
ment varied more with the axis of the motorcoach and not as much
vertically at each row. The front seat seems to have been involved in
the fire first followed by the middle and then rear. The front and
middle parcel rack door temperatures lagged their matching headrest
temperatures indicating that they were receiving heat from the
flaming seats but may not have been as involved in the fire as the
seats. At the rear headrest, this was reversed indicating that the par-
cel rack door was being heated more by the burning of the middle
and front seats than the rear seat. At about 620 seconds after pene-
tration, the rear seat appears to ignite, and the seat and door temper-
atures rose rapidly.
3.4 | Heat fluxes
Figure 12 shows the heat flux results plotted versus time after
penetration for about 4 minutes before suppression. The threshold
for flashover, when all fuels (combustible materials) may simulta-
neously ignite in an enclosure, is often defined9 at 20 kW/m2.
The times after penetration when the heat flux gauges reached
this level were 626 seconds for the 3‐m gauge, 629 seconds for
the 2‐m gauge, 647 seconds for the 4‐m gauge, 650 seconds for
the 1‐m gauge, and 665 seconds for the 6‐m gauge. All the rear
measurement locations exceeded the flashover condition within
40 seconds of each other.
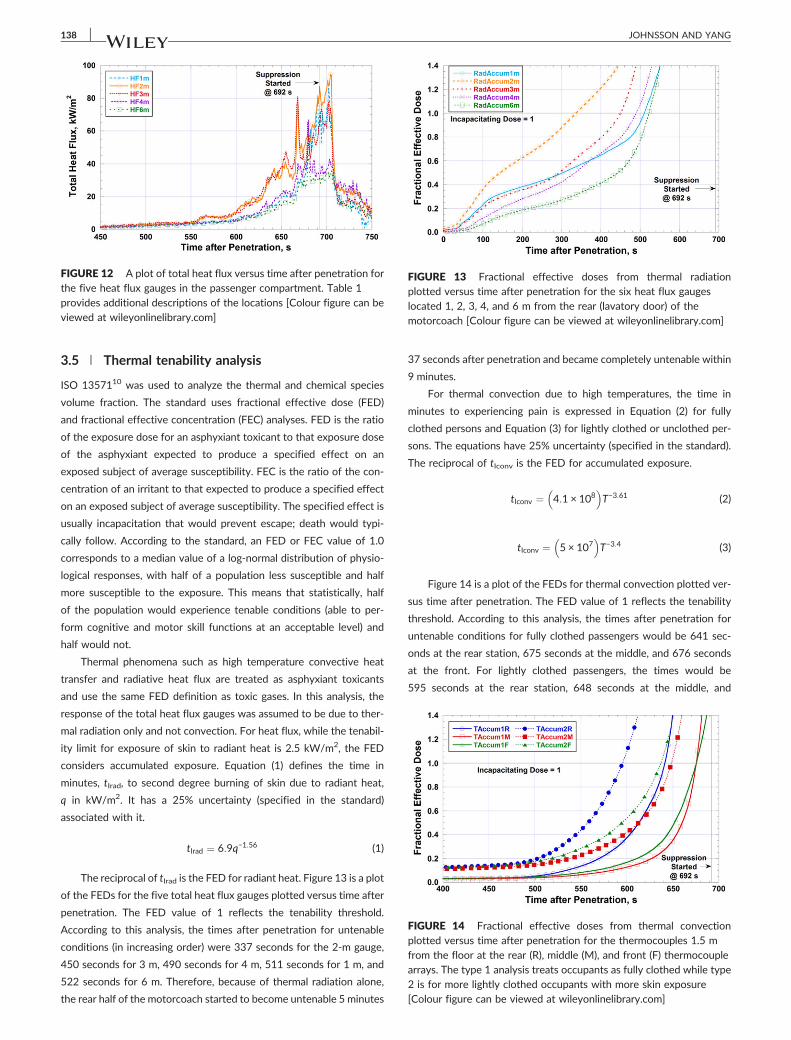
FIGURE 12 A plot of total heat flux versus time after penetration forthe five heat flux gauges in the passenger compartment. Table 1
provides additional descriptions of the locations [Colour figure can beviewed at wileyonlinelibrary.com]
FIGURE 13 Fractional effective doses from thermal radiationplotted versus time after penetration for the six heat flux gaugeslocated 1, 2, 3, 4, and 6 m from the rear (lavatory door) of themotorcoach [Colour figure can be viewed at wileyonlinelibrary.com]
FIGURE 14 Fractional effective doses from thermal convectionplotted versus time after penetration for the thermocouples 1.5 mfrom the floor at the rear (R), middle (M), and front (F) thermocouplearrays. The type 1 analysis treats occupants as fully clothed while type2 is for more lightly clothed occupants with more skin exposure[Colour figure can be viewed at wileyonlinelibrary.com]
138 JOHNSSON AND YANG
3.5 | Thermal tenability analysis
ISO 1357110 was used to analyze the thermal and chemical species
volume fraction. The standard uses fractional effective dose (FED)
and fractional effective concentration (FEC) analyses. FED is the ratio
of the exposure dose for an asphyxiant toxicant to that exposure dose
of the asphyxiant expected to produce a specified effect on an
exposed subject of average susceptibility. FEC is the ratio of the con-
centration of an irritant to that expected to produce a specified effect
on an exposed subject of average susceptibility. The specified effect is
usually incapacitation that would prevent escape; death would typi-
cally follow. According to the standard, an FED or FEC value of 1.0
corresponds to a median value of a log‐normal distribution of physio-
logical responses, with half of a population less susceptible and half
more susceptible to the exposure. This means that statistically, half
of the population would experience tenable conditions (able to per-
form cognitive and motor skill functions at an acceptable level) and
half would not.
Thermal phenomena such as high temperature convective heat
transfer and radiative heat flux are treated as asphyxiant toxicants
and use the same FED definition as toxic gases. In this analysis, the
response of the total heat flux gauges was assumed to be due to ther-
mal radiation only and not convection. For heat flux, while the tenabil-
ity limit for exposure of skin to radiant heat is 2.5 kW/m2, the FED
considers accumulated exposure. Equation (1) defines the time in
minutes, tIrad, to second degree burning of skin due to radiant heat,
q in kW/m2. It has a 25% uncertainty (specified in the standard)
associated with it.
tIrad ¼ 6:9q−1:56 (1)
The reciprocal of tIrad is the FED for radiant heat. Figure 13 is a plot
of the FEDs for the five total heat flux gauges plotted versus time after
penetration. The FED value of 1 reflects the tenability threshold.
According to this analysis, the times after penetration for untenable
conditions (in increasing order) were 337 seconds for the 2‐m gauge,
450 seconds for 3 m, 490 seconds for 4 m, 511 seconds for 1 m, and
522 seconds for 6 m. Therefore, because of thermal radiation alone,
the rear half of the motorcoach started to become untenable 5 minutes
37 seconds after penetration and became completely untenable within
9 minutes.
For thermal convection due to high temperatures, the time in
minutes to experiencing pain is expressed in Equation (2) for fully
clothed persons and Equation (3) for lightly clothed or unclothed per-
sons. The equations have 25% uncertainty (specified in the standard).
The reciprocal of tIconv is the FED for accumulated exposure.
tIconv ¼ 4:1 × 10⁸� �
T−3:61 (2)
tIconv ¼ 5 × 10⁷� �
T−3:4 (3)
Figure 14 is a plot of the FEDs for thermal convection plotted ver-
sus time after penetration. The FED value of 1 reflects the tenability
threshold. According to this analysis, the times after penetration for
untenable conditions for fully clothed passengers would be 641 sec-
onds at the rear station, 675 seconds at the middle, and 676 seconds
at the front. For lightly clothed passengers, the times would be
595 seconds at the rear station, 648 seconds at the middle, and
JOHNSSON AND YANG 139
637 seconds at the front. From these times, the rear of the
motorcoach became untenable 10 minutes 41 seconds after penetra-
tion for fully clothed persons and 9 minutes 55 seconds for lightly
clothed persons. For the middle station, the times from penetration
were 11 minutes 15 seconds and 10 minutes 48 seconds, and for
the front, the times were 11 minutes 16 seconds and 10 minutes
37 seconds. In summary, from thermal convection alone and for any
clothing type, the motorcoach began to be untenable in the rear just
under 10 minutes after penetration and the whole motorcoach
became untenable by 11 minutes 16 seconds.
Combining the two thermal effects is a more practical measure of
the real tenability deterioration in the motorcoach passenger compart-
ment. The total thermal tenability FED is the sum of the radiative and
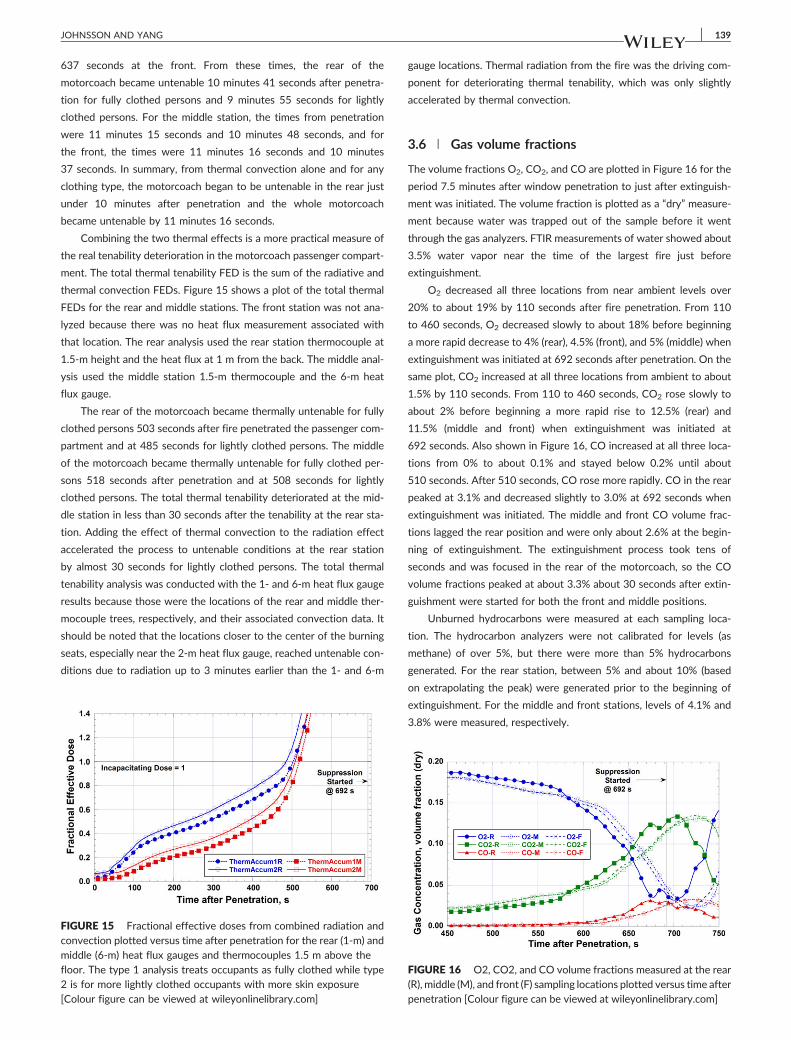
thermal convection FEDs. Figure 15 shows a plot of the total thermal
FEDs for the rear and middle stations. The front station was not ana-
lyzed because there was no heat flux measurement associated with
that location. The rear analysis used the rear station thermocouple at
1.5‐m height and the heat flux at 1 m from the back. The middle anal-
ysis used the middle station 1.5‐m thermocouple and the 6‐m heat
flux gauge.
The rear of the motorcoach became thermally untenable for fully
clothed persons 503 seconds after fire penetrated the passenger com-
partment and at 485 seconds for lightly clothed persons. The middle
of the motorcoach became thermally untenable for fully clothed per-
sons 518 seconds after penetration and at 508 seconds for lightly
clothed persons. The total thermal tenability deteriorated at the mid-
dle station in less than 30 seconds after the tenability at the rear sta-
tion. Adding the effect of thermal convection to the radiation effect
accelerated the process to untenable conditions at the rear station
by almost 30 seconds for lightly clothed persons. The total thermal
tenability analysis was conducted with the 1‐ and 6‐m heat flux gauge
results because those were the locations of the rear and middle ther-
mocouple trees, respectively, and their associated convection data. It
should be noted that the locations closer to the center of the burning
seats, especially near the 2‐m heat flux gauge, reached untenable con-
ditions due to radiation up to 3 minutes earlier than the 1‐ and 6‐m
FIGURE 15 Fractional effective doses from combined radiation andconvection plotted versus time after penetration for the rear (1‐m) andmiddle (6‐m) heat flux gauges and thermocouples 1.5 m above thefloor. The type 1 analysis treats occupants as fully clothed while type2 is for more lightly clothed occupants with more skin exposure[Colour figure can be viewed at wileyonlinelibrary.com]
gauge locations. Thermal radiation from the fire was the driving com-
ponent for deteriorating thermal tenability, which was only slightly
accelerated by thermal convection.
3.6 | Gas volume fractions
The volume fractions O2, CO2, and CO are plotted in Figure 16 for the
period 7.5 minutes after window penetration to just after extinguish-
ment was initiated. The volume fraction is plotted as a “dry” measure-
ment because water was trapped out of the sample before it went
through the gas analyzers. FTIR measurements of water showed about
3.5% water vapor near the time of the largest fire just before
extinguishment.
O2 decreased all three locations from near ambient levels over
20% to about 19% by 110 seconds after fire penetration. From 110
to 460 seconds, O2 decreased slowly to about 18% before beginning
a more rapid decrease to 4% (rear), 4.5% (front), and 5% (middle) when
extinguishment was initiated at 692 seconds after penetration. On the
same plot, CO2 increased at all three locations from ambient to about
1.5% by 110 seconds. From 110 to 460 seconds, CO2 rose slowly to
about 2% before beginning a more rapid rise to 12.5% (rear) and
11.5% (middle and front) when extinguishment was initiated at
692 seconds. Also shown in Figure 16, CO increased at all three loca-
tions from 0% to about 0.1% and stayed below 0.2% until about
510 seconds. After 510 seconds, CO rose more rapidly. CO in the rear
peaked at 3.1% and decreased slightly to 3.0% at 692 seconds when
extinguishment was initiated. The middle and front CO volume frac-
tions lagged the rear position and were only about 2.6% at the begin-
ning of extinguishment. The extinguishment process took tens of
seconds and was focused in the rear of the motorcoach, so the CO
volume fractions peaked at about 3.3% about 30 seconds after extin-
guishment were started for both the front and middle positions.
Unburned hydrocarbons were measured at each sampling loca-
tion. The hydrocarbon analyzers were not calibrated for levels (as
methane) of over 5%, but there were more than 5% hydrocarbons
generated. For the rear station, between 5% and about 10% (based
on extrapolating the peak) were generated prior to the beginning of
extinguishment. For the middle and front stations, levels of 4.1% and
3.8% were measured, respectively.
FIGURE 16 O2, CO2, and CO volume fractions measured at the rear(R), middle (M), and front (F) sampling locations plotted versus time afterpenetration [Colour figure can be viewed at wileyonlinelibrary.com]
140 JOHNSSON AND YANG
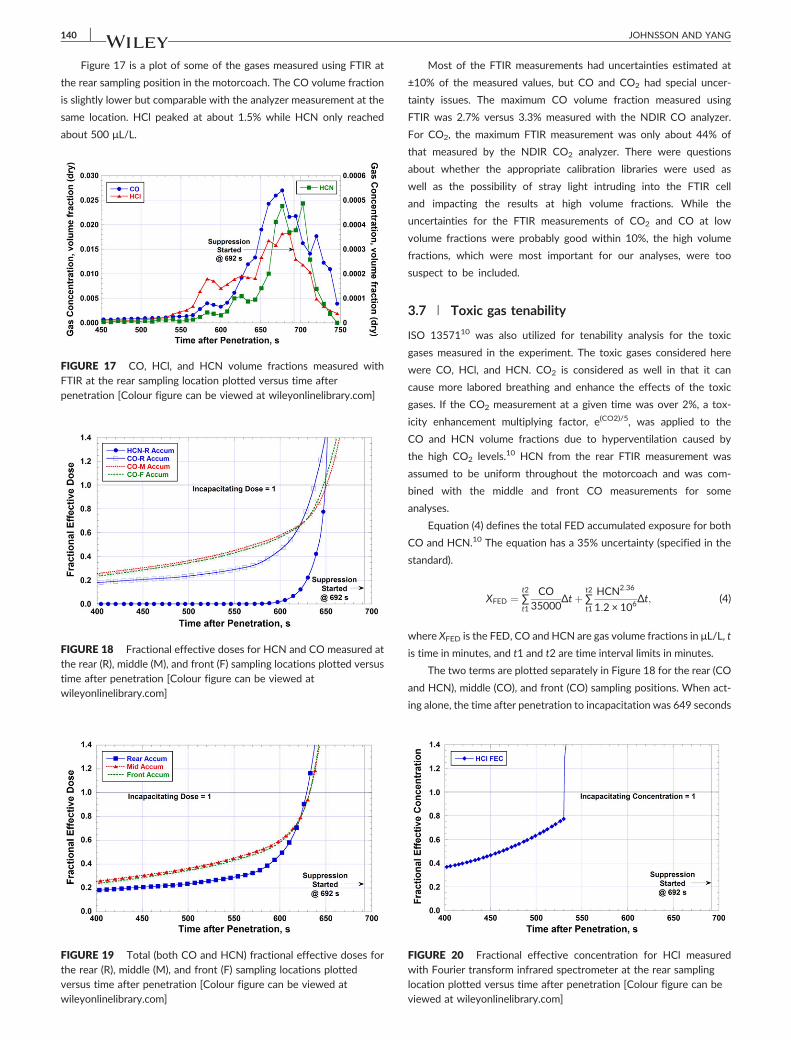
Figure 17 is a plot of some of the gases measured using FTIR at
the rear sampling position in the motorcoach. The CO volume fraction
is slightly lower but comparable with the analyzer measurement at the
same location. HCl peaked at about 1.5% while HCN only reached
about 500 μL/L.
FIGURE 17 CO, HCl, and HCN volume fractions measured withFTIR at the rear sampling location plotted versus time after
penetration [Colour figure can be viewed at wileyonlinelibrary.com]
FIGURE 18 Fractional effective doses for HCN and CO measured atthe rear (R), middle (M), and front (F) sampling locations plotted versustime after penetration [Colour figure can be viewed atwileyonlinelibrary.com]
FIGURE 19 Total (both CO and HCN) fractional effective doses forthe rear (R), middle (M), and front (F) sampling locations plottedversus time after penetration [Colour figure can be viewed atwileyonlinelibrary.com]
Most of the FTIR measurements had uncertainties estimated at
±10% of the measured values, but CO and CO2 had special uncer-
tainty issues. The maximum CO volume fraction measured using
FTIR was 2.7% versus 3.3% measured with the NDIR CO analyzer.
For CO2, the maximum FTIR measurement was only about 44% of
that measured by the NDIR CO2 analyzer. There were questions
about whether the appropriate calibration libraries were used as
well as the possibility of stray light intruding into the FTIR cell
and impacting the results at high volume fractions. While the
uncertainties for the FTIR measurements of CO2 and CO at low
volume fractions were probably good within 10%, the high volume
fractions, which were most important for our analyses, were too
suspect to be included.
3.7 | Toxic gas tenability
ISO 1357110 was also utilized for tenability analysis for the toxic
gases measured in the experiment. The toxic gases considered here
were CO, HCl, and HCN. CO2 is considered as well in that it can
cause more labored breathing and enhance the effects of the toxic
gases. If the CO2 measurement at a given time was over 2%, a tox-
icity enhancement multiplying factor, e(CO2)/5, was applied to the
CO and HCN volume fractions due to hyperventilation caused by
the high CO2 levels.10 HCN from the rear FTIR measurement was
assumed to be uniform throughout the motorcoach and was com-
bined with the middle and front CO measurements for some
analyses.
Equation (4) defines the total FED accumulated exposure for both
CO and HCN.10 The equation has a 35% uncertainty (specified in the
standard).
XFED ¼ ∑t2
t1
CO35000
Δtþ ∑t2
t1
HCN2:36
1:2 × 10⁶Δt; (4)
where XFED is the FED, CO and HCN are gas volume fractions in μL/L, t
is time in minutes, and t1 and t2 are time interval limits in minutes.
The two terms are plotted separately in Figure 18 for the rear (CO
and HCN), middle (CO), and front (CO) sampling positions. When act-
ing alone, the time after penetration to incapacitation was 649 seconds
FIGURE 20 Fractional effective concentration for HCl measuredwith Fourier transform infrared spectrometer at the rear samplinglocation plotted versus time after penetration [Colour figure can beviewed at wileyonlinelibrary.com]
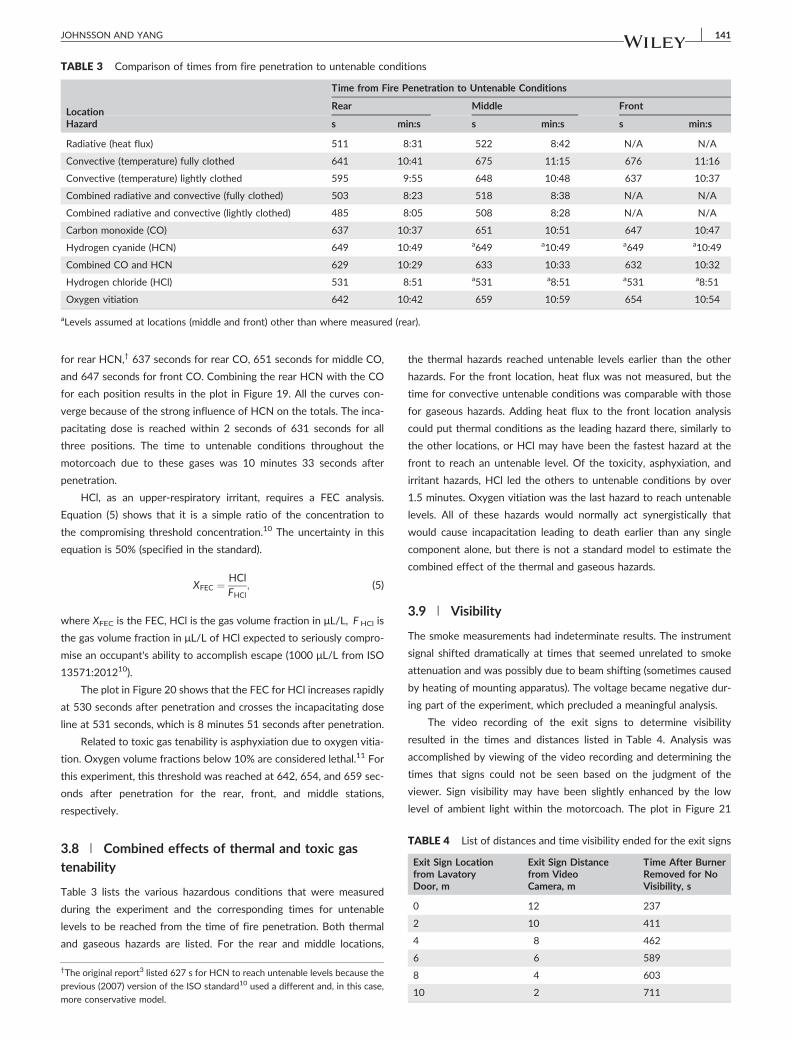
TABLE 3 Comparison of times from fire penetration to untenable conditions
Location
Time from Fire Penetration to Untenable Conditions
Rear Middle Front
Hazard s min:s s min:s s min:s
Radiative (heat flux) 511 8:31 522 8:42 N/A N/A
Convective (temperature) fully clothed 641 10:41 675 11:15 676 11:16
Convective (temperature) lightly clothed 595 9:55 648 10:48 637 10:37
Combined radiative and convective (fully clothed) 503 8:23 518 8:38 N/A N/A
Combined radiative and convective (lightly clothed) 485 8:05 508 8:28 N/A N/A
Carbon monoxide (CO) 637 10:37 651 10:51 647 10:47
Hydrogen cyanide (HCN) 649 10:49 a649 a10:49 a649 a10:49
Combined CO and HCN 629 10:29 633 10:33 632 10:32
Hydrogen chloride (HCl) 531 8:51 a531 a8:51 a531 a8:51
Oxygen vitiation 642 10:42 659 10:59 654 10:54
aLevels assumed at locations (middle and front) other than where measured (rear).
TABLE 4 List of distances and time visibility ended for the exit signs
Exit Sign Locationfrom LavatoryDoor, m
Exit Sign Distancefrom VideoCamera, m
Time After BurnerRemoved for NoVisibility, s
0 12 237
2 10 411
4 8 462
JOHNSSON AND YANG 141
for rear HCN,† 637 seconds for rear CO, 651 seconds for middle CO,
and 647 seconds for front CO. Combining the rear HCN with the CO
for each position results in the plot in Figure 19. All the curves con-
verge because of the strong influence of HCN on the totals. The inca-
pacitating dose is reached within 2 seconds of 631 seconds for all
three positions. The time to untenable conditions throughout the
motorcoach due to these gases was 10 minutes 33 seconds after
penetration.
HCl, as an upper‐respiratory irritant, requires a FEC analysis.
Equation (5) shows that it is a simple ratio of the concentration to
the compromising threshold concentration.10 The uncertainty in this
equation is 50% (specified in the standard).
XFEC ¼ HClFHCl
; (5)
where XFEC is the FEC, HCl is the gas volume fraction in μL/L, F HCl is
the gas volume fraction in μL/L of HCl expected to seriously compro-
mise an occupant's ability to accomplish escape (1000 μL/L from ISO
13571:201210).
The plot in Figure 20 shows that the FEC for HCl increases rapidly
at 530 seconds after penetration and crosses the incapacitating dose
line at 531 seconds, which is 8 minutes 51 seconds after penetration.
Related to toxic gas tenability is asphyxiation due to oxygen vitia-
tion. Oxygen volume fractions below 10% are considered lethal.11 For
this experiment, this threshold was reached at 642, 654, and 659 sec-
onds after penetration for the rear, front, and middle stations,
respectively.
3.8 | Combined effects of thermal and toxic gastenability
Table 3 lists the various hazardous conditions that were measured
during the experiment and the corresponding times for untenable
levels to be reached from the time of fire penetration. Both thermal
and gaseous hazards are listed. For the rear and middle locations,
†The original report3 listed 627 s for HCN to reach untenable levels because the
previous (2007) version of the ISO standard10 used a different and, in this case,
more conservative model.
the thermal hazards reached untenable levels earlier than the other
hazards. For the front location, heat flux was not measured, but the
time for convective untenable conditions was comparable with those
for gaseous hazards. Adding heat flux to the front location analysis
could put thermal conditions as the leading hazard there, similarly to
the other locations, or HCl may have been the fastest hazard at the
front to reach an untenable level. Of the toxicity, asphyxiation, and
irritant hazards, HCl led the others to untenable conditions by over
1.5 minutes. Oxygen vitiation was the last hazard to reach untenable
levels. All of these hazards would normally act synergistically that
would cause incapacitation leading to death earlier than any single
component alone, but there is not a standard model to estimate the
combined effect of the thermal and gaseous hazards.
3.9 | Visibility
The smoke measurements had indeterminate results. The instrument
signal shifted dramatically at times that seemed unrelated to smoke
attenuation and was possibly due to beam shifting (sometimes caused
by heating of mounting apparatus). The voltage became negative dur-
ing part of the experiment, which precluded a meaningful analysis.
The video recording of the exit signs to determine visibility
resulted in the times and distances listed in Table 4. Analysis was
accomplished by viewing of the video recording and determining the
times that signs could not be seen based on the judgment of the
viewer. Sign visibility may have been slightly enhanced by the low
level of ambient light within the motorcoach. The plot in Figure 21
6 6 589
8 4 603
10 2 711
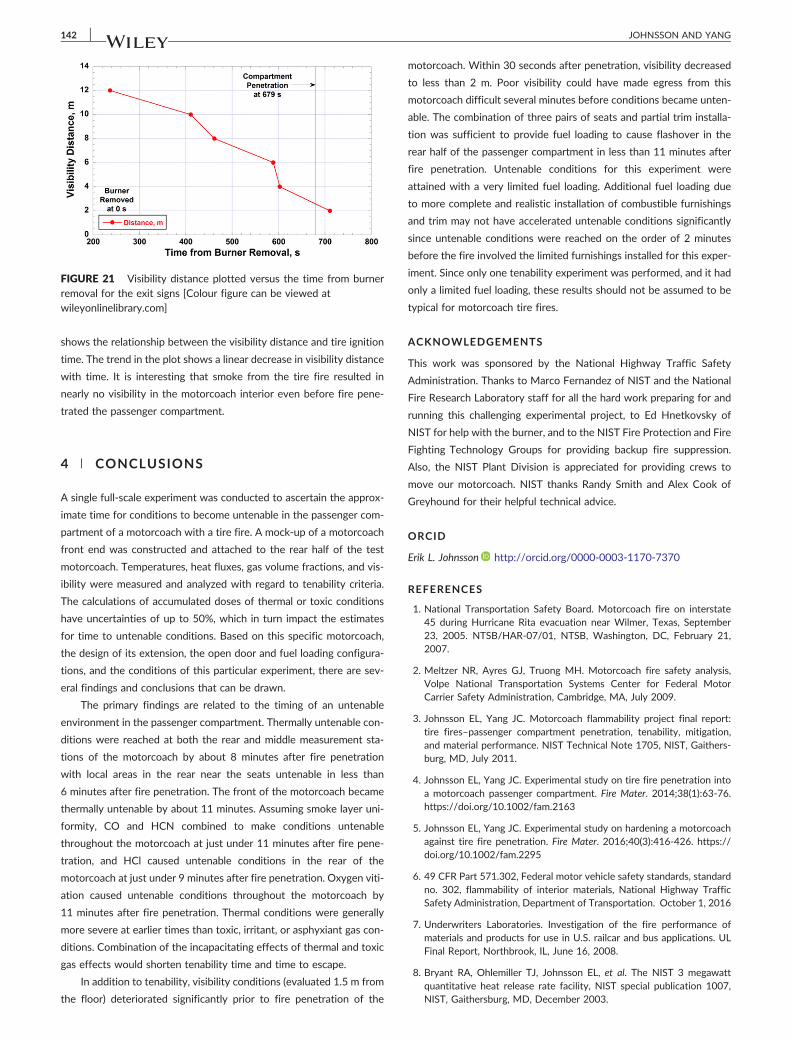
FIGURE 21 Visibility distance plotted versus the time from burnerremoval for the exit signs [Colour figure can be viewed atwileyonlinelibrary.com]
142 JOHNSSON AND YANG
shows the relationship between the visibility distance and tire ignition
time. The trend in the plot shows a linear decrease in visibility distance
with time. It is interesting that smoke from the tire fire resulted in
nearly no visibility in the motorcoach interior even before fire pene-
trated the passenger compartment.
4 | CONCLUSIONS
A single full‐scale experiment was conducted to ascertain the approx-
imate time for conditions to become untenable in the passenger com-
partment of a motorcoach with a tire fire. A mock‐up of a motorcoach
front end was constructed and attached to the rear half of the test
motorcoach. Temperatures, heat fluxes, gas volume fractions, and vis-
ibility were measured and analyzed with regard to tenability criteria.
The calculations of accumulated doses of thermal or toxic conditions
have uncertainties of up to 50%, which in turn impact the estimates
for time to untenable conditions. Based on this specific motorcoach,
the design of its extension, the open door and fuel loading configura-
tions, and the conditions of this particular experiment, there are sev-
eral findings and conclusions that can be drawn.
The primary findings are related to the timing of an untenable
environment in the passenger compartment. Thermally untenable con-
ditions were reached at both the rear and middle measurement sta-
tions of the motorcoach by about 8 minutes after fire penetration
with local areas in the rear near the seats untenable in less than
6 minutes after fire penetration. The front of the motorcoach became
thermally untenable by about 11 minutes. Assuming smoke layer uni-
formity, CO and HCN combined to make conditions untenable
throughout the motorcoach at just under 11 minutes after fire pene-
tration, and HCl caused untenable conditions in the rear of the
motorcoach at just under 9 minutes after fire penetration. Oxygen viti-
ation caused untenable conditions throughout the motorcoach by
11 minutes after fire penetration. Thermal conditions were generally
more severe at earlier times than toxic, irritant, or asphyxiant gas con-
ditions. Combination of the incapacitating effects of thermal and toxic
gas effects would shorten tenability time and time to escape.
In addition to tenability, visibility conditions (evaluated 1.5 m from
the floor) deteriorated significantly prior to fire penetration of the
motorcoach. Within 30 seconds after penetration, visibility decreased
to less than 2 m. Poor visibility could have made egress from this
motorcoach difficult several minutes before conditions became unten-
able. The combination of three pairs of seats and partial trim installa-
tion was sufficient to provide fuel loading to cause flashover in the
rear half of the passenger compartment in less than 11 minutes after
fire penetration. Untenable conditions for this experiment were
attained with a very limited fuel loading. Additional fuel loading due
to more complete and realistic installation of combustible furnishings
and trim may not have accelerated untenable conditions significantly
since untenable conditions were reached on the order of 2 minutes
before the fire involved the limited furnishings installed for this exper-
iment. Since only one tenability experiment was performed, and it had
only a limited fuel loading, these results should not be assumed to be
typical for motorcoach tire fires.
ACKNOWLEDGEMENTS
This work was sponsored by the National Highway Traffic Safety
Administration. Thanks to Marco Fernandez of NIST and the National
Fire Research Laboratory staff for all the hard work preparing for and
running this challenging experimental project, to Ed Hnetkovsky of
NIST for help with the burner, and to the NIST Fire Protection and Fire
Fighting Technology Groups for providing backup fire suppression.
Also, the NIST Plant Division is appreciated for providing crews to
move our motorcoach. NIST thanks Randy Smith and Alex Cook of
Greyhound for their helpful technical advice.
ORCID
Erik L. Johnsson http://orcid.org/0000-0003-1170-7370
REFERENCES
1. National Transportation Safety Board. Motorcoach fire on interstate45 during Hurricane Rita evacuation near Wilmer, Texas, September23, 2005. NTSB/HAR‐07/01, NTSB, Washington, DC, February 21,2007.
2. Meltzer NR, Ayres GJ, Truong MH. Motorcoach fire safety analysis,Volpe National Transportation Systems Center for Federal MotorCarrier Safety Administration, Cambridge, MA, July 2009.
3. Johnsson EL, Yang JC. Motorcoach flammability project final report:tire fires–passenger compartment penetration, tenability, mitigation,and material performance. NIST Technical Note 1705, NIST, Gaithers-burg, MD, July 2011.
4. Johnsson EL, Yang JC. Experimental study on tire fire penetration intoa motorcoach passenger compartment. Fire Mater. 2014;38(1):63‐76.https://doi.org/10.1002/fam.2163
5. Johnsson EL, Yang JC. Experimental study on hardening a motorcoachagainst tire fire penetration. Fire Mater. 2016;40(3):416‐426. https://doi.org/10.1002/fam.2295
6. 49 CFR Part 571.302, Federal motor vehicle safety standards, standardno. 302, flammability of interior materials, National Highway TrafficSafety Administration, Department of Transportation. October 1, 2016
7. Underwriters Laboratories. Investigation of the fire performance ofmaterials and products for use in U.S. railcar and bus applications. ULFinal Report, Northbrook, IL, June 16, 2008.
8. Bryant RA, Ohlemiller TJ, Johnsson EL, et al. The NIST 3 megawattquantitative heat release rate facility, NIST special publication 1007,NIST, Gaithersburg, MD, December 2003.
JOHNSSON AND YANG 143
9. NFPA. In: Cote AE, Grant CC, Hall JR Jr, Solomon RE, eds. Fire Protec-tion Handbook. 20th ed. Quincy, MA: National Fire Protection Assoc.;2008, p. 2/56.
10. ISO 13571:2012. Life‐threatening components of fire—guidelines forthe estimation of time to compromised tenability in fires, internationalorganization of standardization, Geneva, Switzerland; 2012.
11. D.A. Purser, Assessment of hazards to occupants from smoke, toxicgases and heat. The SFPE Handbook of Fire Protection Engineering 4th
ed, DiNenno P. J. (ed.), National Fire Protection Association, Quincy,MA, 2009, pp. 2/96–2/193.
How to cite this article: Johnsson EL, Yang JC. Experimental
study of tenability during a full‐scale motorcoach tire fire. Fire
and Materials. 2019;43:131–143. https://doi.org/10.1002/
fam.2676
![CFD-AIDED TENABILITY ASSESSMENT OF RAILWAY TUNNEL …CFD modelling and risk analysis [9]. However, publications on CFD assessment of ... tunnel’s tenability. The station and the](https://img.pdfslide.us/doc/110x75/5edd4210ad6a402d666849a9/cfd-aided-tenability-assessment-of-railway-tunnel-cfd-modelling-and-risk-analysis.jpg)