Embed Size (px)
DESCRIPTION
experimental study of solvent based emulsion injection to enhance heavy oil recovery
Citation preview
EXPERIMENTAL STUDY OF SOLVENT BASED EMULSION INJECTION TO
ENHANCE HEAVY OIL RECOVERY
A Thesis
by
FANGDA QIU
Submitted to the Office of Graduate Studies of Texas A&M University
in partial fulfillment of the requirements for the degree of
MASTER OF SCIENCE
May 2010
Major Subject: Petroleum Engineering
EXPERIMENTAL STUDY OF SOLVENT BASED EMULSION INJECTION TO
ENHANCE HEAVY OIL RECOVERY
A Thesis
by
FANGDA QIU
Submitted to the Office of Graduate Studies of Texas A&M University
in partial fulfillment of the requirements for the degree of
MASTER OF SCIENCE
Approved by:
Chair of Committee, Daulat D. Mamora Committee Members, Ding Zhu
Zhengdong Cheng Head of Department, Stephen A. Holditch
May 2010
Major Subject: Petroleum Engineering
iii
ABSTRACT
Experimental Study of Solvent Based Emulsion Injection to Enhance Heavy Oil
Recovery. (May 2010)
Fangda Qiu, B.S.,China University of Petroleum (Beijing)
Chair of Advisory Committee: Dr. Daulat D. Mamora
This study presents the results of nano-particle and surfactant-stabilized solvent-
based emulsion core flooding studies under laboratory conditions that investigate the
recovery mechanisms of chemical flooding in a heavy oil reservoir. In the study, bench
tests, including the phase behavior test, rheology studies and interfacial tension
measurement are performed and reported for the optimum selecting method for the
nano-emulsion. Specifically, nano-emulsion systems with high viscosity have been
injected into sandstone cores containing Alaska North Slope West Sak heavy oil with 16
API°, which was dewatered in the laboratory condition.
The experiment results suggest that the potential application of this kind of
emulsion flooding is a promising EOR (enhanced oil recovery) process for some heavy
oil reservoirs in Alaska, Canada and Venezuela after primary production. Heavy oil
lacks mobility under reservoir conditions and is not suitable for the application of the
thermal recovery method because of environmental issues or technical problems.
Core flooding experiments were performed on cores with varied permeabilities.
Comparisons between direct injection of nano-emulsion systems and nano-emulsion
iv
injections after water flooding were conducted. Oil recovery information is obtained by
material balance calculation.
In this study, we try to combine the advantages of solvent, surfactant, and nano-
particles together. As we know, pure miscible solvent used as an injection fluid in
developing the heavy oil reservoir does have the desirable recovery feature, however it is
not economical. The idea of nano-particle application in an EOR area has been recently
raised by researchers who are interested in its feature-reaction catalysis-which could
reduce in situ oil viscosity and generate emulsion without surfactant. Also, the nano-
particle stabilized emulsions can long-distance drive oil in the reservoir, since the nano-
particle size is 2-4 times smaller than the pore throat.
In conclusion, the nano-emulsion flooding can be an effective enhancement for
an oil recovery method for a heavy oil reservoir which is technically sensitive to the
thermal recovery method.

v
DEDICATION
To my parents, Bo Qiu and Zhenyun Zhang
To Feng

vi
ACKNOWLEDGEMENTS
I would like to express heartfelt gratitude to my committee chair, Dr. Daulat D.
Mamora, for his support and guidance through my studies at Texas A&M University in
the Department of Petroleum Engineering.
I am grateful for the experience I have gotten during the work on this research. I
would also like to thank my committee members, Dr. D. Zhu and Dr. Z. Cheng, for their
constant encouragement and academic support.
I am also thankful to my friends and colleagues and the department’s faculty and
staff for making my time at Texas A&M University an awesome experience.
I give my heartfelt appreciation to my parents, Mr. and Mrs.Qiu for their love
and care throughout my childhood.

vii
TABLE OF CONTENTS
Page
ABSTRACT ..................................................................................................................... iii
DEDICATION ................................................................................................................... v
ACKNOWLEDGEMENTS .............................................................................................. vi
TABLE OF CONTENTS .................................................................................................vii
LIST OF FIGURES ............................................................................................................ x
LIST OF TABLES ......................................................................................................... xiii
1. INTRODUCTION ...................................................................................................... 1
1.1 Overview of Alaska North Slope Heavy Oil ..................................................... 3
1.2 Main Challenges in ANS Heavy Oil Reservoirs ............................................... 4
1.3 Chemical EOR in Developing Heavy Oil Reservoir ......................................... 4
1.4 Objective ............................................................................................................ 6
2. ENHANCED OIL RECOVERY-AN OVERVIEW ................................................... 8
2.1 EOR Mechanism .............................................................................................. 10
2.2 Micro-emulsion and Macro-emulsion ............................................................. 12
2.3 Chemical EOR in Heavy Oil Reservoir .......................................................... 14
3. EXPERIMENTAL SET-UP AND PROCEDURES ................................................ 18
3.1 Experimental Materials .................................................................................... 18
3.1.1 Sandstone Core ............................................................................................ 18
3.1.2 Nitrogen ....................................................................................................... 18
3.1.3 Crude Oil ..................................................................................................... 18
3.1.4 Brine Solution ............................................................................................. 19
viii
Page 3.1.5 Surfactant .................................................................................................... 19
3.1.6 Nanoparticles ............................................................................................... 19
3.1.7 Solvent ......................................................................................................... 19
3.2 Emulsion Bench Test Set-up and Procedure.................................................... 20
3.2.1 The Phase Behavior Scan Set-up and Procedure ........................................ 20
3.2.2 Emulsion Droplet Size Measurements ........................................................ 23
3.2.3 Surface Tension Measurements .................................................................. 24
3.2.4 Viscosity Measurements ............................................................................. 25
3.2.5 Other Apparatus .......................................................................................... 26
3.3 Oil Dewatering Apparatus ............................................................................... 28
3.4 Core Flooding Apparatus ................................................................................. 29
3.4.1 Core Holder ................................................................................................. 30
3.4.2 Injection System .......................................................................................... 32
3.4.3 Production System ....................................................................................... 32
3.4.4 Data Logger System .................................................................................... 32
3.5 Core Flooding Experiment Procedure ............................................................. 34
4. EXPERIMENTAL RESULTS AND DISCUSSION ............................................... 36
4.1 Experimental Conditions ................................................................................. 36
4.1.1 Bench Test Experimental Conditions .......................................................... 36
4.1.2 Core Flooding Experiment Conditions ....................................................... 36
4.2 Bench Test Experiments ..................................................................................... 37
4.2.1 Emulsion Phase Behavior Experiments .................................................. 37
4.2.2 Emulsion Rheology Study Experiments ..................................................... 42
4.2.3 Emulsion and Crude Oil Interfacial Tension Measurement ........................ 46
4.2.4 Nanoparticle Thickened Micro-emulsion Experiments .............................. 48
4.2.5 Crude Oil Emulsion Viscosity Reduction Experiment ............................... 50
4.2.6 Core Flooding Experiments ........................................................................ 52
4.2.7 Comparison of Experimental Results .......................................................... 70
5. SUMMARY, CONCLUSIONS AND RECOMMENDATIONS ................................ 74
ix
Page 5.1 Summary ............................................................................................................. 74
5.2 Conclusions ......................................................................................................... 74
5.3 Recommendations ............................................................................................... 76
REFERENCES ................................................................................................................. 77
APPENDIX ...................................................................................................................... 79
VITA ................................................................................................................................ 82
x
LIST OF FIGURES
Page
Fig. 1.1 Distribution of worldwide heavy oil resources ..................................................... 2
Fig. 1.2 Map of ANS area and distribution of oil extraction activities .............................. 3
Fig. 2.1 EOR target for different hydrocarbons ................................................................. 9
Fig. 2.2 The classification of enhanced oil recovery method ............................................. 9
Fig. 2.3 Relationship between ROS and capillary number .............................................. 11
Fig. 2.4 Comparisons between the two cases: M>1 and M ≤ 1 ....................................... 12
Fig. 3.1 The emulsion phase behavior experiments in the hood ...................................... 21
Fig. 3.2 The microscope and the digital camera .............................................................. 23
Fig. 3.3 Kruss DSA30 IL4200 interfacial tension meter .................................................. 24
Fig. 3.4 DV-III Ultra rheometer and the temperature control equipment ........................ 25
Fig.3.5 Ultrasound tub (left) and high speed range blender ............................................. 26
Fig. 3.6 Centrifuge ........................................................................................................... 27
Fig. 3.7 Dewater apparatus ............................................................................................... 28
Fig. 3.8 Schematic diagram of core flooding apparatus ................................................... 29
Fig. 3.9 Sectional drawing of core holder ........................................................................ 30
Fig. 3.10 Detailed cross sectional view of the core holder .............................................. 31
Fig. 3.11 Core holder and the core sleeve ........................................................................ 31
Fig. 3.12 Data logger system of the core flooding apparatus ........................................... 33
Fig. 4.1 Isothermal emulsion ternary phase diagram ....................................................... 38
Fig. 4.2 Emulsion samples and the compositions in Zone-A of ternary diagram ............ 39
xi
Page
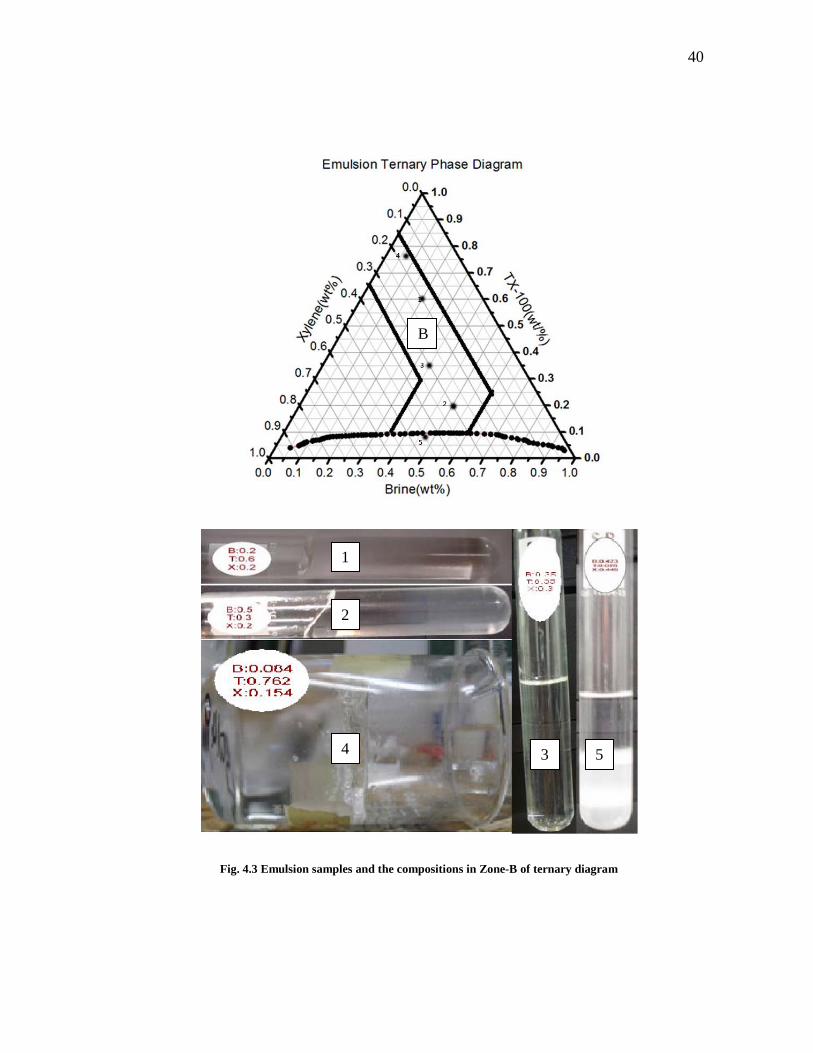
Fig. 4.3 Emulsion samples and the compositions in Zone-B of ternary diagram ............ 40
Fig. 4.4 Emulsion samples and the compositions in Zone-C of ternary diagram ............ 41
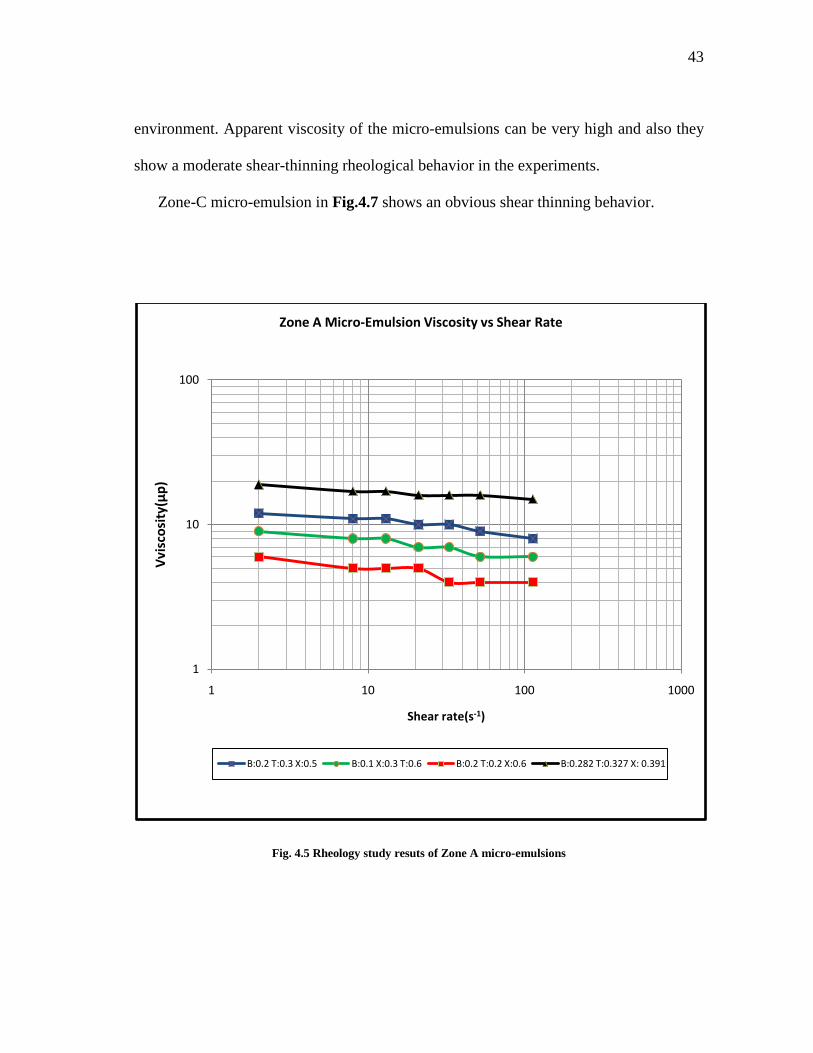
Fig. 4.5 Rheology study resuts of Zone A micro-emulsions ............................................ 43
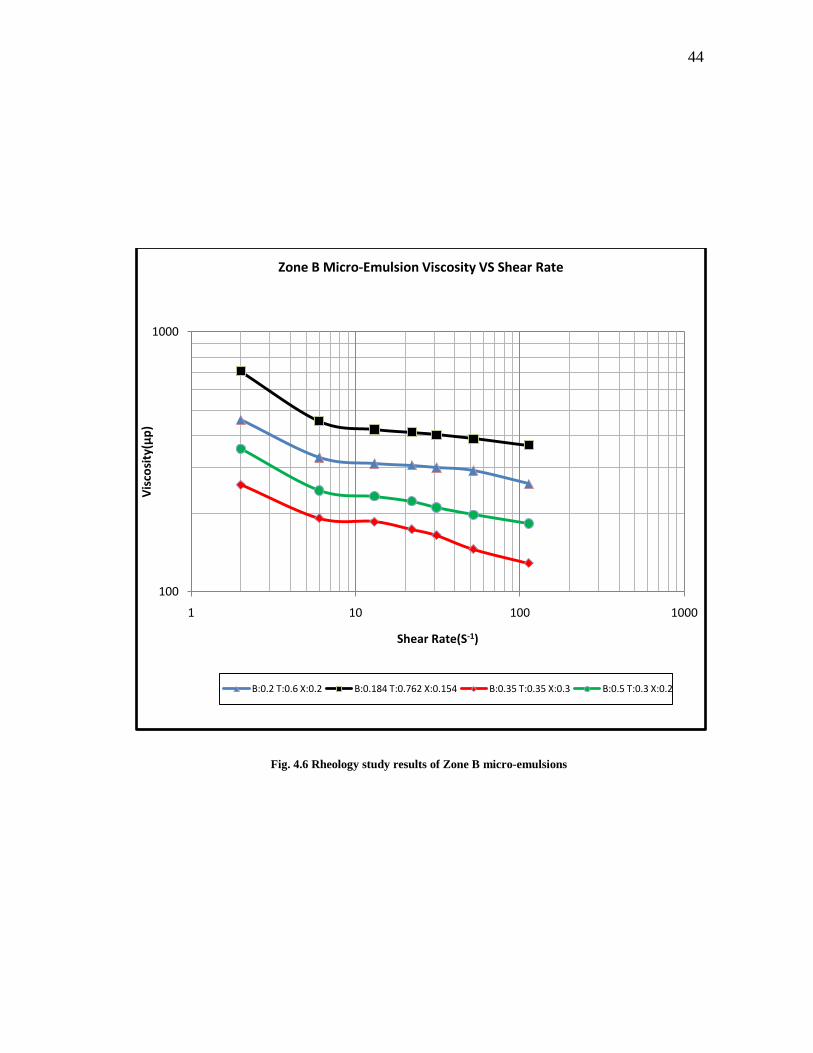
Fig. 4.6 Rheology study results of Zone B micro-emulsions ........................................... 44
Fig. 4.7 Rheology study results of Zone C micro-emulsions ........................................... 45
Fig. 4.8 Sample of the optimized micro-emulsion. .......................................................... 47
Fig. 4.9 Viscosity measurement of the optimized micro-emulsion .................................. 48
Fig. 4.10 Effect of nanoparticles on the emulsion rheology behavior ............................. 49
Fig. 4.11 Viscosity reduction of the crude oil .................................................................. 50
Fig. 4.12 Emulsion pictures under the microscope ......................................................... 51
Fig. 4.13 Picture of the crude oil emulsion ...................................................................... 51
Fig. 4.14 Case 1 core flooding experiment oil recovery profile....................................... 55
Fig. 4.15 Case 1 core flooding effluent collected in the 50 cc plastic tube. ..................... 56
Fig. 4.16 Case 1 core pictures of each core flooding stage .............................................. 57
Fig. 4.17 Case 2 core flooding experiment oil recovery profiles ..................................... 59
Fig. 4.18 Case 2 core flooding effluent collected in the 50 cc plastic tube. ..................... 60
Fig. 4.19 Case 2 core pictures of core flooding stage ...................................................... 61
Fig. 4.20 Case 3 core flooding experiment oil recovery profiles ..................................... 63
Fig. 4.21 Case 3 core flooding effluent collected in the 50 cc plastic tube. ..................... 64
Fig. 4.22 Case 3 core pictures of each flooding stage ...................................................... 65
Fig. 4.23 Case 4 core flooding experimental oil recovery profiles .................................. 67
xii
Page
Fig. 4.24 Case 4 core flooding effluent collected in the 50 cc plastic tube. ..................... 68
Fig. 4.25 Case 4 core pictures of each flooding stage ...................................................... 69
Fig. 4.26 Comparisons of the Berea core flooding experiment results ............................ 70
Fig. 4.27 Comparison of the Idaho core flooding experimental results ........................... 71
Fig. 4.28 Core flooding oil recovery profile comparison between Case 1 and Case 3 .... 72
Fig. 4.29 Core flooding oil recovery profile comparison between Case 2 and Case 4 .... 73
xiii
LIST OF TABLES
Page
Table 1.1 The oil properties of West Sak fields ................................................................. 4
Table 2.1 Comparison between macro-emulsion and micro-emulsion. ........................... 13
Table 3.1 Solvent Kauri-Butanol value table ................................................................... 20
Table 4.1 Crude oil interfacial tension measurement (77˚F, 14.7 psi) ............................. 46
Table 4.2 Optimized micro-emulsion interfacial tension measurement .......................... 47
Table 4.3 Case 1 core flooding experimental results ....................................................... 54
Table 4.4 Case 2 core flooding experiment results .......................................................... 58
Table 4.5 Case 3 core flooding experiment results .......................................................... 62
Table 4.6 Case 4 core flooding experiment results .......................................................... 66
1
1. INTRODUCTION
The term, unconventional oil, typically refers to heavy oil (10-20oAPI), extra heavy
oil (<10oAPI,<10,000cp) and bitumen(<10oAPI,>10,000cp). With increasing demand for
oil of the world, there has been a steady shift of attention to unconventional petroleum
resources. Unconventional oil is one of the options. Totally it accounts for almost 70%
known and technically accessible fossil fuel resources in the world. In this proposal, we
use the term “unconventional oil” to be synonymous with the term “heavy oil”.
Heavy oil resources are located in over 70 countries in the world. A map of Heavy
oil locations is presented below in Fig. 1.1. There are huge and famous heavy oil
resources in Canada, Venezuela, Russia, Alaska and many other countries. Canada and
Venezuela, these two countries account for 3.9 trillion barrels of heavy oil reserves.1
Due to its very high viscosity and thus extremely low mobility comparing to light oil
at reservoir condition, unconventional production methods have been used to extract it.
Canada, Venezuela, and the United States maintain the leading position in heavy oil
production. In Canada, open-pit mining of the shallow oil sands provides approximately
50% of the nation’s heavy oil production. And cold heavy oil production with sand
(CHOPS) and thermal production endows the remainder part. In Venezuela, complex
well cold production predominates. In the USA, thermal production by injecting steam is
the primary production method. However, there are still several barriers to the growth of
the heavy oil production. For example, open-pit mining has a large environmental
impact and can only exploit resources near the surface. Also the thermal method due to
The thesis follows the style of Journal of Petroleum Science and Engineering.

2
the steam generation releases the large amount of CO2, which leads to the global
warming issue. Otherwise, the thermal production needs some strictly unforgiving
reservoir geological conditions, in the order of 8 meters, the heat loss to the overburden
and underburden formation makes the thermal recovery particularly uneconomical. If the
fractures are developed in the reservoir, the problem becomes the heat or steam through
the fractures to aquifers formation. Some cases are even more challenging. For instance,
the Alaska North Slope heavy oil reservoirs are covered by permafrost which is easy to
be destroyed by the steam injection. But there is 30 billion barrels original oil in place in
Alaska North Slope area, up to one-fourth of which could be recoverable. The resources
there are indispensable to fill the fossil fuels gap for the United States energy demands in
the next decade even with aggressive development and deployment of new renewable
and nuclear technologies.
Fig. 1.1 Distribution of worldwide heavy oil resources (Thomas 2007)

3
1.1 Overview of Alaska North Slope Heavy Oil
The Alaska North Slope is famous for its secondary large heavy oil reserves in
United States, primarily in two remote area, the West Sak and Ugnu sands. Fig. 1.2
shows the ANS area below.
Fig. 1.2 Map of ANS area and distribution of oil extraction activities (Thomas 2007)
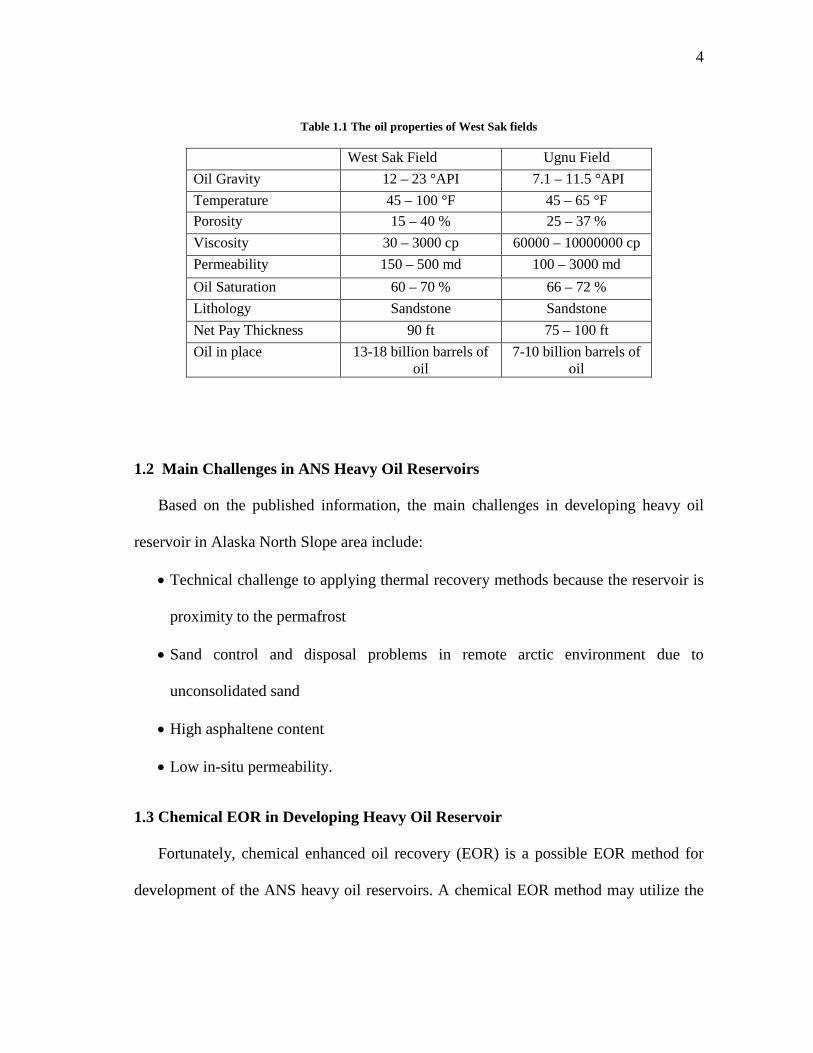
In the research, I use oil samples obtained from West Sak field. Table 1.1 lists the oil
properties in ANS area and Ugnu.
4
Table 1.1 The oil properties of West Sak fields
West Sak Field Ugnu Field Oil Gravity 12 – 23 °API 7.1 – 11.5 °API Temperature 45 – 100 °F 45 – 65 °F Porosity 15 – 40 % 25 – 37 % Viscosity 30 – 3000 cp 60000 – 10000000 cp Permeability 150 – 500 md 100 – 3000 md Oil Saturation 60 – 70 % 66 – 72 % Lithology Sandstone Sandstone Net Pay Thickness 90 ft 75 – 100 ft Oil in place 13-18 billion barrels of
oil 7-10 billion barrels of
oil
1.2 Main Challenges in ANS Heavy Oil Reservoirs
Based on the published information, the main challenges in developing heavy oil
reservoir in Alaska North Slope area include:
• Technical challenge to applying thermal recovery methods because the reservoir is
proximity to the permafrost
• Sand control and disposal problems in remote arctic environment due to
unconsolidated sand
• High asphaltene content
• Low in-situ permeability.
1.3 Chemical EOR in Developing Heavy Oil Reservoir
Fortunately, chemical enhanced oil recovery (EOR) is a possible EOR method for
development of the ANS heavy oil reservoirs. A chemical EOR method may utilize the
5
facilities built in Alaska oil fields and would not destroy the permafrost over the
reservoir and would not affect the formation as thermal EOR would. However, there is
not sensitive to the geological condition like thermal production. However, there is no
on-going commercial industry project using the chemical EOR in Alaska heavy oil
reservoirs. And there are only three or four small chemical EOR projects in conventional
oil reservoirs in the United States. Only a few exploratory researches in heavy oil
chemical EOR area published in recently years. My research is also an exploratory
research in this area.
Compared with the conventional chemical EOR methods used in conventional oil
reservoir, some new ideas have been developed in the research stemming from the
differences between light oil and heavy oil properties. In my research, heavy oil
viscosity reduction is the key factor in the enhanced oil recovery process and heavy oil
in situ emulsification is another critical factor.
This research presents an experimental evaluation of the potential application of
solvent based emulsion to recover heavy oil from the thin, cold, permafrost over or other
kind of steam-non-suitable reservoirs. The solvent based emulsion flooding can provide
the high displacement efficiency like miscible solvent flooding and better sweep
efficiency like polymer flooding.
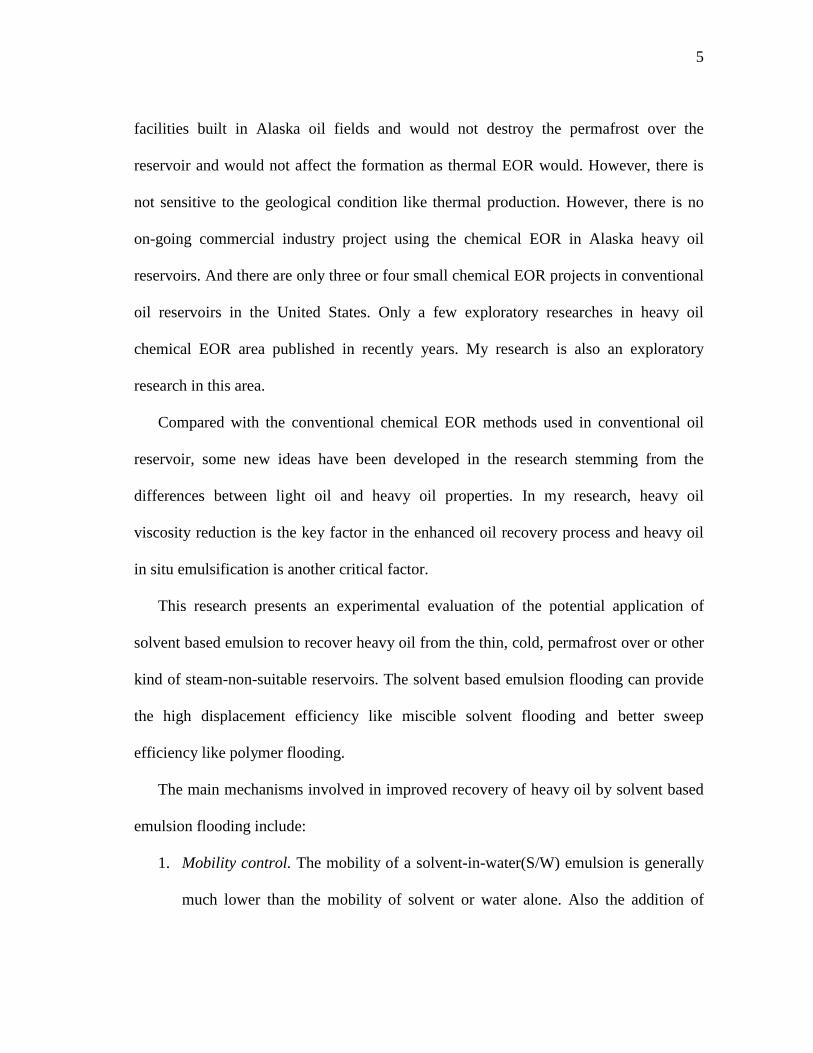
The main mechanisms involved in improved recovery of heavy oil by solvent based
emulsion flooding include:
1. Mobility control. The mobility of a solvent-in-water(S/W) emulsion is generally
much lower than the mobility of solvent or water alone. Also the addition of
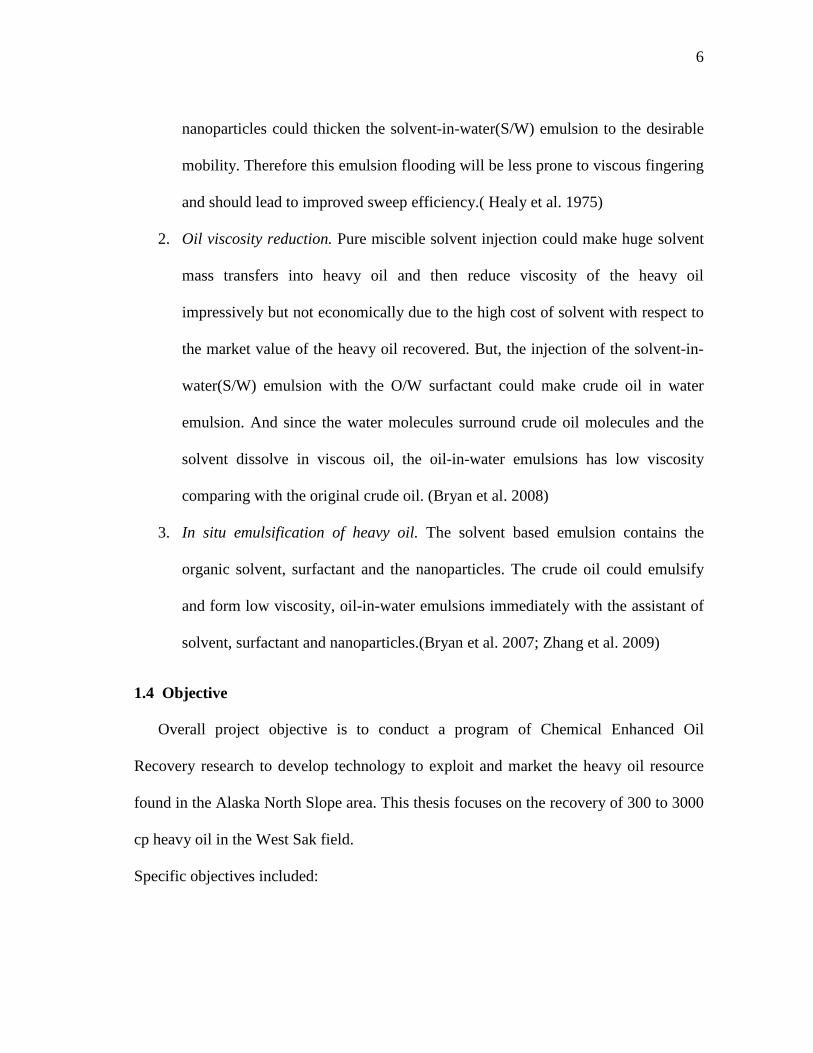
6
nanoparticles could thicken the solvent-in-water(S/W) emulsion to the desirable
mobility. Therefore this emulsion flooding will be less prone to viscous fingering
and should lead to improved sweep efficiency.( Healy et al. 1975)
2. Oil viscosity reduction. Pure miscible solvent injection could make huge solvent
mass transfers into heavy oil and then reduce viscosity of the heavy oil
impressively but not economically due to the high cost of solvent with respect to
the market value of the heavy oil recovered. But, the injection of the solvent-in-
water(S/W) emulsion with the O/W surfactant could make crude oil in water
emulsion. And since the water molecules surround crude oil molecules and the
solvent dissolve in viscous oil, the oil-in-water emulsions has low viscosity
comparing with the original crude oil. (Bryan et al. 2008)
3. In situ emulsification of heavy oil. The solvent based emulsion contains the
organic solvent, surfactant and the nanoparticles. The crude oil could emulsify
and form low viscosity, oil-in-water emulsions immediately with the assistant of
solvent, surfactant and nanoparticles.(Bryan et al. 2007; Zhang et al. 2009)
1.4 Objective
Overall project objective is to conduct a program of Chemical Enhanced Oil
Recovery research to develop technology to exploit and market the heavy oil resource
found in the Alaska North Slope area. This thesis focuses on the recovery of 300 to 3000
cp heavy oil in the West Sak field.
Specific objectives included:
7
I. Investigate the fundamental solvent based emulsion flooding mechanisms in
heavy oil reservoir
II. Evaluate the solvent-based emulsion and heavy oil emulsion property (IFT,
Phase behavior and Rheology, etc) to find the technical and economical feasible
emulsion to develop the reservoir.
III. Study on core flooding to analyze the EOR recovery effect.
IV. Collect relevant data needed to simulate in-situ recovery processes for the
recovery of North Slope heavy oils, especially West Sak.
8
2. ENHANCED OIL RECOVERY-AN OVERVIEW
Five trillion barrels of heavy oil worldwide will remain in the reservoir after primary
and secondary recovery methods have been utilized. Most of this heavy oil may
probably be recovered by enhanced oil recovery (EOR) methods. The EOR method
chosen for a particular reservoir depends on geological, technological as well as
economical factors. But only a few EOR methods have been carried out in the field
successfully, such as steam injection in heavy oil reservoir and miscible carbon dioxide
for light oil reservoirs. The industry currently applies the thermal method to develop the
heavy oil reservoir such like cyclic steam injection, steam-flooding, steam assisted
gravity drainage (SAGD) and in situ combustion. Many chemical EOR projects were
operated in the 1980’s worldwide, some of which were successful, but most failed. The
chemical EOR operations are not active currently except in China. However the industry
gained valuable experiences and a better understanding of chemical EOR since the
research has not been interrupted in last 30 years. And because of the environmental and
geological issues related to thermal method and the vast heavy oil reserves, the industry
has recently embarked on investigation on the feasibility of chemical EOR application in
heavy oil reservoirs. (Mai et al. 2009)
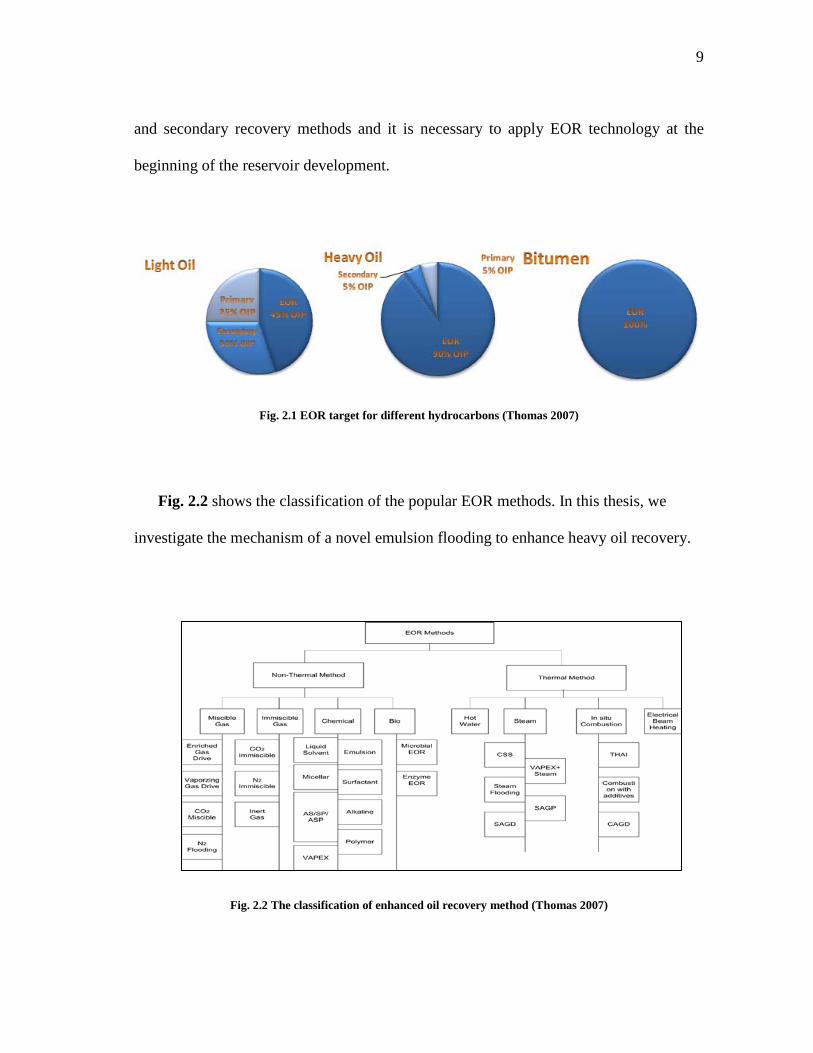
EOR refers to the processes that increase oil recovery by reduction of the residual oil
saturation after primary and secondary production. And the objectives of an EOR
process depend on the oil type. Fig. 2.1 shows the different EOR targets for typical light
oil, heavy oil and bitumen. Heavy oil and bitumen have very poor response to primary
9
and secondary recovery methods and it is necessary to apply EOR technology at the
beginning of the reservoir development.
Fig. 2.1 EOR target for different hydrocarbons (Thomas 2007)
Fig. 2.2 shows the classification of the popular EOR methods. In this thesis, we
investigate the mechanism of a novel emulsion flooding to enhance heavy oil recovery.
Fig. 2.2 The classification of enhanced oil recovery method (Thomas 2007)
10
2.1 EOR Mechanism
Generally, the oil recovery factor may be viewed as consisting of two parts,
displacement efficiency(ED) and sweep efficiency (ES). Displacement efficiency is
controlled by capillary number (NC) and mobility ratio (M) dominates the sweep
efficiency. Capillary number is defined as NC = 𝑣𝑣𝑣𝑣/𝜎𝜎, where 𝑣𝑣 is the Darcy velocity and
𝑣𝑣 is the viscosity of the displacing fluid, 𝜎𝜎 is the interfacial tension.
The capillary forces are responsible for oil droplet trapped in the porous medium,
and the entrapped oil could be mobilized only by exceeding the capillary force. Capillary
number is a significant parameter to evaluate the interaction between the viscous force
and capillary forces. Both of them directly affect the residual oil saturation.
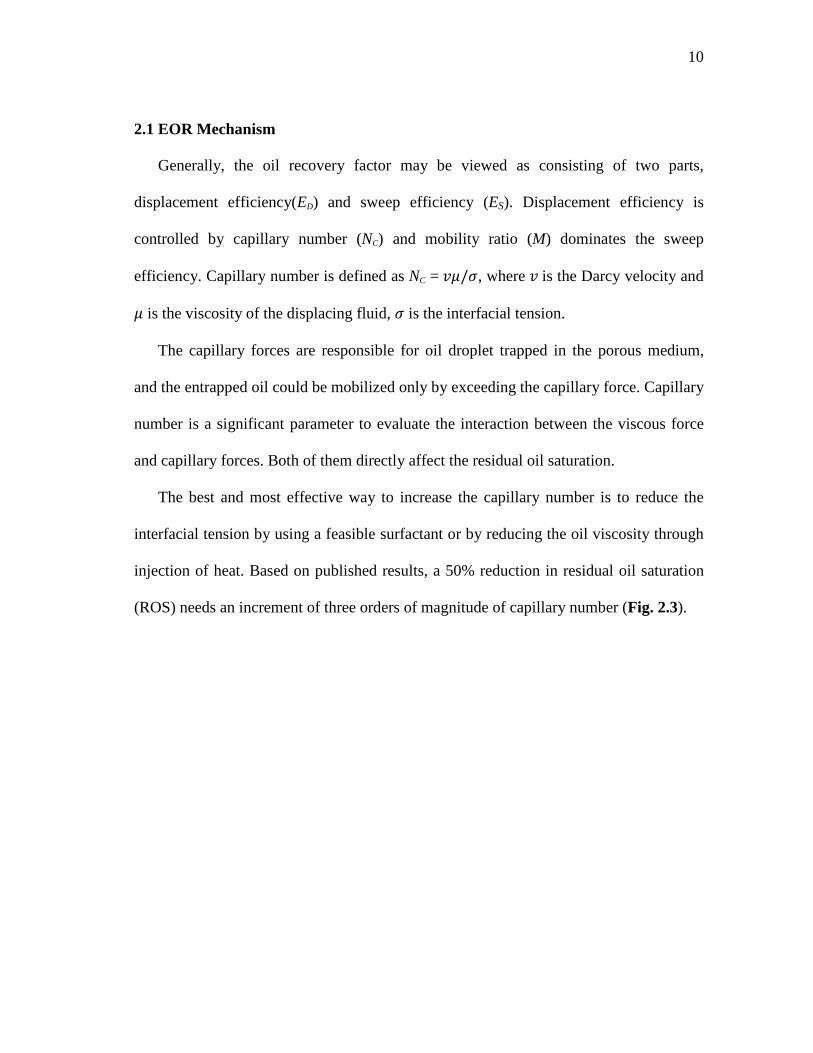
The best and most effective way to increase the capillary number is to reduce the
interfacial tension by using a feasible surfactant or by reducing the oil viscosity through
injection of heat. Based on published results, a 50% reduction in residual oil saturation
(ROS) needs an increment of three orders of magnitude of capillary number (Fig. 2.3).
11
Fig. 2.3 Relationship between ROS and capillary number(Thomas 2007)
A miscible flooding could be understood as a process when the interfacial tension
becomes zero since the displacing phase. In this case, the capillary number is infinity
and the residual oil saturation is zero.
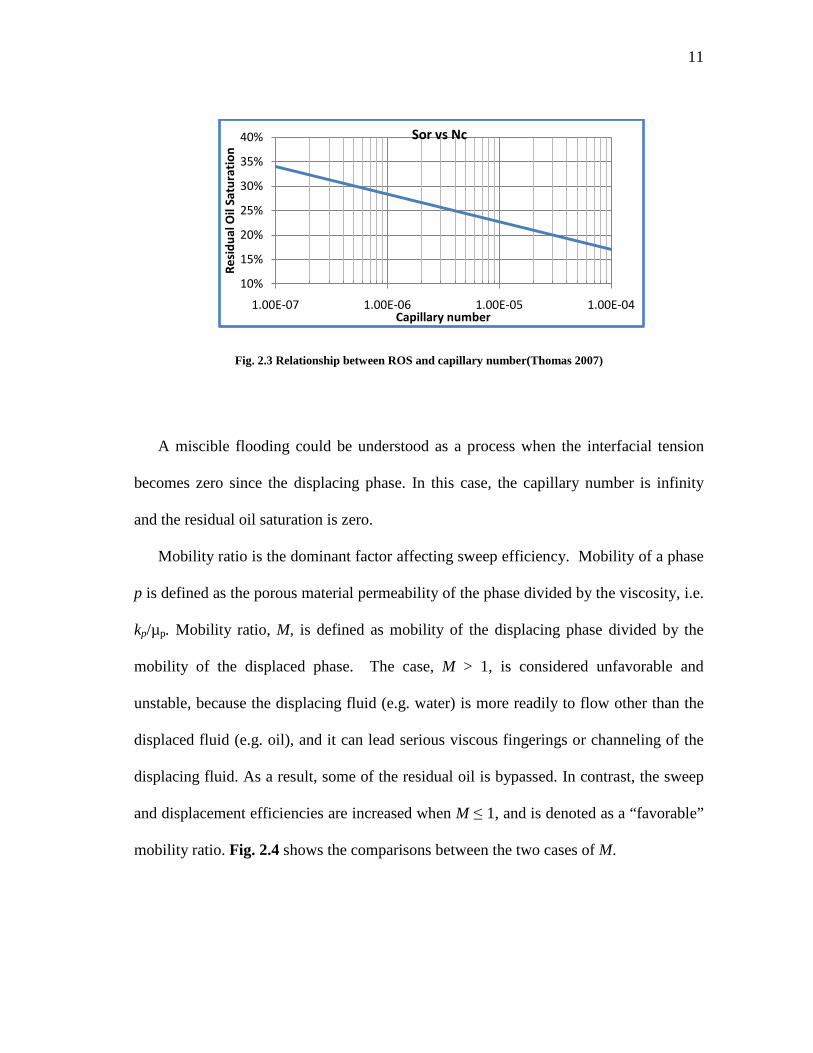
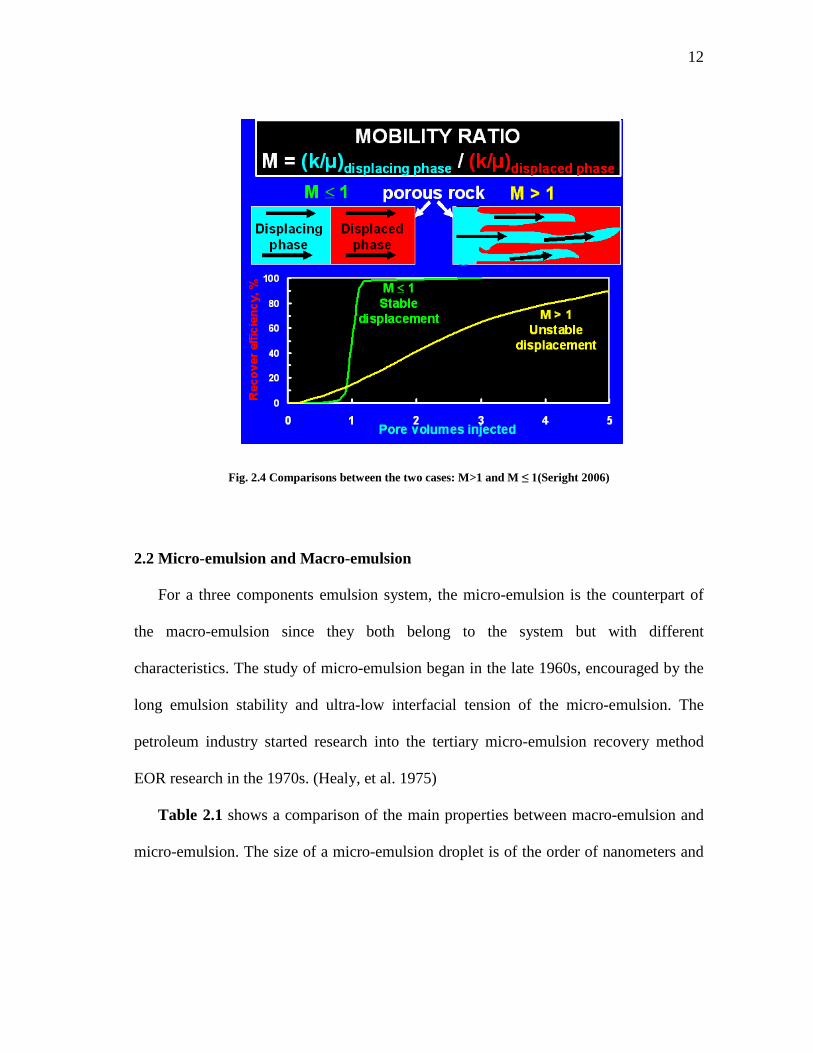
Mobility ratio is the dominant factor affecting sweep efficiency. Mobility of a phase
p is defined as the porous material permeability of the phase divided by the viscosity, i.e.
kp/µp. Mobility ratio, M, is defined as mobility of the displacing phase divided by the
mobility of the displaced phase. The case, M > 1, is considered unfavorable and
unstable, because the displacing fluid (e.g. water) is more readily to flow other than the
displaced fluid (e.g. oil), and it can lead serious viscous fingerings or channeling of the
displacing fluid. As a result, some of the residual oil is bypassed. In contrast, the sweep
and displacement efficiencies are increased when M ≤ 1, and is denoted as a “favorable”
mobility ratio. Fig. 2.4 shows the comparisons between the two cases of M.
10%
15%
20%
25%
30%
35%
40%
1.00E-07 1.00E-06 1.00E-05 1.00E-04
Resi
dual
Oil
Satu
ratio
n
Capillary number
Sor vs Nc
12
Fig. 2.4 Comparisons between the two cases: M>1 and M ≤ 1(Seright 2006)
2.2 Micro-emulsion and Macro-emulsion
For a three components emulsion system, the micro-emulsion is the counterpart of
the macro-emulsion since they both belong to the system but with different
characteristics. The study of micro-emulsion began in the late 1960s, encouraged by the
long emulsion stability and ultra-low interfacial tension of the micro-emulsion. The
petroleum industry started research into the tertiary micro-emulsion recovery method
EOR research in the 1970s. (Healy, et al. 1975)
Table 2.1 shows a comparison of the main properties between macro-emulsion and
micro-emulsion. The size of a micro-emulsion droplet is of the order of nanometers and
13
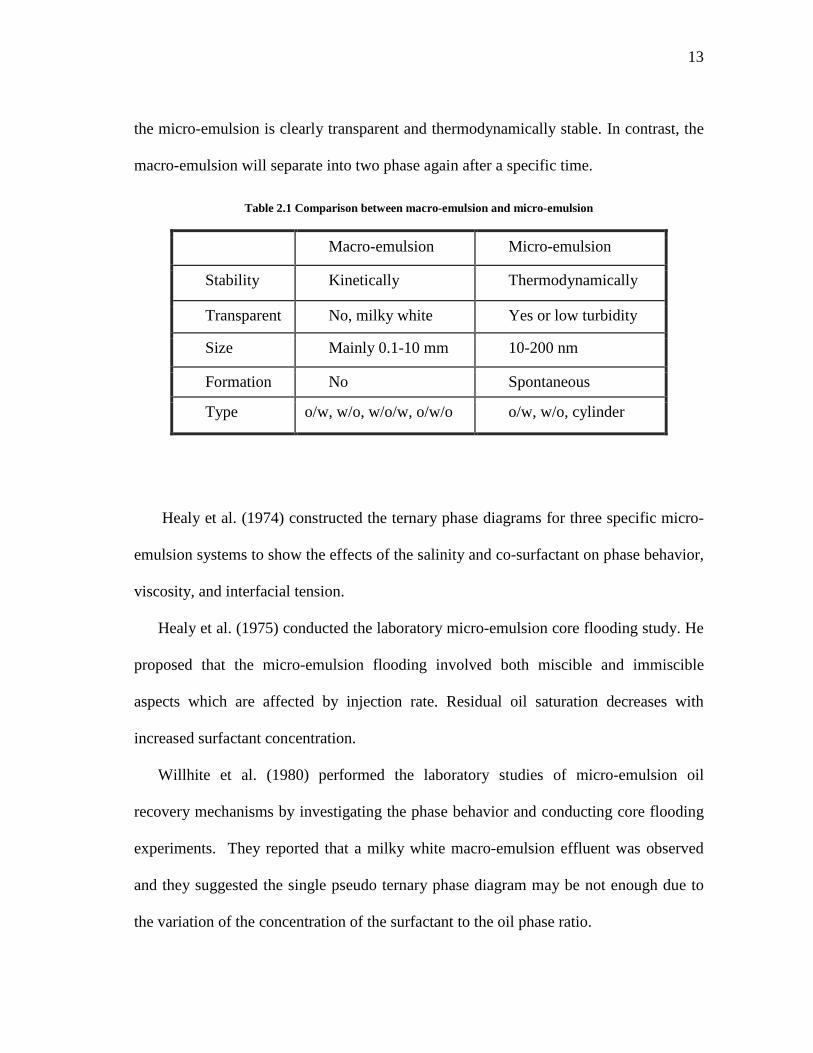
the micro-emulsion is clearly transparent and thermodynamically stable. In contrast, the
macro-emulsion will separate into two phase again after a specific time.
Table 2.1 Comparison between macro-emulsion and micro-emulsion
Macro-emulsion Micro-emulsion
Stability Kinetically Thermodynamically
Transparent No, milky white Yes or low turbidity
Size Mainly 0.1-10 mm 10-200 nm
Formation No Spontaneous
Type o/w, w/o, w/o/w, o/w/o o/w, w/o, cylinder
Healy et al. (1974) constructed the ternary phase diagrams for three specific micro-
emulsion systems to show the effects of the salinity and co-surfactant on phase behavior,
viscosity, and interfacial tension.
Healy et al. (1975) conducted the laboratory micro-emulsion core flooding study. He
proposed that the micro-emulsion flooding involved both miscible and immiscible
aspects which are affected by injection rate. Residual oil saturation decreases with
increased surfactant concentration.
Willhite et al. (1980) performed the laboratory studies of micro-emulsion oil
recovery mechanisms by investigating the phase behavior and conducting core flooding
experiments. They reported that a milky white macro-emulsion effluent was observed
and they suggested the single pseudo ternary phase diagram may be not enough due to
the variation of the concentration of the surfactant to the oil phase ratio.
14
Bennett et al. (1981) examined the rheological properties of the micro-emulsion and
reported the Newtonian and Non-Newtonian behavior.
Bouabboune et al.(2006) made the comparisons between micro-emulsion flooding
and surfactant flooding efficiency in a light oil reservoir. They pointed out that the
micro-emulsion flooding process is the unique and effective method for the high water
containing or depleted reservoir. They optimized the surfactant concentration and micro-
emulsion viscosity for the flooding purposes. They concluded that micro-emulsion
flooding is more efficient than the surfactant flooding.
2.3 Chemical EOR in Heavy Oil Reservoir In heavy oil development case, after the primary and secondary production, the
residual oil is largely bypassed due to viscous finger caused by the adverse mobility ratio
between oil and water. The bypassed oil is not like the residual oil in light oil reservoir is
discontinuous ganglia. Consequently, numerous chemical EOR researches are conducted
to improve oil recovery after water flooding in heavy oil reservoir.
Generally, the heavy oil chemical EOR technology can be applied to the heavy oil
reservoir containing oil of 10˚to 20˚ API gravity and viscosities below 15,000
centipoises.
In this research, solvent, surfactant and nanoparticles are used at low concentration
levels in water and help reduce viscosity by forming a water-external crude oil emulsion.
It is an economical and environmental friendly alternative to other heavy oil recovery
techniques such as steam flooding. Also a wide range of temperatures and salinity
resistance can be tolerated by this emulsion system.
15
Binder et al. (1965) raised the idea to inject an oil-in water emulsion to improve the
heavy oil recovery in his patent. They recognized the necessity to increase the displacing
fluid viscosity to tune the mobility ratio during the viscous oil reservoir water flooding.
They mentioned that the oil-in-water emulsion might make up the whole driving fluid
body or a portion of the driving fluid. The core flooding results indicated that 78% of the
oil in place was recovered at the breakthrough and 83% recovery factor was reached by
injecting one pore volume emulsion. And the produced emulsion was very similar in
characteristics to the emulsion injected.
McAuliffe et al. (1973) reported the first oil field application in emulsion flooding.
The field trial was in Section 5K of the Midway Sunset field, California. The emulsion
with average droplet diameter in 3 microns and viscosity in 200 cp were pumped into the
well. In the 2-year period, three emulsion injection wells showed lower water cut and
increased oil recovery and water tracer studies showed that sweep efficiency was
improved. In all 33,000 bbl of crude oil emulsion (3 percent of PV) was injected, while
55,000 bbl of additional oil had been produced.
Van der Knaap et al. (1970) mentioned the simultaneous injection of solvent and
water into high-viscosity crude oil reservoir, and the solvent only occupied a small
amount in the injected fluid. Also the solvent could be re-injected after it was recovered
from the produced fluid. The simultaneous injection could form unstable solvent in
water emulsion which could overcome the viscous finger tendency of the solvent alone.
Bousaid (1978) proposed a surfactant stabilized solvent in water emulsion injection
to improve heavy oil recovery method. The surfactant concentration may vary during the
16
injection process and different hydrocarbon as solvent could be used in making the
emulsion.
Sarma et al (1995) summarized the mechanism of the solvent in water emulsion
flooding including mobility control, viscosity reduction by solvent dissolution, oil
mobilization by in situ emulsification and phase interfacial tension reduction. The
viscosity reduction improved but mobility control worsened with the surfactant
concentration decreasing. The economical evaluation of solvent in water emulsion
flooding shows that the continuous injection is not economical.
Bryan et al (2007) investigated the potential application of the alkali-surfactant
flooding in heavy oil reservoir. The in situ emulsification is the main mechanism for this
process due to both alkaline and surfactant could lower the interfacial tension between
water and oil phase. The experiment results suggest the water-wet rock and oil in water
emulsion are preferred because the low viscosity character of the O/W emulsions could
facilitate the production.
Flaaten et al (2008) and Zhang et al (2009) discussed the potential application of the
nanoparticles stabilized emulsion system in petroleum industry. The toluene in water
emulsions are generated with assistant of a bit of nanoparticles. The study of the
emulsion stability and phase behavior are reported and the emulsion‘s piston-like front
flooding is observed.
In summary, previous research provide a general but not very clear direction in
application of solvent in water or oil in water emulsion flooding in the development of

17
heavy oil reservoir. In this thesis, I would like to continue an exploratory research in this
area and propose a solvent-emulsion meth.
18
3. EXPERIMENTAL SET-UP AND PROCEDURES
The experimental study can be generally divided into two parts:
(1) Bench tests of the properties of solvent based emulsion and the crude oil
emulsion.
(2) Core flooding experiments to investigate the effect of the various injection on oil
recovery factor.
3.1 Experimental Materials
3.1.1 Sandstone Core
Two different sandstone cores were used in the core flooding experiment. The
permeability of Buff Berea core is 200 mD and Idaho sandstone core is 800 mD. All the
cores are in cylinder shape with 12 in long and 1 inch in diameter.
3.1.2 Nitrogen
Nitrogen was used to maintain the back pressure of the production system. It was
stored in cylinders with an initial pressure of 2500 psi.
3.1.3 Crude Oil
The crude oil comes from the West Sak in Alaska North Slope area provided by
British Petroleum, which has an oil gravity of 16.35˚API or 0.9513 g/cm3 after
dewatering in the lab.

19
3.1.4 Brine Solution
1wt% sodium chloride was added to the de-ionized water to make the 10000ppm
NaCl brine solution. The brine solution was used to saturate and flood the core and make
the solvent base emulsion.
3.1.5 Surfactant
The nonionic surfactant,Triton X-100(Octyphenol Ethoxylate) was used to make
emulsion. The surfactant formula is . The HLB of the surfactant is
13.5, so it intends to help generate oil in water emulsion. The viscosity is 240cp at 77˚F.
3.1.6 Nanoparticles
Nanoparticle- CAB-O-SIL® TS-530 is used to stabilize the emulsion with the
surfactant. It could thicken the solvent based emulsion and provide excellent sag
resistance flow character which means less absorption by the rock. Also due to the high
surface area, it could help form emulsion with no or less surfactant needed.
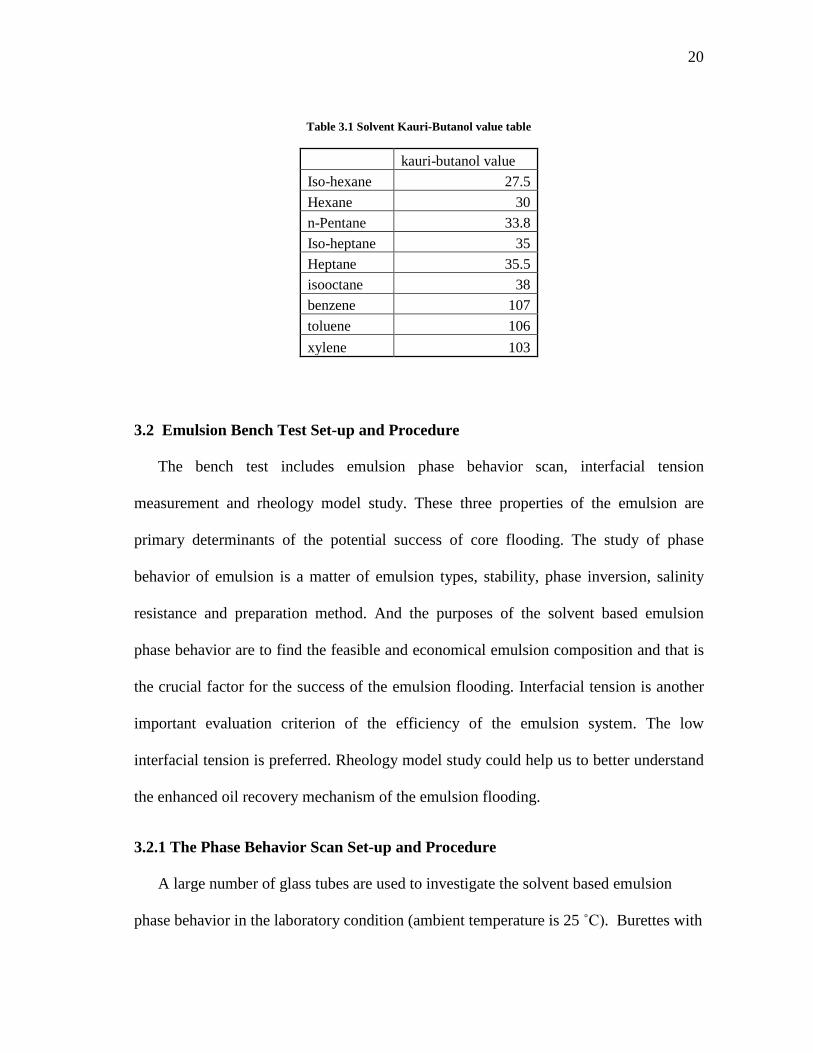
3.1.7 Solvent
The solvent, xylene, plays as the oil phase part in the solvent based emulsion system.
According to the Kauri-butanol value (“Kb value”) table which is an international
standardized measure of solvent power for a hydrocarbon solvent, xylene is one of the
most powerful solvent. (See Table 3.1)
20
Table 3.1 Solvent Kauri-Butanol value table
kauri-butanol value Iso-hexane 27.5 Hexane 30 n-Pentane 33.8 Iso-heptane 35 Heptane 35.5 isooctane 38 benzene 107 toluene 106 xylene 103
3.2 Emulsion Bench Test Set-up and Procedure
The bench test includes emulsion phase behavior scan, interfacial tension
measurement and rheology model study. These three properties of the emulsion are
primary determinants of the potential success of core flooding. The study of phase
behavior of emulsion is a matter of emulsion types, stability, phase inversion, salinity
resistance and preparation method. And the purposes of the solvent based emulsion
phase behavior are to find the feasible and economical emulsion composition and that is
the crucial factor for the success of the emulsion flooding. Interfacial tension is another
important evaluation criterion of the efficiency of the emulsion system. The low
interfacial tension is preferred. Rheology model study could help us to better understand
the enhanced oil recovery mechanism of the emulsion flooding.
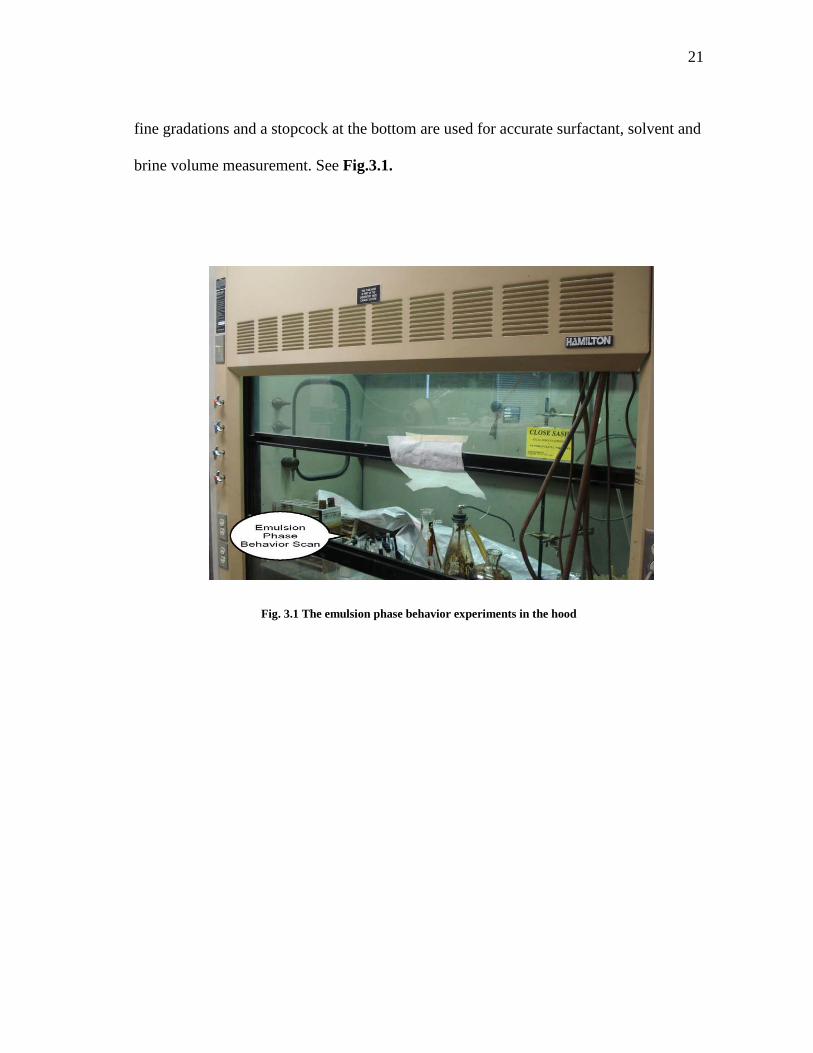
3.2.1 The Phase Behavior Scan Set-up and Procedure
A large number of glass tubes are used to investigate the solvent based emulsion
phase behavior in the laboratory condition (ambient temperature is 25 ˚C). Burettes with
21
fine gradations and a stopcock at the bottom are used for accurate surfactant, solvent and
brine volume measurement. See Fig.3.1.
Fig. 3.1 The emulsion phase behavior experiments in the hood
22
The procedure to make solvent emulsion is summarized as follows:
1. Prepare the glass tubes and fill the two different burettes with Xylene and TX-
100
2. Make 10000 ppm NaCl brine by using de-ionized water and reagent grade NaCl.
3. Mix the solvent, TX-100 and brine with different concentration in the glass tubes
and agitate them in the ultrasound bathtub. The critical emulsion compositions
which could separate the diagram into micro-emulsion and macro-emulsion
region were examined by adding five drops (250µl) water into one verified
micro-emulsion one time and waiting for at least one hour to check the possible
changes until the separation phenomena or macro-emulsion performed. Totally,
about hundreds of the experiments have been done.
4. Observe the emulsion for a minimum of 12 hours to sort the emulsion type based
on the emulsion stability, emulsion transparency, emulsion droplet size and
emulsion formation.
23
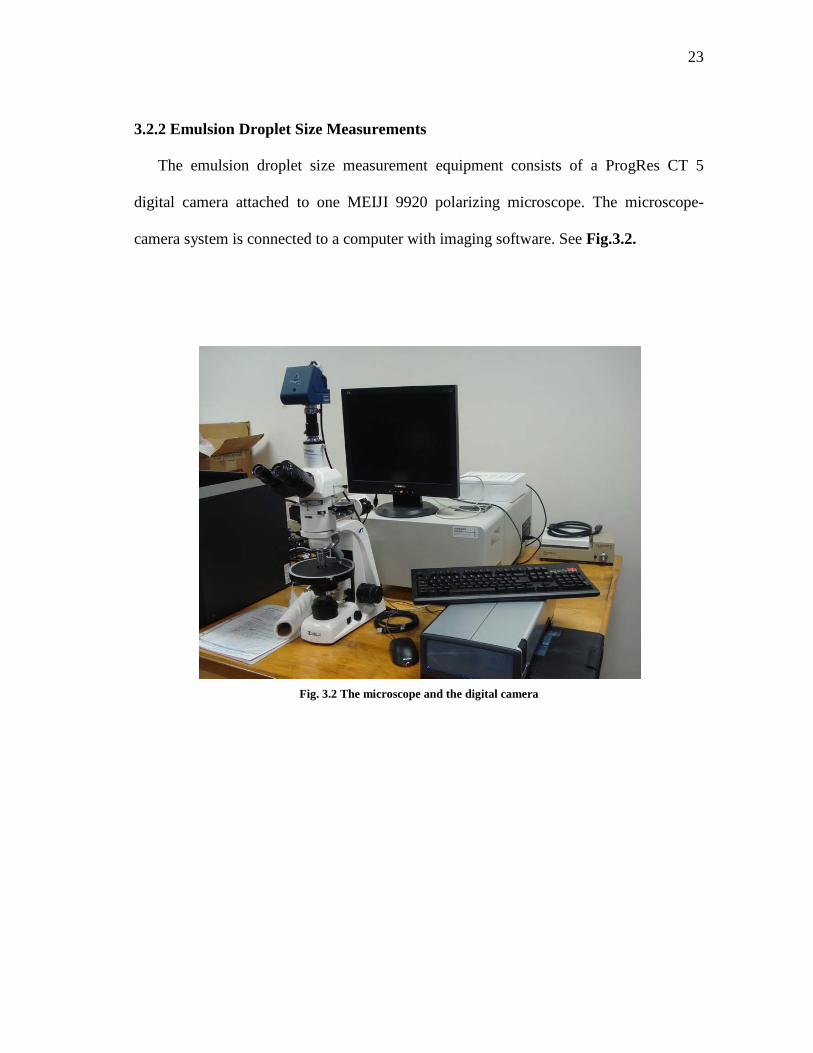
3.2.2 Emulsion Droplet Size Measurements
The emulsion droplet size measurement equipment consists of a ProgRes CT 5
digital camera attached to one MEIJI 9920 polarizing microscope. The microscope-
camera system is connected to a computer with imaging software. See Fig.3.2.
Fig. 3.2 The microscope and the digital camera
24
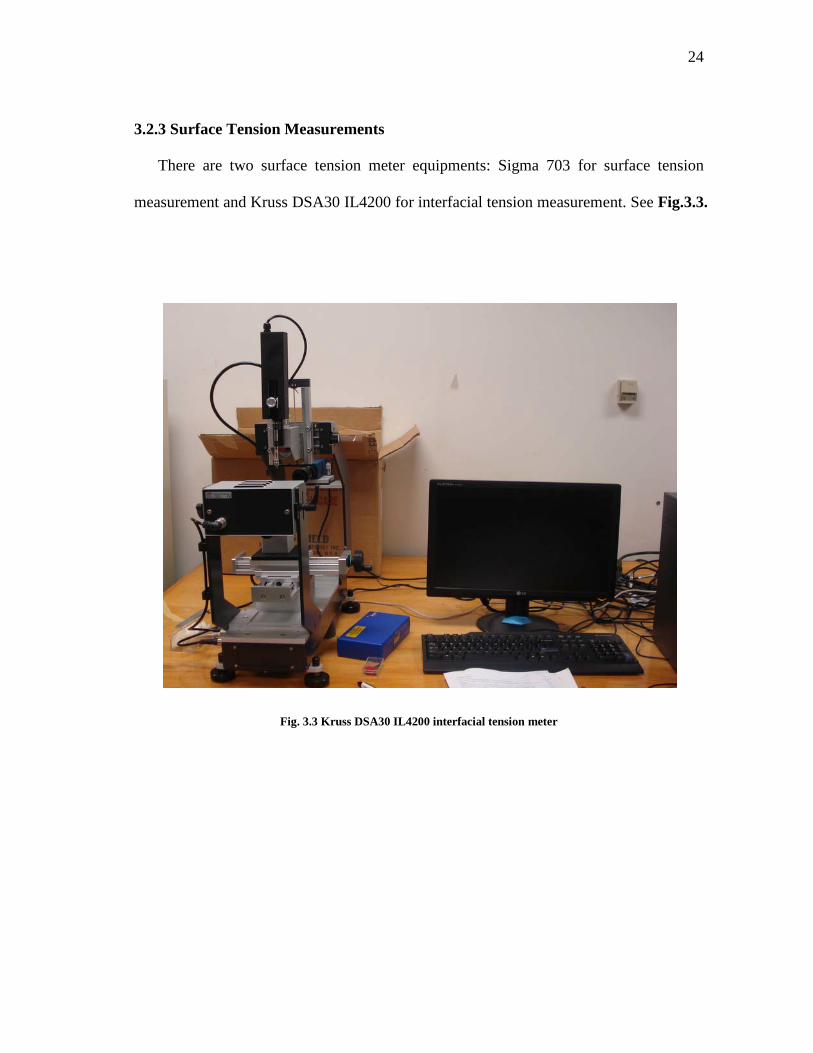
3.2.3 Surface Tension Measurements
There are two surface tension meter equipments: Sigma 703 for surface tension
measurement and Kruss DSA30 IL4200 for interfacial tension measurement. See Fig.3.3.
Fig. 3.3 Kruss DSA30 IL4200 interfacial tension meter
25
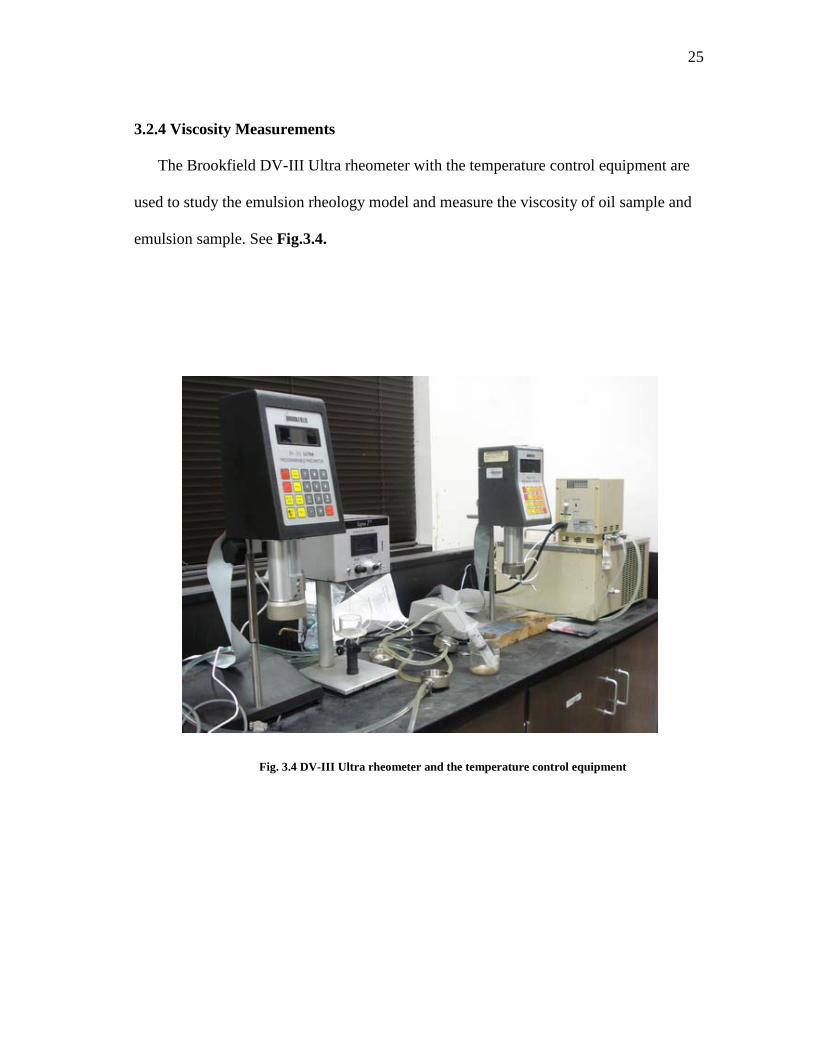
3.2.4 Viscosity Measurements
The Brookfield DV-III Ultra rheometer with the temperature control equipment are
used to study the emulsion rheology model and measure the viscosity of oil sample and
emulsion sample. See Fig.3.4.
Fig. 3.4 DV-III Ultra rheometer and the temperature control equipment
26
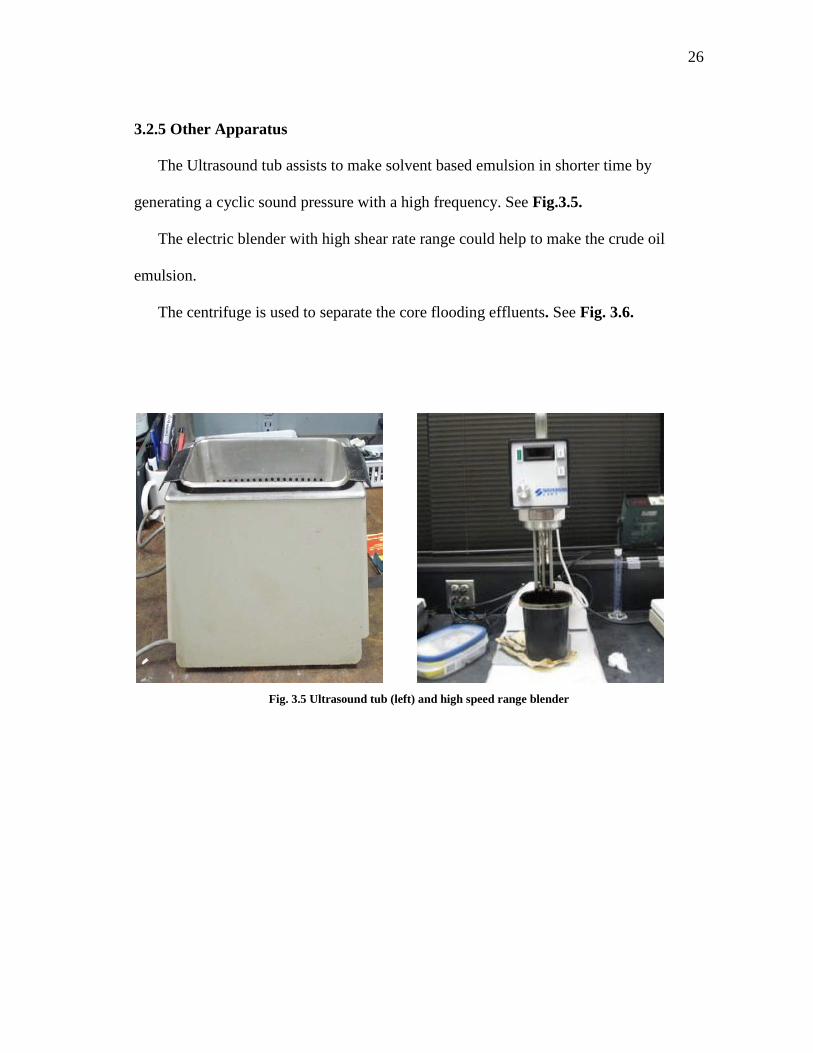
3.2.5 Other Apparatus
The Ultrasound tub assists to make solvent based emulsion in shorter time by
generating a cyclic sound pressure with a high frequency. See Fig.3.5.
The electric blender with high shear rate range could help to make the crude oil
emulsion.
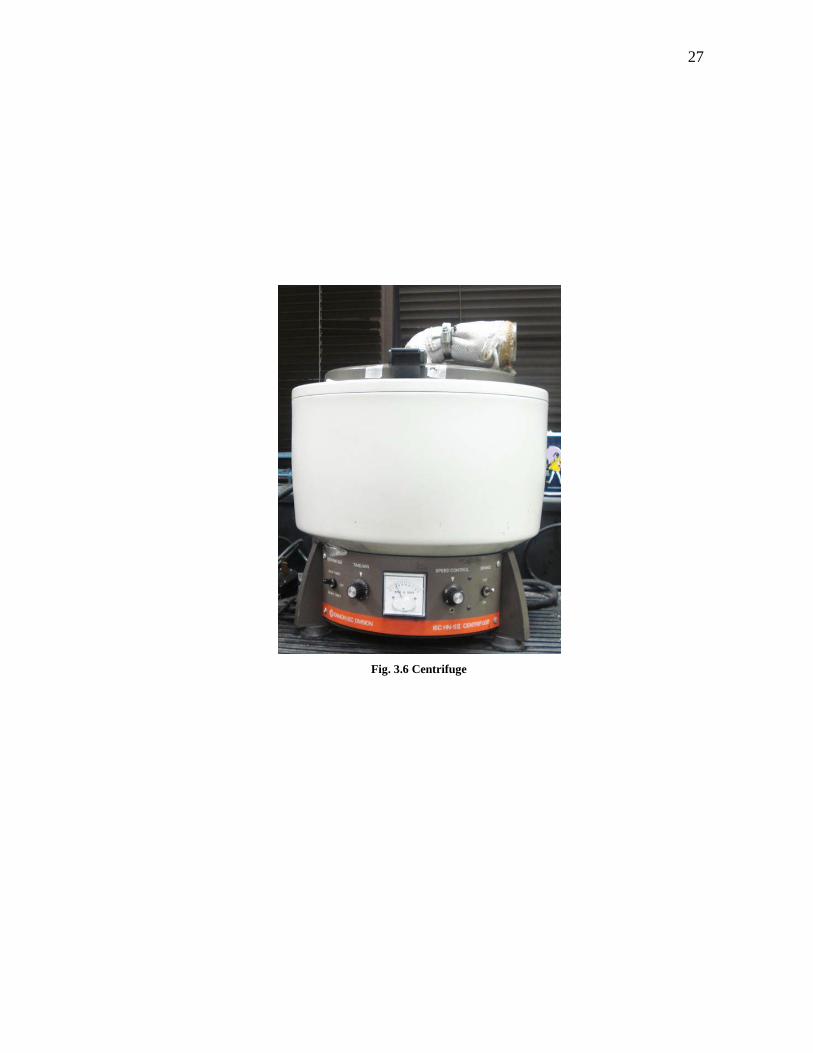
The centrifuge is used to separate the core flooding effluents. See Fig. 3.6.
Fig. 3.5 Ultrasound tub (left) and high speed range blender
27
Fig. 3.6 Centrifuge
28
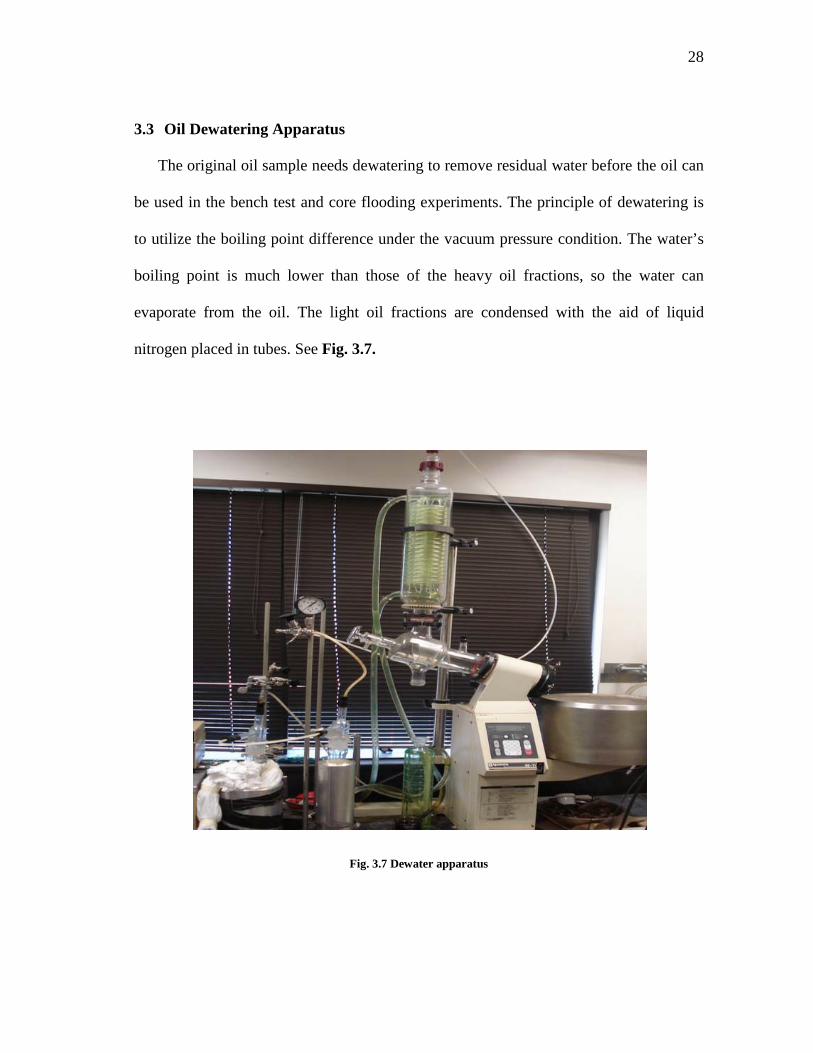
3.3 Oil Dewatering Apparatus
The original oil sample needs dewatering to remove residual water before the oil can
be used in the bench test and core flooding experiments. The principle of dewatering is
to utilize the boiling point difference under the vacuum pressure condition. The water’s
boiling point is much lower than those of the heavy oil fractions, so the water can
evaporate from the oil. The light oil fractions are condensed with the aid of liquid
nitrogen placed in tubes. See Fig. 3.7.
Fig. 3.7 Dewater apparatus
29
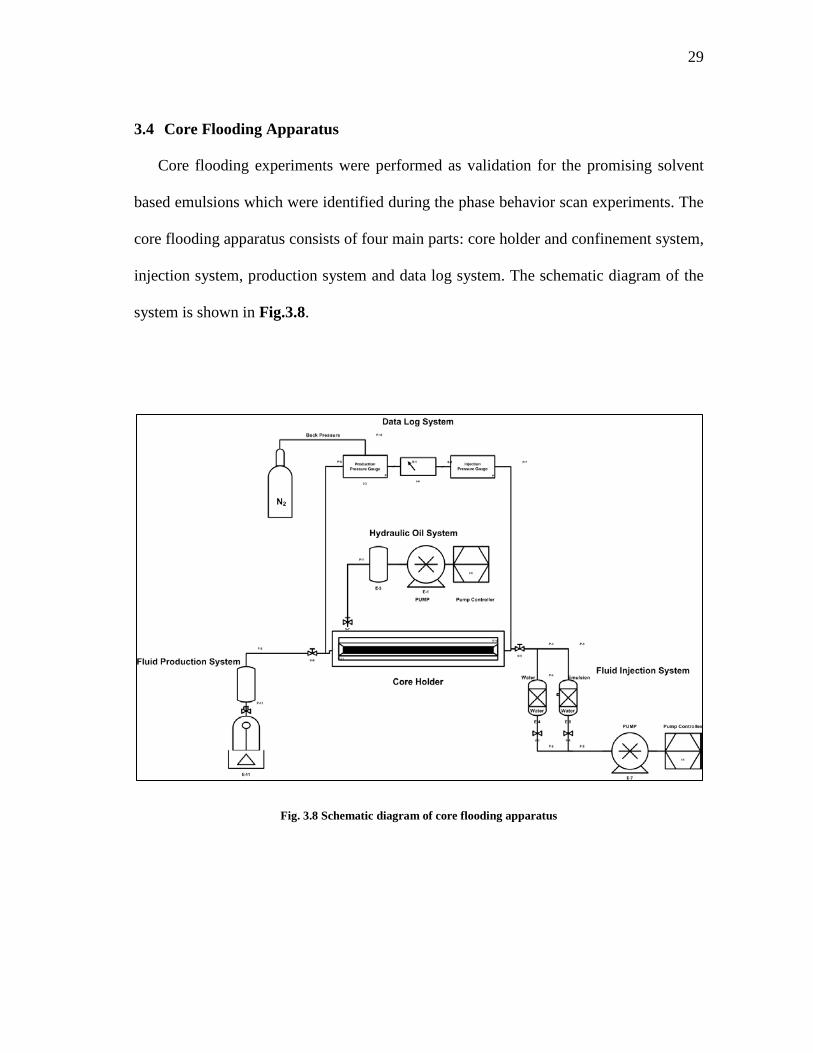
3.4 Core Flooding Apparatus
Core flooding experiments were performed as validation for the promising solvent
based emulsions which were identified during the phase behavior scan experiments. The
core flooding apparatus consists of four main parts: core holder and confinement system,
injection system, production system and data log system. The schematic diagram of the
system is shown in Fig.3.8.
Fig. 3.8 Schematic diagram of core flooding apparatus
30
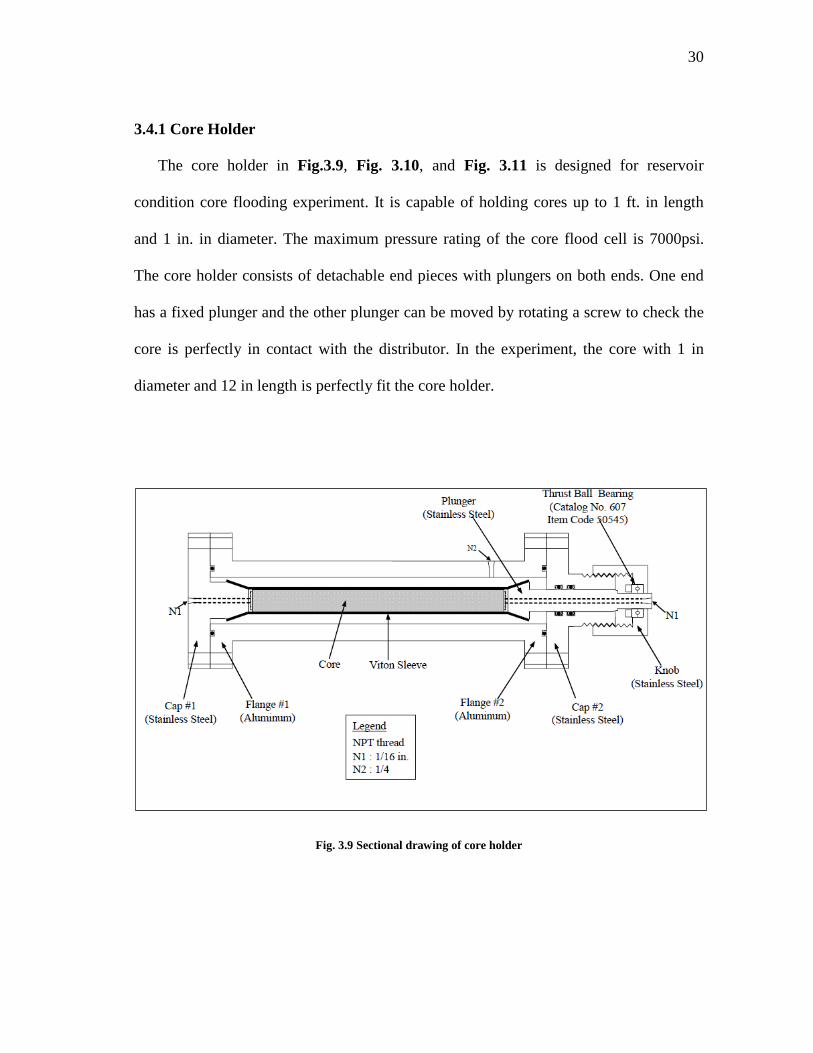
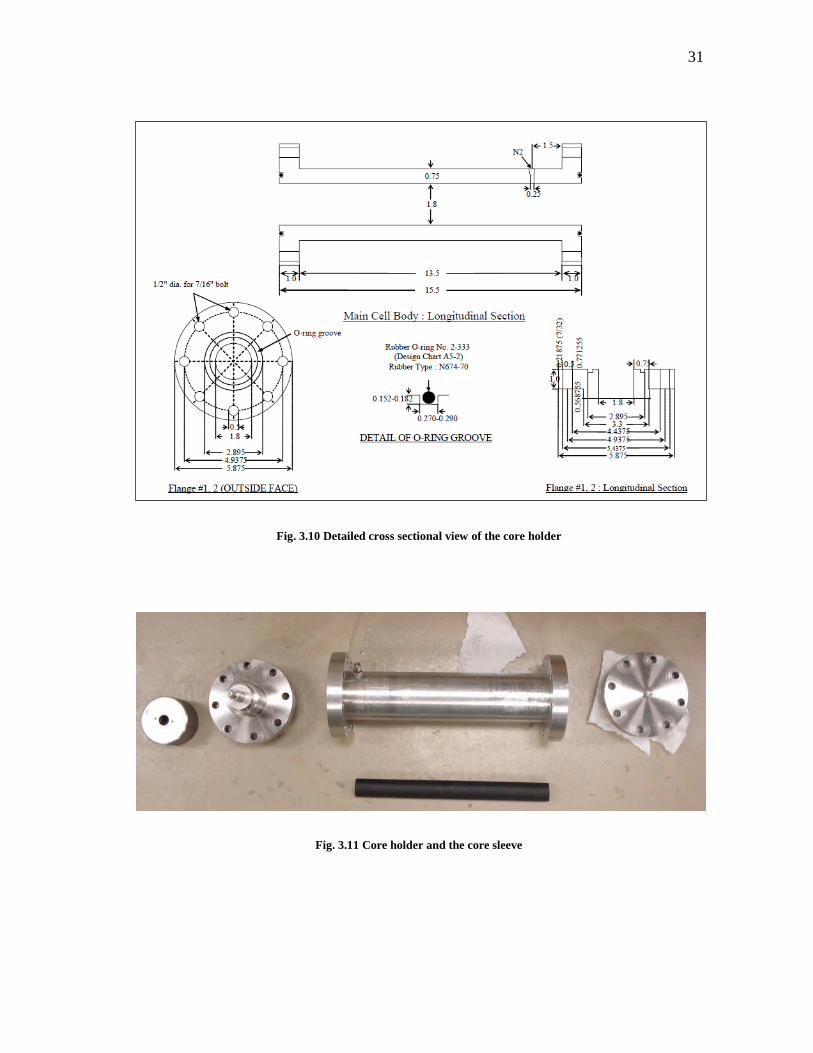
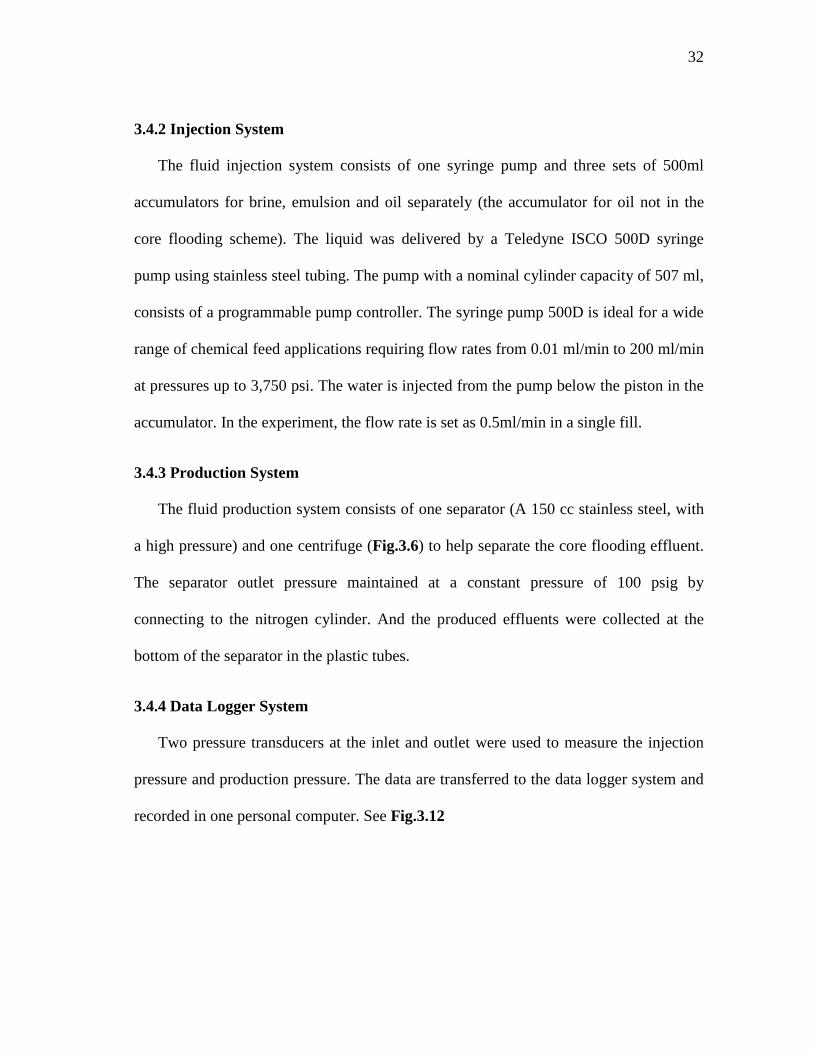
3.4.1 Core Holder
The core holder in Fig.3.9, Fig. 3.10, and Fig. 3.11 is designed for reservoir
condition core flooding experiment. It is capable of holding cores up to 1 ft. in length
and 1 in. in diameter. The maximum pressure rating of the core flood cell is 7000psi.
The core holder consists of detachable end pieces with plungers on both ends. One end
has a fixed plunger and the other plunger can be moved by rotating a screw to check the
core is perfectly in contact with the distributor. In the experiment, the core with 1 in
diameter and 12 in length is perfectly fit the core holder.
Fig. 3.9 Sectional drawing of core holder
31
Fig. 3.10 Detailed cross sectional view of the core holder
Fig. 3.11 Core holder and the core sleeve
32
3.4.2 Injection System
The fluid injection system consists of one syringe pump and three sets of 500ml
accumulators for brine, emulsion and oil separately (the accumulator for oil not in the
core flooding scheme). The liquid was delivered by a Teledyne ISCO 500D syringe
pump using stainless steel tubing. The pump with a nominal cylinder capacity of 507 ml,
consists of a programmable pump controller. The syringe pump 500D is ideal for a wide
range of chemical feed applications requiring flow rates from 0.01 ml/min to 200 ml/min
at pressures up to 3,750 psi. The water is injected from the pump below the piston in the
accumulator. In the experiment, the flow rate is set as 0.5ml/min in a single fill.
3.4.3 Production System
The fluid production system consists of one separator (A 150 cc stainless steel, with
a high pressure) and one centrifuge (Fig.3.6) to help separate the core flooding effluent.
The separator outlet pressure maintained at a constant pressure of 100 psig by
connecting to the nitrogen cylinder. And the produced effluents were collected at the
bottom of the separator in the plastic tubes.
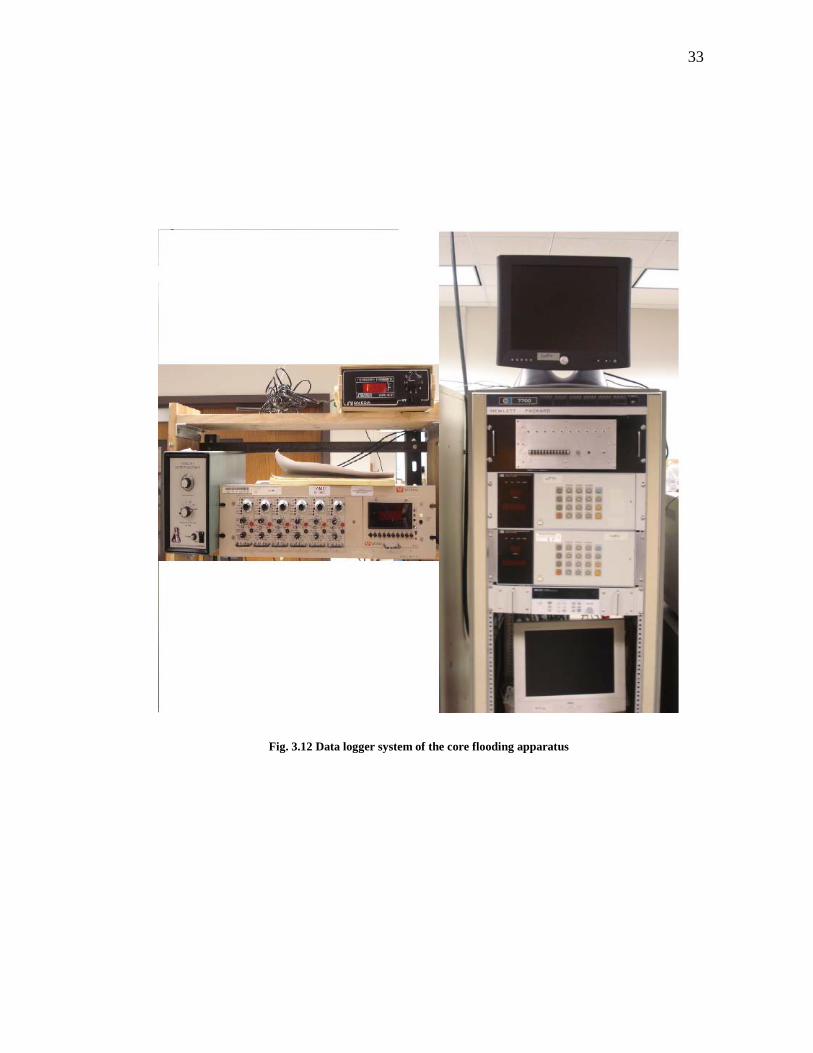
3.4.4 Data Logger System
Two pressure transducers at the inlet and outlet were used to measure the injection
pressure and production pressure. The data are transferred to the data logger system and
recorded in one personal computer. See Fig.3.12
33
Fig. 3.12 Data logger system of the core flooding apparatus
34
3.5 Core Flooding Experiment Procedure
Prior to beginning an experiment, all core flooding apparatus were thoroughly
cleaned to exclude any presence of oil traces and any particles. The pump, pressure
transducers and gauges and data logger were calibrated and checked. The experiments
were conducted in the ambient temperature which is only a little lower than the reservoir
temperature.
The core flooding follows the standard procedure as follows:
1. Place the core in the aluminum core holder and apply confinement pressure of
300-500 psi above the injection pressure.
2. Evacuate the core holder in the oven under temperature (60 ˚C) overnight. This is
established by connecting the core holder outlet to a vacuum pump while the core
holder is placed in the oven.
3. Weigh the dry core.
4. Inject 2-3 PV of the prepared brine to make steady state and hence completed
water saturation. The amount of water entering the core should be recorded. Use
this step to apply Darcy’s law and measure the permeability of water phase.
5. Weigh the 100% brine saturated core.
6. Calculate the core’s porosity using the material balance calculations by using the
weight of dry and saturate core and brine density.
7. Saturate the core with oil to bring the core to connate water. It is achieved by
injecting 2-3 PV of oil at 0.05cc/min until a steady state flow rate is reached and
no more water is produced.

35
8. Weigh the oil saturated core.
9. Calculate oil saturation by material balance calculations.
10. Water floods the core until only water is produced.
11. Weigh the core then calculate the recovery factor after the water flooding.
12. Emulsion floods the core with the reasonable PV injection.
13. Weigh the core and weigh the effluent of emulsion flooding then calculate the
recovery factor after the emulsion flooding.
36
4. EXPERIMENTAL RESULTS AND DISCUSSION
Hundreds of the solvent emulsion bench test experiments were performed, and the
phase behavior of the solvent emulsion was observed. Based on these observations, a
ternary phase behavior diagram was drawn. The viscosity and interfacial tension of 60
selected emulsions were tested in order to screen the emulsion composition for core
flooding. Finally, four successful core flooding experiments were performed. A detailed
discussion of the above experiments is given below.
4.1 Experimental Conditions
An overview of the experimental conditions is presented in this section.
4.1.1 Bench Test Experimental Conditions
The solvent emulsion phase behavior experiments and interfacial tension
measurements were carried out at ambient pressure and temperature. The viscosity of the
emulsion and crude oil were measured at 77˚F since the West Sak oil reservoir
temperature is between 45˚F and 100˚F due to the overlying permafrost.
4.1.2 Core Flooding Experiment Conditions
The core flooding experiments are performed in the oven which was set at a
temperature of 77˚F. The core confining pressure was provided by a hydraulic oil
injection system described in the Section 3. The water and solvent base emulsion
injection rate was set at 0.5 ml/min.……………………………………………………...
37
4.2 Bench Test Experiments
4.2.1 Emulsion Phase Behavior Experiments
Surfactants can form emulsion since they contain both hydrophobic groups and
hydrophilic groups. Therefore, they can lower the interfacial tension between oil and
water by adsorbing at the liquid-liquid interface. The organic solvent, like xylene, is the
perfect candidate to dissolve and mobilize heavy oil in the reservoir. From the
economical and technical consideration, the emulsion made by surfactant, solvent and
brine appears to be logically sound as it the advantages of the solvent and surfactant.
The micro-emulsion is the desired emulsion type in this research since it provides
lower interfacial tension and impressive stability which would be advantageous for
storage and transportation purposes. In order to characterize the micro-emulsion, it is
first necessary to construct the ternary phase diagram. The relative amounts of the three
emulsion components can be represented in the diagram, where their corresponding
volume fraction is 100%. Each point in the diagram represents a possible composition of
the emulsion and the most direct way to investigate the emulsion phase behavior is the
distinguished property of the micro-emulsion- transparency and thermal-dynamical
stability.
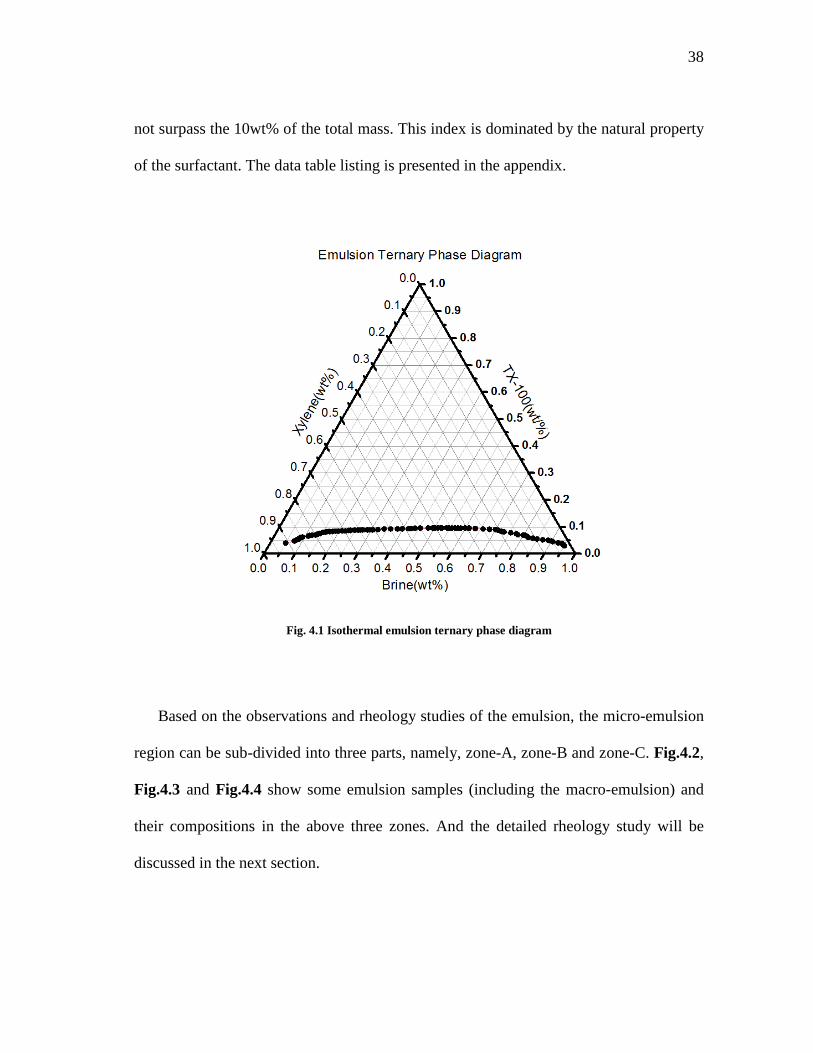
The emulsion ternary phase diagram is shown in Fig.4.1. The spots in the diagram
represent the critical composition of the solvent based emulsion which was examined by
the method described in the Section 3. In the upper region, the solvent based micro-
emulsions are achieved and the macro-emulsions appear in the lower region of the
ternary phase diagram. The surfactant critical concentration of the micro-emulsion does
38
not surpass the 10wt% of the total mass. This index is dominated by the natural property
of the surfactant. The data table listing is presented in the appendix.
Fig. 4.1 Isothermal emulsion ternary phase diagram
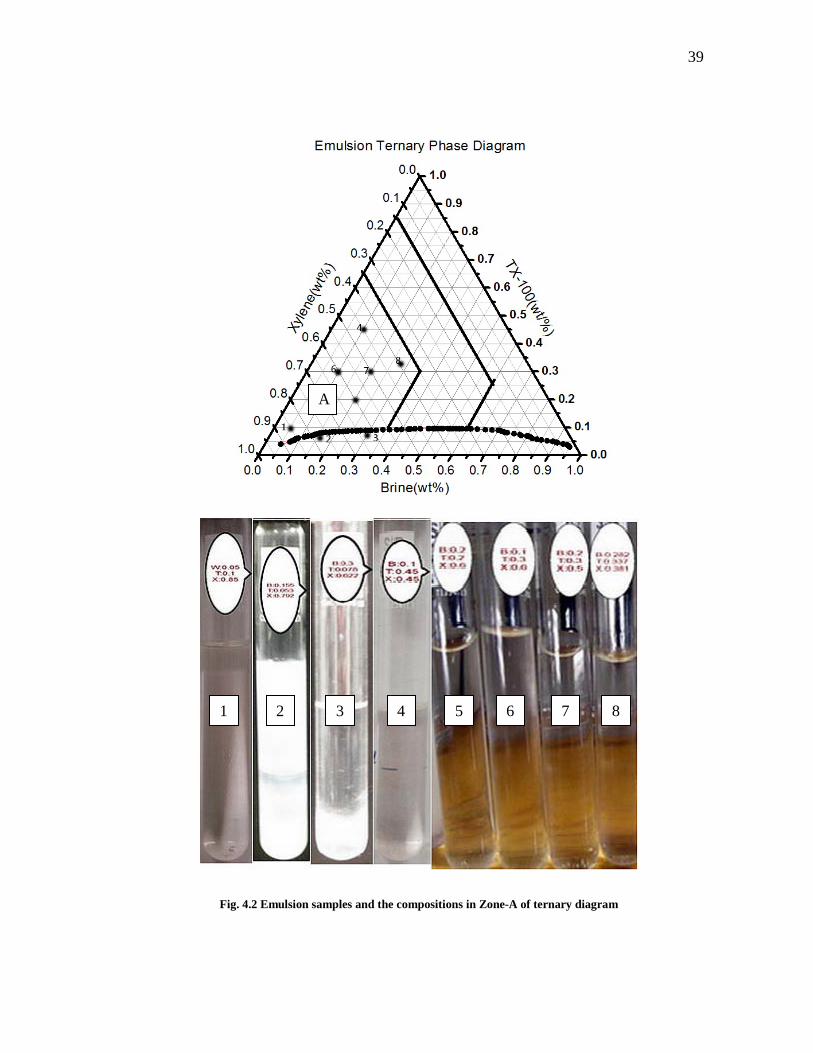
Based on the observations and rheology studies of the emulsion, the micro-emulsion
region can be sub-divided into three parts, namely, zone-A, zone-B and zone-C. Fig.4.2,
Fig.4.3 and Fig.4.4 show some emulsion samples (including the macro-emulsion) and
their compositions in the above three zones. And the detailed rheology study will be
discussed in the next section.
39
Fig. 4.2 Emulsion samples and the compositions in Zone-A of ternary diagram
1 2 3 4 5 6 7 8
A
40
Fig. 4.3 Emulsion samples and the compositions in Zone-B of ternary diagram
1
3
2
4 5
B

41
Fig. 4.4 Emulsion samples and the compositions in Zone-C of ternary diagram
3 2 1 6 5 4 7
C
42
4.2.2 Emulsion Rheology Study Experiments
The rheological measurement of the emulsion is a valuable tool for understanding
the properties of emulsion during the storage and injection process. And also the
emulsion rheology is related to the emulsion stability.
The solvent based emulsion shows the shear-thinning properties which mean that the
viscosity decreases with increasing shear rate. And in general, zone C shows a moderate
shear thinning behavior and zone A and zone B are more like Newtonian fluid.
And the micro-emulsion region is divided into three zones based on the difference of the
three micro-emulsion rheological behavior.
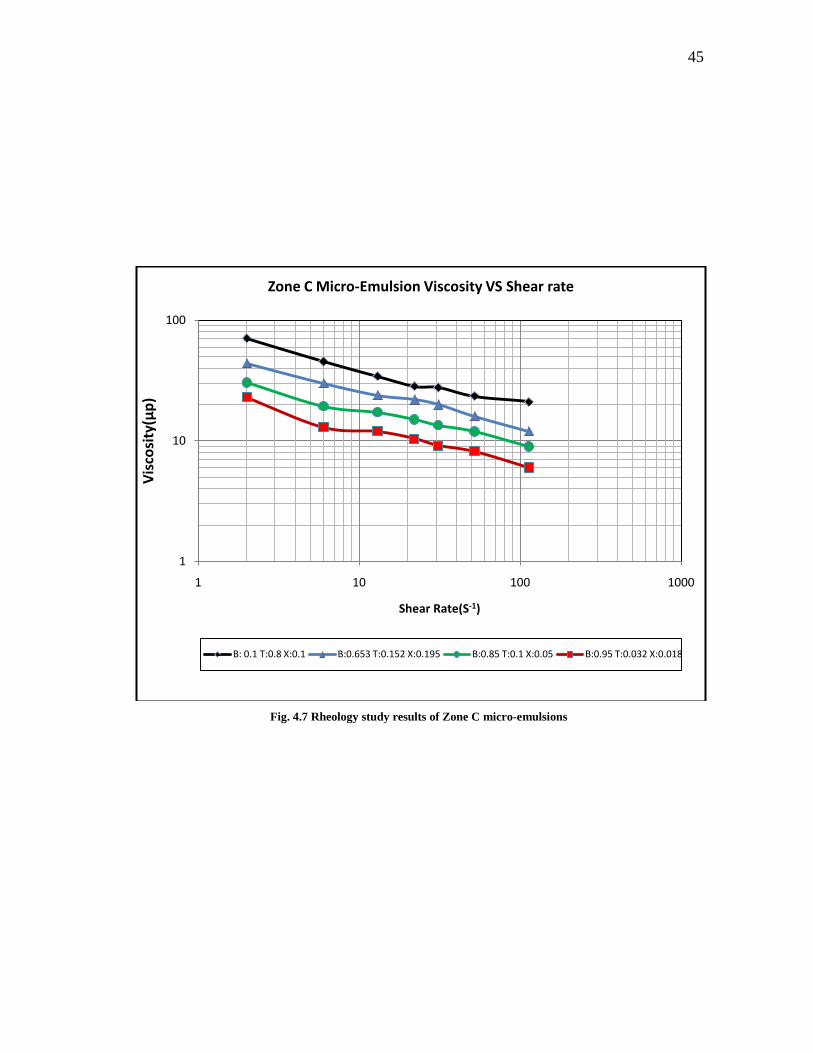
Fig.4.5, Fig.4.6, Fig.4.7 show plots of micro-emulsion viscosity against shear-rate
in the logarithmic coordinates. Straight line fits to the data may be constructed. The
results indicate the rheology may be described by the following a power-law expression.
𝑣𝑣 = 𝐾𝐾 �𝜕𝜕𝜕𝜕𝜕𝜕𝜕𝜕�𝑛𝑛−1
Where K is the flow consistency index (SI units Pa•s), 𝜕𝜕𝜕𝜕/𝜕𝜕𝜕𝜕 is the shear rate (SI unit
s−1), and n is the flow behavior index (dimensionless) and for a shear-thinning fluid n<1.
Zone-A in Fig 4.5 shows that the apparent viscosity is lower compared with that in
the other two zones and indicates a weak shear-thinning property. Because the micro-
emulsion’s oil phase-xylene-plays a critical role in this region, it makes the emulsion
apparent viscosity relatively low.
Zone-B in Fig.4.6 exhibits the formation of the gel micro-emulsion. Some of the
micro-emulsions even cannot flow after the emulsion formation in the ambient
43
environment. Apparent viscosity of the micro-emulsions can be very high and also they
show a moderate shear-thinning rheological behavior in the experiments.
Zone-C micro-emulsion in Fig.4.7 shows an obvious shear thinning behavior.
Fig. 4.5 Rheology study resuts of Zone A micro-emulsions
1
10
100
1 10 100 1000
Vvis
cosi
ty(µ
p)
Shear rate(s-1)
Zone A Micro-Emulsion Viscosity vs Shear Rate
B:0.2 T:0.3 X:0.5 B:0.1 X:0.3 T:0.6 B:0.2 T:0.2 X:0.6 B:0.282 T:0.327 X: 0.391
44
Fig. 4.6 Rheology study results of Zone B micro-emulsions
100
1000
1 10 100 1000
Visc
osity
(µp)
Shear Rate(S-1)
Zone B Micro-Emulsion Viscosity VS Shear Rate
B:0.2 T:0.6 X:0.2 B:0.184 T:0.762 X:0.154 B:0.35 T:0.35 X:0.3 B:0.5 T:0.3 X:0.2
45
Fig. 4.7 Rheology study results of Zone C micro-emulsions
1
10
100
1 10 100 1000
Visc
osity
(µp)
Shear Rate(S-1)
Zone C Micro-Emulsion Viscosity VS Shear rate
B: 0.1 T:0.8 X:0.1 B:0.653 T:0.152 X:0.195 B:0.85 T:0.1 X:0.05 B:0.95 T:0.032 X:0.018
46
4.2.3 Emulsion and Crude Oil Interfacial Tension Measurement
Many publications have pointed out that micro-emulsions could provide the ultra-
low interfacial tension (IFT) which is welcome in the chemical EOR process. Most of
the micro-emulsions used in this research showed very lower IFT, confirming the typical
behavior of micro-emulsions. If the micro-emulsion surfactant concentration exceeds the
Triton-X 100 critical micelle concentration, the measured interfacial tension between the
crude oil and micro- emulsion would be same.
Based on the phase behavior and rheology investigation, Zone-C micro-emulsion,
which brine solution is the main composition, could become an ideal emulsion flooding
candidate. In particular, the micro-emulsion in the ternary diagram right corner would
provide maximum brine concentration and thus cheapest to produce. Then the research
focused on Zone-C micro-emulsion. First, Table 4.1 shows the crude oil interfacial
tension measurement results.
Table 4.1 Crude oil interfacial tension measurement (77˚F, 14.7 psi)
Brine(10000ppm NaCl) Air
Oil 28.9 mN/m 27.5mN/m
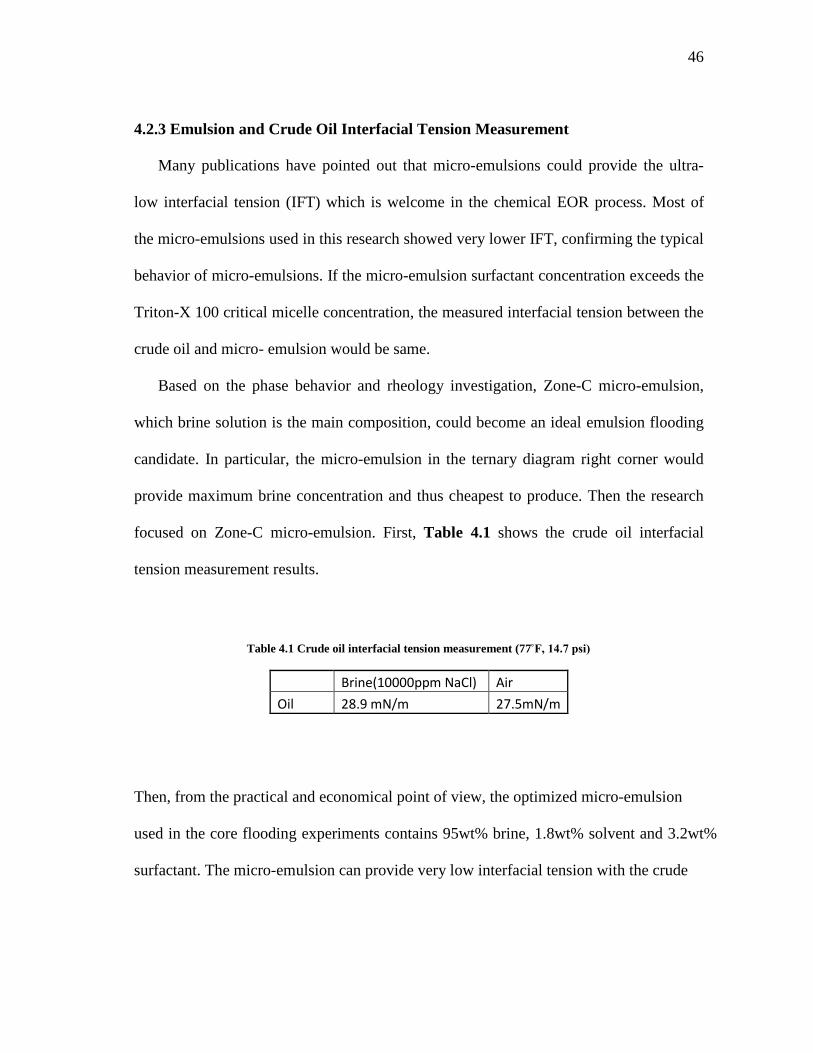
Then, from the practical and economical point of view, the optimized micro-emulsion
used in the core flooding experiments contains 95wt% brine, 1.8wt% solvent and 3.2wt%
surfactant. The micro-emulsion can provide very low interfacial tension with the crude
47
oil compared with the interfacial tension between 0.5wt% surfactant solution and crude
oil which is 1.2mN/m. See Table 4.2.
The micro-emulsion sample is showed in the following picture. See Fig.4.8.
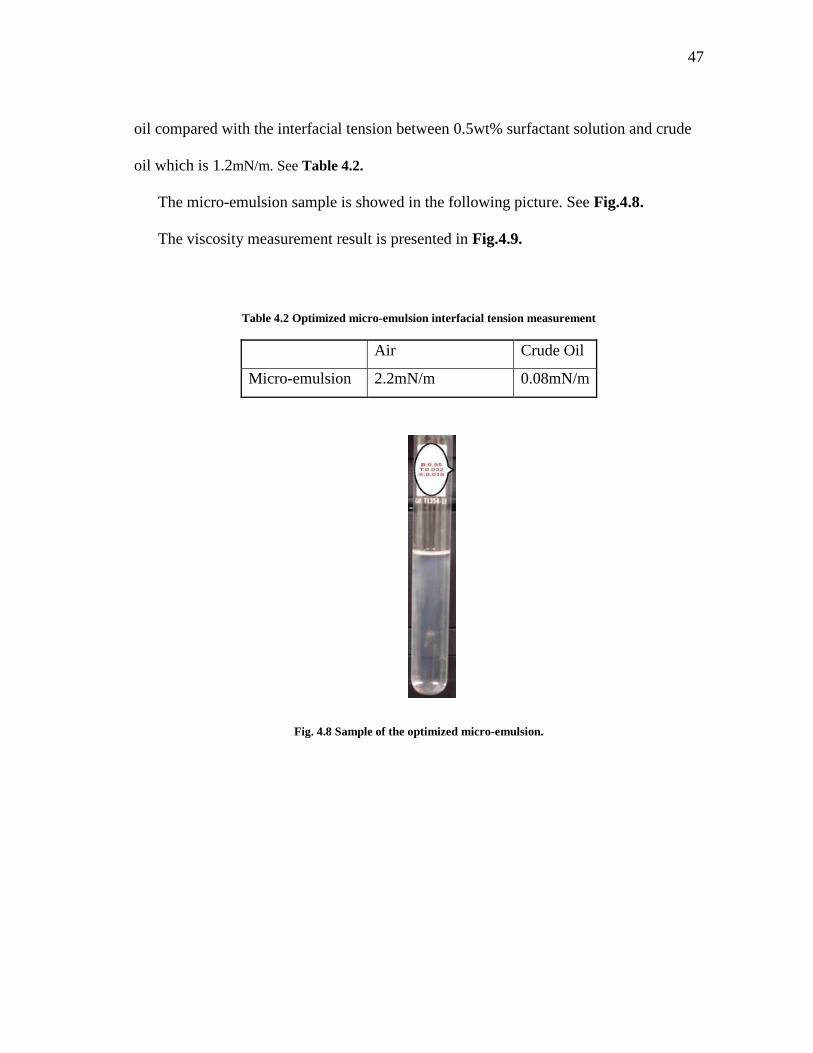
The viscosity measurement result is presented in Fig.4.9.
Table 4.2 Optimized micro-emulsion interfacial tension measurement
Air Crude Oil
Micro-emulsion 2.2mN/m 0.08mN/m
Fig. 4.8 Sample of the optimized micro-emulsion.
48
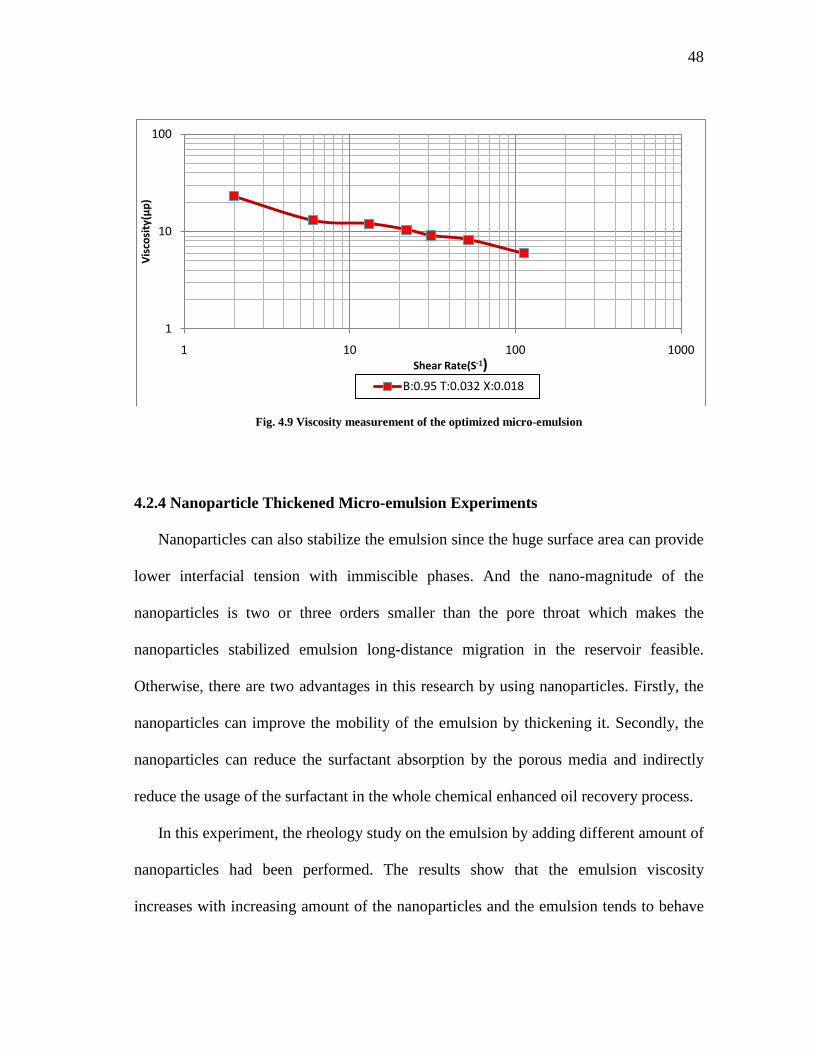
Fig. 4.9 Viscosity measurement of the optimized micro-emulsion
4.2.4 Nanoparticle Thickened Micro-emulsion Experiments
Nanoparticles can also stabilize the emulsion since the huge surface area can provide
lower interfacial tension with immiscible phases. And the nano-magnitude of the
nanoparticles is two or three orders smaller than the pore throat which makes the
nanoparticles stabilized emulsion long-distance migration in the reservoir feasible.
Otherwise, there are two advantages in this research by using nanoparticles. Firstly, the
nanoparticles can improve the mobility of the emulsion by thickening it. Secondly, the
nanoparticles can reduce the surfactant absorption by the porous media and indirectly
reduce the usage of the surfactant in the whole chemical enhanced oil recovery process.
In this experiment, the rheology study on the emulsion by adding different amount of
nanoparticles had been performed. The results show that the emulsion viscosity
increases with increasing amount of the nanoparticles and the emulsion tends to behave
1
10
100
1 10 100 1000
Visc
osity
(µp)
Shear Rate(S-1)B:0.95 T:0.032 X:0.018
49
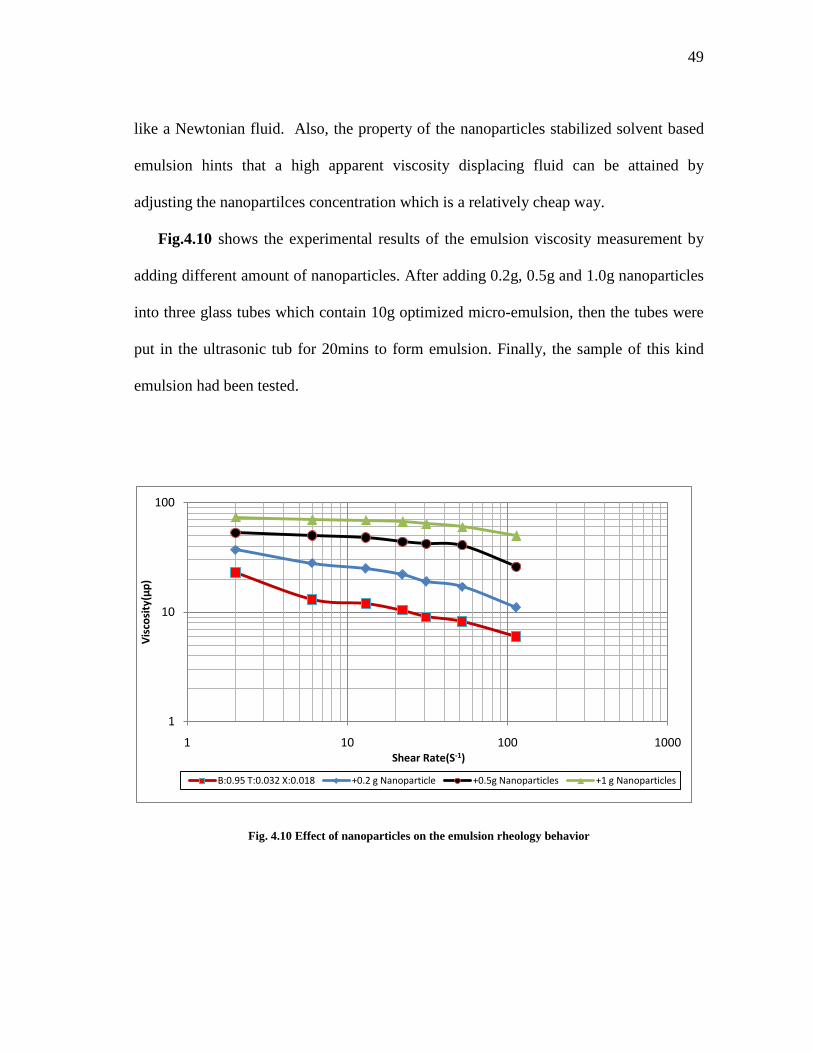
like a Newtonian fluid. Also, the property of the nanoparticles stabilized solvent based
emulsion hints that a high apparent viscosity displacing fluid can be attained by
adjusting the nanopartilces concentration which is a relatively cheap way.
Fig.4.10 shows the experimental results of the emulsion viscosity measurement by
adding different amount of nanoparticles. After adding 0.2g, 0.5g and 1.0g nanoparticles
into three glass tubes which contain 10g optimized micro-emulsion, then the tubes were
put in the ultrasonic tub for 20mins to form emulsion. Finally, the sample of this kind
emulsion had been tested.
Fig. 4.10 Effect of nanoparticles on the emulsion rheology behavior
1
10
100
1 10 100 1000
Visc
osity
(µp)
Shear Rate(S-1)
B:0.95 T:0.032 X:0.018 +0.2 g Nanoparticle +0.5g Nanoparticles +1 g Nanoparticles
50
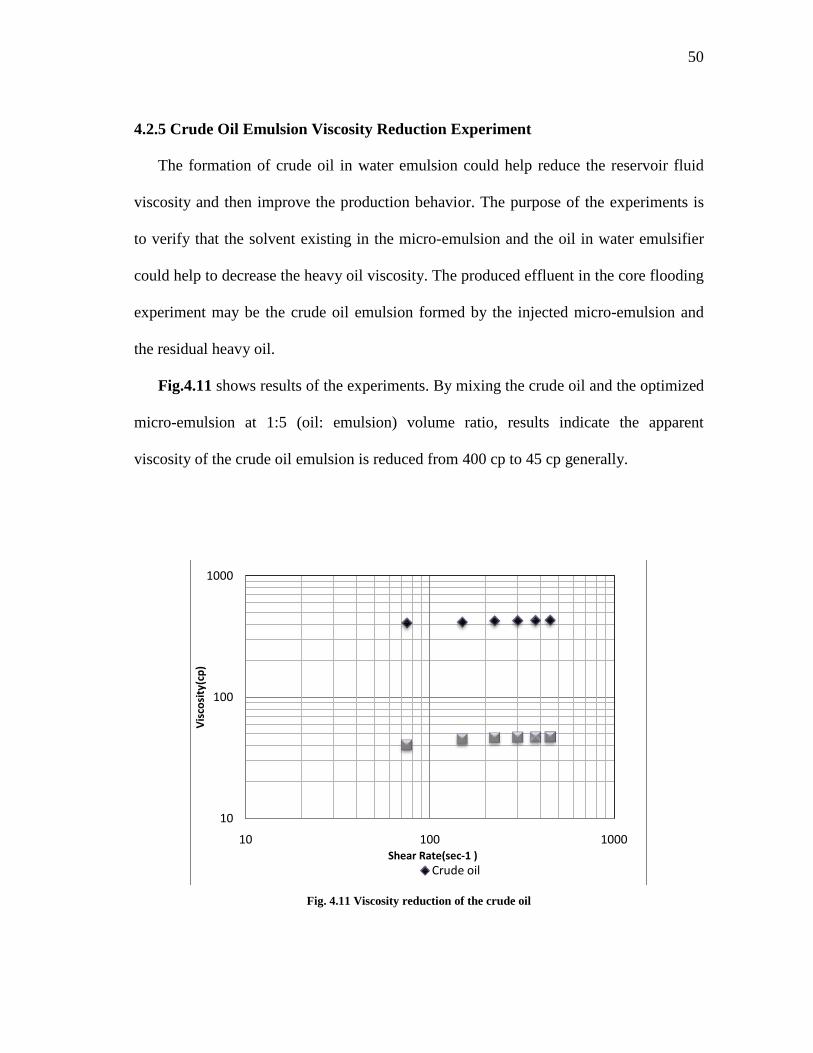
4.2.5 Crude Oil Emulsion Viscosity Reduction Experiment
The formation of crude oil in water emulsion could help reduce the reservoir fluid
viscosity and then improve the production behavior. The purpose of the experiments is
to verify that the solvent existing in the micro-emulsion and the oil in water emulsifier
could help to decrease the heavy oil viscosity. The produced effluent in the core flooding
experiment may be the crude oil emulsion formed by the injected micro-emulsion and
the residual heavy oil.
Fig.4.11 shows results of the experiments. By mixing the crude oil and the optimized
micro-emulsion at 1:5 (oil: emulsion) volume ratio, results indicate the apparent
viscosity of the crude oil emulsion is reduced from 400 cp to 45 cp generally.
Fig. 4.11 Viscosity reduction of the crude oil
10
100
1000
10 100 1000
Visc
osity
(cp)
Shear Rate(sec-1 )Crude oil
51
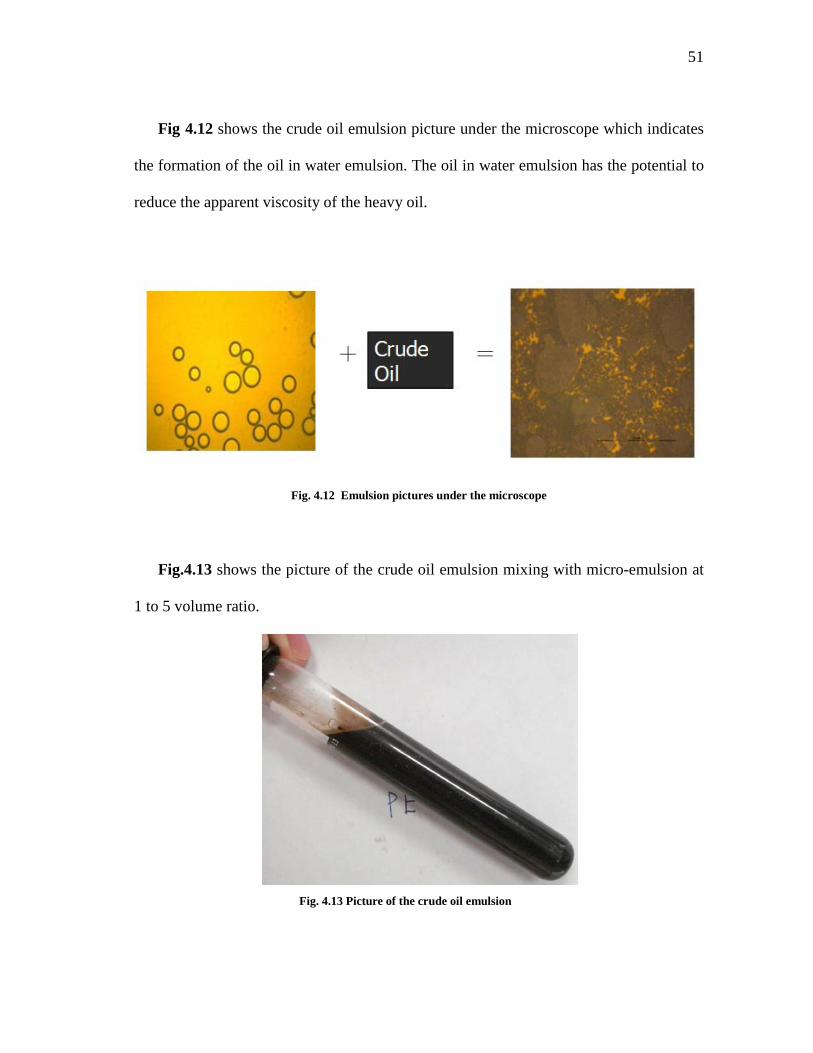
Fig 4.12 shows the crude oil emulsion picture under the microscope which indicates
the formation of the oil in water emulsion. The oil in water emulsion has the potential to
reduce the apparent viscosity of the heavy oil.
Fig. 4.12 Emulsion pictures under the microscope
Fig.4.13 shows the picture of the crude oil emulsion mixing with micro-emulsion at
1 to 5 volume ratio.
Fig. 4.13 Picture of the crude oil emulsion

52
4.2.6 Core Flooding Experiments
The core flooding experiments are the final step of this research. These experiments
are run to verify the emulsion flooding mechanism discussed in the previous sections
and also to evaluate the flooding recovery efficiency under emulsion flooding.
A total of four core-flood experiments were successfully carried out. Two different
kinds of sandstone cores were used: Buff Berea sandstone and Idaho sandstone. Buff
Berea core permeability is around 200 md and Idaho core permeability is around 800 md.
Two different flooding methods were performed on each core in order to make
comparisons. The first method involves emulsion flooding after water flooding, while
the second method involves pure emulsion flooding.
The injected emulsion also contains the nanoparticles for viscosity control purposes.
The nanoparticles make up 4.76wt% of the whole emulsion weight which could thicken
the emulsion 3 to 8 times and also weaken the shear-thinning effect of the emulsion. The
nanoparticles help form more crude oil emulsion when injecting same volume of
optimized emulsion.
The emulsion flooding effluent contains two parts based on the observation. Since
the injected micro-emulsion has a better mobility control characteristic and the locally
formation of the crude oil emulsion could have a high apparent viscosity (even with the
injecting emulsion, the crude oil emulsion become thinning.), it could form piston-like
flooding at the beginning. This is the reason that some amount of crude oil was produced
in the experiment, but the bigger fraction effluent is crude oil emulsion.
53
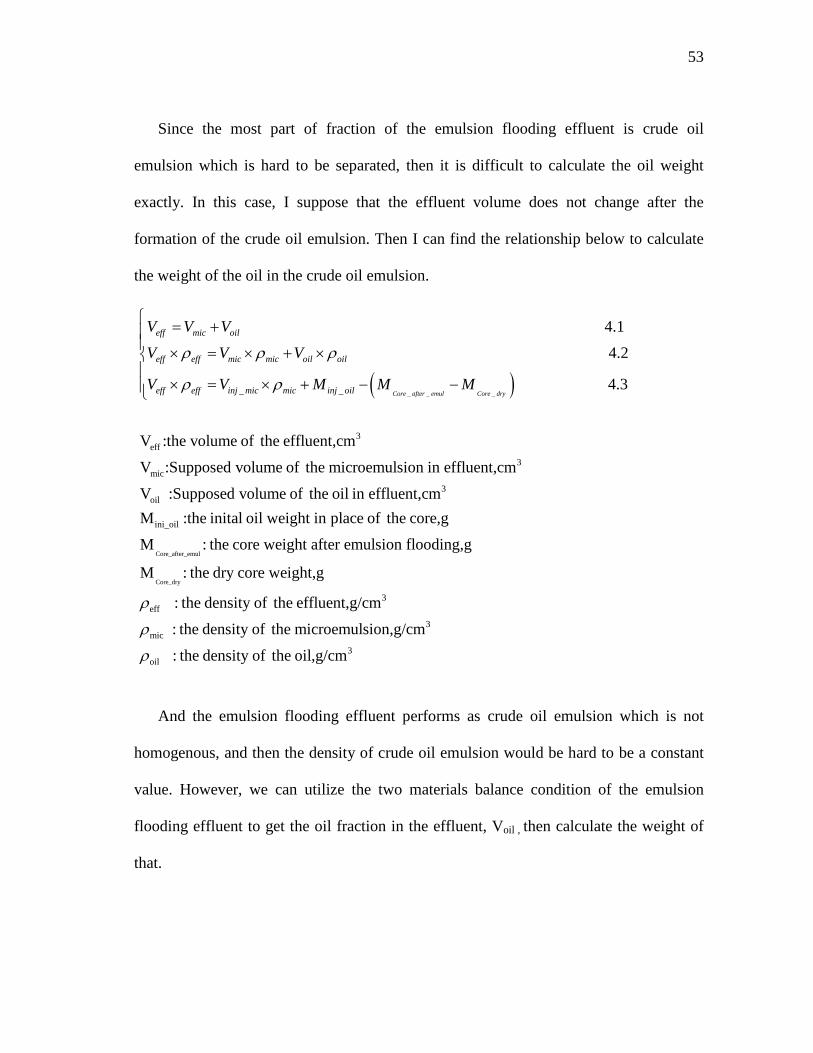
Since the most part of fraction of the emulsion flooding effluent is crude oil
emulsion which is hard to be separated, then it is difficult to calculate the oil weight
exactly. In this case, I suppose that the effluent volume does not change after the
formation of the crude oil emulsion. Then I can find the relationship below to calculate
the weight of the oil in the crude oil emulsion.
And the emulsion flooding effluent performs as crude oil emulsion which is not
homogenous, and then the density of crude oil emulsion would be hard to be a constant
value. However, we can utilize the two materials balance condition of the emulsion
flooding effluent to get the oil fraction in the effluent, Voil , then calculate the weight of
that.
( )_ _ __ _
3eff
3mic
4.1
4.2
4.3
V :the volume of the effluent,cm
V :Supposed volume of the microemulsion in effluent,cm
Core after emul Core dry
eff mic oil
eff eff mic mic oil oil
eff eff inj mic mic inj oil
V V VV V V
V V M M M
ρ ρ ρ
ρ ρ
= + × = × + ×
× = × + − −
Core_after_emul
Core_dry
3oil
ini_oil
eff
V :Supposed volume of the oil in effluent,cmM :the inital oil weight in place of the core,g
M : the core weight after emulsion flooding,g
M : the dry core weight,g
: the density of the effluent,g/cmρ 3
3mic
3oil
: the density of the microemulsion,g/cm
: the density of the oil,g/cm
ρ
ρ
54
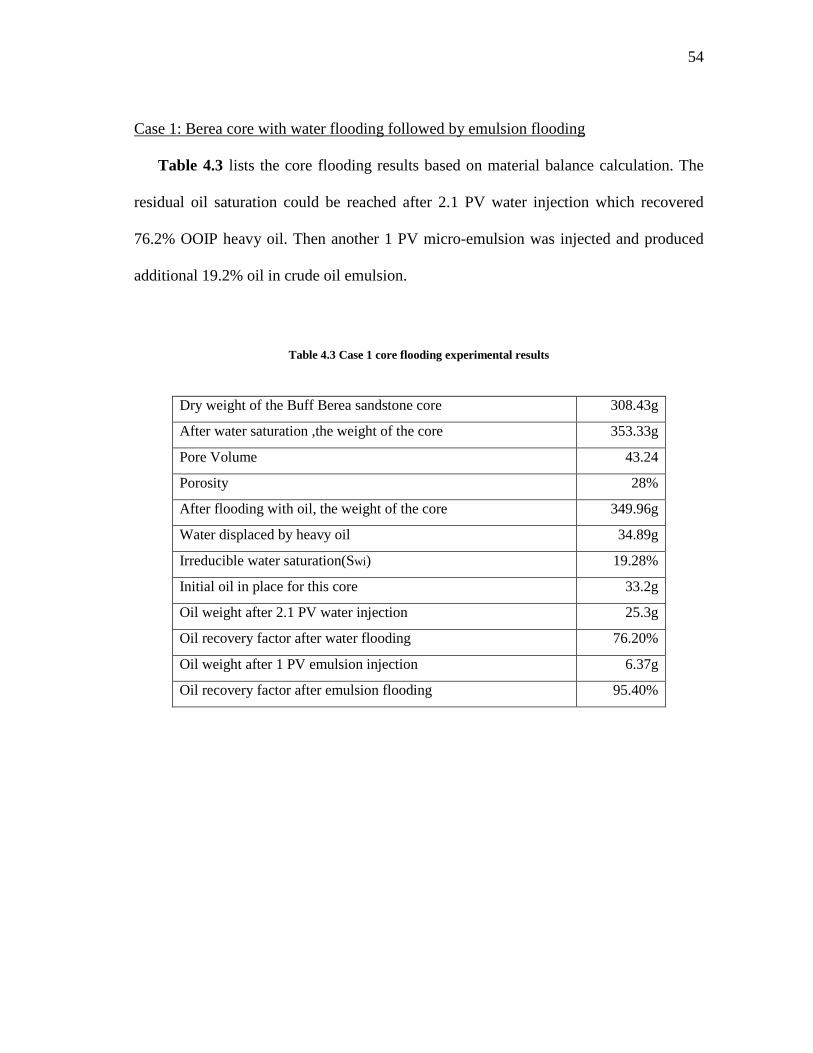
Case 1: Berea core with water flooding followed by emulsion flooding
Table 4.3 lists the core flooding results based on material balance calculation. The
residual oil saturation could be reached after 2.1 PV water injection which recovered
76.2% OOIP heavy oil. Then another 1 PV micro-emulsion was injected and produced
additional 19.2% oil in crude oil emulsion.
Table 4.3 Case 1 core flooding experimental results
Dry weight of the Buff Berea sandstone core 308.43g
After water saturation ,the weight of the core 353.33g
Pore Volume 43.24
Porosity 28%
After flooding with oil, the weight of the core 349.96g
Water displaced by heavy oil 34.89g
Irreducible water saturation(Swi) 19.28%
Initial oil in place for this core 33.2g
Oil weight after 2.1 PV water injection 25.3g
Oil recovery factor after water flooding 76.20%
Oil weight after 1 PV emulsion injection 6.37g
Oil recovery factor after emulsion flooding 95.40%
55
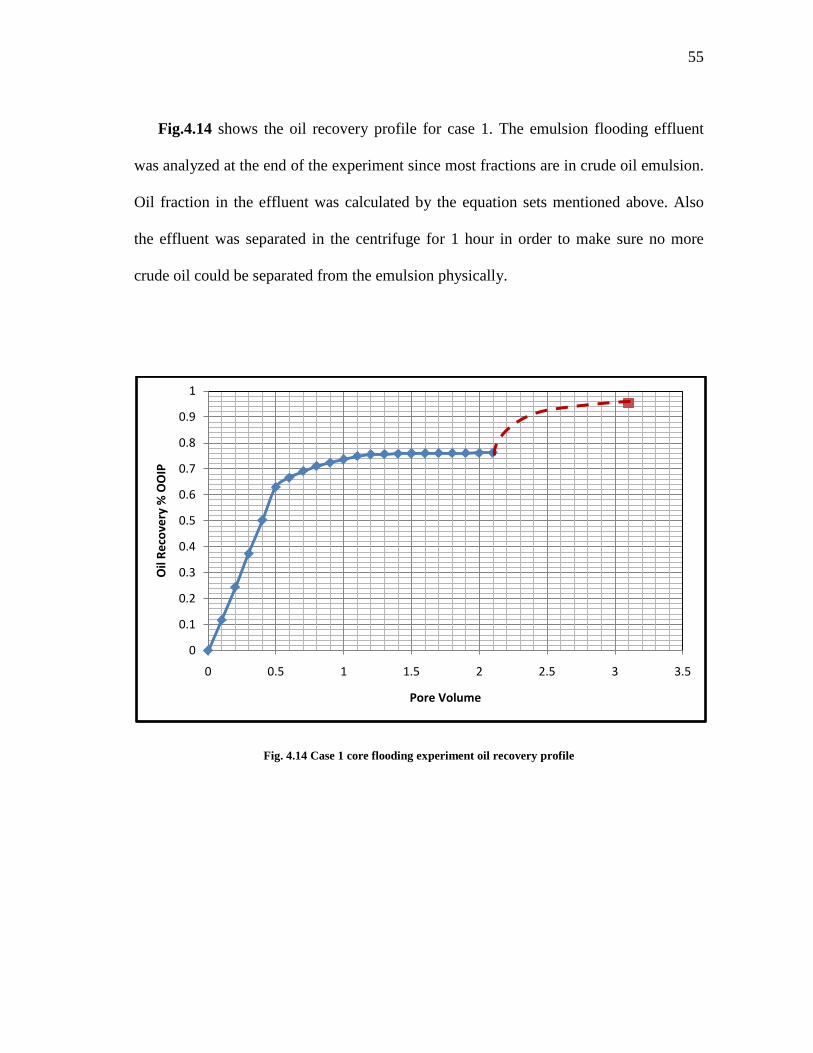
Fig.4.14 shows the oil recovery profile for case 1. The emulsion flooding effluent
was analyzed at the end of the experiment since most fractions are in crude oil emulsion.
Oil fraction in the effluent was calculated by the equation sets mentioned above. Also
the effluent was separated in the centrifuge for 1 hour in order to make sure no more
crude oil could be separated from the emulsion physically.
Fig. 4.14 Case 1 core flooding experiment oil recovery profile
0
0.1
0.2
0.3
0.4
0.5
0.6
0.7
0.8
0.9
1
0 0.5 1 1.5 2 2.5 3 3.5
Oil
Reco
very
% O
OIP
Pore Volume

56
Fig.4.15 shows pictures of the effluent of the core flooding experiments. From left to
right, we can easily figure out the effect of flooding type on the effluent. As mentioned
above, after 2.1 PV water injections, no more oil could be produced and the third tube
only shows the produced water. The crude oil emulsion occupied the most volume
percentage in the fourth tube.
Fig. 4.15 Case 1 core flooding effluent collected in the 50 cc plastic tube.
1 2 3 4

57
Fig.4.16 is the pictures of the core at each core flooding stage.The difference in core
color indicates the various saturation and flooding stages, the change in color being due
to the different fluid type being present in the core.
Fig. 4.16 Case 1 core pictures of each core flooding stage

58
Case 2: Berea core with pure emulsion flooding
The main objectives of pure emulsion flooding are
(1) to investigate if the piston-like crude oil emulsion flooding could form for a
longer time then the breakthrough time point would be later for the same kind
of core and
(2) to evaluate changes in oil recovery.
Table 4.4 lists the core flooding results based on the materials balance calculation in
Case 2. The second Berea core has very similar properties to the first Berea core which
is necessary for comparisons to be made.
Table 4.4 Case 2 core flooding experiment results
Dry weight of the Buff Berea sandstone core 307.12g
After water saturation ,the weight of the core 352.3g
Pore Volume 43.03cm3 Porosity 27.86% After flooding with oil, the weight of the core 346.88g
Water displaced by heavy oil 36.88g Irreducible water saturation(Swi) 18.37% Initial oil in place for this core 31.46g Oil weight after 1.6 PV emulsion injection 30.45g
Oil recovery factor after emulsion flooding 96.81%
59
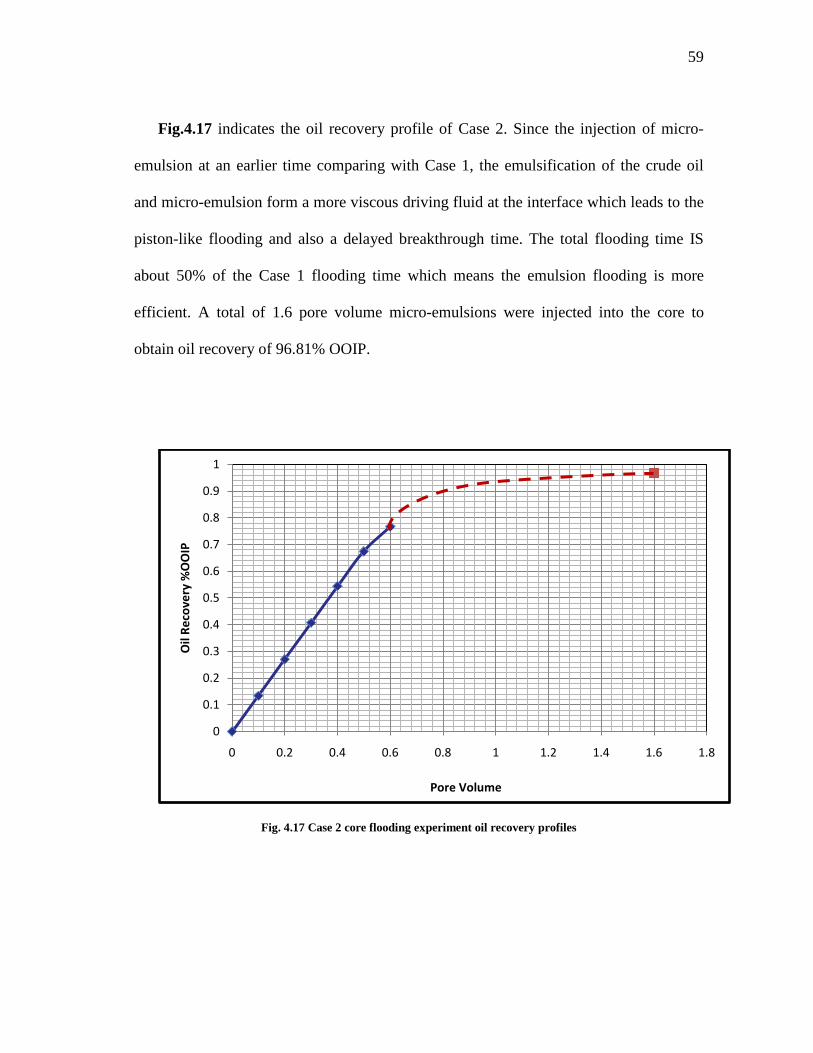
Fig.4.17 indicates the oil recovery profile of Case 2. Since the injection of micro-
emulsion at an earlier time comparing with Case 1, the emulsification of the crude oil
and micro-emulsion form a more viscous driving fluid at the interface which leads to the
piston-like flooding and also a delayed breakthrough time. The total flooding time IS
about 50% of the Case 1 flooding time which means the emulsion flooding is more
efficient. A total of 1.6 pore volume micro-emulsions were injected into the core to
obtain oil recovery of 96.81% OOIP.
Fig. 4.17 Case 2 core flooding experiment oil recovery profiles
0
0.1
0.2
0.3
0.4
0.5
0.6
0.7
0.8
0.9
1
0 0.2 0.4 0.6 0.8 1 1.2 1.4 1.6 1.8
Oil
Reco
very
%O
OIP
Pore Volume
60
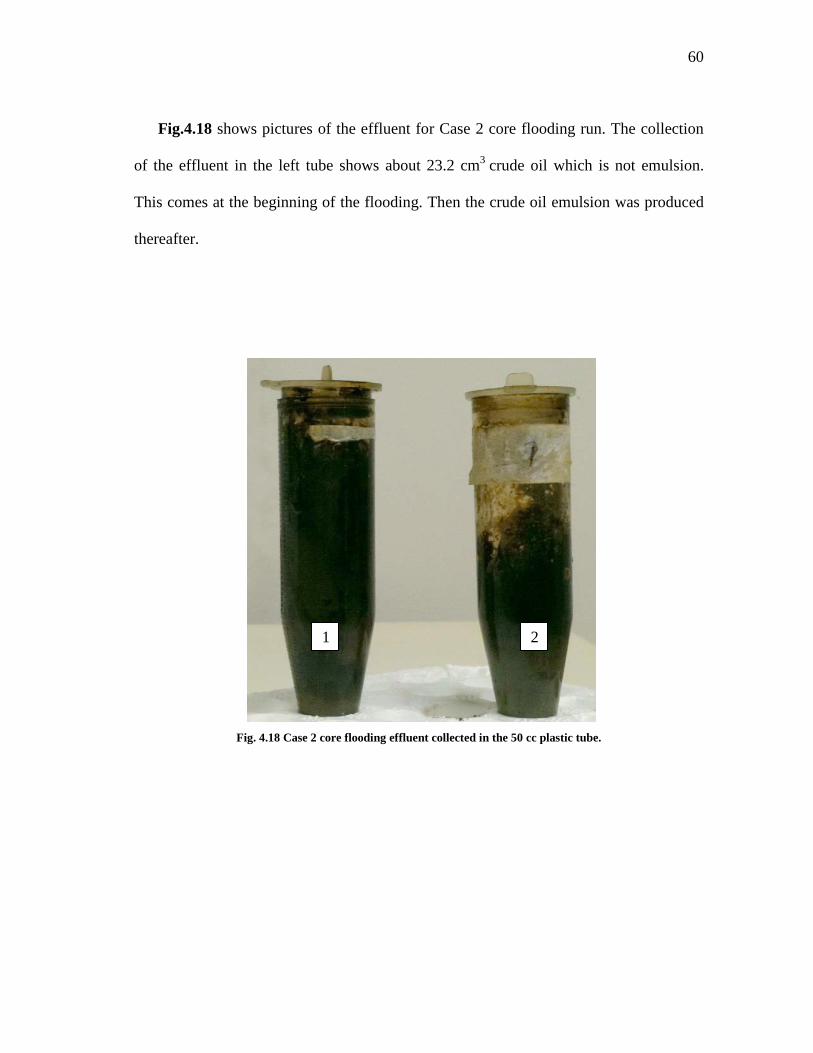
Fig.4.18 shows pictures of the effluent for Case 2 core flooding run. The collection
of the effluent in the left tube shows about 23.2 cm3 crude oil which is not emulsion.
This comes at the beginning of the flooding. Then the crude oil emulsion was produced
thereafter.
Fig. 4.18 Case 2 core flooding effluent collected in the 50 cc plastic tube.
1 2
61
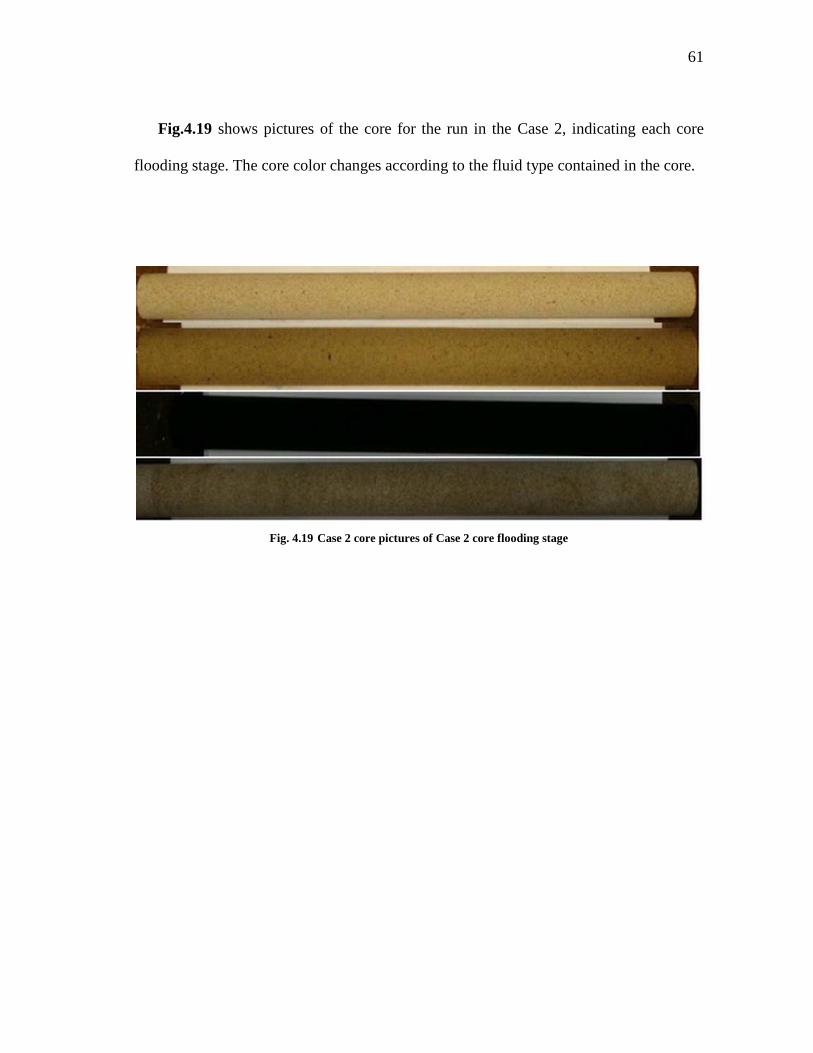
Fig.4.19 shows pictures of the core for the run in the Case 2, indicating each core
flooding stage. The core color changes according to the fluid type contained in the core.
Fig. 4.19 Case 2 core pictures of Case 2 core flooding stage
62
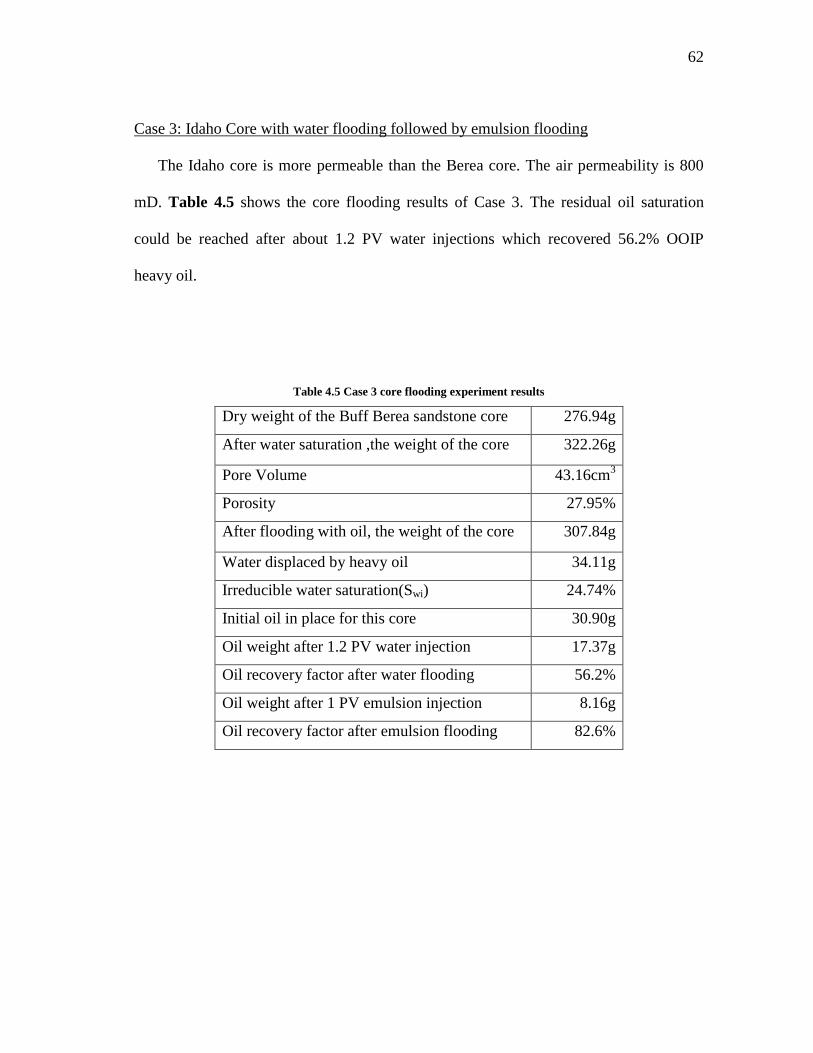
Case 3: Idaho Core with water flooding followed by emulsion flooding
The Idaho core is more permeable than the Berea core. The air permeability is 800
mD. Table 4.5 shows the core flooding results of Case 3. The residual oil saturation
could be reached after about 1.2 PV water injections which recovered 56.2% OOIP
heavy oil.
Table 4.5 Case 3 core flooding experiment results
Dry weight of the Buff Berea sandstone core 276.94g
After water saturation ,the weight of the core 322.26g
Pore Volume 43.16cm3
Porosity 27.95%
After flooding with oil, the weight of the core 307.84g
Water displaced by heavy oil 34.11g
Irreducible water saturation(Swi) 24.74%
Initial oil in place for this core 30.90g
Oil weight after 1.2 PV water injection 17.37g
Oil recovery factor after water flooding 56.2%
Oil weight after 1 PV emulsion injection 8.16g
Oil recovery factor after emulsion flooding 82.6%
63
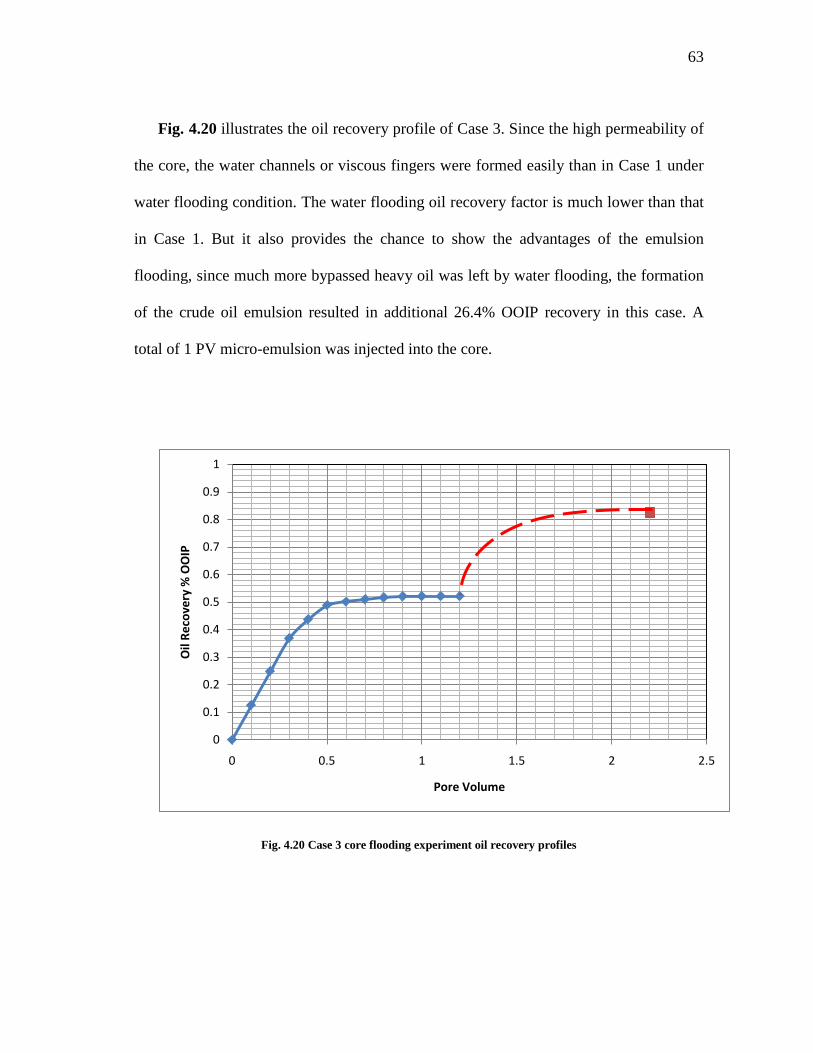
Fig. 4.20 illustrates the oil recovery profile of Case 3. Since the high permeability of
the core, the water channels or viscous fingers were formed easily than in Case 1 under
water flooding condition. The water flooding oil recovery factor is much lower than that
in Case 1. But it also provides the chance to show the advantages of the emulsion
flooding, since much more bypassed heavy oil was left by water flooding, the formation
of the crude oil emulsion resulted in additional 26.4% OOIP recovery in this case. A
total of 1 PV micro-emulsion was injected into the core.
Fig. 4.20 Case 3 core flooding experiment oil recovery profiles
0
0.1
0.2
0.3
0.4
0.5
0.6
0.7
0.8
0.9
1
0 0.5 1 1.5 2 2.5
Oil
Reco
very
% O
OIP
Pore Volume
64
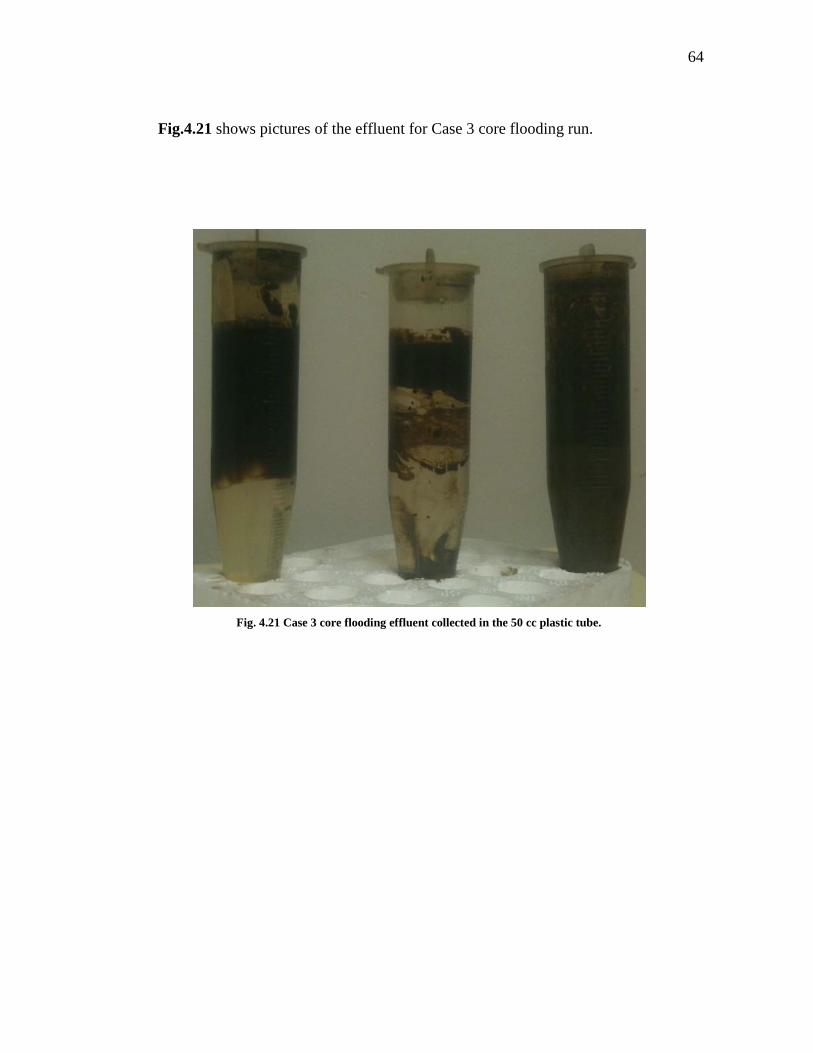
Fig.4.21 shows pictures of the effluent for Case 3 core flooding run.
Fig. 4.21 Case 3 core flooding effluent collected in the 50 cc plastic tube.
65
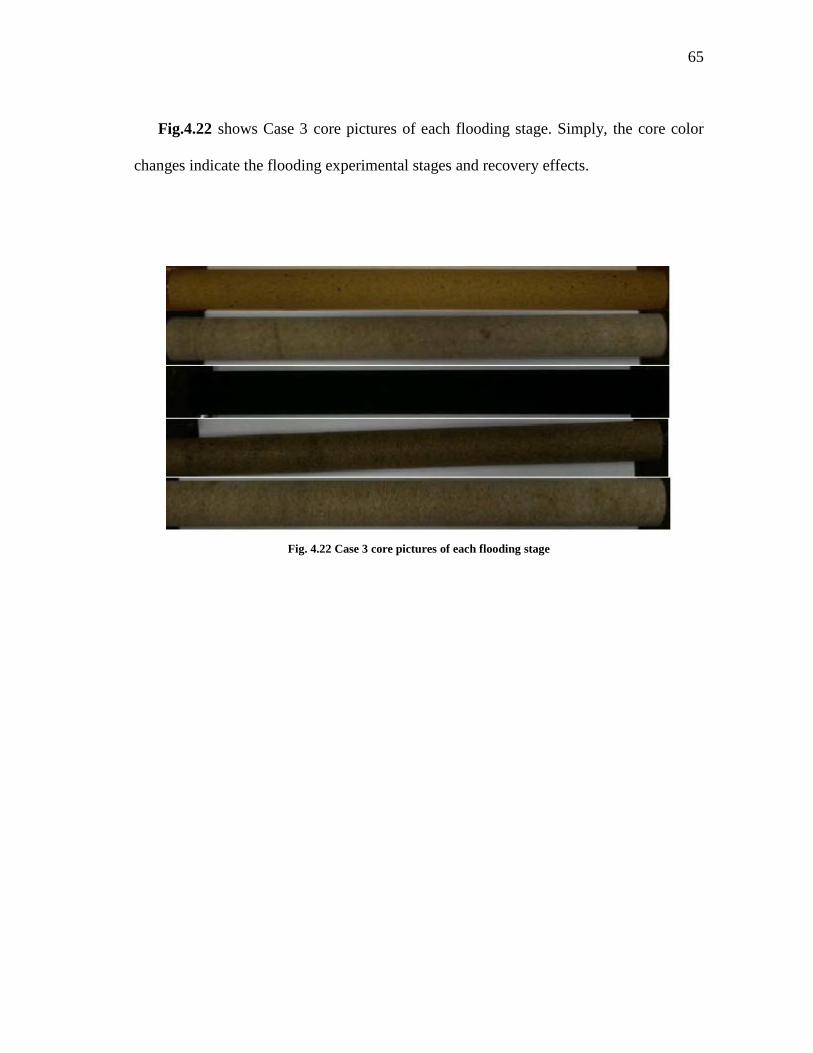
Fig.4.22 shows Case 3 core pictures of each flooding stage. Simply, the core color
changes indicate the flooding experimental stages and recovery effects.
Fig. 4.22 Case 3 core pictures of each flooding stage
66
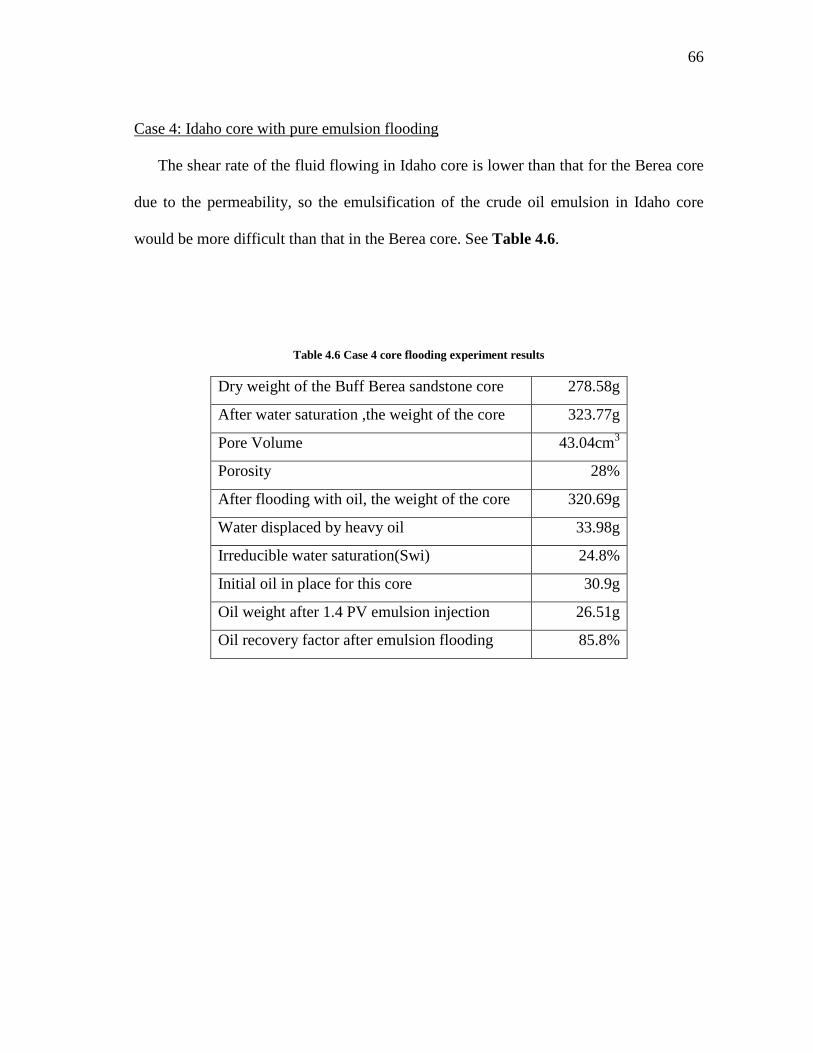
Case 4: Idaho core with pure emulsion flooding
The shear rate of the fluid flowing in Idaho core is lower than that for the Berea core
due to the permeability, so the emulsification of the crude oil emulsion in Idaho core
would be more difficult than that in the Berea core. See Table 4.6.
Table 4.6 Case 4 core flooding experiment results
Dry weight of the Buff Berea sandstone core 278.58g
After water saturation ,the weight of the core 323.77g
Pore Volume 43.04cm3
Porosity 28%
After flooding with oil, the weight of the core 320.69g
Water displaced by heavy oil 33.98g
Irreducible water saturation(Swi) 24.8%
Initial oil in place for this core 30.9g
Oil weight after 1.4 PV emulsion injection 26.51g
Oil recovery factor after emulsion flooding 85.8%
67
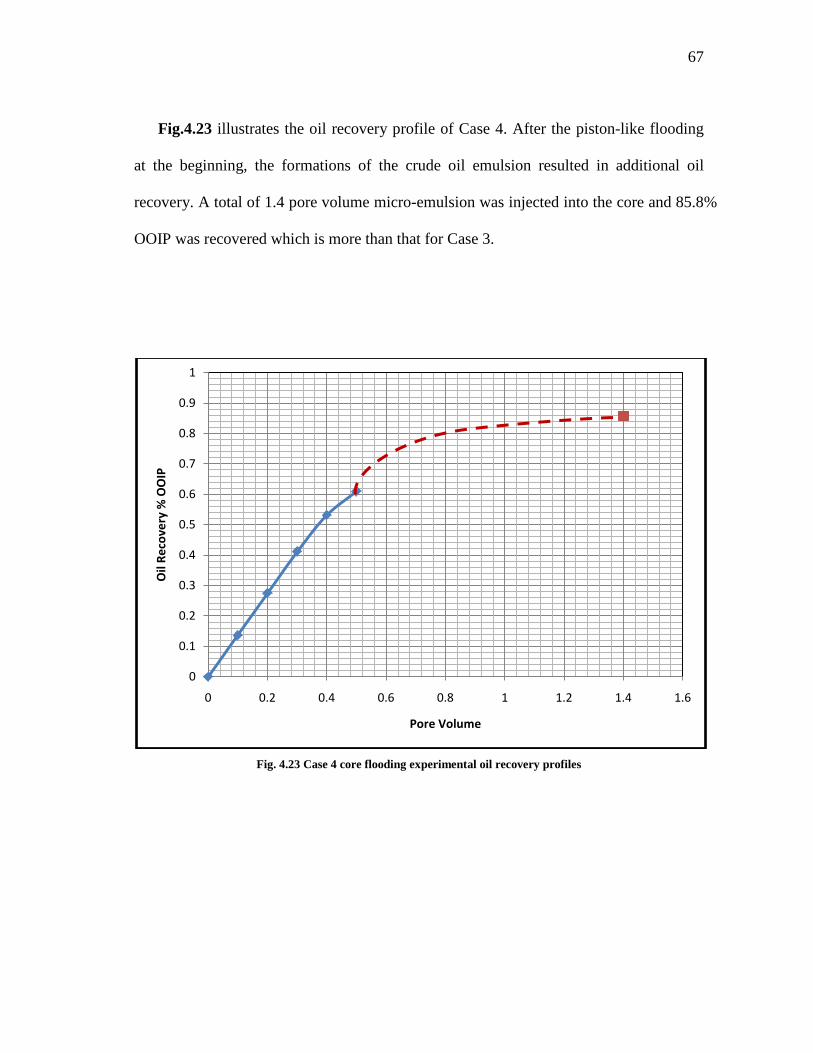
Fig.4.23 illustrates the oil recovery profile of Case 4. After the piston-like flooding
at the beginning, the formations of the crude oil emulsion resulted in additional oil
recovery. A total of 1.4 pore volume micro-emulsion was injected into the core and 85.8%
OOIP was recovered which is more than that for Case 3.
Fig. 4.23 Case 4 core flooding experimental oil recovery profiles
0
0.1
0.2
0.3
0.4
0.5
0.6
0.7
0.8
0.9
1
0 0.2 0.4 0.6 0.8 1 1.2 1.4 1.6
Oil
Reco
very
% O
OIP
Pore Volume
68
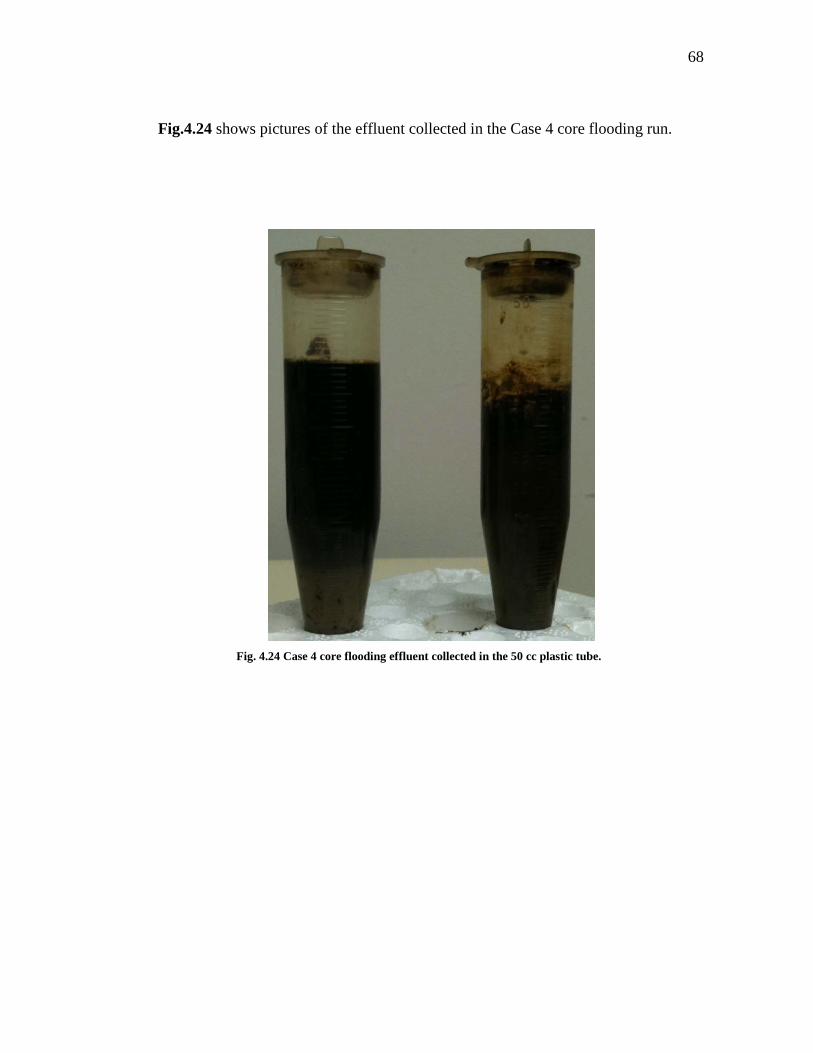
Fig.4.24 shows pictures of the effluent collected in the Case 4 core flooding run.
Fig. 4.24 Case 4 core flooding effluent collected in the 50 cc plastic tube.
69
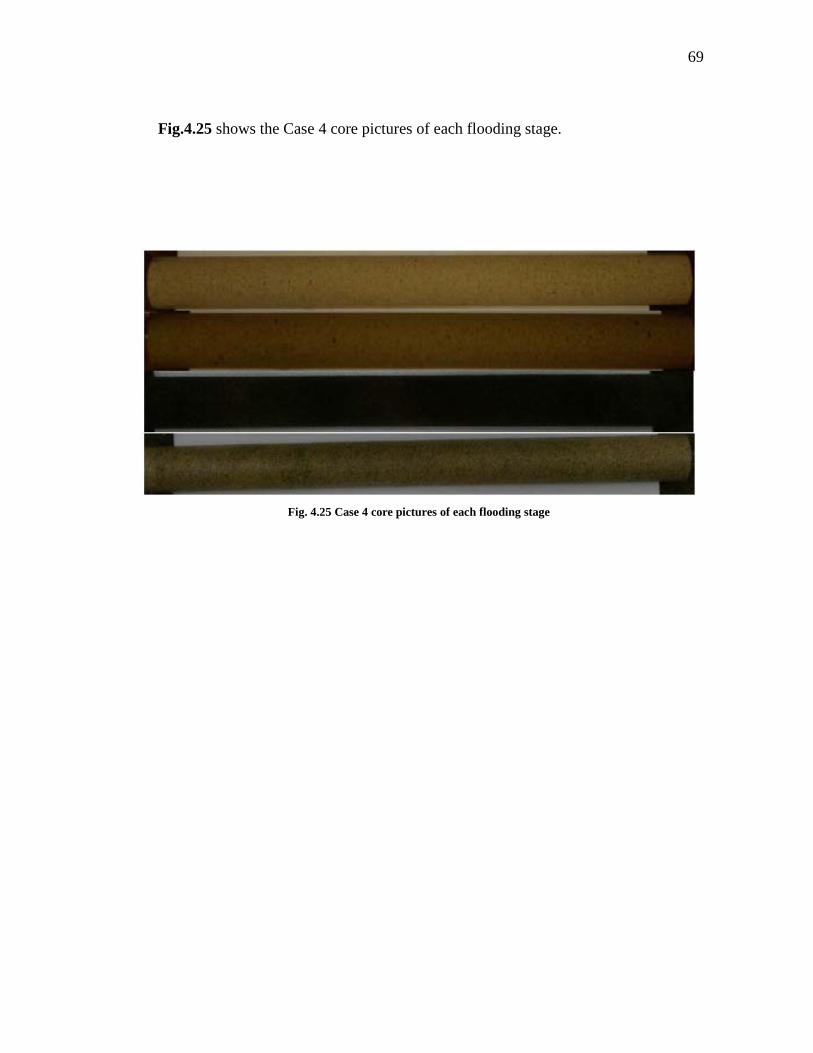
Fig.4.25 shows the Case 4 core pictures of each flooding stage.
Fig. 4.25 Case 4 core pictures of each flooding stage
70
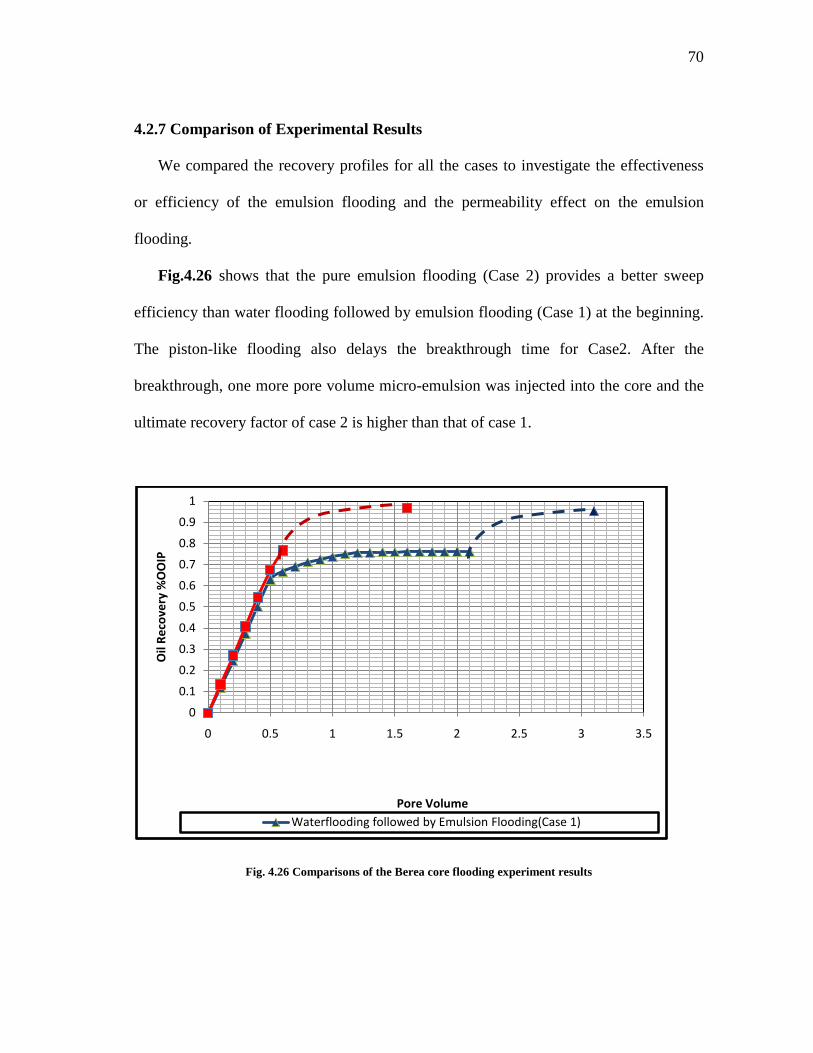
4.2.7 Comparison of Experimental Results
We compared the recovery profiles for all the cases to investigate the effectiveness
or efficiency of the emulsion flooding and the permeability effect on the emulsion
flooding.
Fig.4.26 shows that the pure emulsion flooding (Case 2) provides a better sweep
efficiency than water flooding followed by emulsion flooding (Case 1) at the beginning.
The piston-like flooding also delays the breakthrough time for Case2. After the
breakthrough, one more pore volume micro-emulsion was injected into the core and the
ultimate recovery factor of case 2 is higher than that of case 1.
Fig. 4.26 Comparisons of the Berea core flooding experiment results
0
0.1
0.2
0.3
0.4
0.5
0.6
0.7
0.8
0.9
1
0 0.5 1 1.5 2 2.5 3 3.5
Oil
Reco
very
%O
OIP
Pore VolumeWaterflooding followed by Emulsion Flooding(Case 1)

71
Fig. 4.27 shows that the pure emulsion flooding (Case 4) results in better recovery
efficiency than water flooding followed by emulsion flooding (Case 3) at the beginning.
The piston-like flooding also delays the breakthrough time in Case 4. After the
breakthrough, one more pore volume micro-emulsion was injected into the core and the
resulting ultimate oil recovery factor of case 4 is higher than that of Case 3.
Fig. 4.27 Comparison of the Idaho core flooding experimental results
0
0.1
0.2
0.3
0.4
0.5
0.6
0.7
0.8
0.9
1
0 0.5 1 1.5 2 2.5
Oil
Reco
very
% O
OIP
Pore Volume
Emulsion Flooding(Case 4) Water Flooding followed by Emulsion Flooding(Case 3)
72
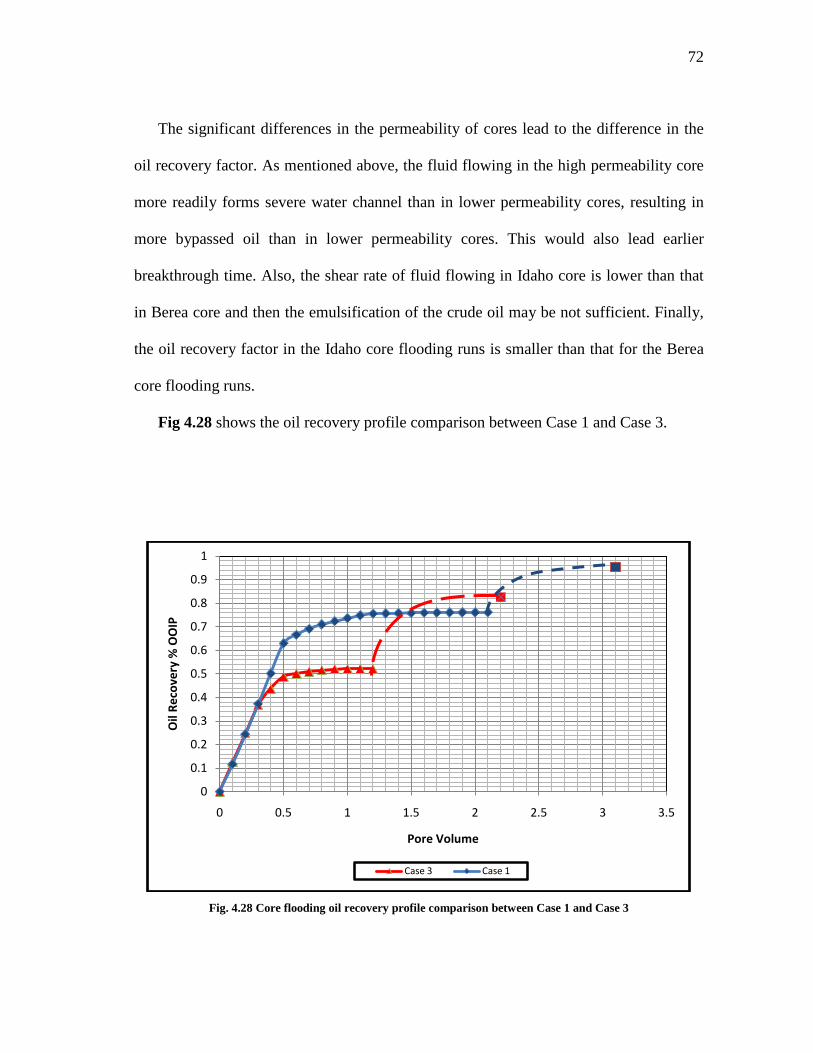
The significant differences in the permeability of cores lead to the difference in the
oil recovery factor. As mentioned above, the fluid flowing in the high permeability core
more readily forms severe water channel than in lower permeability cores, resulting in
more bypassed oil than in lower permeability cores. This would also lead earlier
breakthrough time. Also, the shear rate of fluid flowing in Idaho core is lower than that
in Berea core and then the emulsification of the crude oil may be not sufficient. Finally,
the oil recovery factor in the Idaho core flooding runs is smaller than that for the Berea
core flooding runs.
Fig 4.28 shows the oil recovery profile comparison between Case 1 and Case 3.
Fig. 4.28 Core flooding oil recovery profile comparison between Case 1 and Case 3
0
0.1
0.2
0.3
0.4
0.5
0.6
0.7
0.8
0.9
1
0 0.5 1 1.5 2 2.5 3 3.5
Oil
Reco
very
% O
OIP
Pore Volume
Case 3 Case 1
73
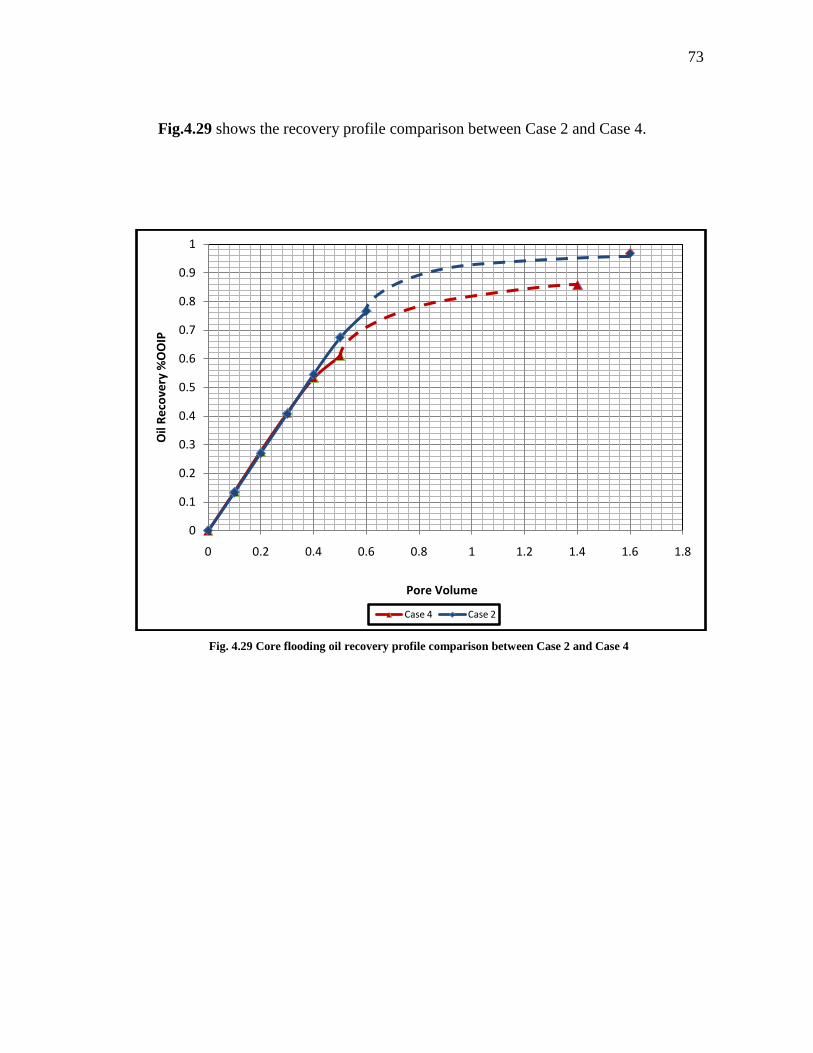
Fig.4.29 shows the recovery profile comparison between Case 2 and Case 4.
Fig. 4.29 Core flooding oil recovery profile comparison between Case 2 and Case 4
0
0.1
0.2
0.3
0.4
0.5
0.6
0.7
0.8
0.9
1
0 0.2 0.4 0.6 0.8 1 1.2 1.4 1.6 1.8
Oil
Reco
very
%O
OIP
Pore Volume
Case 4 Case 2
74
5. SUMMARY, CONCLUSIONS AND RECOMMENDATIONS
5.1 Summary
The main thrust of the research was to evaluate the potential application of nano-
particle-stabilized solvent base emulsion injection to enhance heavy oil recovery in the
Alaska North Slope area. Bench tests including phase behavior scan, rheology study, and
interfacial tension measurement were used to optimize the possible micro-emulsion
composition subjected to the technical and economical consideration. A stable micro-
emulsion containing 90.48wt% brine, 1.71wt% solvent, 3.05wt% surfactant and 4.76wt%
nano-particles were chosen for the core flooding experiments.
Four successful core flood experiments were performed using heavy oil from the
West Sak oil field in Alaska North Slope area. Two different kinds of cores, namely,
Berea core and Idaho core were used for the coreflood experiments. The runs made were
(1) water flooding followed by emulsion flooding and (2) pure emulsion injection core
flooding. During the experimental runs, the following conditions were kept constant:
injection rate (0.5cc/min) and core flooding temperature (77̊F) and only 1 PV micro-
emulsion was injected after breakthrough under water flooding or emulsion flooding.
5.2 Conclusions
The following main conclusions may be drawn from the experimental results:
1. A micro-emulsion will form if the surfactant concentration reaches a critical value
in the emulsion system. In this case, Triton X-100 concentration does not surpass
the 10wt% of the total mass to form micro-emulsion. It is possible to form micro-

75
emulsion with low surfactant concentration. Based on the ternary phase behavior
diagram, the optimum micro-emulsion without nano-particles used in the core
flood experiments contains 95wt% brine, 1.8wt% solvent, 3.2wt% surfactant.
2. Addition of nano-particles to the micro-emulsion increases the viscosity of the
micro-emulsion, resulting in a favorable mobility ratio at the beginning of the
injection. Nano-particles also help to make in situ crude oil emulsification which
could mobilize the bypassed heavy oil and form a favorable miscible flooding
recovery process.
3. The optimized micro-emulsion provides an ultra-low interfacial tension
(0.08mN/m) between micro-emulsion and West Sak heavy oil which is desired to
form continuous emulsion flooding.
4. The experiments involving mixing by the optimized micro-emulsion and West Sak
crude oil, indicated the viscosity reduction mechanisms to be solvent dissolving
oil and formation of oil in water emulsion.
5. In the Berea core flood experiments, emulsion flooding increased the oil recovery
factor by 19.2 points after water flooding (from 76.2% to 95.4% OOIP). This
indicates that the bypassed crude oil in situ emulsification probably blocked the
water channels, increasing the sweep efficiency and also mobilized the residual
crude oil. Oil recovery with pure emulsion flooding was 96.8% OOIP. This
recovery is slightly higher than that with water flooding followed by emulsion
flooding,95.4% OOIP, probably because of the delayed breakthrough time caused
by formation of a more viscous crude oil emulsion.
76
6. In the Idaho core flood run, due to the high permeability of the core compared to
that of Berea core, the breakthrough time is earlier than for the Berea core flood
runs. More bypassed oil is left behind at the end of water flooding. The same pore
volume emulsion flooding behaves more effectively than for Berea core flood
runs. Oil recovery increased by 26.4 percent points from 56.2% OOIP with
waterflooding to 82.6% OOIP with injection of emulsion following waterflooding.
With pure emulsion flooding, oil recovery is slightly higher at 85.8% OOIP.
7. Low permeability typically results in a higher shear rate which is favorable for the
in situ emulsification and higher displacement efficiency. This is verified by
comparing the emulsion flooding oil recovery profiles for the two different cores.
5.3 Recommendations
1. More core flooding experiments should be made to more accurately determine
the optimum the micro-emulsion concentration.
2. Depending on the crude oil properties, a specific surfactant is required to
maximize the advantage of emulsion flooding
3. Consider the use of other kinds of solvents to satisfy the environmental issues
related to xylene.
77
REFERENCES Bouabboune, M., Hammouch, N., & Benhadid, S., 2006. Comparision Between Micro-
Emulsion and Surfactant Solution Flooding Effeciency for Enhanced Oil Recovery in TinFouye Oil Field. Paper presented at the Canadian International Petroleum Conference. SPE 2006-058.
Bryan, J. L., & Kantzas, A., 2007. Enhanced Heavy-Oil Recovery by Alkali-Surfactant
Flooding. Paper presented at the SPE Annual Technical Conference and Exhibition. SPE 110738-MS
Bryan, J. L., Mai, A. T., & Kantzas, A., 2008. Investigation into the Processes
Responsible for Heavy Oil Recovery by Alkali-Surfactant Flooding. Paper presented at the SPE/DOE Symposium on Improved Oil Recovery. SPE 113993-MS
Flaaten, A., Nguyen, Q. P., Pope, G. A., & Zhang, J., 2008. A Systematic Laboratory
Approach to Low-Cost, High-Performance Chemical Flooding. Paper presented at the SPE/DOE Symposium on Improved Oil Recovery. SPE 113469-MS
Healy, R. N., Reed, R. L., 1974. Physsicochemical Aspects of Microemulsion Flooding.
14(5), 491-501.SPE 4583-PA Healy, R. N., Reed, R. L., Carpenter Jr., C. W., 1975. A Laboratory Study of
Microemulsion Flooding (includes associated papers 6395 and 6396). 15(1), 87-103. SPE 4752-PA
Mai, A., Bryan, J., Goodarzi, N., & Kantzas, A., 2009. Insights into Non-Thermal
Recovery of Heavy Oil. 48(3). SPE 09-03-27 Seright, R. S., 2006. Cleanup of Oil Zones after a Gel Treatment. SPE Production &
Operations, 21(2), 237-244. Thomas, 2007. Enhanced Oil Recovery - An Overview. Oil & Gas Science and
Technology, 63(January-February 2008), 9-19. Willhite, G. P., Green, D. W., Okoye, D. M., & Looney, M. D., 1980. A Study of Oil
78
Displacement by Microemulsion Systems Mechanisms and Phase Behavior. SPE Journal, 20(6), 459-472.
Zhang, T., Roberts, M., Bryant, S. L., & Huh, C., 2009. Foams and Emulsions Stabilized
with Nanoparticles for Potential Conformance Control Applications. Paper presented at the SPE International Symposium on Oilfield Chemistry. SPE 121744-MS
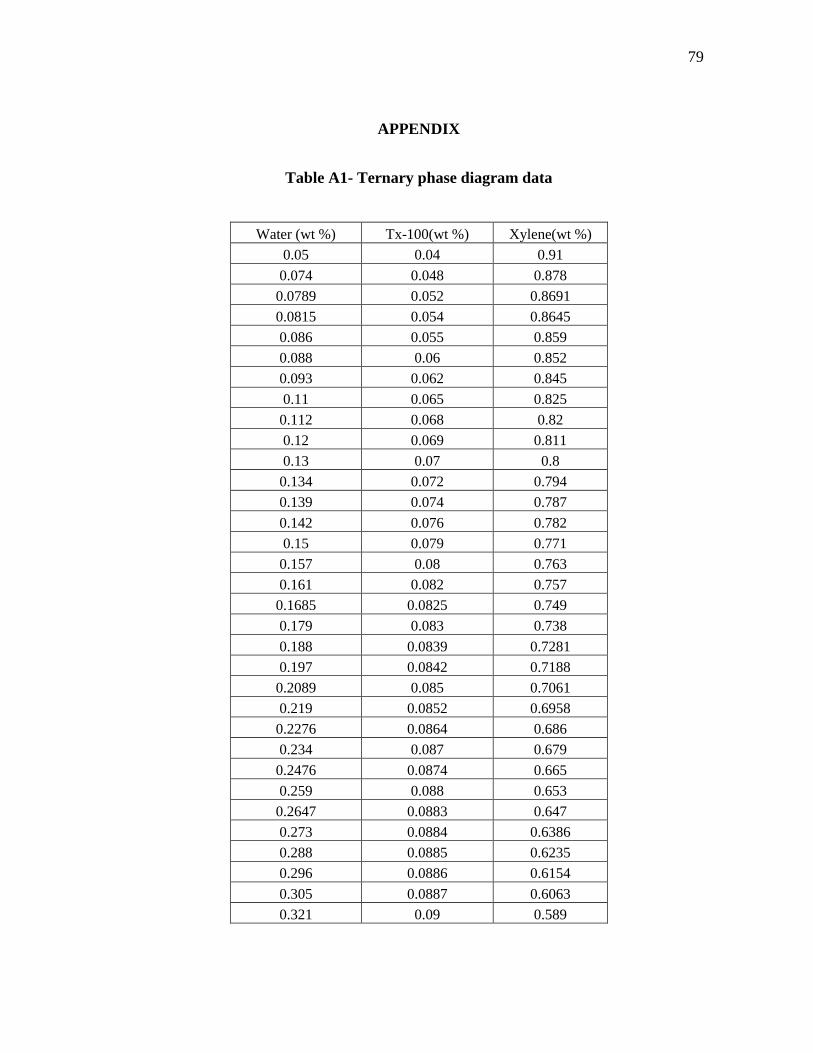
79
APPENDIX
Table A1- Ternary phase diagram data
Water (wt %) Tx-100(wt %) Xylene(wt %)
0.05 0.04 0.91 0.074 0.048 0.878 0.0789 0.052 0.8691 0.0815 0.054 0.8645 0.086 0.055 0.859 0.088 0.06 0.852 0.093 0.062 0.845 0.11 0.065 0.825
0.112 0.068 0.82 0.12 0.069 0.811 0.13 0.07 0.8
0.134 0.072 0.794 0.139 0.074 0.787 0.142 0.076 0.782 0.15 0.079 0.771
0.157 0.08 0.763 0.161 0.082 0.757 0.1685 0.0825 0.749 0.179 0.083 0.738 0.188 0.0839 0.7281 0.197 0.0842 0.7188 0.2089 0.085 0.7061 0.219 0.0852 0.6958 0.2276 0.0864 0.686 0.234 0.087 0.679 0.2476 0.0874 0.665 0.259 0.088 0.653 0.2647 0.0883 0.647 0.273 0.0884 0.6386 0.288 0.0885 0.6235 0.296 0.0886 0.6154 0.305 0.0887 0.6063 0.321 0.09 0.589
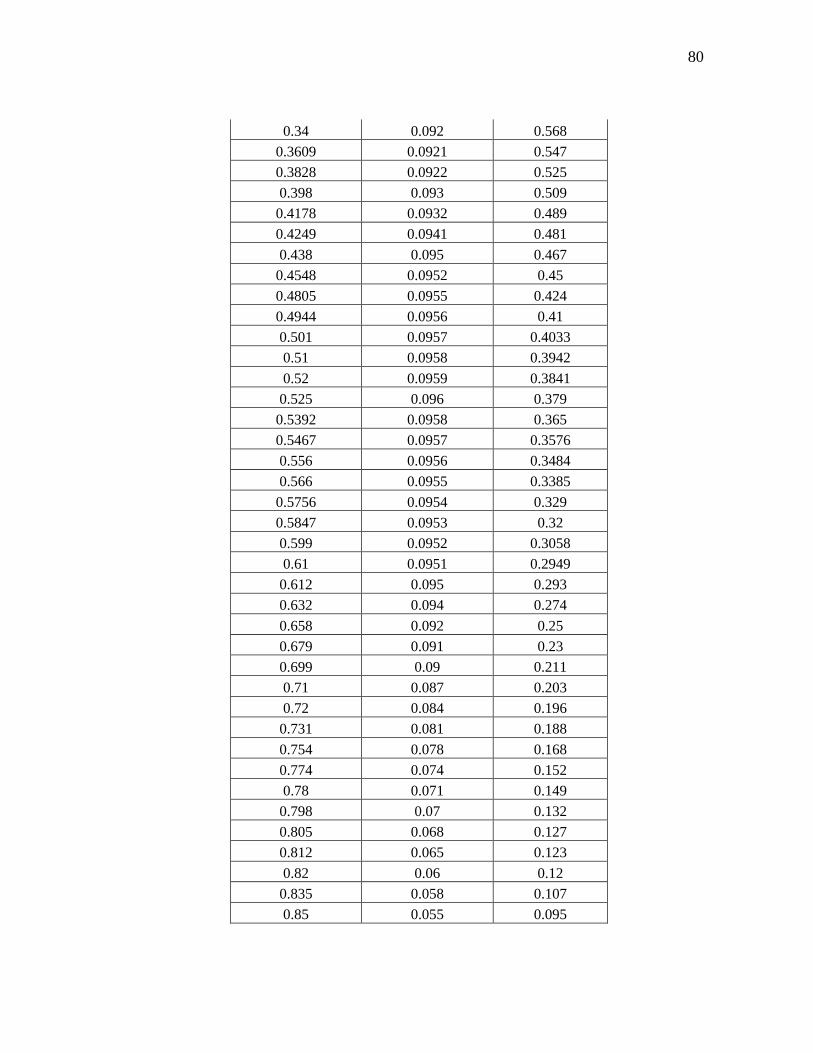
80
0.34 0.092 0.568 0.3609 0.0921 0.547 0.3828 0.0922 0.525 0.398 0.093 0.509 0.4178 0.0932 0.489 0.4249 0.0941 0.481 0.438 0.095 0.467 0.4548 0.0952 0.45 0.4805 0.0955 0.424 0.4944 0.0956 0.41 0.501 0.0957 0.4033 0.51 0.0958 0.3942 0.52 0.0959 0.3841
0.525 0.096 0.379 0.5392 0.0958 0.365 0.5467 0.0957 0.3576 0.556 0.0956 0.3484 0.566 0.0955 0.3385 0.5756 0.0954 0.329 0.5847 0.0953 0.32 0.599 0.0952 0.3058 0.61 0.0951 0.2949
0.612 0.095 0.293 0.632 0.094 0.274 0.658 0.092 0.25 0.679 0.091 0.23 0.699 0.09 0.211 0.71 0.087 0.203 0.72 0.084 0.196
0.731 0.081 0.188 0.754 0.078 0.168 0.774 0.074 0.152 0.78 0.071 0.149
0.798 0.07 0.132 0.805 0.068 0.127 0.812 0.065 0.123 0.82 0.06 0.12
0.835 0.058 0.107 0.85 0.055 0.095
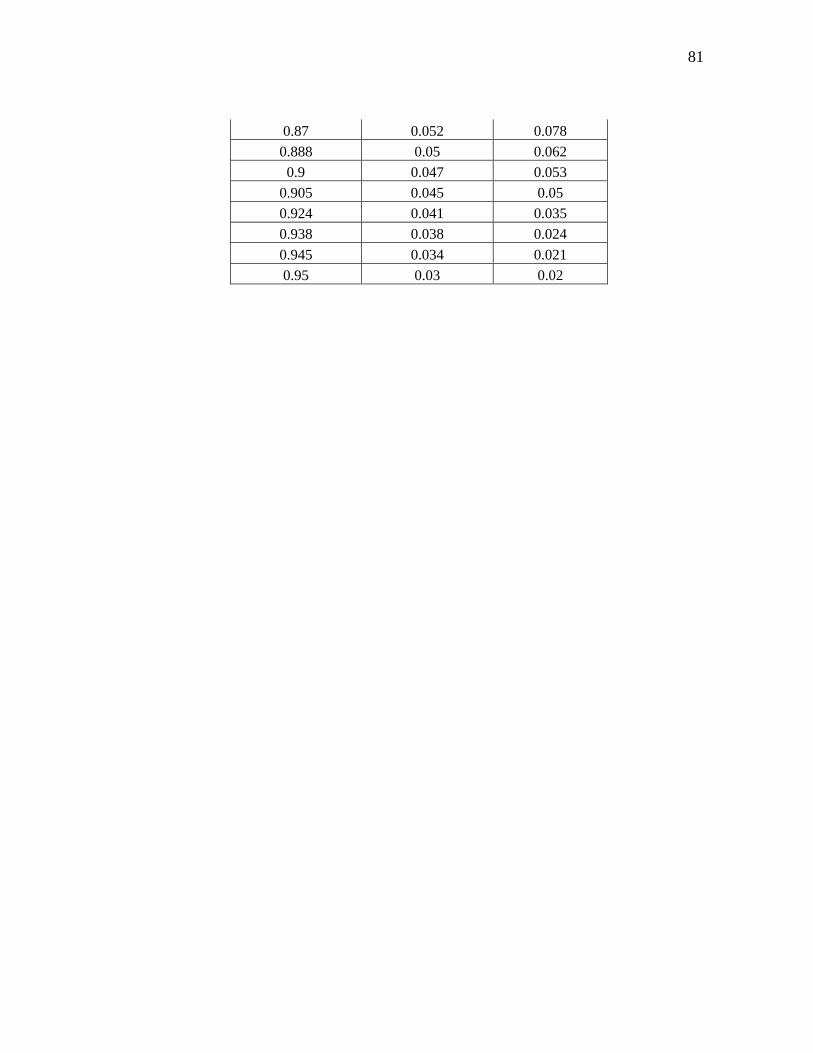
81
0.87 0.052 0.078 0.888 0.05 0.062 0.9 0.047 0.053
0.905 0.045 0.05 0.924 0.041 0.035 0.938 0.038 0.024 0.945 0.034 0.021 0.95 0.03 0.02
82
VITA
Name: Fangda Qiu
Permanent address: 3116 TAMU, Richardson Building
Texas A&M University, College Station, Texas, 77843
Education: B.S. Petroleum Engineering
China University of Petroleum, Beijing, China 2008
M.S. Petroleum Engineering
Texas A&M University, College Station 2010
Member: Society of Petroleum Engineers
Email address: [email protected]