Embed Size (px)
Citation preview
Experimental Study of Rotor Performance in Deep Ground Effect with
Application to a Human-Powered Helicopter
Joseph Schmaus1 Benjamin Berry
2 William Gross
3 Panagiotis Koliais
4
Alfred Gessow Rotorcraft Center
Department of Aerospace Engineering
University of Maryland, College Park, MD 20742
ABSTRACT
A study of ground effect performance is presented with specific applications to Gamera, a human powered helicopter. This
parametric study quantifies ground effect for four different rotors: a baseline (no twist/no taper), negative twist/no taper,
positive twist/no taper, and taper/no twist. Data for these four rotors are presented in power polars and as global performance
improvements. A brief study is made of how to apply these measurements to predictions of performance in ground effect.
Comparisons between the individual rotors are then used to inform design decisions for helicopters being optimized for
ground effect, specifically Gamera. Performance measurements from a Gamera rotor in deep ground effect are presented.
NOTATION
A Rotor disc area, ft2
c(r) Chord distribution, ft
c75 Chord at 75% radius, ft
croot/ctip Taper ratio
CP Power Coefficient, P/ρA(ΩR)3
CT Thrust Coefficient, T/ρA(ΩR)2
k Induced power factor
kG Ground effect induced power factor
R Rotor radius, ft
Retip Tip Reynolds number
z Height above the ground, ft
z/R Height to radius ratio
λi Induce inflow
Ω Rotor speed, rad/s
ρ Air density, slug/ft3
σ Thrust weighted solidity, (3Nb/πR)∫c(r)r2dr
θo Collective pitch
θtw Tip twist relative to the root
Abbreviations
IGE In ground effect
OGE Out of ground effect
1 Graduate Research Assistant. [email protected]
2 Graduate Research Assistant. [email protected]
3 Undergraduate Researcher. [email protected]
4 Graduate Research Assistant. [email protected]
Presented at the American Helicopter Society 68th Annual
Forum, Fort Worth, Texas, May 1-3, 2012. Copyright ©
2012 by the American Helicopter Society International, Inc.
All rights reserved.
INTRODUCTION
Team Gamera from the Alfred Gessow Rotorcraft
Center at the University of Maryland designed and flew a
human powered helicopter, named Gamera I, in the summer
of 2011. Judy Wexler, a graduate student at UMD, flew the
vehicle a total of 6 times. Her longest flight, lasting 11.4
seconds, holds the Fédération Aéronautique Internationale
(FAI) world record for hovering duration of a human
powered helicopter in the general and feminine categories.
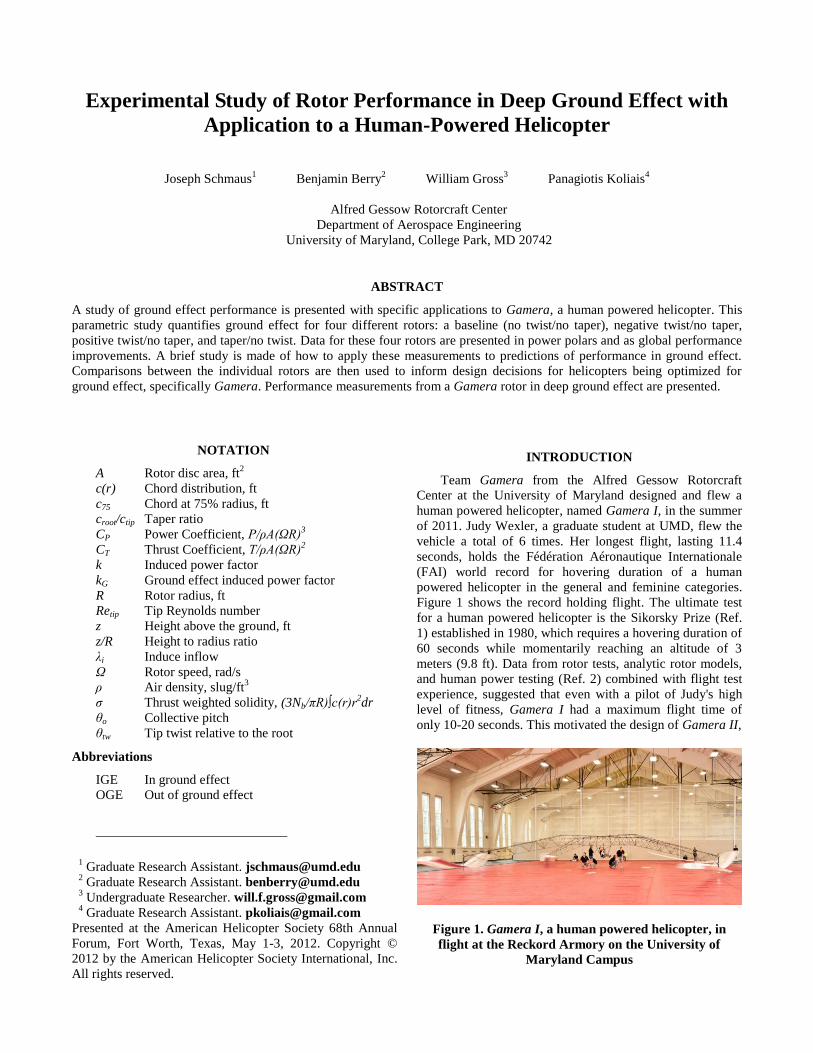
Figure 1 shows the record holding flight. The ultimate test
for a human powered helicopter is the Sikorsky Prize (Ref.
1) established in 1980, which requires a hovering duration of
60 seconds while momentarily reaching an altitude of 3
meters (9.8 ft). Data from rotor tests, analytic rotor models,
and human power testing (Ref. 2) combined with flight test
experience, suggested that even with a pilot of Judy's high
level of fitness, Gamera I had a maximum flight time of
only 10-20 seconds. This motivated the design of Gamera II,
Figure 1. Gamera I, a human powered helicopter, in
flight at the Reckord Armory on the University of
Maryland Campus
focusing on minimizing the total weight of the vehicle and
designing a more efficient rotor (Ref. 3). As part of this
effort, a detailed study of ground effect performance on a
sub-scale rotor was undertaken by the team. Based on the
sub-scale experimental results a design was selected for
Gamera II’s rotor and this rotor has been tested across a
range of heights.
Ground effect is a term that is used to describe the
changes in performance that both rotorcraft and fixed wing
aircraft experience as they approach the ground. In rotorcraft
it is used to allow an overloaded helicopter to transition to
forward flight for takeoff and to provide part of the air
cushion an autorotating helicopter relies on for a safe
landing. For this reason, ground effect is often viewed as an
increase in thrust for a constant power. A key parameter
when looking at ground effect is the height above the
ground, traditionally represented as a non dimensional ratio
with the rotor radius (z/R). In most helicopters the rotor is
placed above the fuselage, creating a practical minimum z/R
value of 0.5. Rotors on human powered helicopters have
radii of 20-50 ft and are placed as close to the ground as
possible to maximize the impact of ground effect. This
limits the maximum z/R of a human powered helicopter less
than 0.5. The region with z/R < 0.5 was labeled deep ground
effect in these experiments to differentiate it from the higher
heights and more marginal improvements seen by a
traditional helicopter. Human Powered helicopters have
other unique features affecting the way ground effect is
measured. Figure 2 shows how the constant power output a
human can sustain is a strong function of the duration of the
activity. The combined weight of the pilot and aircraft are
constant suggesting that it is more natural to look at ground
effect as a savings in power at a constant thrust.
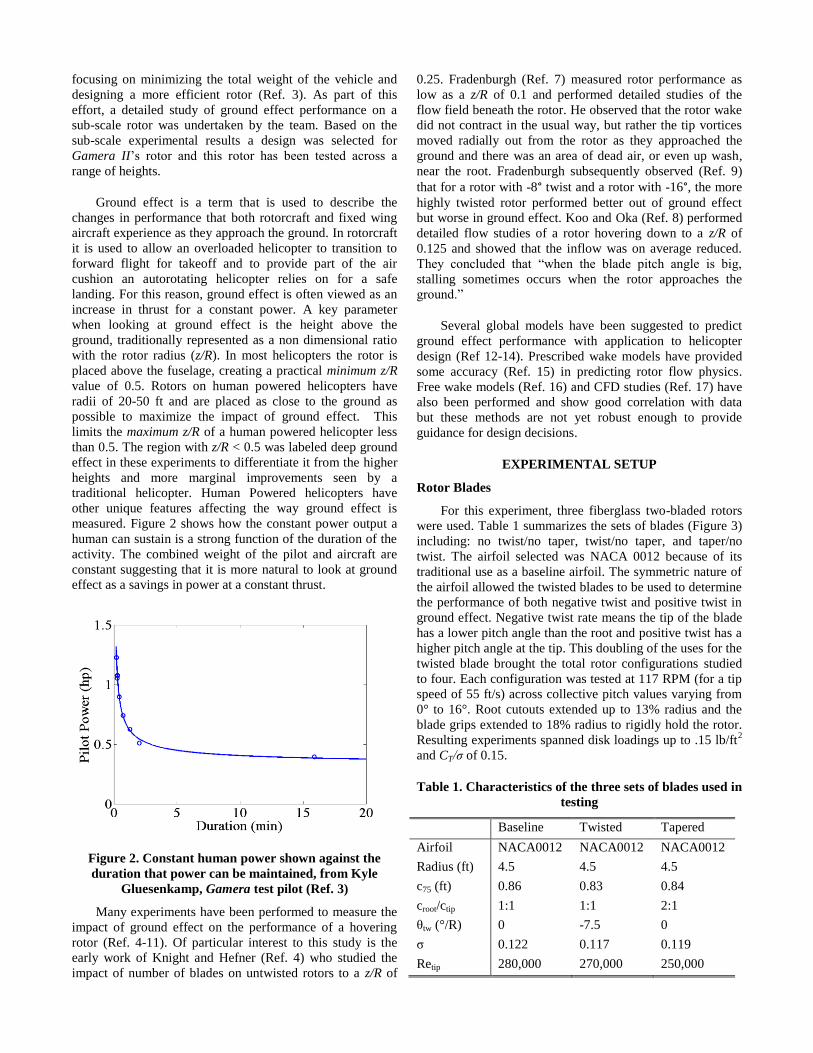
Figure 2. Constant human power shown against the
duration that power can be maintained, from Kyle
Gluesenkamp, Gamera test pilot (Ref. 3)
Many experiments have been performed to measure the
impact of ground effect on the performance of a hovering
rotor (Ref. 4-11). Of particular interest to this study is the
early work of Knight and Hefner (Ref. 4) who studied the
impact of number of blades on untwisted rotors to a z/R of
0.25. Fradenburgh (Ref. 7) measured rotor performance as
low as a z/R of 0.1 and performed detailed studies of the
flow field beneath the rotor. He observed that the rotor wake
did not contract in the usual way, but rather the tip vortices
moved radially out from the rotor as they approached the
ground and there was an area of dead air, or even up wash,
near the root. Fradenburgh subsequently observed (Ref. 9)
that for a rotor with -8° twist and a rotor with -16°, the more
highly twisted rotor performed better out of ground effect
but worse in ground effect. Koo and Oka (Ref. 8) performed
detailed flow studies of a rotor hovering down to a z/R of
0.125 and showed that the inflow was on average reduced.
They concluded that “when the blade pitch angle is big,
stalling sometimes occurs when the rotor approaches the
ground.”
Several global models have been suggested to predict
ground effect performance with application to helicopter
design (Ref 12-14). Prescribed wake models have provided
some accuracy (Ref. 15) in predicting rotor flow physics.
Free wake models (Ref. 16) and CFD studies (Ref. 17) have
also been performed and show good correlation with data
but these methods are not yet robust enough to provide
guidance for design decisions.
EXPERIMENTAL SETUP
Rotor Blades
For this experiment, three fiberglass two-bladed rotors
were used. Table 1 summarizes the sets of blades (Figure 3)
including: no twist/no taper, twist/no taper, and taper/no
twist. The airfoil selected was NACA 0012 because of its
traditional use as a baseline airfoil. The symmetric nature of
the airfoil allowed the twisted blades to be used to determine
the performance of both negative twist and positive twist in
ground effect. Negative twist rate means the tip of the blade
has a lower pitch angle than the root and positive twist has a
higher pitch angle at the tip. This doubling of the uses for the
twisted blade brought the total rotor configurations studied
to four. Each configuration was tested at 117 RPM (for a tip
speed of 55 ft/s) across collective pitch values varying from
0° to 16°. Root cutouts extended up to 13% radius and the
blade grips extended to 18% radius to rigidly hold the rotor.
Resulting experiments spanned disk loadings up to .15 lb/ft2
and CT/σ of 0.15.
Table 1. Characteristics of the three sets of blades used in
testing
Baseline Twisted Tapered
Airfoil NACA0012 NACA0012 NACA0012
Radius (ft) 4.5 4.5 4.5
c75 (ft) 0.86 0.83 0.84
croot/ctip 1:1 1:1 2:1
θtw (°/R) 0 -7.5 0
σ 0.122 0.117 0.119
Retip 280,000 270,000 250,000
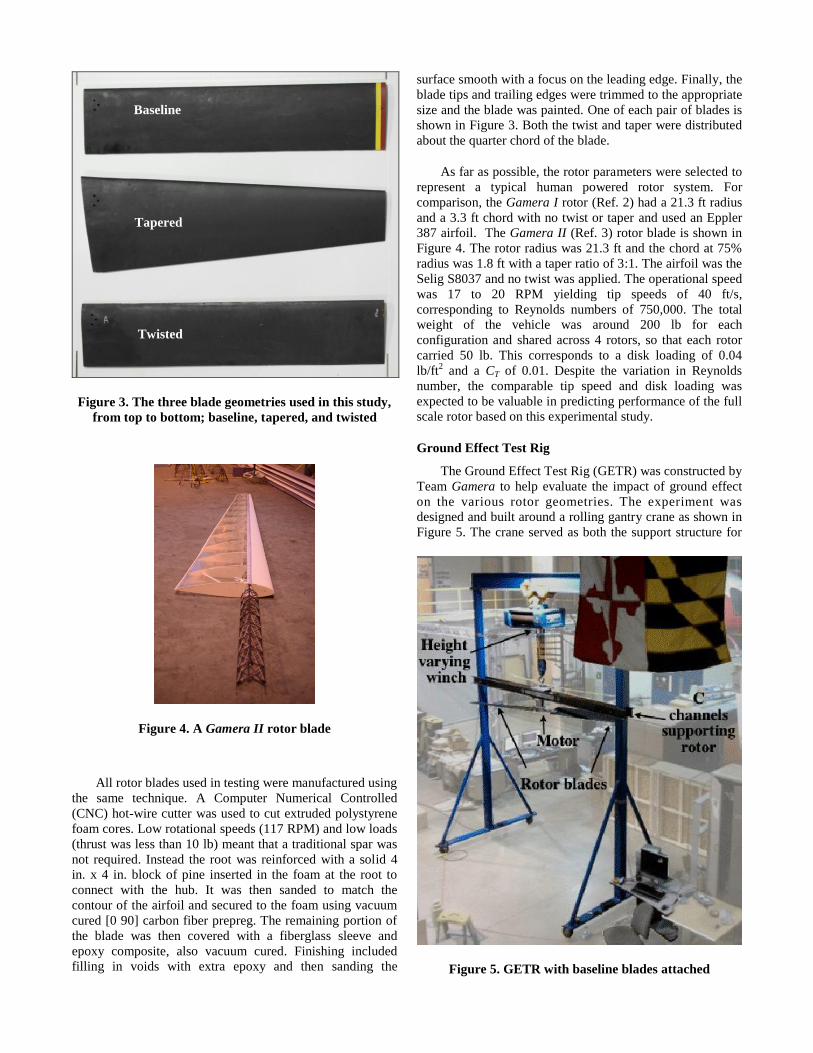
Figure 3. The three blade geometries used in this study,
from top to bottom; baseline, tapered, and twisted
Figure 4. A Gamera II rotor blade
All rotor blades used in testing were manufactured using
the same technique. A Computer Numerical Controlled
(CNC) hot-wire cutter was used to cut extruded polystyrene
foam cores. Low rotational speeds (117 RPM) and low loads
(thrust was less than 10 lb) meant that a traditional spar was
not required. Instead the root was reinforced with a solid 4
in. x 4 in. block of pine inserted in the foam at the root to
connect with the hub. It was then sanded to match the
contour of the airfoil and secured to the foam using vacuum
cured [0 90] carbon fiber prepreg. The remaining portion of
the blade was then covered with a fiberglass sleeve and
epoxy composite, also vacuum cured. Finishing included
filling in voids with extra epoxy and then sanding the
surface smooth with a focus on the leading edge. Finally, the
blade tips and trailing edges were trimmed to the appropriate
size and the blade was painted. One of each pair of blades is
shown in Figure 3. Both the twist and taper were distributed
about the quarter chord of the blade.
As far as possible, the rotor parameters were selected to
represent a typical human powered rotor system. For
comparison, the Gamera I rotor (Ref. 2) had a 21.3 ft radius
and a 3.3 ft chord with no twist or taper and used an Eppler
387 airfoil. The Gamera II (Ref. 3) rotor blade is shown in
Figure 4. The rotor radius was 21.3 ft and the chord at 75%
radius was 1.8 ft with a taper ratio of 3:1. The airfoil was the
Selig S8037 and no twist was applied. The operational speed
was 17 to 20 RPM yielding tip speeds of 40 ft/s,
corresponding to Reynolds numbers of 750,000. The total
weight of the vehicle was around 200 lb for each
configuration and shared across 4 rotors, so that each rotor
carried 50 lb. This corresponds to a disk loading of 0.04
lb/ft2 and a CT of 0.01. Despite the variation in Reynolds
number, the comparable tip speed and disk loading was
expected to be valuable in predicting performance of the full
scale rotor based on this experimental study.
Ground Effect Test Rig
The Ground Effect Test Rig (GETR) was constructed by
Team Gamera to help evaluate the impact of ground effect
on the various rotor geometries. The experiment was
designed and built around a rolling gantry crane as shown in
Figure 5. The crane served as both the support structure for
Figure 5. GETR with baseline blades attached
Baseline
Tapered
Twisted
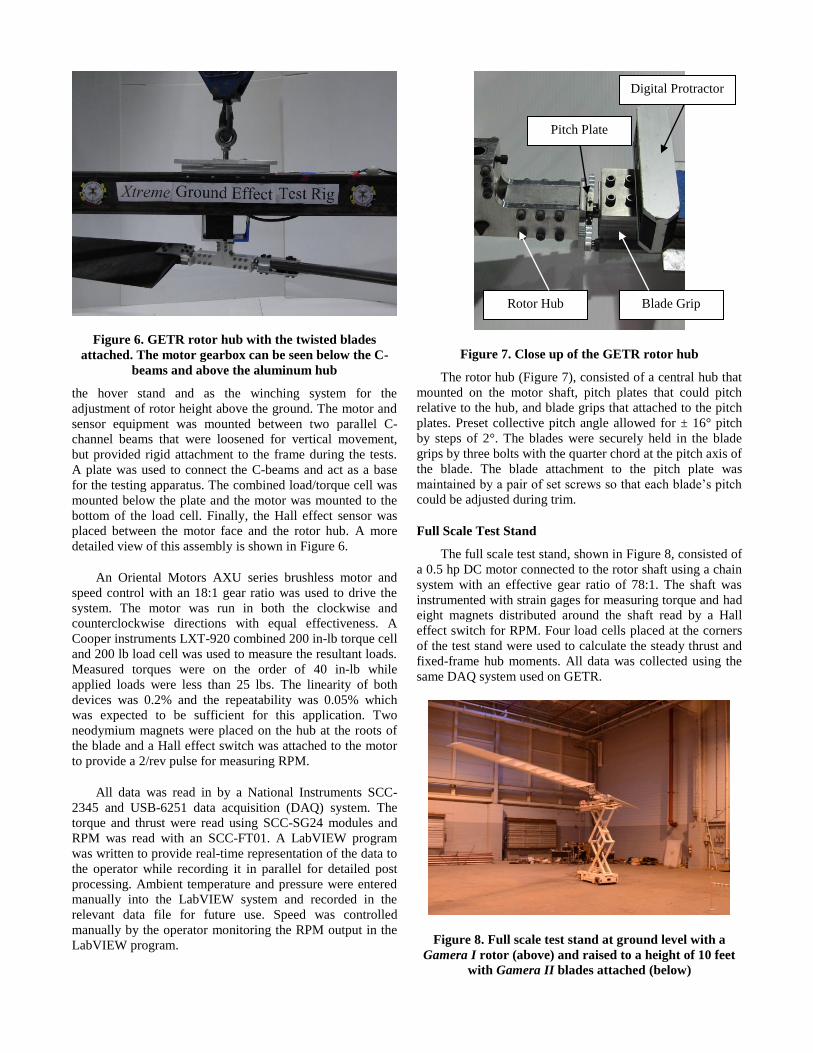
Figure 6. GETR rotor hub with the twisted blades
attached. The motor gearbox can be seen below the C-
beams and above the aluminum hub
the hover stand and as the winching system for the
adjustment of rotor height above the ground. The motor and
sensor equipment was mounted between two parallel C-
channel beams that were loosened for vertical movement,
but provided rigid attachment to the frame during the tests.
A plate was used to connect the C-beams and act as a base
for the testing apparatus. The combined load/torque cell was
mounted below the plate and the motor was mounted to the
bottom of the load cell. Finally, the Hall effect sensor was
placed between the motor face and the rotor hub. A more
detailed view of this assembly is shown in Figure 6.
An Oriental Motors AXU series brushless motor and
speed control with an 18:1 gear ratio was used to drive the
system. The motor was run in both the clockwise and
counterclockwise directions with equal effectiveness. A
Cooper instruments LXT-920 combined 200 in-lb torque cell
and 200 lb load cell was used to measure the resultant loads.
Measured torques were on the order of 40 in-lb while
applied loads were less than 25 lbs. The linearity of both
devices was 0.2% and the repeatability was 0.05% which
was expected to be sufficient for this application. Two
neodymium magnets were placed on the hub at the roots of
the blade and a Hall effect switch was attached to the motor
to provide a 2/rev pulse for measuring RPM.
All data was read in by a National Instruments SCC-
2345 and USB-6251 data acquisition (DAQ) system. The
torque and thrust were read using SCC-SG24 modules and
RPM was read with an SCC-FT01. A LabVIEW program
was written to provide real-time representation of the data to
the operator while recording it in parallel for detailed post
processing. Ambient temperature and pressure were entered
manually into the LabVIEW system and recorded in the
relevant data file for future use. Speed was controlled
manually by the operator monitoring the RPM output in the
LabVIEW program.
Figure 7. Close up of the GETR rotor hub
The rotor hub (Figure 7), consisted of a central hub that
mounted on the motor shaft, pitch plates that could pitch
relative to the hub, and blade grips that attached to the pitch
plates. Preset collective pitch angle allowed for ± 16° pitch
by steps of 2°. The blades were securely held in the blade
grips by three bolts with the quarter chord at the pitch axis of
the blade. The blade attachment to the pitch plate was
maintained by a pair of set screws so that each blade’s pitch
could be adjusted during trim.
Full Scale Test Stand
The full scale test stand, shown in Figure 8, consisted of
a 0.5 hp DC motor connected to the rotor shaft using a chain
system with an effective gear ratio of 78:1. The shaft was
instrumented with strain gages for measuring torque and had
eight magnets distributed around the shaft read by a Hall
effect switch for RPM. Four load cells placed at the corners
of the test stand were used to calculate the steady thrust and
fixed-frame hub moments. All data was collected using the
same DAQ system used on GETR.
Figure 8. Full scale test stand at ground level with a
Gamera I rotor (above) and raised to a height of 10 feet
with Gamera II blades attached (below)
Rotor Hub
Pitch Plate
Blade Grip
Digital Protractor
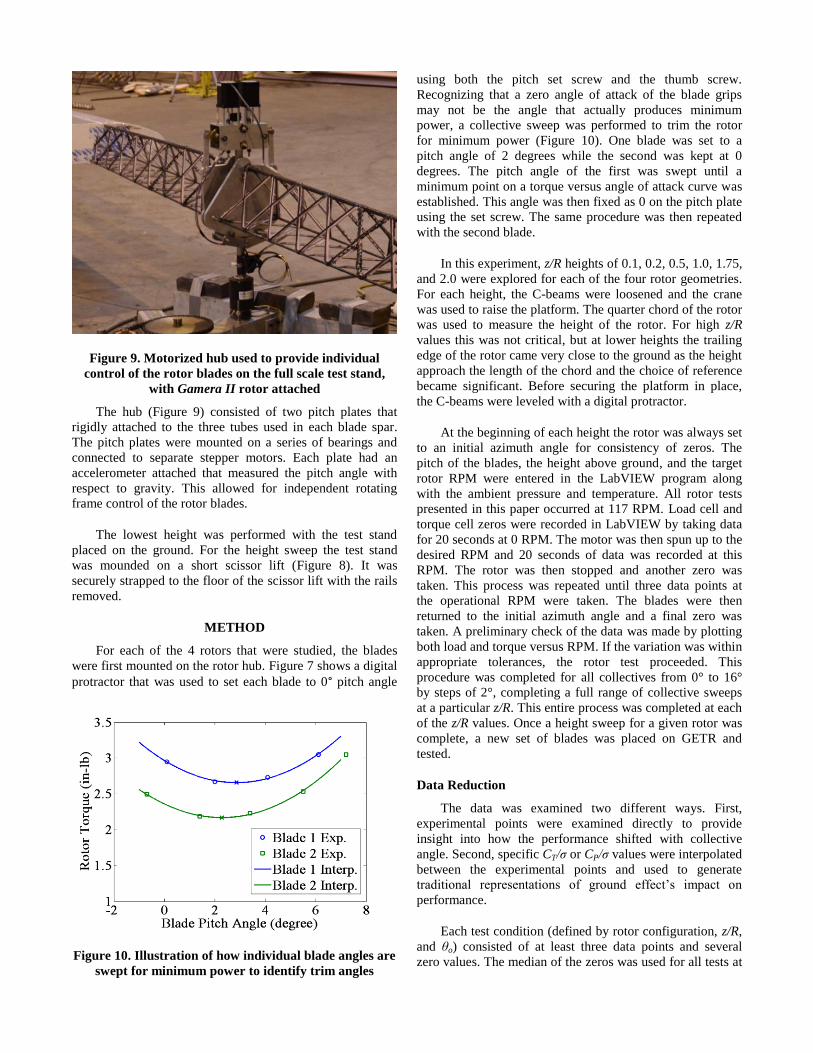
Figure 9. Motorized hub used to provide individual
control of the rotor blades on the full scale test stand,
with Gamera II rotor attached
The hub (Figure 9) consisted of two pitch plates that
rigidly attached to the three tubes used in each blade spar.
The pitch plates were mounted on a series of bearings and
connected to separate stepper motors. Each plate had an
accelerometer attached that measured the pitch angle with
respect to gravity. This allowed for independent rotating
frame control of the rotor blades.
The lowest height was performed with the test stand
placed on the ground. For the height sweep the test stand
was mounded on a short scissor lift (Figure 8). It was
securely strapped to the floor of the scissor lift with the rails
removed.
METHOD
For each of the 4 rotors that were studied, the blades
were first mounted on the rotor hub. Figure 7 shows a digital
protractor that was used to set each blade to 0° pitch angle
Figure 10. Illustration of how individual blade angles are
swept for minimum power to identify trim angles
using both the pitch set screw and the thumb screw.
Recognizing that a zero angle of attack of the blade grips
may not be the angle that actually produces minimum
power, a collective sweep was performed to trim the rotor
for minimum power (Figure 10). One blade was set to a
pitch angle of 2 degrees while the second was kept at 0
degrees. The pitch angle of the first was swept until a
minimum point on a torque versus angle of attack curve was
established. This angle was then fixed as 0 on the pitch plate
using the set screw. The same procedure was then repeated
with the second blade.
In this experiment, z/R heights of 0.1, 0.2, 0.5, 1.0, 1.75,
and 2.0 were explored for each of the four rotor geometries.
For each height, the C-beams were loosened and the crane
was used to raise the platform. The quarter chord of the rotor
was used to measure the height of the rotor. For high z/R
values this was not critical, but at lower heights the trailing
edge of the rotor came very close to the ground as the height
approach the length of the chord and the choice of reference
became significant. Before securing the platform in place,
the C-beams were leveled with a digital protractor.
At the beginning of each height the rotor was always set
to an initial azimuth angle for consistency of zeros. The
pitch of the blades, the height above ground, and the target
rotor RPM were entered in the LabVIEW program along
with the ambient pressure and temperature. All rotor tests
presented in this paper occurred at 117 RPM. Load cell and
torque cell zeros were recorded in LabVIEW by taking data
for 20 seconds at 0 RPM. The motor was then spun up to the
desired RPM and 20 seconds of data was recorded at this
RPM. The rotor was then stopped and another zero was
taken. This process was repeated until three data points at
the operational RPM were taken. The blades were then
returned to the initial azimuth angle and a final zero was
taken. A preliminary check of the data was made by plotting
both load and torque versus RPM. If the variation was within
appropriate tolerances, the rotor test proceeded. This
procedure was completed for all collectives from 0° to 16°
by steps of 2°, completing a full range of collective sweeps
at a particular z/R. This entire process was completed at each
of the z/R values. Once a height sweep for a given rotor was
complete, a new set of blades was placed on GETR and
tested.
Data Reduction
The data was examined two different ways. First,
experimental points were examined directly to provide
insight into how the performance shifted with collective
angle. Second, specific CT/σ or CP/σ values were interpolated
between the experimental points and used to generate
traditional representations of ground effect’s impact on
performance.
Each test condition (defined by rotor configuration, z/R,
and θo) consisted of at least three data points and several
zero values. The median of the zeros was used for all tests at
that condition to limit the impact of data drift and remove
the impact of slight variations in test setup between
configurations. Temperature and pressure were used to
calculate the air density value. CP and CT values were
calculated as described in the notation section using this
local density value and the RPM recorded by the Hall effect
switch for each test. The data was further divided by the
thrust weighted solidity, σ, to remove the impact of blade
area, particularly when comparing tapered to untapered
blades.
Figure 11. Collective sweep of the baseline rotor at a z/R
of 0.20 with an interpolated best fit line
At each height the data in the sweep were interpolated
by a polynomial, an example of which is shown in Figure
11. In some cases a polynomial could not properly capture
high powers associated with high collectives in deep ground
effect without adding extra oscillations or poorly
representing the data. These cases correlate with sharp
power increases that are discussed later and are likely
correlated with stall. Therefore these points were not
included in the interpolations. This is illustrated by the point
with a CT/σ value of 0.13 in Figure 11.
Full Scale Tests
For the full scale tests heights with a z/R of 0.30, 0.39,
0.54, 0.63, 0.71, and 0.86 were examined. While these do
not come close to the OGE value, they were chosen because
they cover the range of heights Gamera II would experience
completing the Sikorsky prize. At each height the scissor lift
was secured and a zero was taken with the rotors stationary.
Then rotors were spun up to 20 RPM with the pitch set low
and the rotors were balanced. The individual blade control
and moment data from the four load cells were used to
ensure that the net lift was shared evenly between the two
rotor blades for optimal performance and safety of the rig
and personnel. With the rotor still spinning the collective
was increased and a thrust sweep was taken in a single test.
Ambient temperature and pressure were recorded in the
LabVIEW program and the resulting data was analyzed in a
similar way to the GETR tests.
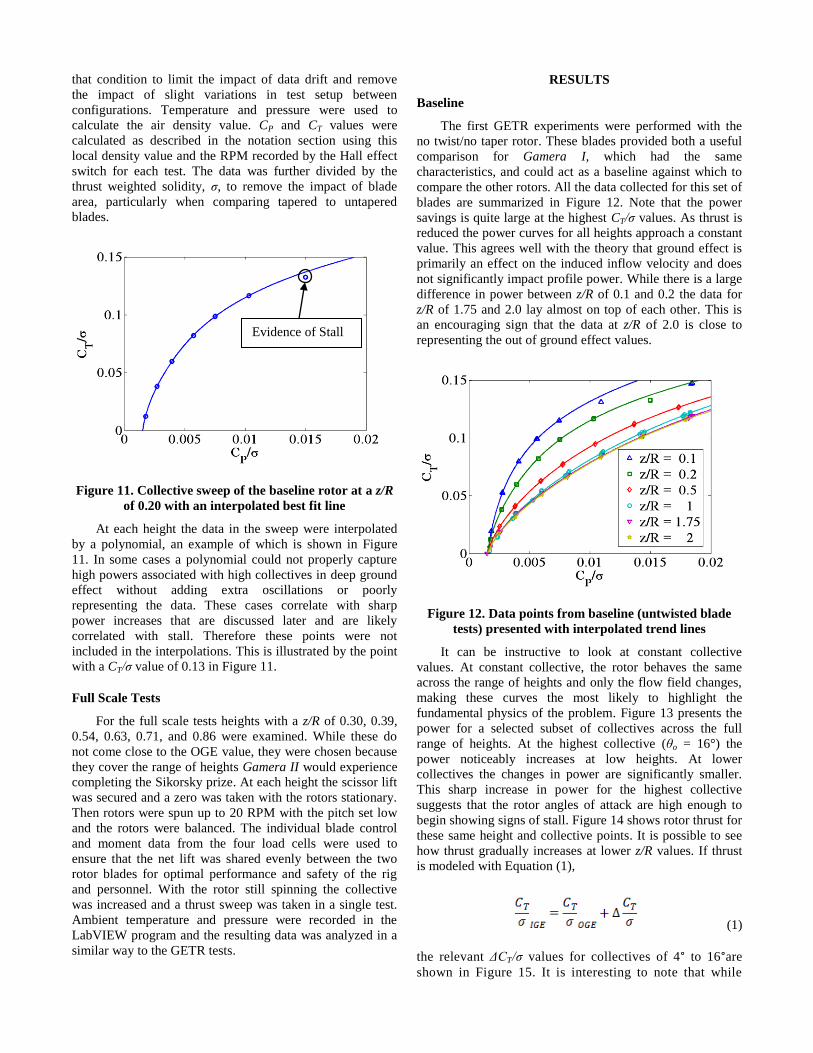
RESULTS
Baseline
The first GETR experiments were performed with the
no twist/no taper rotor. These blades provided both a useful
comparison for Gamera I, which had the same
characteristics, and could act as a baseline against which to
compare the other rotors. All the data collected for this set of
blades are summarized in Figure 12. Note that the power
savings is quite large at the highest CT/σ values. As thrust is
reduced the power curves for all heights approach a constant
value. This agrees well with the theory that ground effect is
primarily an effect on the induced inflow velocity and does
not significantly impact profile power. While there is a large
difference in power between z/R of 0.1 and 0.2 the data for
z/R of 1.75 and 2.0 lay almost on top of each other. This is
an encouraging sign that the data at z/R of 2.0 is close to
representing the out of ground effect values.
Figure 12. Data points from baseline (untwisted blade
tests) presented with interpolated trend lines
It can be instructive to look at constant collective
values. At constant collective, the rotor behaves the same
across the range of heights and only the flow field changes,
making these curves the most likely to highlight the
fundamental physics of the problem. Figure 13 presents the
power for a selected subset of collectives across the full
range of heights. At the highest collective (θo = 16°) the
power noticeably increases at low heights. At lower
collectives the changes in power are significantly smaller.
This sharp increase in power for the highest collective
suggests that the rotor angles of attack are high enough to
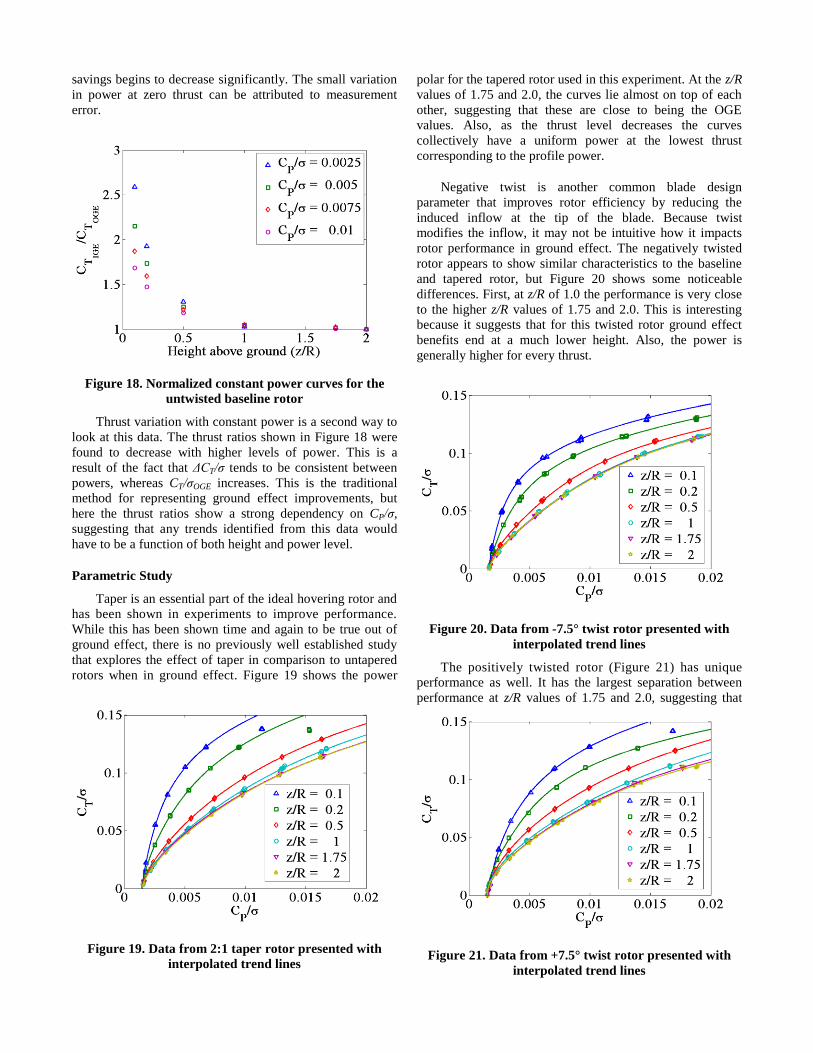
begin showing signs of stall. Figure 14 shows rotor thrust for
these same height and collective points. It is possible to see
how thrust gradually increases at lower z/R values. If thrust
is modeled with Equation (1),
(1)
the relevant ΔCT/σ values for collectives of 4° to 16°are
shown in Figure 15. It is interesting to note that while
Evidence of Stall
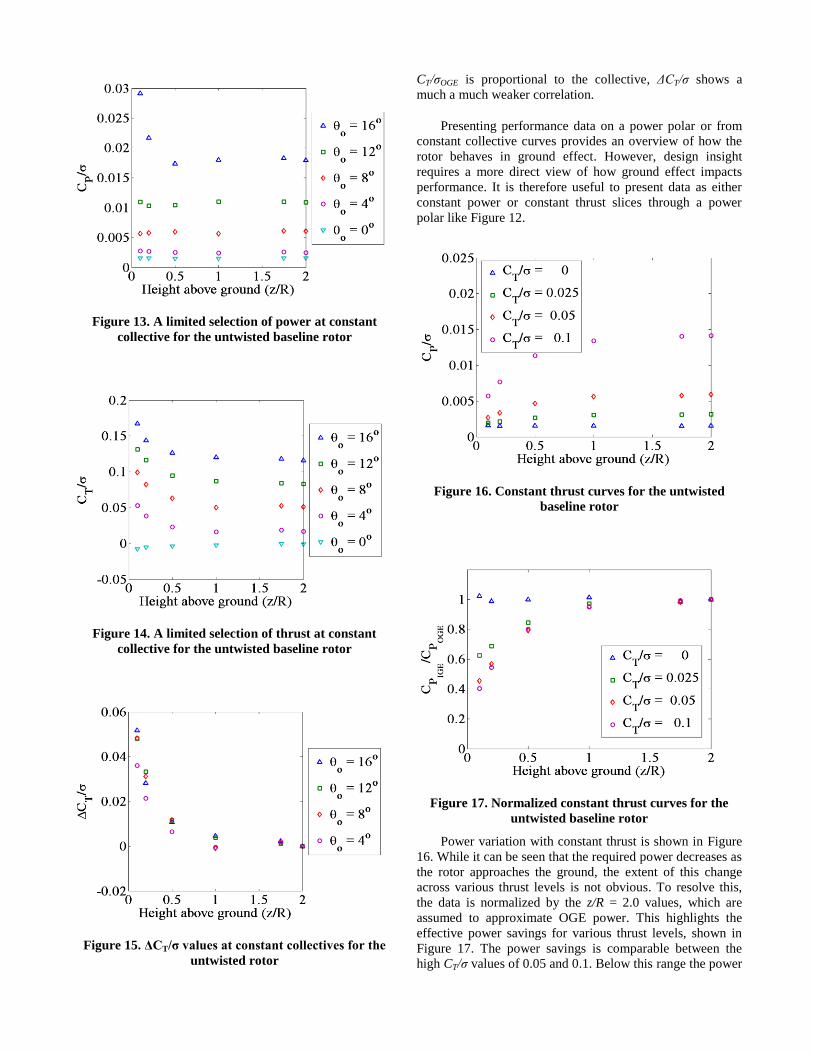
Figure 13. A limited selection of power at constant
collective for the untwisted baseline rotor
Figure 14. A limited selection of thrust at constant
collective for the untwisted baseline rotor
Figure 15. ΔCT/σ values at constant collectives for the
untwisted rotor
CT/σOGE is proportional to the collective, ΔCT/σ shows a
much a much weaker correlation.
Presenting performance data on a power polar or from
constant collective curves provides an overview of how the
rotor behaves in ground effect. However, design insight
requires a more direct view of how ground effect impacts
performance. It is therefore useful to present data as either
constant power or constant thrust slices through a power
polar like Figure 12.
Figure 16. Constant thrust curves for the untwisted
baseline rotor
Figure 17. Normalized constant thrust curves for the
untwisted baseline rotor
Power variation with constant thrust is shown in Figure
16. While it can be seen that the required power decreases as
the rotor approaches the ground, the extent of this change
across various thrust levels is not obvious. To resolve this,
the data is normalized by the z/R = 2.0 values, which are
assumed to approximate OGE power. This highlights the
effective power savings for various thrust levels, shown in
Figure 17. The power savings is comparable between the
high CT/σ values of 0.05 and 0.1. Below this range the power
savings begins to decrease significantly. The small variation
in power at zero thrust can be attributed to measurement
error.
Figure 18. Normalized constant power curves for the
untwisted baseline rotor
Thrust variation with constant power is a second way to
look at this data. The thrust ratios shown in Figure 18 were
found to decrease with higher levels of power. This is a
result of the fact that ΔCT/σ tends to be consistent between
powers, whereas CT/σOGE increases. This is the traditional
method for representing ground effect improvements, but
here the thrust ratios show a strong dependency on CP/σ,
suggesting that any trends identified from this data would
have to be a function of both height and power level.
Parametric Study
Taper is an essential part of the ideal hovering rotor and
has been shown in experiments to improve performance.
While this has been shown time and again to be true out of
ground effect, there is no previously well established study
that explores the effect of taper in comparison to untapered
rotors when in ground effect. Figure 19 shows the power
Figure 19. Data from 2:1 taper rotor presented with
interpolated trend lines
polar for the tapered rotor used in this experiment. At the z/R
values of 1.75 and 2.0, the curves lie almost on top of each
other, suggesting that these are close to being the OGE
values. Also, as the thrust level decreases the curves
collectively have a uniform power at the lowest thrust
corresponding to the profile power.
Negative twist is another common blade design
parameter that improves rotor efficiency by reducing the
induced inflow at the tip of the blade. Because twist
modifies the inflow, it may not be intuitive how it impacts
rotor performance in ground effect. The negatively twisted
rotor appears to show similar characteristics to the baseline
and tapered rotor, but Figure 20 shows some noticeable
differences. First, at z/R of 1.0 the performance is very close
to the higher z/R values of 1.75 and 2.0. This is interesting
because it suggests that for this twisted rotor ground effect
benefits end at a much lower height. Also, the power is
generally higher for every thrust.
Figure 20. Data from -7.5° twist rotor presented with
interpolated trend lines
The positively twisted rotor (Figure 21) has unique
performance as well. It has the largest separation between
performance at z/R values of 1.75 and 2.0, suggesting that
Figure 21. Data from +7.5° twist rotor presented with
interpolated trend lines
the rotor may not yet be all the way out of ground effect at
z/R = 2.0. The curves are spaced farther apart from each
other than the negatively twisted case, indicating that
positive twist has a greater impact from ground effect. The
performance for each height is similar to the other heights up
to a CT/σ of 0.015 suggesting some unknown phenomenon
caused by the positive twist at low thrust and low power.
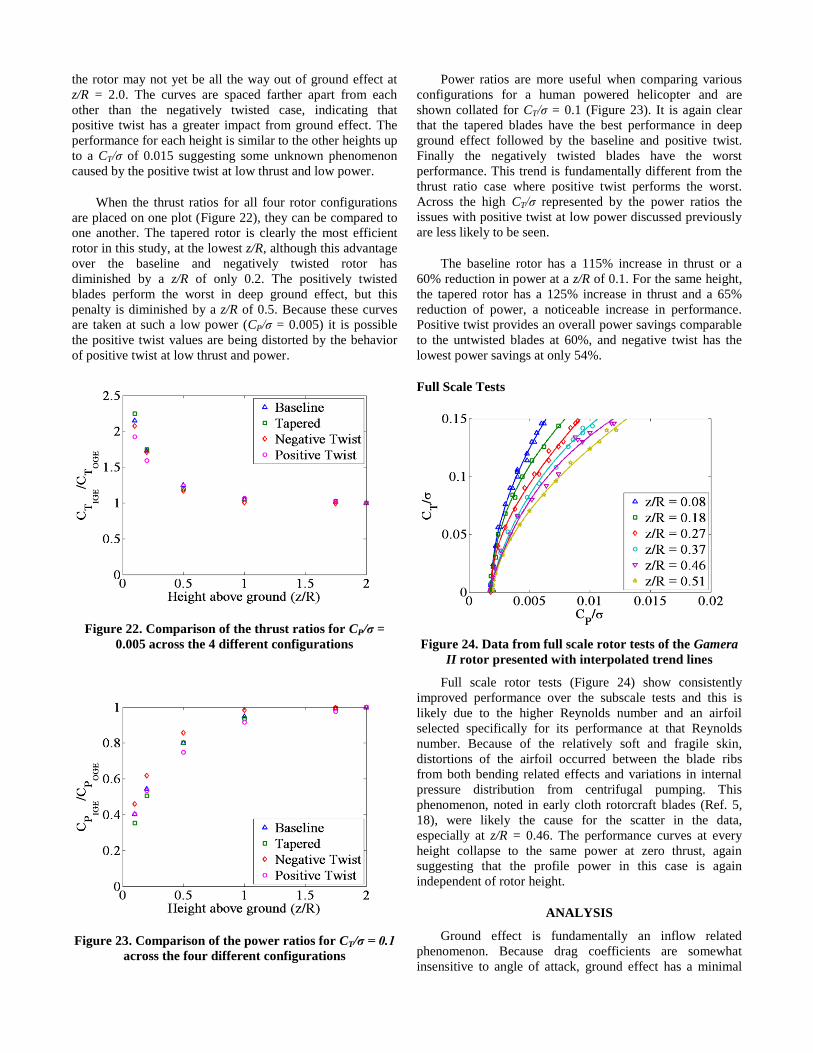
When the thrust ratios for all four rotor configurations
are placed on one plot (Figure 22), they can be compared to
one another. The tapered rotor is clearly the most efficient
rotor in this study, at the lowest z/R, although this advantage
over the baseline and negatively twisted rotor has
diminished by a z/R of only 0.2. The positively twisted
blades perform the worst in deep ground effect, but this
penalty is diminished by a z/R of 0.5. Because these curves
are taken at such a low power (CP/σ = 0.005) it is possible
the positive twist values are being distorted by the behavior
of positive twist at low thrust and power.
Figure 22. Comparison of the thrust ratios for CP/σ =
0.005 across the 4 different configurations
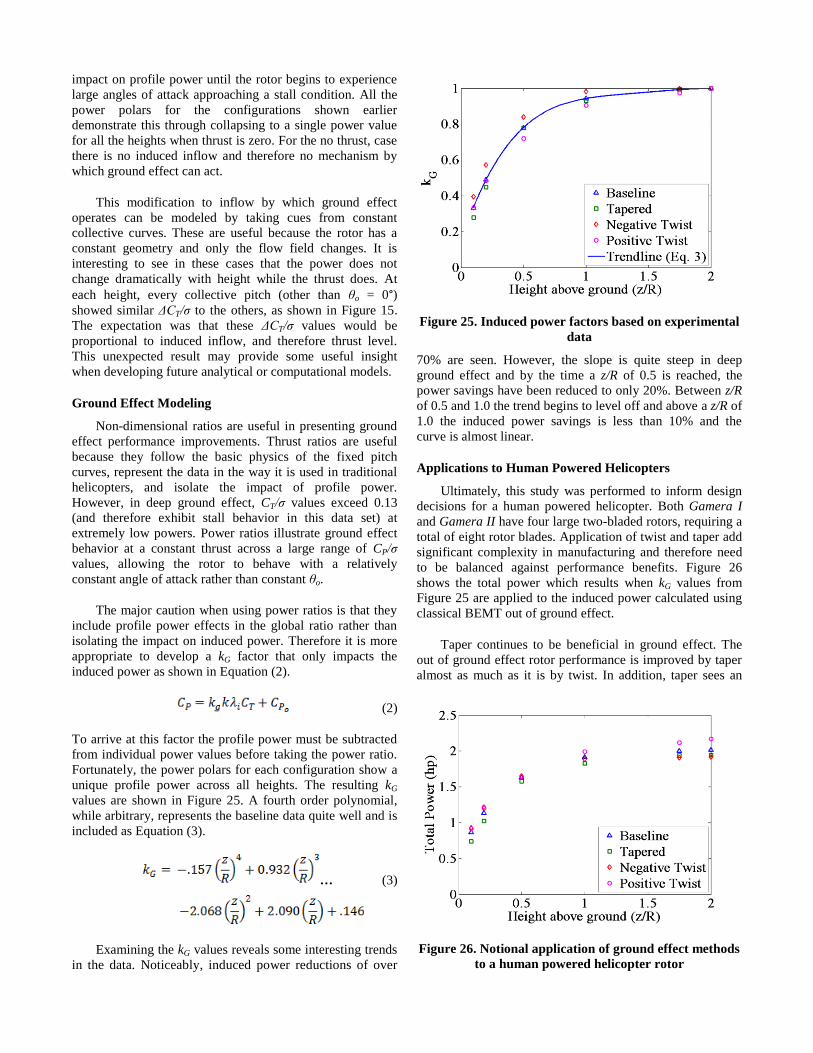
Figure 23. Comparison of the power ratios for CT/σ = 0.1
across the four different configurations
Power ratios are more useful when comparing various
configurations for a human powered helicopter and are
shown collated for CT/σ = 0.1 (Figure 23). It is again clear
that the tapered blades have the best performance in deep
ground effect followed by the baseline and positive twist.
Finally the negatively twisted blades have the worst
performance. This trend is fundamentally different from the
thrust ratio case where positive twist performs the worst.
Across the high CT/σ represented by the power ratios the
issues with positive twist at low power discussed previously
are less likely to be seen.
The baseline rotor has a 115% increase in thrust or a
60% reduction in power at a z/R of 0.1. For the same height,
the tapered rotor has a 125% increase in thrust and a 65%
reduction of power, a noticeable increase in performance.
Positive twist provides an overall power savings comparable
to the untwisted blades at 60%, and negative twist has the
lowest power savings at only 54%.
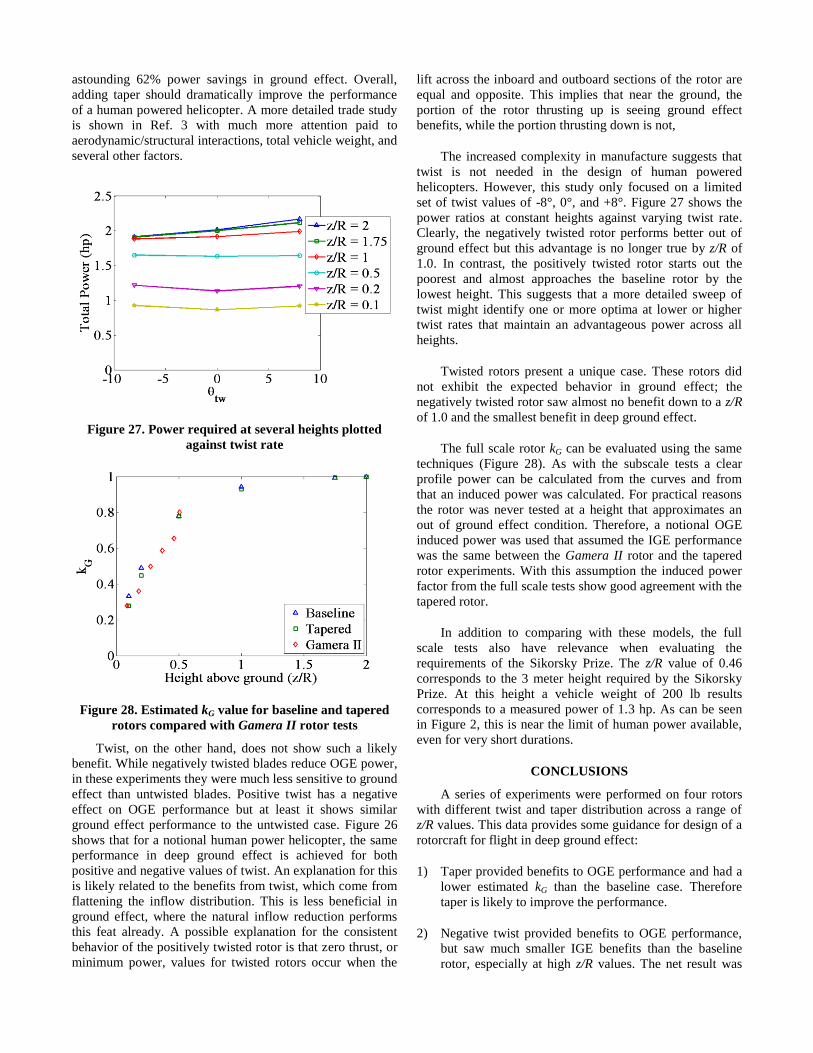
Full Scale Tests
Figure 24. Data from full scale rotor tests of the Gamera
II rotor presented with interpolated trend lines
Full scale rotor tests (Figure 24) show consistently
improved performance over the subscale tests and this is
likely due to the higher Reynolds number and an airfoil
selected specifically for its performance at that Reynolds
number. Because of the relatively soft and fragile skin,
distortions of the airfoil occurred between the blade ribs
from both bending related effects and variations in internal
pressure distribution from centrifugal pumping. This
phenomenon, noted in early cloth rotorcraft blades (Ref. 5,
18), were likely the cause for the scatter in the data,
especially at z/R = 0.46. The performance curves at every
height collapse to the same power at zero thrust, again
suggesting that the profile power in this case is again
independent of rotor height.
ANALYSIS
Ground effect is fundamentally an inflow related
phenomenon. Because drag coefficients are somewhat
insensitive to angle of attack, ground effect has a minimal
impact on profile power until the rotor begins to experience
large angles of attack approaching a stall condition. All the
power polars for the configurations shown earlier
demonstrate this through collapsing to a single power value
for all the heights when thrust is zero. For the no thrust, case
there is no induced inflow and therefore no mechanism by
which ground effect can act.
This modification to inflow by which ground effect
operates can be modeled by taking cues from constant
collective curves. These are useful because the rotor has a
constant geometry and only the flow field changes. It is
interesting to see in these cases that the power does not
change dramatically with height while the thrust does. At
each height, every collective pitch (other than θo = 0°) showed similar ΔCT/σ to the others, as shown in Figure 15.
The expectation was that these ΔCT/σ values would be
proportional to induced inflow, and therefore thrust level.
This unexpected result may provide some useful insight
when developing future analytical or computational models.
Ground Effect Modeling
Non-dimensional ratios are useful in presenting ground
effect performance improvements. Thrust ratios are useful
because they follow the basic physics of the fixed pitch
curves, represent the data in the way it is used in traditional
helicopters, and isolate the impact of profile power.
However, in deep ground effect, CT/σ values exceed 0.13
(and therefore exhibit stall behavior in this data set) at
extremely low powers. Power ratios illustrate ground effect
behavior at a constant thrust across a large range of CP/σ
values, allowing the rotor to behave with a relatively
constant angle of attack rather than constant θo.
The major caution when using power ratios is that they
include profile power effects in the global ratio rather than
isolating the impact on induced power. Therefore it is more
appropriate to develop a kG factor that only impacts the
induced power as shown in Equation (2).
(2)
To arrive at this factor the profile power must be subtracted
from individual power values before taking the power ratio.
Fortunately, the power polars for each configuration show a
unique profile power across all heights. The resulting kG
values are shown in Figure 25. A fourth order polynomial,
while arbitrary, represents the baseline data quite well and is
included as Equation (3).
… (3)
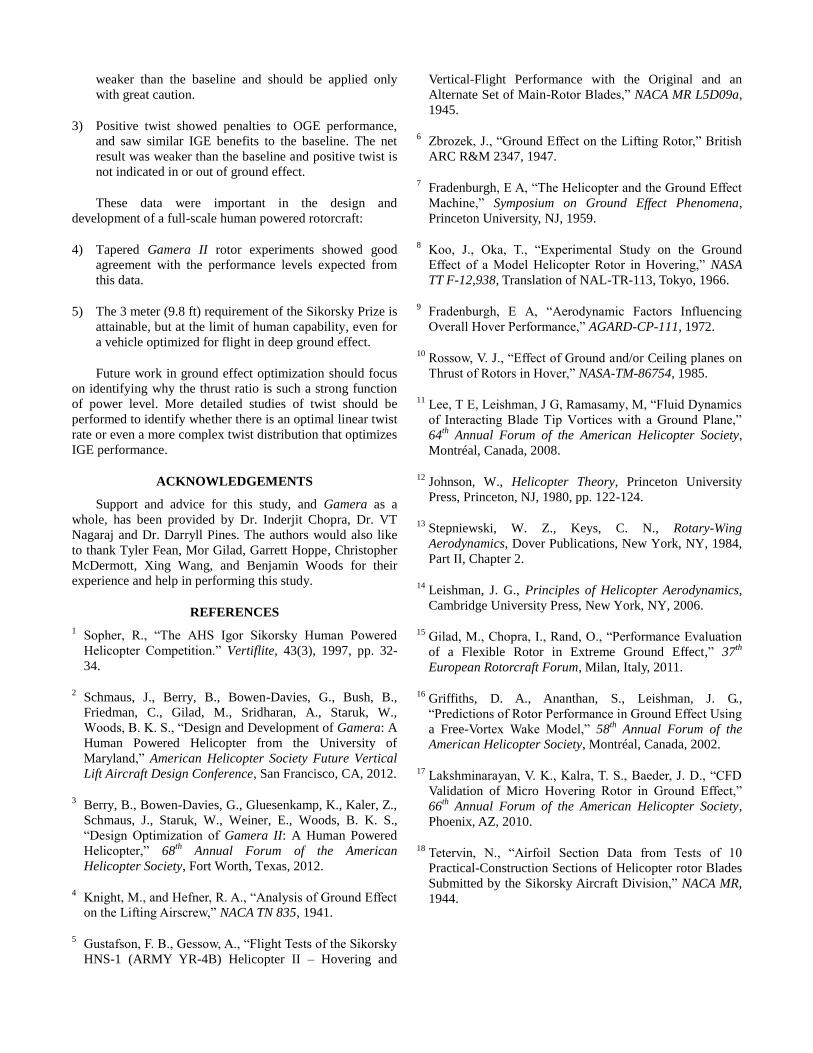
Examining the kG values reveals some interesting trends
in the data. Noticeably, induced power reductions of over
Figure 25. Induced power factors based on experimental
data
70% are seen. However, the slope is quite steep in deep
ground effect and by the time a z/R of 0.5 is reached, the
power savings have been reduced to only 20%. Between z/R
of 0.5 and 1.0 the trend begins to level off and above a z/R of
1.0 the induced power savings is less than 10% and the
curve is almost linear.
Applications to Human Powered Helicopters
Ultimately, this study was performed to inform design
decisions for a human powered helicopter. Both Gamera I
and Gamera II have four large two-bladed rotors, requiring a
total of eight rotor blades. Application of twist and taper add
significant complexity in manufacturing and therefore need
to be balanced against performance benefits. Figure 26
shows the total power which results when kG values from
Figure 25 are applied to the induced power calculated using
classical BEMT out of ground effect.
Taper continues to be beneficial in ground effect. The
out of ground effect rotor performance is improved by taper
almost as much as it is by twist. In addition, taper sees an
Figure 26. Notional application of ground effect methods
to a human powered helicopter rotor
astounding 62% power savings in ground effect. Overall,
adding taper should dramatically improve the performance
of a human powered helicopter. A more detailed trade study
is shown in Ref. 3 with much more attention paid to
aerodynamic/structural interactions, total vehicle weight, and
several other factors.
Figure 27. Power required at several heights plotted
against twist rate
Figure 28. Estimated kG value for baseline and tapered
rotors compared with Gamera II rotor tests
Twist, on the other hand, does not show such a likely
benefit. While negatively twisted blades reduce OGE power,
in these experiments they were much less sensitive to ground
effect than untwisted blades. Positive twist has a negative
effect on OGE performance but at least it shows similar
ground effect performance to the untwisted case. Figure 26
shows that for a notional human power helicopter, the same
performance in deep ground effect is achieved for both
positive and negative values of twist. An explanation for this
is likely related to the benefits from twist, which come from
flattening the inflow distribution. This is less beneficial in
ground effect, where the natural inflow reduction performs
this feat already. A possible explanation for the consistent
behavior of the positively twisted rotor is that zero thrust, or
minimum power, values for twisted rotors occur when the
lift across the inboard and outboard sections of the rotor are
equal and opposite. This implies that near the ground, the
portion of the rotor thrusting up is seeing ground effect
benefits, while the portion thrusting down is not,
The increased complexity in manufacture suggests that
twist is not needed in the design of human powered
helicopters. However, this study only focused on a limited
set of twist values of -8°, 0°, and +8°. Figure 27 shows the
power ratios at constant heights against varying twist rate.
Clearly, the negatively twisted rotor performs better out of
ground effect but this advantage is no longer true by z/R of
1.0. In contrast, the positively twisted rotor starts out the
poorest and almost approaches the baseline rotor by the
lowest height. This suggests that a more detailed sweep of
twist might identify one or more optima at lower or higher
twist rates that maintain an advantageous power across all
heights.
Twisted rotors present a unique case. These rotors did
not exhibit the expected behavior in ground effect; the
negatively twisted rotor saw almost no benefit down to a z/R
of 1.0 and the smallest benefit in deep ground effect.
The full scale rotor kG can be evaluated using the same
techniques (Figure 28). As with the subscale tests a clear
profile power can be calculated from the curves and from
that an induced power was calculated. For practical reasons
the rotor was never tested at a height that approximates an
out of ground effect condition. Therefore, a notional OGE
induced power was used that assumed the IGE performance
was the same between the Gamera II rotor and the tapered
rotor experiments. With this assumption the induced power
factor from the full scale tests show good agreement with the
tapered rotor.
In addition to comparing with these models, the full
scale tests also have relevance when evaluating the
requirements of the Sikorsky Prize. The z/R value of 0.46
corresponds to the 3 meter height required by the Sikorsky
Prize. At this height a vehicle weight of 200 lb results
corresponds to a measured power of 1.3 hp. As can be seen
in Figure 2, this is near the limit of human power available,
even for very short durations.
CONCLUSIONS
A series of experiments were performed on four rotors
with different twist and taper distribution across a range of
z/R values. This data provides some guidance for design of a
rotorcraft for flight in deep ground effect:
1) Taper provided benefits to OGE performance and had a
lower estimated kG than the baseline case. Therefore
taper is likely to improve the performance.
2) Negative twist provided benefits to OGE performance,
but saw much smaller IGE benefits than the baseline
rotor, especially at high z/R values. The net result was
weaker than the baseline and should be applied only
with great caution.
3) Positive twist showed penalties to OGE performance,
and saw similar IGE benefits to the baseline. The net
result was weaker than the baseline and positive twist is
not indicated in or out of ground effect.
These data were important in the design and
development of a full-scale human powered rotorcraft:
4) Tapered Gamera II rotor experiments showed good
agreement with the performance levels expected from
this data.
5) The 3 meter (9.8 ft) requirement of the Sikorsky Prize is
attainable, but at the limit of human capability, even for
a vehicle optimized for flight in deep ground effect.
Future work in ground effect optimization should focus
on identifying why the thrust ratio is such a strong function
of power level. More detailed studies of twist should be
performed to identify whether there is an optimal linear twist
rate or even a more complex twist distribution that optimizes
IGE performance.
ACKNOWLEDGEMENTS
Support and advice for this study, and Gamera as a
whole, has been provided by Dr. Inderjit Chopra, Dr. VT
Nagaraj and Dr. Darryll Pines. The authors would also like
to thank Tyler Fean, Mor Gilad, Garrett Hoppe, Christopher
McDermott, Xing Wang, and Benjamin Woods for their
experience and help in performing this study.
REFERENCES
1 Sopher, R., “The AHS Igor Sikorsky Human Powered
Helicopter Competition.” Vertiflite, 43(3), 1997, pp. 32-
34.
2 Schmaus, J., Berry, B., Bowen-Davies, G., Bush, B.,
Friedman, C., Gilad, M., Sridharan, A., Staruk, W.,
Woods, B. K. S., “Design and Development of Gamera: A
Human Powered Helicopter from the University of
Maryland,” American Helicopter Society Future Vertical
Lift Aircraft Design Conference, San Francisco, CA, 2012.
3 Berry, B., Bowen-Davies, G., Gluesenkamp, K., Kaler, Z.,
Schmaus, J., Staruk, W., Weiner, E., Woods, B. K. S.,
“Design Optimization of Gamera II: A Human Powered
Helicopter,” 68th Annual Forum of the American
Helicopter Society, Fort Worth, Texas, 2012.
4 Knight, M., and Hefner, R. A., “Analysis of Ground Effect
on the Lifting Airscrew,” NACA TN 835, 1941.
5 Gustafson, F. B., Gessow, A., “Flight Tests of the Sikorsky
HNS-1 (ARMY YR-4B) Helicopter II – Hovering and
Vertical-Flight Performance with the Original and an
Alternate Set of Main-Rotor Blades,” NACA MR L5D09a,
1945.
6 Zbrozek, J., “Ground Effect on the Lifting Rotor,” British
ARC R&M 2347, 1947.
7 Fradenburgh, E A, “The Helicopter and the Ground Effect
Machine,” Symposium on Ground Effect Phenomena,
Princeton University, NJ, 1959.
8 Koo, J., Oka, T., “Experimental Study on the Ground
Effect of a Model Helicopter Rotor in Hovering,” NASA
TT F-12,938, Translation of NAL-TR-113, Tokyo, 1966.
9 Fradenburgh, E A, “Aerodynamic Factors Influencing
Overall Hover Performance,” AGARD-CP-111, 1972.
10 Rossow, V. J., “Effect of Ground and/or Ceiling planes on
Thrust of Rotors in Hover,” NASA-TM-86754, 1985.
11 Lee, T E, Leishman, J G, Ramasamy, M, “Fluid Dynamics
of Interacting Blade Tip Vortices with a Ground Plane,”
64th
Annual Forum of the American Helicopter Society,
Montréal, Canada, 2008.
12 Johnson, W., Helicopter Theory, Princeton University
Press, Princeton, NJ, 1980, pp. 122-124.
13 Stepniewski, W. Z., Keys, C. N., Rotary-Wing
Aerodynamics, Dover Publications, New York, NY, 1984,
Part II, Chapter 2.
14 Leishman, J. G., Principles of Helicopter Aerodynamics,
Cambridge University Press, New York, NY, 2006.
15 Gilad, M., Chopra, I., Rand, O., “Performance Evaluation
of a Flexible Rotor in Extreme Ground Effect,” 37th
European Rotorcraft Forum, Milan, Italy, 2011.
16 Griffiths, D. A., Ananthan, S., Leishman, J. G.,
“Predictions of Rotor Performance in Ground Effect Using
a Free-Vortex Wake Model,” 58th
Annual Forum of the
American Helicopter Society, Montréal, Canada, 2002.
17 Lakshminarayan, V. K., Kalra, T. S., Baeder, J. D., “CFD
Validation of Micro Hovering Rotor in Ground Effect,”
66th
Annual Forum of the American Helicopter Society,
Phoenix, AZ, 2010.
18 Tetervin, N., “Airfoil Section Data from Tests of 10
Practical-Construction Sections of Helicopter rotor Blades
Submitted by the Sikorsky Aircraft Division,” NACA MR,
1944.