Embed Size (px)
Citation preview

Experimental study of hybrid precast concrete lattice girder floor at construction
stage
Shane Newella,b and Jamie Gogginsa,c
a Civil Engineering, School of Engineering, National University of Ireland Galway, Ireland
b Department of Building and Civil Engineering, Galway-Mayo Institute of Technology,
Galway, Ireland
c MaREI Centre, Ryan Institute, National University of Ireland Galway, Ireland
Corresponding author: Jamie Goggins ([email protected]), Senior Lecturer, Civil
Engineering, School of Engineering, National University of Ireland Galway, Alice Perry
Engineering Building, Upper Newcastle, Galway, Ireland.
Cite as:
Newell, S., & Goggins, J. (2019). Experimental study of hybrid precast concrete lattice girder floor at construction stage. Structures (Vol. 20, pp. 866‐885). Elsevier.

Experimental study of hybrid precast concrete lattice girder floor at construction
stage
Abstract
As part of an on-going research project on the hybrid precast lattice girder floor system, a series of six
specimens were physically tested in the laboratory to investigate the behaviour of the floor at
construction stage. The purpose of the experimental tests was to improve the understanding of the floor
system at construction stage and examine the key parameters which influence its behaviour at both
serviceability and ultimate limit states. The results suggest that there is scope for further optimisation
of the lattice girder floor system and that the current design methods may be overly conservative.
The lack of comprehensive test data on this floor system limits the development of accurate models
which can predict the behaviour of the floor during construction. In this paper, the development of strain
in the various components of the floor system (lattice girder, concrete plank and reinforcement) are
measured for a range of lattice girder planks. The use of the transformed area method and Eurocode 3
to predict the behaviour of the plank are investigated in this paper. The analytical model developed is
shown to be relatively accurate for predicting the initial stiffness and deflection of planks with tall
girders but is not appropriate for planks with low height girders. Areas requiring further research are
recommended in this paper to allow formulation of a generic model which would predict the behaviour
of the floor system accurately at construction stage.
Keywords: Experimental tests, Precast concrete, Lattice girder slabs, Hybrid concrete,
Construction stage, Structural behaviour

1
1. Introduction
The cost of formwork is a significant component of the total cost of an in-situ concrete frame.
In recent years, contractors have attempted to rationalise construction by implementing offsite
construction methods to minimise the amount of formwork required and reduce the quantity of
reinforcement installed on site. Offsite construction offers many advantages in terms of
efficiencies, quality control, time saving and health and safety. One such method is the use of
hybrid concrete lattice girder slabs as an alternative to in-situ flat slab construction. Lattice
girder precast planks (Figure 1) may be designed and detailed for both one-way and two-way
spanning action.
Hybrid concrete construction (HCC) combines in-situ and precast concrete to utilise the
many advantages of both forms of construction. HCC offers increased prefabrication, faster
construction times, improved quality control and significant cost savings. To maximise the
benefits of HCC, the design and construction decisions in relation to any project must be
finalised at design stage. This will allow precast elements to be manufactured and stored at the
precast factory and delivered ‘just-in-time’ to site. Traditional formwork traditionally accounts
for 40 per cent of in-situ frame costs and is dependent on weather and labour [1]. The use of
HCC means that a percentage of the frame is manufactured in a weather-proof factory, resulting
in faster construction and reduced formwork costs.
1.1 Precast concrete lattice girder floor
One of the most popular forms of hybrid concrete floors is the lattice girder slab system. The
major advantage of this system is that it is an ‘in-situ structure’ (one-way or two-way
spanning); fully continuous and tied together without the need for shuttering on site [1]. The
lattice girder floor system is also known as Omnia slab, Filigree slab or half-finished slab in
the construction industry.
The floor system consists of steel lattice girders which are cast with the precast plank
(typically 50-70mm thick), as shown for example in Figure 1, and an in-situ concrete topping,
which when hardened, forms a composite concrete slab. The lattice girder trusses which
protrude from the precast plank serve a number of functions. The girders (i) provide stiffness
to the precast plank during the construction stage until the in-situ topping has reached sufficient
strength to ensure composite action, (ii) increase composite action between the precast plank
and in-situ topping, (iii) act as a spacer for the top layer of reinforcement in the slab which is
placed on site and (iv) are used as lifting points when unloading the planks on site. The bottom

2
layer of reinforcement is embedded in the precast plank and two-way action between adjacent
planks is created by the use of a ‘stitching bar’ which is laid perpendicular to the joint between
precast planks.
Figure 1 Precast concrete lattice girder plank
The precast planks are manufactured using steel moulds which ensures a high-quality
finish and gives the option to leave exposed soffits, if required. The top surface of the plank is
roughened to ensure bond between the precast plank and in-situ topping (see, for example
Figure 1). The planks can be manufactured up to 3400mm wide and 12000mm long, depending
on transport restrictions to the site. Lattice girder floors require temporary propping until there
is sufficient strength gain in the in-situ topping. The spacing and configuration of propping is
generally dictated by the load/span characteristics, spacing of the lattice girders and the
diameter of the top chord bar in the lattice girder. The height of the lattice girder is based on
the overall thickness of the hybrid concrete slab, as the lattice girder supports the top layer of
reinforcement.
Lattice girders are three-dimensional industrially manufactured elements constructed
using steel reinforcement. The steel used for lattice girders in Europe is typically grade B500A
and they consist of a top chord, two bottom chords and diagonal bars. The diagonal bars are
welded to the top and bottom chord by electric resistance welding. The standard distance

3
between diagonal bars along the top chord is 200mm. The diameter of the bars in the lattice
girders typically range from 5mm to 16mm and height of the girders required for most slabs
will generally be between 100mm and 300mm (Figure 2).
Figure 2 Typical dimensions of lattice girders
At construction stage, the lattice girder plank must be able to support the self-weight of
the plank, construction loading and the weight of the in-situ concrete topping. In addition, the
deflection of the plank during construction must be controlled. The European standard EN
13747 [2] requires mid-span deflection between props or temporary supports to not exceed
10mm for spans up to 4m. Typically, contractors erect temporary propping at specified
maximum centres (determined by lattice girder plank designer) before the lattice girder planks
are erected on site (Figure 3). At midspan (between props and/or supports), the top chord of
the lattice girder must resist the compressive forces and the tensile forces are resisted by a
combination of the reinforcement in the plank, bottom chord of the lattice girder and the
concrete in the plank. At the location of the temporary props, the top chord is subject to tensile
forces and the compression forces are resisted by the concrete in the plank, embedded
reinforcement and the bottom chords of the girders. During design of the lattice girder floors,
four checks for the construction stage must be undertaken: (1) demand does not exceed the
compression buckling resistance of the top chord (bending failure mode), (2) demand does not
exceed the compression buckling resistance of the diagonal (shear failure mode), (3) maximum
permitted deflection is not exceeded and (4) maximum crack width is not exceeded. The
configuration of the lattice girders (spacing and diameter of the reinforcement in the girder
truss) largely determines the behaviour of the plank at construction stage. For most girders, the
top chord compression resistance and deflection are the critical design checks at the

4
construction stage. However, for taller girders (greater than 200mm height), the diagonal
compression resistance can be critical as the length of the diagonal increases.
The behaviour of the lattice girder floor at the construction stage is relatively complex
because of the interaction between the concrete plank and steel lattice girder trusses. Although
some experimental testing has been conducted on the behaviour of precast concrete lattice
girder planks at construction stage [3–7], there is relatively little experimental data available in
the literature on the floor system during construction in view of the popularity of the floor as a
viable and efficient alternative to in-situ flat slab construction. The laboratory testing
programme described in this paper utilised a comprehensive range of sensors to measure the
deformation of the plank and the strain characteristics of all the key parameters (top chord,
diagonals, bottom chord, reinforcement and, concrete) which effect the behaviour of the lattice
girder floor during construction. Without this knowledge in relation to the interaction of the
various components of the floor system, the development of accurate modelling of the lattice
girder plank and potential optimisation is difficult.
Figure 3 Temporary props prior to erection of lattice girder planks

5
2. Experimental set-up
A series of physical tests was undertaken on six precast concrete lattice girder planks in the
heavy structures laboratory in NUI Galway. The planks were manufactured by Oran Pre-Cast
in Galway, Ireland. This experimental study is part of an on-going research project which is
investigating the behaviour of the lattice girder floor system using experimental testing and
embedded sensors [8–13] in real buildings. The concrete plank for all six tests was similar,
except for the type of lattice girders used, which varied in each test. All planks were 3650mm
long, 65mm thick, 550mm wide and were manufactured with two lattice girders at 250mm
centres (Figure 4). Many precast manufacturers require temporary propping at a maximum of
2.4 metres to limit deflection during construction. The span of planks was 3.6m (measured
from centre of bearing) in this experimental study and this was selected so that the possible
optimisation of the spacing of temporary propping could be investigated. It was considered that
manufacturing the planks with two lattice girders would allow the interaction between the
girders to be studied and is more representative of the lattice girder planks used in the industry.
The steel reinforcement in all planks (Grade B500B) was H12 at 100mm spacing in both the
longitudinal and transverse directions and the cover to the reinforcement at the plank soffit was
25mm. The concrete planks were tested between 45-69 days after manufacture.
Figure 4 Configuration of precast lattice girder plank tested

6
The configuration of the lattice girders used in the experimental testing is provided in
Table 1. The convention for identifying girders is the letter designating the type of girder (‘S’
for slab, ‘W’ for wall), the height of the lattice girder in centimetres, the diameter of the top
chord, diameter of the diagonal and diameter of the bottom chord (all expressed in millimetres).
For example, S29-14/07/06 refers to a slab lattice girder plank with a height of 29cm, top chord
diameter of 14mm, diagonal bar diameter of 7mm and a bottom chord diameter of 6mm.
Table 1 Details of test planks
Plank
Reference
Ø Top
Chord
(mm)
Ø Diagonal
(mm)
Ø Bottom
Chord
(mm)
Girder
Height
(mm)
Longitudinal
Reinforcement
Plank
Thickness
(mm)
S29‐14/07/06
2015 14 7 6 290 H10‐100 B2 65
S29‐14/07/06
2018 14 7 6 290 H10‐100 B2 65
S22‐14/07/06
2018 14 7 6 220 H10‐100 B2 65
S10‐14/07/06
2018 14 7 6 100 H10‐100 B2 65
W22.5‐
08/05/05 2018 8 5 5 225 H10‐100 B2 65
W10‐10/06/06
2018 10 6 6 100 H10‐100 B2 65
The lattice girder planks were loaded in four point bending using a 240kN hydraulic
actuator and spreader beam, as shown in Figure 5 and Figure 6. The load was transferred to the
plank from the spreader beams through 2 No. 40 x 5mm square hollow sections (SHS) located
at approximately one-third span to ensure a constant moment within the central third of the
plank. A compressible board was located between the top of the plank (textured profile) and
the SHS to ensure uniform load is applied to the plank during the test. At the end supports, the
precast plank was supported on rollers, where the load was transferred through 50mm wide x
10mm thick steel bearing plates. To create a low friction slip membrane at the bearing of the
precast plank, two sheets of PTFE (Polytetrafluoroethylene) were positioned between the plank
soffit and bearing plates. Initially, a ‘seating load’ of approximately 10% of the expected load

7
followed by a return to zero was applied to the plank. The test was carried out using
displacement control, with a midspan displacement rate of 0.01mm/sec. The test was
terminated when the midspan displacement reached 40mm (> span/100).
Figure 5 Four point bending of precast plank
Figure 6 Experimental test set‐up in laboratory

8
2.1 Instrumentation
Seven LVDTs (Linear variable differential transformers) were used in each test to record the
vertical displacement of the plank at midspan, at the two load points on both sides of the plank
and at one of the supports. In addition, digital image correlation (DIC) was used in one of the
tests to measure the midspan deflection of the plank to investigate the accuracy and feasibility
of using DIC for subsequent load tests in the laboratory.
In order to study the interaction of the various components in the lattice girder plank, a
total of twenty three electrical resistance (ER) strain gauges were bonded to the longitudinal
reinforcement, steel lattice girder and the concrete surface of the precast plank. Five ER gauges
were bonded to one of the internal longitudinal reinforcement bars (3.6m long, H10 at 100mm
centres) prior to manufacture of the precast plank (Figure 7a). The gauges are located at 200mm
from either end of the reinforcement bar and at 800mm centres along the reinforcement bar
(B2 reinforcement layer). One ER strain gauge was bonded to each of the bottom chords of
both lattice girders in each plank at midspan (Figure 7b). The ER gauges embedded in the
concrete were sequentially coated in wax, butyl coating tape and vinyl-mastic (VM) tape prior
to casting of the concrete to protect the gauges from water ingress (Figure 7).
Figure 7 ER strain gauges bonded to (a) longitudinal reinforcement, (b) bottom chord, (c) diagonal, (d) top chord and (e) concrete surface

9
After manufacture of the plank, ER gauges were bonded to the diagonals of the both
lattice girders at the supports, as shown in Figure 7c (8 No. in total). Two ER gauges were
bonded to the top chord of both lattice girders at midspan (Figure 7d). These gauges were
positioned at 180 degrees to each other so that the buckling behaviour of the top chord could
be recorded during the test. Two ER gauges were bonded to the top surface of the precast
concrete plank at midspan to directly measure the strain at the top surface of the concrete plank
(Figure 7e). Data from the sensors were recorded every second during the testing. Two fixed
location webcams and a camcorder were also used to record the deformation of the precast
planks during the testing. The instrumentation used for the experimental testing of the lattice
girder planks are detailed in Figure 8 and Table 2.
Figure 8 Schematic of instrumentation

10
Table 2 Table of Instrumentation (Refer to Figure 8 for drawing showing location of instrumentation)
Instrumentation Reference Location Quantity
LVDT LVDT 1‐7 At one support; at midspan and both load
points on either side of the plank. 7
Surface ER
Gauge
(GL = 60mm)
SUR‐E, SUR‐I
On top surface (SUR) of plank at midspan, at
edge of plank and between the two lattice
girders
2
Diagonal ER
Gauge
(GL = 6mm)
DA1‐I/E, DA2‐I/E
DB1‐I/E, DB2‐I/E
On diagonals (D) on both girders at both
supports (external support = 1, internal
support = 2)
8
Top Chord ER
Gauge
(GL = 6mm)
TCA‐I/E, TCB‐I/E
On top chord (TC) at midspan on both girders.
Two gauges on each top chord at 180°C to
each other.
4
Bottom Chord
ER Gauge
(GL = 6mm)
BCA‐I/E, BCB‐I/E On bottom chords (BC) at midspan on both
girders. 4
Reinft. ER Gauge
(GL = 6mm) B2‐A‐E
On longitudinal reinforcement (B2), 3600mm
long. Gauges positioned at 200mm, 1000mm,
1800mm, 2600mm and 3400mm respectively
from end of bar.
5
Note: GL = Gauge Length; E = external side of girder; I = internal side of girder
2.2 Concrete properties
The tensile resistance of the concrete used to manufacture the concrete plank will determine
the nature of cracking (width, extent) and the stiffness of the plank during construction stage.
When the tensile stresses at the plank soffit exceed the tensile resistance of the concrete, the
concrete will crack and the tensile strains are resisted by the embedded reinforcement and the
bottom chord of the lattice girders. The concrete used to manufacture the precast planks in the
factory is strength class C40/50. A CEM II A-V cement (370kg/m3) and limestone aggregates
are the primary constituents in the concrete mix (Table 3). The precast planks are thermal cured
for approximately 10-12 hours at a minimum temperature of 32°C after manufacture so that
they can be removed from their steel moulds and stored at the precast factory.
Concrete cylinders and cubes were made and tested to measure the compressive
strength (EN 12390-Part 3 [14]) and modulus of elasticity (EN 12390-Part 13 [15]). The

11
cylinders and cubes were cured in water and in air to match the environmental conditions of
the concrete planks that were tested in the laboratory. The mean characteristic compressive
strength based on testing cubes and cylinders (cured in water) at 28 days was 52.3 MPa (fcm),
with a standard deviation () of 1.44 MPa (The compressive strength of the concrete cubes
were multiplied by 0.8 to convert them to an equivalent cylinder compressive strength).
Concrete cylinders which were air cured and stored with the precast planks were tested on the
same day that the planks were tested in the laboratory. The planks were tested between 45 and
69 days after manufacture and the mean cylinder compressive strength was 54.1 MPa ( = 2.17
MPa), which was very favourable when compared with values measured from the concrete
specimens stored in water (high ambient air temperatures at this time might partially explain
the compressive strength of the air cured specimens) . The mean secant modulus of elasticity
of the concrete cylinders cured in water at 28 days was 49.5GPa ( = 1.54 GPa). The measured
values for the compressive strength and modulus of elasticity indicate the importance of using
actual characteristic material properties rather than assumed properties based on the specified
grade of concrete used. In both cases, the measured modulus of elasticity and compressive
strength were significantly greater than those assumed if the properties were based on a C40/50
grade of concrete.
Table 3 Concrete mix design for precast concrete planks (1m3)
C40/50 mix for lattice girder planks, w/c = 0.35, Dmax = 10mm
Cement (II‐A‐V 42.5) Aggregate (8‐14mm) Sand (0‐2mm) Water Plasticiser
(kg) (kg) (kg) (litre) (litre)
370 900 950 130 2.2
2.3 Steel properties
The mechanical properties of the steel reinforcement in the lattice girder will typically govern
the stiffness of the lattice girder plank at construction stage and the failure mode. Depending
on the configuration of the lattice girder plank, the failure mode for the lattice girder plank will
be compression buckling of the top chord or the diagonals in the lattice girder. Samples of the
top chords (12No.) of all lattice girders in the precast planks tested in this project were cut after
the planks were tested and the material properties were evaluated by means of a tensile test
(EN ISO 15630-Part 1 [16]). The samples of top chord were taken close to the support, where
no buckling of the top chord had occurred during the load tests. The reinforcement used to
manufacture the lattice girder is grade B500A (characteristic yield strength = 500 MPa). The

12
mean yield strength of the reinforcement in the top chords tested was 569MPa (minimum =
518 MPa, maximum = 639 MPa, standard deviation = 45.8MPa). The mean modulus of
elasticity of the top chords was 202 GPa ( = 17.4 GPa). The mean ratio of tensile ultimate
strength to yield strength based on the tensile tests undertaken was 1.09.
3. Test results
The results and findings from six laboratory tests are presented in this section. An initial test
(Specimen ID S29-14/07/06 2015) was undertaken in 2015 to assess the experimental set-up
and to investigate the optimum number of sensors required to accurately model the behaviour
of the lattice girder precast plank. The remaining tests were undertaken in 2018. Cracking and
crack propagation in the concrete plank was visually observed during all tests. However, many
cracks were difficult to observe because of the relatively small width of the cracks. At the end
of the test, the cracking pattern on the precast plank soffit was also recorded
3.1 Moment-deflection behaviour
The moment of resistance per girder (two girders in each plank) is plotted against the
average midspan deflection in Figure 9. The moment-deflection behaviour of the planks is
characterised by a linear relationship initially until the onset of micro-cracking of the concrete,
which was visible on the soffit (or at the side originating at the soffit) of the plank. As the
cracks continue to grow and propagate, the stiffness of the lattice girder plank reduces until
peak load/moment is reached. Failure (and peak load) is typically initiated by buckling of the
top chord (bending failure) or buckling of the diagonals (shear failure). Up to peak load, it is
observed that the moment-deflection curve consists of a series of near-linear phases and load
steps which represent a loss of stiffness of the plank caused by either cracking of the concrete,
buckling of top chord or buckling of diagonal. Initial cracking was typically observed adjacent
to one of the load points (Figure 10a) and as the test developed cracking would develop along
the soffit of the plank at a number of locations in the middle third of the plank (constant moment
zone).
In all tests conducted, it is noted in the moment-deflection plots (Figure 9) that the first
significant reduction in stiffness typically occurs at approximately the same midspan deflection
(3.0-4.5mm). When the concrete cracks, load redistribution occurs and the stiffness and
resistance of the plank is reduced suddenly. As the test is displacement control, the actuator
maintains the same displacement rate of loading (0.01mm/sec) but the rate of loading is lower
to take account of the reduced stiffness of the plank.
13
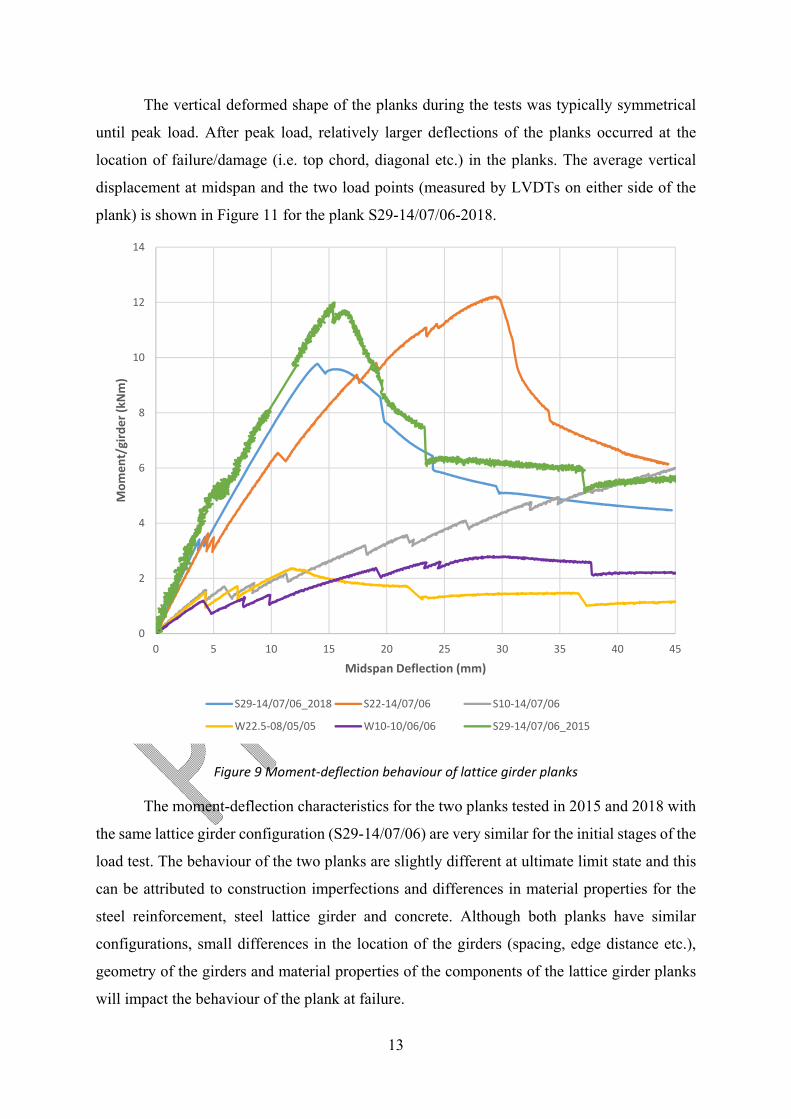
The vertical deformed shape of the planks during the tests was typically symmetrical
until peak load. After peak load, relatively larger deflections of the planks occurred at the
location of failure/damage (i.e. top chord, diagonal etc.) in the planks. The average vertical
displacement at midspan and the two load points (measured by LVDTs on either side of the
plank) is shown in Figure 11 for the plank S29-14/07/06-2018.
Figure 9 Moment‐deflection behaviour of lattice girder planks
The moment-deflection characteristics for the two planks tested in 2015 and 2018 with
the same lattice girder configuration (S29-14/07/06) are very similar for the initial stages of the
load test. The behaviour of the two planks are slightly different at ultimate limit state and this
can be attributed to construction imperfections and differences in material properties for the
steel reinforcement, steel lattice girder and concrete. Although both planks have similar
configurations, small differences in the location of the girders (spacing, edge distance etc.),
geometry of the girders and material properties of the components of the lattice girder planks
will impact the behaviour of the plank at failure.
0
2
4
6
8
10
12
14
0 5 10 15 20 25 30 35 40 45
Moment/girder (kNm)
Midspan Deflection (mm)
S29‐14/07/06_2018 S22‐14/07/06 S10‐14/07/06
W22.5‐08/05/05 W10‐10/06/06 S29‐14/07/06_2015

14
Figure 10 Cracking on concrete plank
Figure 11 Vertical displacement of lattice girder planks at different load levels
3.2 Initial cracking
During the tests, a number of audible cracks were noted in the laboratory during the
load tests and it is believed that these correspond to points at which the stiffness of the planks
are reduced due to cracking of the concrete plank. It is proposed that the first audible crack is
0
2
4
6
8
10
12
14
16
18
0 600 1200 1800 2400 3000 3600
Vertical displacement (m
m)
Distance from support (mm)
0 5 10 15 20 25 30Load (kN)

15
the onset of the first micro-cracks during the load test. Typically, at a later stage during the test
cracking was observed in the concrete plank at the location of the load points. From a
theoretical viewpoint, cracking would be expected to occur on the plank when the tensile strain
capacity of the concrete (ctu) was exceeded during the load test. Some research has shown that
microcracks can form even if 50% of the tensile strength of the concrete is exceeded [17].
Although not explicitly mentioned in Eurocode 2 [18], the tensile strain capacity can be
determined by dividing the mean tensile strength of the concrete (fctm) and the mean elastic
modulus of elasticity of the concrete (Ecm).
ctu = fctm/ Ecm (Eqn. 1)
Based on the testing undertaken on samples made from the concrete used to manufacture the
precast planks, the mean compressive strength (fcm) of the concrete when the planks were tested
was 54.1 MPa ( = 2.17 MPa). The compressive strength was determined using cylinders tested
on the day of the tests and cured in the same environmental conditions as the planks tested
(cylinders and planks were cured side by side until testing). The mean tensile strength and
elastic modulus can be derived using the mean compressive strength (Eqn 3.4 and 3.5 in
Eurocode 2:Pt 1-1) so that an estimate of tensile strain capacity of the concrete plank can be
calculated. Using equation 1, the tensile strain capacity of the concrete was estimated to range
from 88-125 microstrains. The lower and upper value for the tensile strain capacity depends on
whether the measured value for the elastic modulus is used (49.5 GPa, = 1.54 GPa) or the
value derived using the mean compressive strength (34.8 GPa).
An estimation of the tensile strain at the bottom of the plank during the test can be
determined by plotting the measured strains on the top surface of the plank and in the bottom
chord of the girder and extrapolating the strain to the soffit of the plank. Theoretically, for the
initial stages of the load test, the lattice girder plank should be linear elastic and, therefore, the
strain profile from the top of the plank to the bottom of the plank should be linear. The strain
profile for the 65mm thick plank (S22.5-08/05/05 girder) is shown in Figure 12 during the
linear elastic phase of the test. The graph plots the average strain at the top of the plank
(measured by two surface ER gauges bonded to the concrete surface at midspan) and the
average strain in the bottom chords (measured by four ER gauges bonded to the four bottom
chords at midspan) with increasing load. The graph is typical of the strain profile in all the
concrete planks and indicates that the top of the plank is subject to compressive strains and that
the neutral axis for the precast lattice girder plank lies within the concrete section. An estimate
of the tensile strain at the soffit of the plank is found by extrapolating the measured linear strain

16
profile to the bottom of the plank. For this plank, the first reduction in stiffness and audible
crack was noted at an applied loading of 4.98kN and Figure 12 shows the change in strain
profile in the concrete plank up to the point immediately before the first change in stiffness.
Figure 12 Measured strain profile in concrete plank (S22.5_08/05/05)
By reviewing the video and measured data, it was found that the first audible crack in
the tests occurred at approximately the load which equates to the tensile strain at the plank
soffit to be in the range of 37-102 microstrains. Therefore, this suggests that the first reduction
in stiffness in the plank due to microcracking on the plank soffit occurs when the tensile strain
in the bottom of the plank exceeds 50% of the tensile strain capacity of the concrete in the
lattice girder plank. This concept has the potential for designers to offer a conservative
predictor for first reduction in stiffness of the plank and the likelihood of microcracking on the
plank soffit during construction.
3.3 Initial Stiffness
In order to accurately predict the behaviour of the lattice girder plank during construction stage,
the initial stiffness (EI) of the plank must be known. Prior to the onset of micro cracking in the
concrete plank, there is a linear relationship between load and midspan deflection which can
be measured (Figure 9) to determine the initial stiffness of the lattice girder plank. The lattice
girder plank is a hybrid system and, therefore, its initial stiffness is due to the composite action
0
5
10
15
20
25
30
35
40
45
50
55
60
65
‐80 ‐70 ‐60 ‐50 ‐40 ‐30 ‐20 ‐10 0 10 20 30 40 50 60 70 80
Height from plank soffit (mm)
Microstrains
0 kN 2 kN 3 kN 4 kN 5 kN
‐ : Comp+ : Tens
Neutral Axis
Load (kN)
17
between the lattice girders, concrete and steel reinforcement. When significant cracking in the
concrete plank occurs, the composite action ceases and the stiffness of the floor system is
primarily provided by the lattice girder and the reinforcement.
An analytical model of the lattice girder plank may be developed using the transformed
section method such that the steel components in the girder and steel reinforcement are
transformed to the equivalent concrete section. The modular ratio (ratio of the modulus of
elasticity of the steel (202 GPa) to the modulus of elasticity of the concrete (49.5 GPa)) used
is based on the material testing undertaken on the concrete and steel in the girder. The top
chord, diagonals, bottom chord and longitudinal reinforcement are transformed to the
equivalent concrete section. The stiffness provided by the diagonals will vary along the length
of the plank as the diagonals are inclined with respect to the neutral axis of the lattice girder
plank. An average stiffness provided by the diagonals at mid-height of the lattice girder is used
in the analytical model (elliptical cross-section for diagonal is used). This allows the stiffness
of the lattice girder plank to be determined using conventional beam theory. The comparison
of measured initial stiffness in the plank (from testing) and the predicted initial stiffness using
the analytical model (transformed section) are shown in Table 4. In addition, secondary
stiffness of the plank after the initial formation of first cracking measured during the test is
compared with the analytical model by omitting the stiffness of the concrete plank in the model.
This is a conservative estimate and a measure of the lower bound of the secondary stiffness, as
the concrete will still have some tensile and compressive strength after initial crack formation.
It is expected that there will be some discrepancy between the measured and predicted stiffness
as the analytical model is sensitive to the material properties and does not take account of
shrinkage, creep or tension stiffening when cracking starts. For planks with tall girders (greater
than 200mm), the analytical model calculated the initial stiffness and consequently the elastic
deflection of the lattice girder planks to an accuracy of between +2 and +53%. Although, the
scope of this study is limited to comparison with five types of lattice girders, the analytical
model has the potential to be used as a tool for predicting the initial stiffness and elastic
deflection of tall lattice girder planks at construction stage. It should be noted that the Concrete
Society [19] estimated that even the most sophisticated analysis can only estimate deflection
with an error of between +15% and -30% because of the number of factors which cannot be
accurately assessed. Similarly for the tall girders, the analytical model predicts the secondary
stiffness after the onset of initial cracking with an accuracy of +26% to -26%. It is expected
that the accuracy of the analytical model for the secondary stiffness would be a lower bound,
as it does not take account of the degree of cracking, tension stiffening and residual stiffness

18
of the concrete plank after the first cracks form. As the analytical model after initial cracking
ignores the stiffness of concrete plank, the predicted stiffness is more representative of the
lattice girder plank when the concrete has fully cracked and behaviour is governed by the
stiffness of the steel lattice girder and the longitudinal reinforcement.
Table 4 Stiffness of lattice girder planks
Plank
Reference
Girder
Height
(mm)
Measured
Initial
Stiffness
Kim
(kN/mm)
Predicted
Initial
Stiffness
Kip
(kN/mm)
Ratio
of
Measured
Secondary
Stiffness
K2m
(kN/mm)
Predicted
Secondary
Stiffness
K2p
(kN/mm)
Ratio
of
Estimated
contribution
of plank to
overall
stiffness (%)
S29‐
14/07/06
2015
290 1.53 2.35 1.54 1.33 1.49 1.12 15%
S29‐
14/07/06
2018
290 1.54 2.35 1.53 1.18 1.49 1.26 15%
S22‐
14/07/06
2018
220 1.35 1.37 1.02 1.06 0.79 0.74 20%
S10‐
14/07/06
2018
100 0.62 0.42 0.67 0.52 0.13 0.25 50%
W22.5‐
08/05/05
2018
225 0.59 0.69 1.18 0.46 0.39 0.85 31%
W10‐
10/06/06
2018
100 0.50 0.32 0.65 0.33 0.09 0.26 62%
However, for the two planks with low height girders (100mm) that were tested, the
analytical model underestimates the initial stiffness by approximately -34% and the secondary
stiffness by approximately by -74%. It is proposed that accuracy of the analytical model for
planks with small height girders is diminished because the contribution of the concrete plank

19
to the stiffness of the composite plank is more significant for planks with small height girders.
For the two planks with 100mm high girders, the contribution of the concrete to the overall
stiffness of the lattice girder plank is 50% (S10-14/07/06) and 62% (W10-10/06/06)
respectively. This contrasts with the three tall lattice girders tested in which the average
contribution of the concrete to the overall stiffness of the lattice girder plank is 22%. This
suggests that the analytical model is less accurate at modelling the bending behaviour of the
concrete plank because of the various properties which are not included in the model such as
creep, shrinkage and tension stiffening. In particular, accurate determination of the material
properties is critical to the accuracy of the analytical model. Because the model is based on the
transformed section method, the modular ratio (ratio of modulus of elasticity of steel and
concrete) is a very important factor with respect to the predicted stiffness. Another possible
reason for the discrepancies between the analytical model and measured stiffness is that the
concrete plank may be considered a wide slender flange, so the assumption of plane cross-
sections remaining planar during bending for beam theory may not be applicable. The low
height girders are typically used for the production of twin-wall precast wall panels.
3.4 Deflection at construction stage
The cost of temporary propping lattice girder planks during the construction phase is a
significant element for the contractor (€20-50/m2; based on information supplied by precast
manufacturer in Ireland). The higher figure would apply to projects with very high floor to
ceiling heights and, hence, the requirement for longer props. The props must be left in place
until the concrete in the in-situ topping reaches a specified compressive strength and the hybrid
concrete slab can support its own self-weight and construction loading. The spacing of the
props is dictated by limiting the deflection of the planks during to construction. Typically,
lattice girder planks are manufactured in lengths such that they are continuous over at least one
line of temporary props (i.e. multi-span behaviour). The European standard for precast concrete
floor products, EN 13747 [2], states that the midspan deflection of precast floors during
construction should not exceed 10mm for spans up to 4m. EN 13747 recommends that a
uniformly distributed load of 1kN/m2 should be used for temporary loads (variable) during
construction. EN 1991-1-6 [21] covers actions during construction and provides guidance in
relation to construction loads for various types of construction activities and equipment and
also for construction loads during casting of concrete. It recommends a uniformly distributed
load of 1kN/m2 for construction personnel and hand tools. For casting of concrete, it
recommends a minimum uniformly distributed load of 0.75kN/m2 with an additional of 10%

20
of the slab self-weight or 0.75kN/m2 whichever is greater, over a 3m x 3m working area.
Typically in Ireland and the UK, a uniformly distributed of 1.5kN/m2 is allowed for
construction loads and this figure is based on previous Irish and British codes of practice which
were superseded with the introduction of the Eurocodes in 2010.
Many designers when checking the behaviour of the lattice girder plank at construction
assume the plank is single span, ignore the stiffness of the concrete plank and assume the plank
is simply supported between supports and/or props. This implies that there is potential for
optimisation of the propping system if the behaviour of the floor at construction stage and the
critical design parameters are better understood. Using the initial stiffness determined from the
load tests, it is possible to determine the maximum span of the lattice girder plank (single span)
during construction supporting the self-weight of the in-situ topping and a construction load of
1.5kN/m2. In Table 5, the maximum span and corresponding midspan deflection for each of
the planks tested is determined based on the plank resisting an applied moment equivalent to
bending moment at which the first cracking of the plank (Mcrack) was recorded in the plank
during the load test (i.e. first reduction in plank stiffness). In addition, the deflection of the
plank for various propping arrangements can also be investigated. The predicted deflection of
the plank for the single span arrangement of 2.4m (common spacing of temporary prop
systems) and double span arrangement of 3.6m (7.2m long plank) is also provided in Table 5
to illustrate the application of the test data to generate useful design data for the floor system
(predict deflection for various propping arrangements). The applied loading in all cases is the
self-weight of the in-situ topping and the construction load (1.5kN/m2). It is noted in Table 5
where the cracking moment (Mcrack) is exceeded and the expected deflection would therefore
be larger than the figure quoted in the table as the lattice girder plank would have reduced
stiffness after cracking occurs. The importance of the diameter of the top chord to control
deflection at construction is highlighted by the fact that the two planks with similar heights
(100mm and 220/225mm) have significantly different deflection characteristics.

21
Table 5 Deflection characteristics of lattice girder planks during construction
Plank Reference
Girder Height (mm)
Top chord
diameter (mm)
Max Span1 (single span) (m)
Midspan deflection at Max Span1
(mm)
(a) Midspan deflection when
propping at L = 2.4m
(single span)2 (mm)
(b) Midspan deflection when
propping at L =3.6m
(double span)2
(mm)
S29‐
14/07/06
2018
290 14 3.17 2.05 1.55 0.97
S22‐
14/07/06
2018
220 14 3.61 2.19 1.46 0.91
S10‐
14/07/06
2018
100 14 2.99 4.99 4.00 2.49
W22.5‐
08/05/05
2018
225 8 2.30 6.48 6.773 4.223
W10‐
10/06/06
2018
100 10 2.60 5.38 4.96 3.093

22
The most critical parameter for controlling the deflection of the plank is the diameter
of the top chord. The deflection characteristics of planks S22-14/07/06 and W22.5-08/05/05,
whose girders are approximately the same height are significantly different because the cross
sectional area of the former is approximately three times greater than the latter (i.e. 14mm and
8mm diameter bars in the top chords, respectively). For the two propping arrangements
examined (single span, L = 2.4m; double span, L = 2 x 3.6m), the midpsan deflection of the
plank W22.5-08/05/05 is approximately 4.5 times the deflection of the plank S22-14/07/06.
The difference in the deflection characteristics of the two planks with girders which are 10cm
high (i.e. planks S10-14/07/06 and W10-10/06/06) were not as sizeable because the top chords
are 14mm and 10mm, respectively. However, as expected, the deflection of the plank with the
14mm top chords is approximately 20% less than the planks with 10mm top chords for the two
propping arrangements examined.
3.5 Strain distribution
The development of strain in the top chords was broadly similar for all planks tested. Increasing
compressive strains (negative) were recorded during the load test. The two strain gauges
bonded on each top chord (girder A and B in each plank, refer to Figure 8) allowed buckling
behaviour of the top chord to be measured. The measured strains in the top chords for the plank
S29-14/07/06-2018 are shown in Figure 13a and the buckling of the top chord in girder A is
clearly observed at peak load (approximately 32kN) causing excessive tensile strains on one
side of the top chord and excessive compressive strains on the other side of the top chord. In
contrast, no buckling was observed in the top chord for S10-14/07/06-2018 (Figure 14a) when
the midspan deflection was 50mm.
Strain gauges were bonded to each of the diagonals at the supports and in all tests the
intersection of first diagonal of the girder and bottom chord of the girder was located over the
support (50mm wide). The measured strains from the diagonals in the tests are not consistent,
which suggests that imperfections in the diagonals may influence the induced strains in the
diagonals during the load tests. In an idealised lattice girder plank, it would be expected that
the diagonals would be subjected to increasing compressive strains as the load increases.
However in some tests, the measured strains between diagonals at opposite supports and at the
same support are inconsistent. The measured strains up to peak load for the diagonals at each
support for one girder in plank S29-14/07/06 are shown in Figure 13b. Initially, increasing
compressive strains (negative) are recorded but at approximately 25kN load, tensile strains are
recorded in the diagonals up to peak load. This may indicate that buckling of the top chord of

23
girder A commences at this point and induces tensile strains in the diagonals as the top chord
buckles laterally in response to the increasing load. To contrast, the measured strains up to peak
load for the diagonals at each support for one girder in plank S10-14/07/06 are shown in Figure
14b. At both supports, one diagonal experiences tensile strains (positive) and one support
experiences compressive strains (negative). There is no change in the nature of the induced
strains during the load test and this is primarily due to the fact that buckling of the top chord
had not commenced at the end of the test. Similar findings were reported by Lofgren [4] in
which he conducted load tests on two similar lattice girder planks and measured inconsistent
strains in the diagonals similar to the findings as reported herein.
It is also noted that the strains in the diagonals suggest that the load transfer in the lattice
girder is not shared equally between the diagonals and this may be due to imperfections and
also the geometric layout of the diagonals (angle of inclination with respect to the horizontal
and vertical axis, distance from the support, distance from edge of plank). During the
manufacture of lattice girder planks, it is not uncommon because of tolerances and
manufacturing practices that the girder may not be perfectly symmetrical and, therefore, this
can result in non-symmetrical load transfer within the girder.
The measured strains on the top surface of the concrete planks tested were generally
consistent and there was little difference between strains from the two ER gauges bonded to
the concrete surface in the middle of the plank and at the edge of the plank. This suggests that
the transverse strains on the concrete surface are relatively uniform. The strains on the surface
of the plank are compressive which confirms that the neutral axis of the lattice girder plank lies
within the depth of the concrete plank. The surface strains measured by the two ER gauges on
the top surface of planks S29-14/07/06 and S10-14/07/06 are shown in Figure 13c and Figure
14c, respectively. The reduction in load at the onset of micro-cracking indicating the reduced
stiffness of the plank after the onset of cracking of the plank soffit is clearly observed.
The measured strains in the bottom chords of the girders were generally consistent for
all tests conducted and had two distinct phases. Initially, up to the onset of the first cracking in
the concrete plank, increasing compressive strains are recorded. At first, this may appear
surprising but it confirms the strain profile plotted in Figure 12 which shows that the neutral
axis for the uncracked lattice girder plank lies below the bottom chords of the girder. Hence,
in the uncracked state, approximately the top half of the plank (65mm overall thickness) is in
compression. The bottom chords are positioned in the top portion of the plank as the girders sit
on the transverse reinforcement (H12 bars at 100mm centres) which are located 25mm above
the plank soffit to comply with cover requirements. This first phase of increasing compressive

24
strains may be clearly identified in Figure 13d, which plots the measured strains in the four
bottom chords of the two girders in plank S29-14-07-06 up to peak load. The significant tensile
change in strain at approximately 11kN measured in the bottom chords indicates the point at
which the concrete plank cracks initially. After cracking of the concrete, the bottom chords in
combination with the longitudinal reinforcement in the plank must resist the tensile stresses
and this is clearly observed by the increasing tensile strains up to peak load.
The five ER gauges bonded to one of the longitudinal reinforcement bars (B2 layer,
H10 reinforcement at 100mm centres, 3.6m long) embedded in the concrete are at 0.8m centres
and, therefore, allow the development of strain along the plank to be measured. The measured
strains in the instrumented longitudinal reinforcement in plank S29-14/07/06 and S10-14/07/06
are shown in Figure 15. The ER gauges on the reinforcement bar are labelled in sequence A-E
(‘A’ is located 200m from end of the bar, ‘C’ is in the middle of the bar). Similar to the
measured strains at midspan in the bottom chords, the measured strain in the longitudinal
reinforcement has two distinct phases. This is expected as both the longitudinal reinforcement
and bottom chord are positioned on top of the transverse reinforcement during the manufacture
of the lattice girder plank. As described previously, with reference to the strains in the bottom
chord, the measured strains in the longitudinal reinforcement were compressive up to the onset
of the cracking of the concrete plank. After cracking of the concrete plank, the longitudinal
reinforcement is subject to increasing tensile strains up to peak load.
The magnitude of the measured strains in the ER gauges located 200mm from the end
of the 3.6m bar (Gauges A and E) at either end is typically small, as they are close to the
supports where the bending stresses are relatively small. The three central ER gauges (Gauges
B, C and D) are located at approximately midspan and adjacent to the load points on the support
side of the plank. The measured strains along the longitudinal reinforcement at the approximate
locations of the load points (Gauge ‘B’ and ‘D’) show slight differences which indicates that
after cracking of the plank commences, the strain distributions along the reinforcement are not
symmetrical. This is confirmed by observing the crack formation during the tests as typically
cracking is initiated at one of the points and increased crack widths and deflection is noted in
the vicinity of the load points.

25
Note: Refer to Figure 8 and Table 2 for nomenclature used for instrumentation.
Figure 13 Measured strains of specimen S29‐14/07/06‐2018
0
5
10
15
20
25
30
35
‐10000 ‐5000 0 5000 10000
Load
(kN
)
Strain (microstrains)
TCA‐E TCA‐I TCB‐E TCB‐I
0
5
10
15
20
25
30
35
‐250 ‐200 ‐150 ‐100 ‐50 0 50Load
(kN
)Strain (microstrains)
DA1‐E DA1‐I DA2‐E DA2‐I
0
5
10
15
20
25
30
35
‐60 ‐40 ‐20 0 20
Load
(kN
)
Strain (microstrains)
SUR‐I SUR‐E
0
5
10
15
20
25
30
35
‐15 ‐5 5 15 25
Load
(kN
)
Strain (microstrains)
BCA‐E BCA‐I BCB‐E BCB‐I
(a) Top chord (b) Diagonal
(c) Top surface of concrete (d) Bottom chord
‐ : Comp + : Tens

26
Note: Refer to Figure 8 and Table 2 for nomenclature used for instrumentation.
Figure 14 Measured strains of specimen S10‐14/07/06‐2018
0
2
4
6
8
10
12
‐1200 ‐600 0
Load
(kN
)
Strain (microstrains)
TCA‐E TCA‐I TCB‐E TCB‐I
0
2
4
6
8
10
12
‐40 ‐20 0 20Load
(kN
)Strain (microstrains)
DB1‐E DB1‐I DB2‐E DB2‐I
0
2
4
6
8
10
12
‐800 ‐600 ‐400 ‐200 0
Load
(kN
)
Strain (microstrains)
SUR‐I SUR‐E
0
2
4
6
8
10
12
‐100 100 300
Load
(kN
)
Strain (microstrains)
BCA‐E BCA‐I BCB‐E BCB‐I
(a) Top chord (b) Diagonal
(c) Top surface of concrete (d) Bottom chord
‐ : Comp + : Tens

27
Figure 15 Strains in longitudinal reinforcement of concrete planks (a) S29‐14/07/06 and (b) S10‐14/07/06
The strain profile for the longitudinal reinforcement during the load for plank S10-
14/07/06 is shown in Figure 16. Figure 16a plots the measured strains along the longitudinal
reinforcement when the concrete plank is uncracked. Up to the first crack (load less than 6kN),
the lattice girder plank is linear elastic and the recorded strains along the longitudinal bar are
compressive as the bar is located above the neutral axis and broadly symmetrical. When
cracking occurs, the longitudinal reinforcement must resist the tensile stresses in the plank and
restrain the extent and width of cracking in the concrete. The strain reversal from compressive
to tensile strains after cracking is shown in Figure 16b, which shows the increasing tensile
strains along the reinforcement. The location of the large tensile strains adjacent to one of the
load points (~2600mm from internal support, 1000mm from external support) indicates that
the cracking in the concrete plank is most extensive at this location. Also, it is noticeable that
the order of magnitude of the tensile strains in the reinforcement after cracking are significantly
greater than the compressive strains in the reinforcement prior to cracking. The observed
cracking of the soffit of plank during the load test confirms that the extent and width of cracks
were greatest adjacent to the load point closest to the external load point. The crack pattern on
the plank soffit adjacent to the external load point after the load test is shown in Figure 17. The
0
5
10
15
20
25
30
35
‐200 0 200 400 600
Load
(kN
)
Strain (microstrains)
B2‐A B2‐B B2‐C B2‐D B2‐E
0
5
10
15
20
25
‐500 0 500 1000
Load
(kN
)Strain (microstrains)
B2‐A B2‐B B2‐C B2‐D B2‐E
‐ : Comp + : Tens
(a) S29‐14/07/06 (b) S10‐14/07/06

28
cracks generally run in the transverse direction along the plank soffit and the crack widths were
greatest in the region adjacent to the external load point.
The main findings from analysis of the strain data from the ER gauges in the various
load tests are:
Top chord – Increasing compressive strains until buckling occurs.
Diagonals – Inconsistent strain data which suggests that manufacturing imperfections
and geometric layout of the girders can influence the load transfer mechanism in the
lattice girders.
Top surface of concrete plank – Increasing compressive strains.
Bottom chord – Increasing compressive strains whilst plank is linear elastic. After
cracking of concrete plank, increasing tensile strains.
Longitudinal reinforcement – Increasing compressive strains whilst plank is linear
elastic. After cracking of concrete plank, increasing tensile strains.
The average strains in the top chord (4No.), top surface of concrete plank (2No.) and
the bottom chords (4No.) for plank S29-14/07/06 and S10-14/07/06 are shown in Figure 18.
Similar to strain profile generated for the concrete plank in Figure 12, the measured strains can
be used to analyse the strain distribution through the overall section of the lattice girder plank.
When the concrete is uncracked, the lattice girder plank is linear elastic. After the initiation of
cracking of the concrete plank due to the tensile stresses, the stiffness of lattice girder plank
reduces and the majority of the stiffness is provided by the lattice girder and the tensile
reinforcement in the concrete plank. The measured strains illustrate the increasing tensile
strains in the bottom chords and increasing compressive strains in the top chord as the load
increases. The strain profile for the S10-14/07/06 plank (Figure 18b) clearly shows the linear
elastic phase of the load test (up to ~5kN load) and the non-elastic phase after cracking of the
concrete is initiated.

29
Figure 16 Strains profile along longitudinal reinforcement of plank (S10‐14/07/06)
Figure 17 Crack pattern on plank soffit (S10‐14/07/06)
‐40
‐35
‐30
‐25
‐20
‐15
‐10
‐5
0
0 600 1200 1800 2400 3000 3600
Microstrains
Distance from internal support (mm)
0 2 4 5LOAD (kN)
‐50
50
150
250
350
450
550
650
750
0 600 1200 1800 2400 3000 3600
Microstrains
Distance from internal support (mm)
0 2 4 5
6 8 10 15
LOAD (kN)
(a) Uncracked plank (b) Cracked plank
‐ : Comp + : Tens

30
Figure 18 Strain profile for lattice girder plank
3.6 Ultimate limit state
Failure of the lattice girder planks is typically due to buckling of the top chord or diagonals in
compression. Buckling of the diagonals is only critical for tall lattice girders (i.e. deep concrete
slabs) in which the buckling length of the diagonals can be critical. In all cases, the deflection
of the plank at failure (peak load) exceeded 10mm, which means that the serviceability limit
state of deflection and cracking of concrete were the critical design checks rather than the
ultimate limit state. In tests conducted for this study, three failure modes were observed (Figure
19); buckling of the diagonal (1No.), buckling of the top chord between diagonals (3No.) and
lateral buckling of the top chord with lateral deformation (2No.). A summary of the failure
modes and peak loads for the tests conducted is shown in Table 6. When failure was due to
buckling of the diagonals, initial buckling occurred in diagonals close to the support and as the
load increased, buckling of other diagonals followed. When the failure mode was buckling of
the top chord, initial buckling was observed close to the load point at one-third span which is
the location of combined maximum moment and maximum shear acting on the plank.
0
50
100
150
200
250
300
350
400
‐1200 ‐800 ‐400 0 400
Height from plank soffit (mm)
Microstrains0 510 1520 25
0
25
50
75
100
125
150
175
‐1200 ‐800 ‐400 0 400
Height from plank soffit (mm)
Microstrains0 2 4 5
6 8 10
LOAD (kN)
LOAD (kN)
(a) S29‐14/07/06 (b) S10‐14/07/06
‐ : Comp + : Tens

31
Figure 19 Failure mode of planks
Although the test data is limited to six tests, the buckling failure mode of the top chord
with tall girders (greater than 200mm) is more likely due to lateral buckling of the entire top
chord rather than localised buckling between the diagonals. In contrast, buckling of the top
chord with shallow girders is due to buckling of the top chord between the diagonals. As the
length of diagonals increases for tall girders, the lateral restraint provided by the diagonals to
the top chord is reduced and consequently lateral buckling of the top chord is more likely than
buckling between the top chords. This suggests the buckling resistance of the top chord for tall
girders is a function of the lateral restraint provided by the diagonals in addition to the diameter
of the top chord. The other interesting observation from the tests conducted was the different
failure mode for the same plank (S29-14/07/06) tested in 2015 and 2018. Although the initial
stiffness of both planks were very broadly similar (1.53kN/mm and 1.54kN/mm), the plank
tested in 2015 failed due to buckling of the diagonals and the plank in 2018 failed due to the
buckling of the top chord. There are several factors which could explain the different failure of
two planks with the same lattice girder configuration such as initial imperfections that can
result from the manufacturing process or handling of the lattice girder, material properties and
32
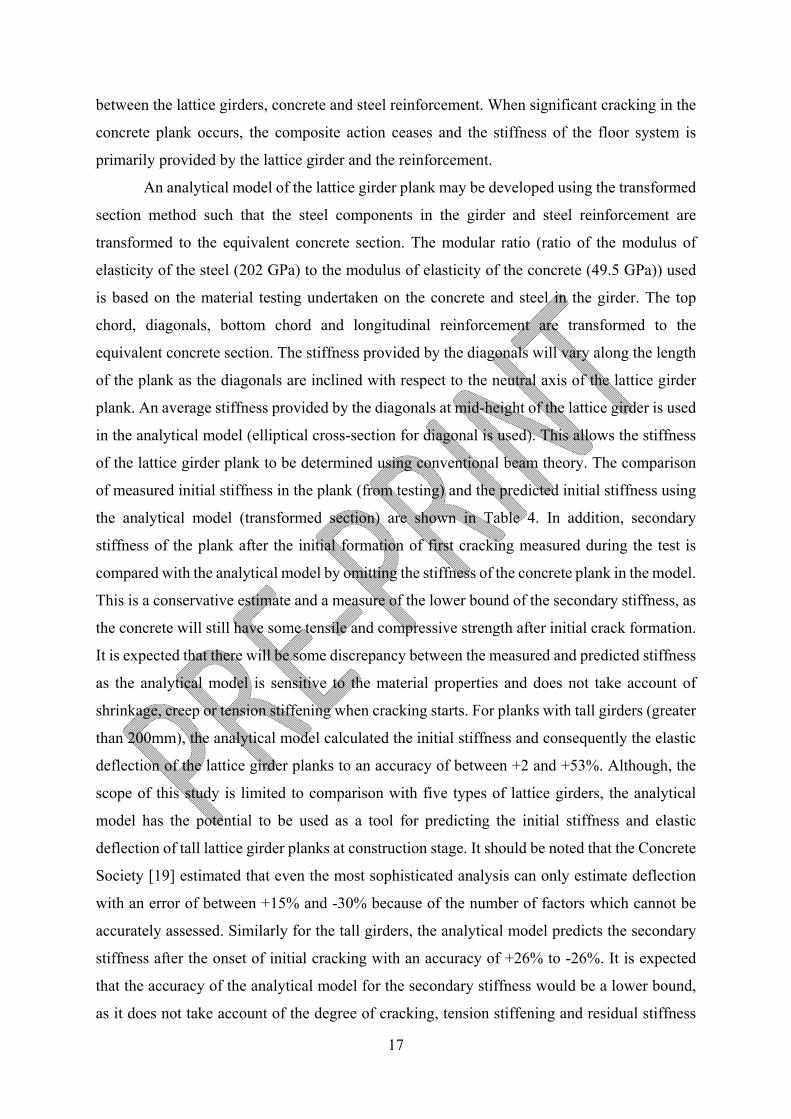
restraint by diagonals. Based on the tensile tests conducted, the average yield stress for the top
chord of the plank tested in 2015 was 20% higher than the yield stress of the top chord of the
plank tested in 2018. The difference in material properties for the top chords of the two planks
would mean that the compressive resistance of the top chords in the 2015 plank were
significantly greater than the compressive resistance of the 2018 plank and may partially
explain why the top chord buckled in the 2018 test and not in the 2015 tests even if the girder
configuration and specification were similar. It is proposed to repeat this test for the next series
of tests. The difference in failure modes for the same plank also highlights the difficulty in
modelling the lattice girder plank and the importance of using accurate material properties in
numerical modelling.
Table 6 Failure mode of planks
Plank Reference
Girder
Height
(mm)
Peak
Load*
(kN)
Failure Mode
S29‐14/07/06
2015 290 19.98 Buckling of diagonals at support.
S29‐14/07/06
2018 290 16.26 Lateral buckling of top chord.
S22‐14/07/06
2018 220 20.36 Lateral buckling of top chord.
S10‐14/07/06
2018 100 11.60
Peak load was not reached when midspan deflection
was 50mm. Buckling of top chord between diagonals
was observed when midspan deflection was manually
increased to 66mm.
W22.5‐08/05/05
2018 225 3.95 Buckling of top chord between diagonals.
W10‐10/06/06
2018 100 4.66 Buckling of top chord between diagonals.
*Peak load per girder
The compression buckling resistance of the top chord and diagonal can be determined
by using the provisions in Eurocode 3 (Design of steel structures) [22]. Similar to most
structural codes of practice, the formulae for compression buckling provided in the Eurocodes
are based on the elastic buckling load developed by the mathematician Euler and buckling

33
curves to take account of imperfections which are based on empirical data and the Perry-
Robertson formula. To accurately predict the buckling resistance of compression members one
must also allow for geometric imperfections, non-homogenous material properties, residual
stresses and end restraints conditions which may affect the actual behaviour of the top chord
and diagonal. The assumed buckling length of the top chord and diagonal are two of the key
parameters when predicting the compression buckling resistance. For the top chord, the
assumed buckling length is typically assumed by designers to be 300mm which equates to 1.5
times the distance between the diagonals (200mm). However, the buckling behaviour of the
top chord in the tests conducted suggest that the buckling length of the top chord is sensitive to
imperfections and material properties and that the degree of lateral restraint provided by the
diagonals may influence the buckling mode of the top chord. With regard to the buckling length
of the diagonal, the actual length of the diagonal is easily defined but the degree of rotational
restraint provided by the concrete at one end and the top chord at the other is difficult to
determine. Using the formulae in Eurocode 3, the predicted peak load for the plank can be
determined by calculating the load which will produce a compression force equivalent to the
compression buckling resistance of the top chord and diagonal, respectively, and using the
smaller load as this will the critical failure load. A comparison of measured peak load and the
predicted failure load for the lattice girder planks tested is shown in Table 7 based on the
compression resistance of the top chord and diagonal determined in accordance with Eurocode
3. There is no guidance in the literature in relation to an appropriate buckling length of elements
of a lattice girder composed of solid steel reinforcement. The assumed buckling length of the
top chord was 300mm and the buckling length of the diagonal was assumed to 85% of the
length of diagonal protruding from the concrete plank (based on assuming pinned-fixed end
conditions and a buckling length = 0.85L). In addition, the modulus of elasticity of the steel
reinforcement was assumed to be 202GPa (mean modulus of elasticity of the top chords tested,
refer to Section 2.3) and a material partial safety factor of 1.0 (s) was adopted for the strength
of the steel reinforcement (s = 1.15 defined in Eurocode 2 [18]).
It is clear from Table 7 that the current ultimate design check is conservative and the
global factor of safety for the lattice girder plank when comparing the peak load and the
predicted failure load (in accordance with Eurocode 3) ranges between 2.08 and 3.26. In
addition, the predicted failure mode (top chord or diagonal buckling) is not always in agreement
with the actual failure mode in tests. This suggests that further investigation is required to
accurately predict the buckling length for top chords and diagonals in the lattice girder during

34
construction stage so that better predictive models may be developed for the ultimate limit state
behaviour of the lattice girder plank.
Table 7 Predicted failure of planks
Plank
Reference
Predicted
Failure
Mode
Actual
Failure
Mode
Predicted
based on
Diagonal
Resistance
(kN)
Predicted
based on
Top Chord
Resistance
(kN)
Actual
Failure Load
(kN)*
Global
Factor of
Safety
S29‐14/07/06
2015 Diagonal Diagonal 6.43 14.05 19.98 3.11
S29‐14/07/06
2018 Diagonal
Top
Chord 6.43 14.05 16.26 2.53
S22‐14/07/06
2018
Diagonal/
Top
Chord
Top
Chord 9.77 10.66 20.36 2.08
S10‐14/07/06
2018
Top
Chord
Top
Chord 18.00 4.85 11.60 2.39
W22.5‐
08/05/05 2018
Top
Chord
Top
Chord 2.69 1.39 3.95 2.85
W10‐10/06/06
2018
Top
Chord
Top
Chord 11.19 1.43 4.66 3.26
*Failure load per girder
In all the tests conducted, failure of the bottom chords of the lattice girder was not
recorded. The bottom chords of the lattice girder in conjunction with the longitudinal
reinforcement resist the tensile forces during construction stage. To avoid tensile failure in the
concrete plank, a minimum area of longitudinal reinforcement is specified in the plank to
ensure that failure will occur due to the buckling of the top chord or diagonal.
Cracking was visually observed during the load tests and the cracking pattern on the
plank soffit was recorded after each test. For all tests, initial cracking was noted on the side of
the plank close to one of the load points and as the load increased the crack width would
increase and propagate along the plank soffit (Figure 10). Cracks were typically running along
the transverse direction of the plank (perpendicular with the span of the plank). The location
of the first observed cracking typically coincided with the location of the initial buckling of the

35
top chord and, at failure, the crack widths were largest at the same location of the buckled
element (top chord or diagonal). At the end of the test, a series of transverse cracks were
typically observed in the middle third of the plank between the load points (Figure 20). In some
tests, in which peak load was reached relatively early during tests, additional transverse
cracking developed in the outer third of the plank between the supports and the load point. The
magnitude and extent of the largest transverse cracking was typically an indication of the
location of a failed element in the lattice girder. When a component of the lattice girder buckles
(top chord or diagonal), the tensile stresses and crack widths in the concrete plank at that
location are increased as the bottom chords and longitudinal reinforcement must resist
additional load.
In addition to cracking on the plank soffit, some minor cracking was also observed on
the top surface of the plank in some of the load tests (Figure 21). These typically occurred in
latter part of the tests and none were observed on the top surface prior to cracking of the plank
soffit. Most cracking was observed adjacent to the diagonals protruding from the plank and
were not reflected on the plank soffit although cracking was observed between the lattice
girders in one test (W22.5-08/05/05). Some of these cracks are thought to be due to concrete
laitance (weak thin layer of fine aggregate and cement) and some of the cracking is in response
to the deformation of the lattice girder components during the load test.
Figure 20 Transverse cracking on middle third of plank soffit

36
Figure 21 Cracking on surface of plank
4. Conclusions
This paper describes six full-scale tests on precast concrete lattice girder planks which
were undertaken at NUI Galway to investigate the behaviour of the hybrid concrete floor
system during the construction stage. During the construction stage, the planks are temporarily
propped until the in-situ concrete topping is poured and the props are removed when the in-situ
topping has achieved a specified minimum strength. The concrete planks tested were similar
except for the lattice girder configuration and the range of lattice girders (100-290mm) used
were representative of the type of girders used in the construction industry. Material testing
was undertaken to determine the properties of the concrete and steel in the lattice girder planks.
It is envisaged that the greater understanding of this precast floor system at construction stage
achieved through this experimental programme and previous research [9,10] will make it
possible to develop numerical models which can accurately predict the of the behaviour of the
lattice girder plank floor during construction. The comprehensive range of instrumentation
utilised in the tests allowed the behaviour of the various components in the lattice girder plank
(top chord, bottom chord, diagonals, concrete, reinforcement) to be analysed. This rich data
will contribute to the relatively little experimental data available and will assist with the
development of accurate numerical modelling. The experimental results illustrate that there is
potential for significant optimisation of the lattice girder precast floor system at construction
stage which could reduce the cost and labour required for temporary propping. Several
structural aspects can be concluded from the experimental tests conducted:
The behaviour of the lattice girder plank has a number of distinct phases. The moment-
deflection relationship is linear and elastic initially until the onset of cracking on the
plank soffit. As load increases, the cracks widen and propagate, and the stiffness of the
plank reduces until peak load/moment is reached.
(a) Surface cracking between girders (W22.5‐08/05/05)
(b) Surface cracking at diagonals (S22‐14/07/06)
(c) Surface cracking at diagonals (S22‐14/07/06)

37
During the linear elastic phase, the neutral axis for the lattice girder plank for all tests
was located below the longitudinal reinforcement in the concrete plank. The neutral
axis was typically located in the middle of the concrete plank (65mm thick).
The onset of cracking typically occurred at similar displacements for all tests and
appeared to be related to the tensile strain capacity of the concrete. Using the measured
strain profile on the lattice girder to extrapolate the strain on the plank soffit, it appeared
that cracking was initiated when the strain exceeded the tensile strain capacity of the
concrete. The tensile strain capacity was calculated using information from material
testing of the concrete used in the plank.
The initial stiffness and deflection of the lattice girder plank can be determined
relatively accurately for tall girders (height ≥200mm) using the transformed section
method. The elastic deflection of the lattice girder plank with tall girders can be
calculated to an accuracy of between +2 % and +53%.
The transformed section method may be used as a lower bound estimate for the
secondary stiffness of the of the lattice girder plank with tall girders.
The transformed section method is not suitable for estimating the stiffness and
deflection of the lattice girder plank with small height girders (height 100mm).
Experimental test data can be used to determine the deflection of the lattice girder
planks with variable propping arrangements and variable construction loading. Taking
account of the multi-span nature of lattice girder planks during construction can result
in significant efficiencies for propping arrangements on site.
Failure of the plank at construction stage is due to either buckling of the top chord
(bending failure) or buckling of the diagonal (shear failure). In all cases, deflection of
the plank at failure exceeded 10mm (maximum permitted deflection at construction
stage).
Imperfections due to the manufacturing and construction process of the lattice girders
planks and differences in material properties can impact the behaviour of the lattice
girder plank at the construction stage.
The ultimate resistance of the lattice girder plank can be estimated using the
compression buckling resistance provisions in Eurocode 3. This method is sensitive to
the buckling length assumed for the top chord and diagonal of the lattice girder and the
material properties.

38
An average global factor of safety of 2.7 was calculated when comparing the
experimental failure load and the calculated failure load using Eurocode 3. This
suggests that there is scope for more refinement to better predict the failure mode and
load.
4.1 Recommendations for future research
Based on the experimental testing conducted and comparison of predicted and actual
behaviour, it is recommended that further research should be undertaken in the following areas:
Development of a general analytical model which can be used for the design of lattice
girder planks at construction stage.
Further experimental testing with different configurations of lattice girders (height,
spacing, top chord diameter, diagonal diameter, reinforcement).
Further experimental testing investigation on both single span and multi-span propping
arrangements.
Degree of restraint provided by the diagonals to the top chord of the lattice girder.
Determine appropriate buckling lengths to be used for checking the buckling resistance
of the top chord and diagonal of the lattice girder.
Impact of reinforcement in the concrete plank on the stiffness, deflection and crack
behaviour.
Contribution of diagonals of the lattice girder to the overall stiffness of the lattice girder
plank.
Modelling of tension stiffening and residual stiffness of concrete plank after cracking.
Parameter study to investigate optimisation of lattice girder configuration (top chord,
diagonal, bottom chord, girder height, girder spacing).
Design guide with more realistic temporary propping arrangements to control
deflection and cracking.
Appropriate factor of safety for lattice girder precast floor system at construction stage.
5. Acknowledgements
The authors would like to acknowledge the support of Oran Precast and in particular Dave
Holleran (Engineering Manager) who manufactured all the precast elements which were tested
for this project. The authors would like to thank Colm Walsh (Senior Technical Officer, NUI
Galway) and Peter Fahy (Senior Technical Officer, NUI Galway) for their assistance with the
laboratory testing and material testing respectively. The assistance of Gerard O’Kelly-Lynch

39
(former masters student) with bonding of sensors during manufacture of the planks is also
acknowledged. This project has received funding from the European Union’s Horizon 2020
research and innovation programme under grant agreement No. 637221 Built2Spec Project.
The second author would also like to acknowledge the funding received from the Science
Foundation Ireland through the Career Development Award programme (Grant No.
13/CDA/2200).

40
References
[1] The Concrete Centre. Hybrid Concrete Construction. 2005.
[2] NSAI. EN 13747: Precast concrete products - Floor plates for floor systems. 2010.
[3] Furche J, Bauermeister U. Load tests: Long erection spans with strengthened lattice
girders. Betonwerk+ Fert 2011;77:4–17.
[4] Löfgren I. Lattice Girder Elements in Four Point Bending – Pilot Experiment. Göteberg:
2001.
[5] Bertram G, Furche J, Hegger J, Bauermeister U. Permissible Span of Semi-precast Slabs
in Case of Erection (Zulässige Montagestützweiten von Elementdecken mit verstärkten
Gitterträgern). Beton- Und Stahlbetonbau 2011;106:540–50.
doi:10.1002/best.201100031.
[6] Cheng YM, Fan Y. Laboratory and numerical test on concrete plank composite with
reinforcement truss. J Struct Eng 1994;20:207–16.
[7] Torre A, Martínez JAM, Saiz AR, Lopez VO. Span in Construction of Concrete Precast
Products: Bearing Beams and Reinforced Slabs. Int J Hous Sci Its Appl 2011;35:91–
102.
[8] Newell S, Hajdukiewicz M, Goggins J. Real-time monitoring to investigate structural
performance of hybrid precast concrete educational buildings. J Struct Integr Maint
2016;1:147–55. doi:10.1080/24705314.2016.1240525.
[9] Newell S, Goggins J. Real-time monitoring of concrete – lattice-girder slabs during
construction. Proc Inst Civ Eng - Struct Build 2017;170:885–900.
doi:https://doi.org/10.1680/jstbu.16.00198.
[10] Newell S, Goggins J. Investigation of Thermal Behaviour of a Hybrid Precasted
Concrete Floor using Embedded Sensors. Int J Concr Struct Mater 2018;12:66.
doi:10.1186/s40069-018-0287-y.
[11] Byrne D, Goggins J. Evaluating the structural capacity of concrete elements through in-
situ instrumentation. Key Eng Mater 2013;569–570.
doi:10.4028/www.scientific.net/KEM.569-570.382.
[12] Goggins J, Byrne D, Cannon E. The creation of a living laboratory for structural
engineering at the National University of Ireland, Galway. Struct Eng 2012;90:12–9.
[13] Hajdukiewicz M, Byrne D, Keane MM, Goggins J. Real-time monitoring framework to
investigate the environmental and structural performance of buildings. Build Environ
2015;86:1–16.

41
[14] NSAI. IS EN 12390 Testing hardened concrete – Part 3: Compressive strength of test
specimens. 2009.
[15] NSAI. IS EN 12390 Testing hardened concrete - Part 13: Determination of secant
modulus of elasticity in compression. 2013.
[16] NSAI. IS EN 15630 Steel for the reinforcement and prestressing of concrete - Test
methods - Part 1 : Reinforcing bars , wire rod and wire 2010.
[17] FIB. Externally bonded FRP reinforcement for RC structures. vol. 14. Lausanne,
Switzerland: 2001.
[18] CEN. Eurocode 2: Design of concrete structures. Part 1-1: General rules and rules for
buildings. Brussels, Belgium: CEN; 2005. doi:[Authority: The European Union Per
Regulation 305/2011, Directive 98/34/EC, Directive 2004/18/EC].
[19] The Concrete Society. Technical Report No. 58: Deflections in concrete slabs and
beams. Camberley, London.: 2005.
[20] Bond A, Brooker O, Burridge J, Fraser AS, Harris AJ, Harrison T, et al. How to Design
Concrete Structure Using Eurocode 2. 2nd Ed. MPA The Concrete Centre; 2018.
[21] NSAI. Eurocode 1 - Actions on structures - Part 1 -6 : General actions - Actions during
execution ( Including National Annex ). 2005.
[22] NSAI. Eurocode 3: Design of Steel Structures: Part 1-1: General Rules and Rules for
Buildings. 2005.


![Vol. 5, No. 3-4, 2017rinterian/publications/journal... · lattice. In[Dormann and Deutsch 2002], avascular tumor growth is simulated using a hybrid lattice-gas cellular automaton,](https://img.pdfslide.us/doc/110x75/5e822d108e491c096561a2ef/vol-5-no-3-4-rinterianpublicationsjournal-lattice-indormann-and-deutsch.jpg)