Embed Size (px)
Citation preview

UNLV Retrospective Theses & Dissertations
1-1-1995
Experimental study of heat transfer and fluid flow in unsaturated Experimental study of heat transfer and fluid flow in unsaturated
porous media porous media
Abdullah Abdullatif Izzeldin University of Nevada, Las Vegas
Follow this and additional works at: https://digitalscholarship.unlv.edu/rtds
Repository Citation Repository Citation Izzeldin, Abdullah Abdullatif, "Experimental study of heat transfer and fluid flow in unsaturated porous media" (1995). UNLV Retrospective Theses & Dissertations. 456. http://dx.doi.org/10.25669/r57i-dv1o
This Thesis is protected by copyright and/or related rights. It has been brought to you by Digital Scholarship@UNLV with permission from the rights-holder(s). You are free to use this Thesis in any way that is permitted by the copyright and related rights legislation that applies to your use. For other uses you need to obtain permission from the rights-holder(s) directly, unless additional rights are indicated by a Creative Commons license in the record and/or on the work itself. This Thesis has been accepted for inclusion in UNLV Retrospective Theses & Dissertations by an authorized administrator of Digital Scholarship@UNLV. For more information, please contact [email protected].

INFORMATION TO USERS
This manuscript has been reproduced from the microfilm master. UMI films the text directly from the original or copy submitted. Thus, some thesis and dissertation copies are in typewriter face, while others may be from aiy type of computer printer.
The quality of this reproduction is dependent upon the quali^ of the copy submitted. Broken or indistinct print, colored or poor quality illustrations and photographs, print bleedthrough, substandard margins, and improper alignment can adversely affect reproduction.
In the unlikely event that the author did not send UMI a complete manuscript and there are missing pages, these wül be noted. Also, if unauthorized copyright material had to be removed, a note will indicate the deletion.
Oversize materials (e.g., maps, drawings, charts) are reproduced by sectioning the original, beginning at the upper left-hand comer and continuing from left to right in equal sections with small overlaps. Each original is also photographed in one exposure and is included in reduced form at the back of the book.
Photographs included in the original manuscript have been reproduced xerographically in this copy. Higher quality 6" x 9" black and white photographic prints are available for assy photographs or illustrations appearing in this copy for an additional charge. Contact UMI directly to order.
UMIA Bell & Howell Information Company
300 North Zeeb Road. Ann Arbor. Ml 48106-1346 USA 313/761-4700 800/521-0600


EXPERIMENTAL STUDY OF HEAT TRANSFER AND FLUID FLOW IN UNSATURATED POROUS MEDIA
Abdullah Abdullatif Izzeldin
A thesis submitted in partial fulfillment
of requirements for the degree of
Master of Science
m
Mechanical Engineering
Department of Mechanical Engineering
University of Nevada, Las Vegas
December 1994

UMI Number: 1374885
DMI Microform 1374885 Copyright 1995, by DMI Company. All rights reserved.
This microform edition is protected against unauthorized copying under Title 17, United States Code.
UMI300 North Zeeb Road Ann Arbor, MI 48103
The thesis of Mr. Abdullah A bdullatif Izzeldin tor the degree of Master of Science in Mechanical Engineering is approved.
Chairperson, Robert F. Boehm, Ph.D
W . i“
Examining Committee, Darrell Pepper, Ph.D
Examining Committee, M ohamed B. E. Trabia, Ph.D
■ M/ -• ./ 'I [j .'I'
G raduate Faculty Representative, W illiam Culbreth, Ph.D
G raduate Dean, Ronald W. Smith, Ph.D
University of N evada, Las Vegas December 1994
11

Abstract
A laboratory experim ent was conducted to investigate therm al and
flu id flow behavior in an unsaturated porous m edium . The experim ent
consisted of a bed of homogeneous glass beads packed uniform ly in a Lexan
rectangular box. A cylindrical heat source was located horizontally in the
m iddle region of the bed and the bed was heated to steady state conditions.
W ater was then introduced uniformly through square nozzles located over
the fill material for short periods of time. The box w as fitted with a screen at
the bottom to keep the porous material intact w hile allow ing the w ater to
flow out. Below the box, an outflow system was located w hich consisted of a
partitioned catch cham ber for m easuring the special variation of the w ater
flow ing out. M easurem ents in the bed were obtained using two types of
devices that are p laced in selected locations. These devices include
capacitance elem ents for inferring moisture presence and therm ocouples for
m easuring tem peratures.
The experim ental results confirmed that the dom inan t m ass and heat
transfer m echanism s w ere vaporization, condensation , conduction , and
convection. The sim ulated m edium was observed to develop a d ry zone, a
tw o-phase zone, and liquid zone. Moreover placem ent of a heat source in an
u n sa tu ra ted porous m edium causes a shifting of w ater around the heat
source.
ill

ACKNOWLEDGMENTS
The au thor w ishes to express his profound g ra titu d e and sincere
appreciation to Dr. Robert F. Boehm for his inspiration and indispensable
guidance throughout the course of this study. I rem ain specially indebted to
him for all his suggestions, guidance, encouragem ent, constructive criticism,
and financial support of this project.
Special thanks are extended to Dr. Yi-Tung Chen for his valuable
suggestion, encouragem ent, and constructive criticism of this project. Much
thanks goes to Dr. W oosoon Yim for all of his help. Also, thanks to Dr.
Darrell Pepper and Dr. M ohamed Trabia of the D epartm ent of Mechanical
E ngineering and Dr. W illiam C ulbreth of the D epartm ent of Civil and
Environm ental Engineering for offering me invaluable advice regarding this
project. F inally, 1 w ould like to extend m y thanks to D epartm ent of
M echanical Engineering for the financial support and other items during the
course of m y study.
I V
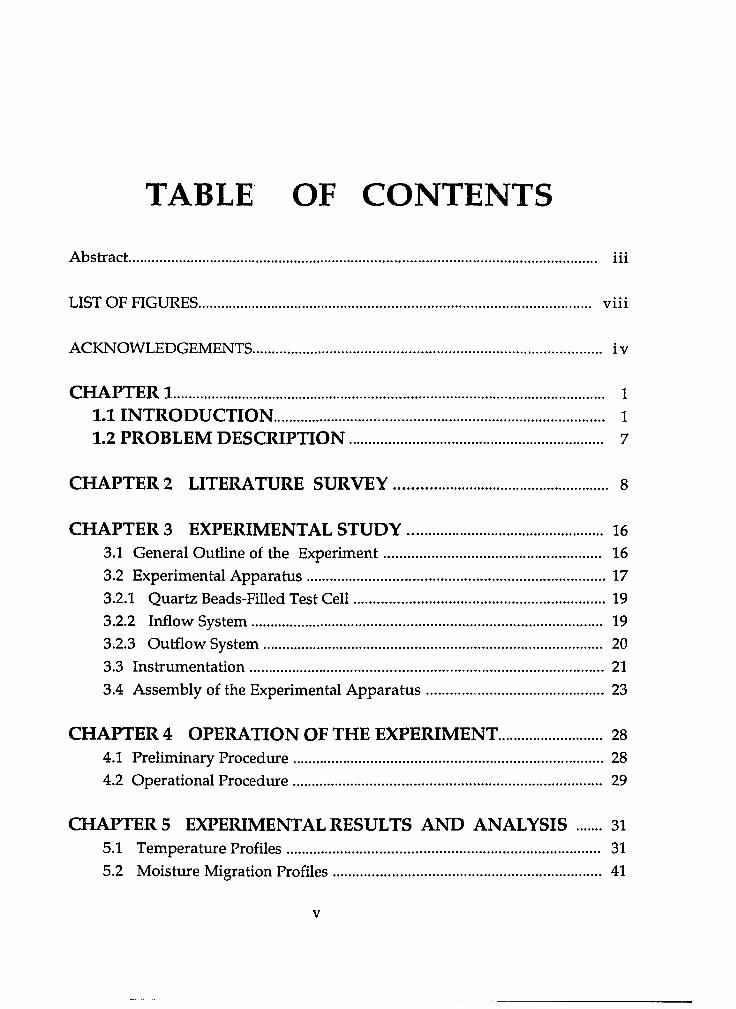
TABLE OF CONTENTS
Abstract........................................................................................................................... iii
LIST OF FIGURES....................................................................................................... v iii
ACKNOWLEDGEMENTS............................................................................................ iv
CHAPTER 1................................................................................................... 11.1 IN T R O D U C T IO N .................................................................................. 11.2 PROBLEM DESCRIPTION.......................................................... 7
CHAPTER 2 LITERATURE SURVEY................................................ 8
CHAPTERS EXPERIMENTAL STU D Y ............................................ 163.1 General Outline of the Experim ent......................................................... 163.2 Experimental A pparatus.............................................................................. 173.2.1 Quartz Beads-Filled Test C ell.................................................................. 193.2.2 Inflow System ............................................................................................ 193.2.3 Outflow System ......................................................................................... 203.3 Instrum entation............................................................................................. 213.4 Assembly of the Experimental A p p a ra tu s ................................. 23
CHAPTER 4 OPERATION OF THE EXPERIMENT....................... 284.1 Preliminary P rocedure................................................................................. 284.2 Operational Procedure................................................................................. 29
CHAPTER 5 EXPERIMENTAL RESULTS AND ANALYSIS ..... 315.1 Temperature Profiles.................................................................................. 315.2 Moisture Migration Profiles...................................................................... 41

CHAPTER 6 SU M M ARY A N D C O N C L U SIO N ................................. 45
CHAPTER 7 BIBLIOGRAPHY.............................................................. 48
A PPE N D IX I: Capacitance Element Calibrations....................................... 52
APPENDIX II: Labview Data Acquisition................................................... 59
A PPE N D IX III: Coefficient of Permeability Falling-Head M eth o d 65
V I

LIST OF FIGURES
1. Diagram of how ground water might be diverted by a "hot repository."... 3
2. A sketch of the experimental apparatus sy s tem ............................................... 5
3. Schematic of the developm ent of heat pipe in porous m edium .............. 11
4. A sketch of the modified experimental apparatus system .......................... 22
5. Location of thermocouples distribution in the b e d ....................................... 25
6. Design of the capacitance e lem ents.................................................................... 26
7. Location of capacitance elements distribution in the b e d ............................ 27
8. Tem perature profile vs time for thermocouples 6, 8, and 9 ......................... 36
9. Tem perature profile vs time for thermocouples 1, 4, 7, 10 and 11 ............. 37
10. Tem perature profile vs time for thermocouples 2, 3, and 5 ........................ 38
11. Schematic of condition achieved during the experim ent r u n .................. 39
12. The distribution of water collected in the p a rtitio n s .................................... 40
13. M oisture content in the bed for sensor 1, 2, and 3 .......................................... 43
14. M oisture content in the bed for sensor 4, 5, and 6 .......................................... 44
15. Schematic diagram of capacitance-to-voltage converter c irc u it ................ 53
16a. Plots of the capacitance element sensors 1 calib ra tion ................................ 56
16b. Plots of the capacitance element sensors 2 calib ration ................................ 56
16c. Plots of the capacitance element sensors 3 calib ration ................................. 57
16d. Plots of the capacitance element sensors 4 ca lib ra tion ................................ 57
16e. Plots of the capacitance element sensors 5 calib ra tion ................................ 58
16f. Plots of the capacitance element sensors 6 calib ra tion ................................. 58
vii

17a. Front panel for thermocouple virtual instrum ent program ..................... 61
17b. Block diagram for thermocouple virtual instrum ent p ro g ra m ............... 62
18a. Front panel for voltage virtual instrum ent p ro g ra m ................................. 63
18b. Block diagram for voltage virtual instrum ent p ro g ra m ............................ 64
19a. Sketch details of falling-head ap p ara tu s ........................................................... 67
19b. Sketch details of test m o ld ................................................................................... 68
Vlll

CHAPTER 1
1. 1 Introduction
H eat and mass transfer in porous m edia are im portant contributors to
processes governing many of the environm ental questions. Everything from
trying to figure out w here groundw ater contam ination will go to where it
came from and how to deal w ith it depends on these processes. This work
deals w ith issues that have bearing on the prevention of w ater contamination
from nuclear waste that will be buried underground . The effects of w ater
flow and heat transfer around a buried nuclear waste canister are examined in
detail.
Com bined heat and mass transfer w ith phase change in an unsaturated
porous m edia has been a topic of much research over the past decade because
of its applications in geothermal energy, underground disposal of nuclear and
chem ical w astes, therm ally enhanced oil recovery , w ater table and
g ro u n d w a te r p o llu ta n t flow , d ry in g of g ra in s, th erm al in su la tio n
1

perform ance and solar pond design. An analysis of these processes is
complicated by the possible presence of two phases (liquid and vapor) and the
varieties of the structure of the porous matrix. Energy transfer in such a
m edium occurs by conduction, in all of the phases, as well as by convection,
evaporation, and condensation. M oisture transport occurs w ithin the voids
of the porous m edium as a resu lt of vapor pressure gradients, pressure
gradients, and thermal gradients. These studies led to a current concept called
the "hot repository" design which is a concept for the design of the proposed
high level radioactive waste repository. This concept has been analyzed by
researchers at Lawrence Berkeley N ational Laboratory (e.g. [Pruess and
Duoghty, 1988]), Lawrence Livermore N ational Laboratory (e.g. [Buscheck and
N itao, 1993]), and others. In this design, the high level radioactive nuclear
w aste package is emplaced in the repository such that heat generated by the
waste results in tem peratures in the su rrounding form ations that are above
the boiling point of water. These high tem peratures can persist for thousands
of years. As tem peratures around the repository increase to the saturation
tem p era tu re , evaporation of any w ater flow ing vertically tow ard the
repository increases and vapor pressure becomes appreciable. Essentially, the
vapor will flow radially away from the heated source. In the cooler region,
the w ater will condense and again flows vertically. In this w ay w ater should
be d iverted around the repository area. The conditions surrounding a heat
source are shown schematically in Figure 1. This general phenom ena have
also been denoted as the "heat-pipe" effect, w hich im plies essentially
evaporation/condensation phenom ena transporting m oisture. Problems of
this sort have been analyzed theoretically and analytically through the use of
num erical m ethods.

i S", • s • s • sis ■ s • s ■ s
IWsCsWvlK#S«S"S"S«S"
■S»S»S"S*S»S*S"S*S' « îg g ï____
#S"S"S«S"S"S s-s»s«
Moisture Paths■ - - . - -«S"S"%"S"S"S"S- -- »- »- ,- ,- .-
“ S • S • S «4iS ■ S ■ S • S • S • S ■ S • S ■ S^S ■ S • S • '
■ ■ ■- ■- •- -- “- “- ■- ■- J>sa*aaa*B"X
*
ÉIÉ“ S " S " S # ^
Extent of Vaporization
Zone
W t■® smmmL
Hot Repository]
# # LU/a/a/a a* ■ a* • J
m m I # #Æ N #^ # / a / a / a ^ a ^ a ^ a J " a ^ a ^ a / a ^ a ^ a a " a ^ a ^ a / a / a , f a ^ j
%S"S"S"S"S«S"S"S"S"S ,s • s • s • s ■ s • s • s • s • s • s • \a\a«,a",#^a«,aS"S"S»S"S"S"S"S"S"S"S
# ^ " ^ a ^ a ^ a ^ a , " a / a / a ^ a ^ a / a , " a / a / a / a / a ^ a / a a " a / a / a / a / a / a ^ a , " « / a ^ a a " a / a , f m a " a ^ a / a / a / a j " a / a “
S»S"S"S»S»S»S"S»S«S"S«S"S»S»S"%
%S»S»S»S"S"S"S"S*S"S"S#S"S*S"S S"S S»S"S"S*S«S*S«S»S»S"S*S*S»'
%S"S*S"S«S"S«S*S»S"S"S
6$i%i$iA%;ŸA~%Formation.ïsWsWvVW-
■- " ^ a ^ a ^ a J ' a / a ^ a / a ^ a / a ^ a / a / a / a / e ^ a / a ^ a # ^
Figure 1: Diagram of how ground water might be diverted by a " hot repository." In this case the repository heat would cause vaporization of the water, forcing
the vapor to flow in an approximately radial direction.

An experim ent was conducted to evaluate some aspects of the "heat
pipe" effect. The approach was to model the concept in tw o-dim ensions. To
apply this, a hom ogeneous, granular m edium in a box was used. For these
studies glass beads were chosen to represent the matrix form ation, and these
w ere uniform ly packed in a rectangular Lexan box. At 10.2 cm (4 in) from the
bottom of the box an electrical im m ersion heater was located horizontally to
sim ulate the heat source. At the top of the Lexan box the inflow system was
located w here the w ater was sprayed uniform ly through an array of square
nozzles. The Lexan box was fitted w ith screen at the bottom to keep the
porous m aterial intact while allowing the water to flow out. Below the Lexan
box, the outflow system was located which contained th irteen partitioned
catch cham bers for m easuring w ater flowing out of the test section. The
experimental apparatus is shown schematically in Figure 2.
M easurem ents were obtained using two types of devices that are placed
in carefully selected locations. These devices include capacitance elements
for in ferring m oistu re location and chrom el alum el therm ocoup les for
m easuring tem peratures. Locations for placing the various devices in the bed
w ere determ ined approxim ately to predict the heat transfer and flu id flow.
The fie ld near to the hea t source w as heavily in s tru m e n te d w ith
therm ocouples bu t had only a lim ited num ber of resistance elements.

(5.0 gallon capacity)
Head Tank
7'
Inflow System
Control Valves
Flow Distributor ( square nozzles )
Main Experimental Tank
Outflow System
Ball valve
Porous Media,InstrumentI ' OD Firerod heater
(lOOOW 120V )
Dram Va
Screen
CollectionPartitions
Figure 2: A sketch of the experimental apparatus system
6
The w ork p resen ted in this thesis investigates experim entally two
phase (liquid and vapor) fluid flow and energy transport in an enclosed
unsaturated porous m edium .
The m otivation for this study was to predict the heat transfer and fluid
flow m echanisms present w ithin the unsaturated, porous geologic setting like
the p ro p o sed high-level rad ioactive nuclear w aste reposito ry . The
em placem ent of heat generating waste in an unsaturated perm eable m edium
is expected to give rise to the developm ent of a heat pipe effect (Pruess et al.
1990). The heat pipe effect can be im portant in predicting the corrosion of
waste canisters and transport of radionuclides through the geologic setting.
The purpose of the experiment described here is designed to provide a
m odel that dem onstrates the processes controlling the transport of w ater and
energy in unsaturated porous media. Further it is desired to apply the model
to a hypothetical repository in order to predict the basic effects a high level
rad ioactive nuclear w aste repository w ould have on the m ovem ent of
ground w ater and energy in unsaturated porous media.
1.2 Problem Description
The thermal behavior of the near field of the em placed electrical heater
w as s tu d ie d experim entally u s in g v arious m easu rem en t techniques.
M onitoring the change in the m oisture distribution was accom plished using
capacitance elements for inferring m oisture migration, and these were located
at m any places throughout the m edium . The tem peratures were m easured at
several points of the porous m edium using chromel alum el thermocouples.
The m oisture and tem peratures changes gave evidence of the different heat
tran sfe r m odes in the m edium (conduction , convection). H ow ever,
m onitoring the tem peratures and the m oisture m igration helped locate the
phase change zones and the dry ing areas. This facilitated following the
form ation of a progression of d ifferent zones such as the saturated liquid
zone, the sa tu ra ted vapor zone, and the tw o-phase zone. By careful
m onito ring these zones, one could identify various phenom ena in the
phase-change region. This allowed detailed analysis of its effects.

CHAPTER 2
LITERATURE SURVEY
H eat transfer and fluid flow in unsaturated porous m edia are topics of
practical im portance and current research interest. Researchers have studied
m any aspects of these topics using numerical and sim ulated analyses.
M ultiphase flow in porous m edia w ith heat transfer involving phase
change is one topic that m any researchers have stud ied theoretically and
experim entally . Studies of therm al b ehav io r of a m ultiflu id -sa tu ra ted
form ation were conducted by Gomaa et al. [1974] showing the effect of vapor
sa tu ra tio n and apparen t therm al conductiv ity in a porous m edium . A
conceptual m odel was derived that represented both a theoretical derivation
and experim ent confirmation of the heat pipe concept in porous media. It
w as found that the dom inant m ode of hea t transfer in porous m edia
sa tu ra ted w ith two phase fluid flow under certain tem perature conditions
8
9
was a com bination of phase change and convection. This has been called the
"heat-pipe” effect. The study also shows that the heat pipe effect increases
w ith increasing perm eability and porosity of the m edium , latent heat of
vaporization of the saturating liquid, and vapor pressure.
A heat pipe is an effective tool in transferring heat at high rates by
evaporating the liquid at the warm parts and condensing the vapor at the
cooler p a rts of a cham ber. The porous heat p ipe effects have been
investigated extensively by many researchers. H ow ever an early investigation
was done by Ogniewcz and Tien [1979]. In this study, the governing equations
for fluid and heat flow for a one dim ensional heat pipe configuration were
developed neglecting the effect of fractures bu t including gravity effects. The
g o v e rn in g eq u a tio n s w ere solved for one d im en sio n a l h ea t p ipe
configuration. The results show the effects of various flu id and porous
m edium properties on the heat pipe performance. In a sim ilar study Su and
Som erton [1979] p roposed a one dim ensional theoretical derivation and
experim ental confirm ation for the heat pipe phenom ena in porous media.
The theoretical derivation described the functional dependence of the heat
pipe effect on liquid saturation gradient, capillary pressure, perm eability, heat
flux and gravity. The results of their study show ed that the length of the two
phase region is inversely proportional to the heat flux and tem perature
difference through the system. The presence of the heat pipe effect in a
partia lly sa tu ra ted porous media can cause large changes in the apparent
therm al conductivity.
1 0
Several investigators have developed num erical and m athem atical
m odels for two phase heat transfer and flu id flow in unsatu ra ted porous
m edia that accounts for processes controlling the transport of w ater and
energy. In particular, attention was focused on the analysis of heat pipe effects
in unsaturated or partially saturated porous m edia that m ight occur near a
high-level radioactive nuclear waste disposal.
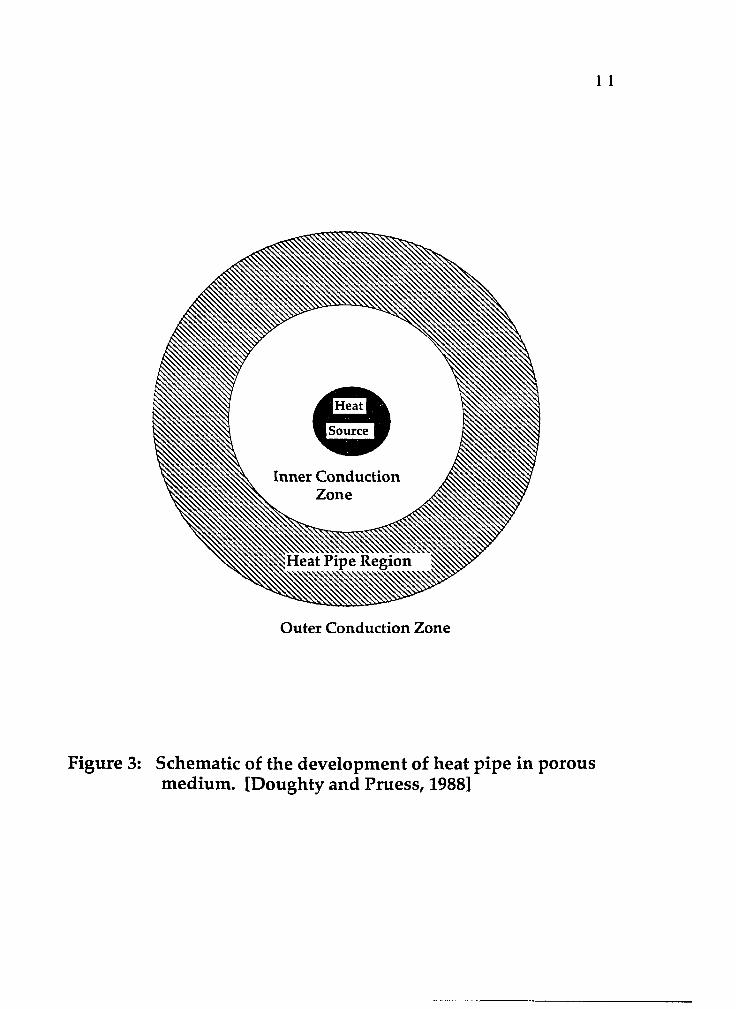
The heat pipe behavior in porous m edia was presented by Doughty and
Pruess [1987,1989] in a semi-analytical study. Figure 3 shows the schematic
representation of heat transfer regimes and developm ent of the heat pipe
region in porous m edium due to the em placem ent of a high level nuclear
w aste package. H eat penetrates into the fo rm ation as soon as the waste
package is buried in the partially saturated perm eable m edium . This causes
tem peratures to rise in the surroundings w hich will vaporize the liquid water
present in the formation. The vapor generated in the porous m atrix flows
radially aw ay from the heat source, then at som e time later it condenses on
the cooler region of the formation. U nder the capillary pressure and gravity,
the condensed liquid migrates vertically dow n the saturated region towards
the w aste package. As time progresses the sa tu ra tion grad ien t causes a
backflow of the majority of the condensated liquid vertically tow ard the heat
source. The liquid is then revaporized as it flow s tow ard the waste package
and repeats the cycle. The vaporization and condensation cycle is repeated to
develop a heat pipe region.
From the Doughty and Pruess study, it w as found that, under steady
11
Inner Conduction Zone
Heat Pipe Region
Outer Conduction Zone
Figure 3: Schematic of the developm ent of heat pipe in porous medium. [Doughty and Pruess, 1988]

1 2
state conditions, three regions with different heat transfer m echanism s exist
in the porous m edium around the heat source. At the ou ter boundary a
liqu id conduction zone dom inates w here in the inner reg ion there is a
conduction dom inated single phase vapor zone. The m iddle dom ain is a
two-phase heat pipe region where heat flow is primarily convective. Also the
study shows that the extent of the heat pipe region is influenced strongly by
relative perm eability and capillary pressure. A porous m edium w ith larger
p e rm eab ility w ill p ro v id e m ore favorable conditions for h ea t p ipe
developm ent.
Extensive theoretical and experim ental studies of the hom ogeneous
porous heat pipe have been reported by Udell [1983,1985]. First, he conducted
an experim ental study on heat transfer in a porous m ed ium heated from
above exhib iting the effects of capillary, evaporation, and condensation.
From these experim ents, it was found that at steady state conditions, three
distinct regions existed: a liquid, conduction dom inated region at the bottom,
a tw o-phase convection dom inated transition zone, an d a conduction
dom inated vapor region at the top. Later he conducted a one-dim ensional
steady state experim ental analysis of the heat and mass transfer in a porous
m edia satu ra ted w ith the liquid and vapor phases. The resu lt of this analysis
shows tha t convection heat transfer dom inates in the tw o phase zone. In
addition, it w as found that the driving forces for convection in the heat pipe
region are capillary and vapor pressure gradients. The results also predicted
the critical d ry-ou t heat flux, the m inimum heat flux at w hich a vapor zone
will form for the bottom -heated case. For the horizontally-heated system, it
was found that the product of the heat flux and tw o-phase zone length is

1 3
constant for fixed fluid and media properties. Finally, the analysis show ed
that the effective therm al conductivity of the two-phase zone increased w ith
increasing perm eability.
Analytical and semi-analytical solutions in sim ultaneous flow of fluid
and heat associated w ith high-level radioactive nuclear waste disposal in a
porous m edium w ere carried out by Pollock [1986] and Pruess et al. [1985].
Pollock developed a m athem atical model analyzing one dim ensional vertical
transport in an unsa tu ra ted porous m edium accounting for the coupled
transport of heat, two-phase fluid (liquid and vapor), and air. The results he
presented illustrated the basic effects of high-level radioactive nuclear w aste
disposal on the m ovem ent of w ater and heat in an u nsa tu ra ted porous
medium. Em placem ent of waste w ith the high heat generation of spent fuel
resulted in a one dim ensional tem perature rise, vapor pressure, and liquid
and vapor fluxes. Thus he anticipated a convective circulation pattern in the
vapor phase in two dimensions. Also the analysis showed that the increases
in tem perature produce evaporation of the w ater, forcing the vapor to flow
away from the heat source. This led to developm ent of an initial dry zone in
the vicinity of the repository, and increased liquid saturation away from the
heat source due to condensation. The same result was reached by Pruess et al.
[1985]. They sim ulated the sim ultaneous heat transfer and fluid flow effects
on the waste package buried in partially saturated porous formations.
An extensive analysis on the subject of high-level radioactive nuclear
waste repository heat driven flow in partially saturated porous m edia was

1 4
perform ed by Buscheck et al. [1993,1994]. These analyses examined the impact
of the repository therm al condition on the hydrological perform ance of the
u n sa tu ra ted and partia lly sa tu ra ted porous form ation using "Tough"
(transport of unsaturated groundw ater and heat) com puter codes. In general,
these m odels predict a drying out of the repository form ation by boiling of
liquid w ater in the near field of the heat generation fuel and flow of the water
vapor to the cooler region. Further, these studies indicate that thermal and
fluid flow perform ance of the unsaturated form ation will be dom inated by
conduction heat transfer. The studies also show that the vapor-phase
convection and condensate backflow are influenced sharp ly by the bulk
perm eability of the formation. The vapor-phase convection will be increased
by increasing bulk permeability. Therefore, the convection heat transfer will
be dom inated in the vapor zone. Finally, it was found that the region of large
contrasting bulk permeability increases the vapor pressure differentials which
can drive w ater vapor into a high permeability region where it condenses and
backflows tow ard the repository.
A n experim ental s tudy on the heat transfer in a porous m edia
saturated by a liquid was also carried out by Cioulachtjian et al. [1989] using
bronze beads to sim ulate the porous media. Three different configurations
were studied: thermal transfer with a flowing liquid, therm al transfer w ith a
flowing liquid w ith vaporization, and drying of the porous m edium initially
saturated w ith liquid. W hen the heat source delivered sufficient heat flux,
the experim en tal results show the appearance of three zones in the
hom ogeneous porous media. This reaffirm ed U dell's experim ental finding
and Pruess's num erical results m entioned previously. The developm ent of

1 5
the two phase zone begins near the heat source and the vapor transport away
from the heat source leads to developm ent of a dry out zone.
Finally , an experim ental in v estig a tio n of the behavior of non-
isotherm al flow in two-dimensional saturated and partially saturated porous
m edia was performed by Ho et al. [1994]. In this paper, physical experiments
w ere conducted using three different saturation levels: fully saturated, half
saturated, and residually saturated porous m edia to identify non-isotherm al
flow fields and temperature distributions in a bottom heating and top cooling
bed. The experimental results show that vapor convection took place in the
unsatu ra ted zone of the half-saturated case. Further, in all three cases two
counter-rotating convection cells were observed to develop in the saturated
region.
M ost of these studies, either num erical analysis or experim ental
analysis, w ere done in an initially fu lly sa tu ra ted porous m edium or a
partia lly satu ra ted porous m edium. H eat transfer studies in unsatu ra ted
porous m edia infiltrated by a liquid has had little attention in the literature.
For this reason, the objective of the present w ork will be developm ent of an
experim ental study of unsaturated porous m edia infiltrated by a liquid.

CHAPTER 3
EXPERIMENTAL STUDY
3.1 General Outline of Experiment
C oupled therm al and fluid flow processes in an u nsa tu ra ted porous
m edium are im portant in the performance evaluation of some aspect of high
level radioactive waste repository. The high tem perature fields resulting from
the h ea t p ro d u c tio n w ith in a radioactive w aste reposito ry in a deep
u n d erg ro u n d form ation can mobilize the liquid and vapor phases either
away from or into the heated region surrounding of the repository. Therefore
u n d e rs tan d in g the behavior of therm ally-induced flow s is of particu lar
im portance because of the possibility of radionuclide release, which could
con tam inate the mobile ground w ater if it comes in contact w ith the
radioactive waste.
1 6
1 7
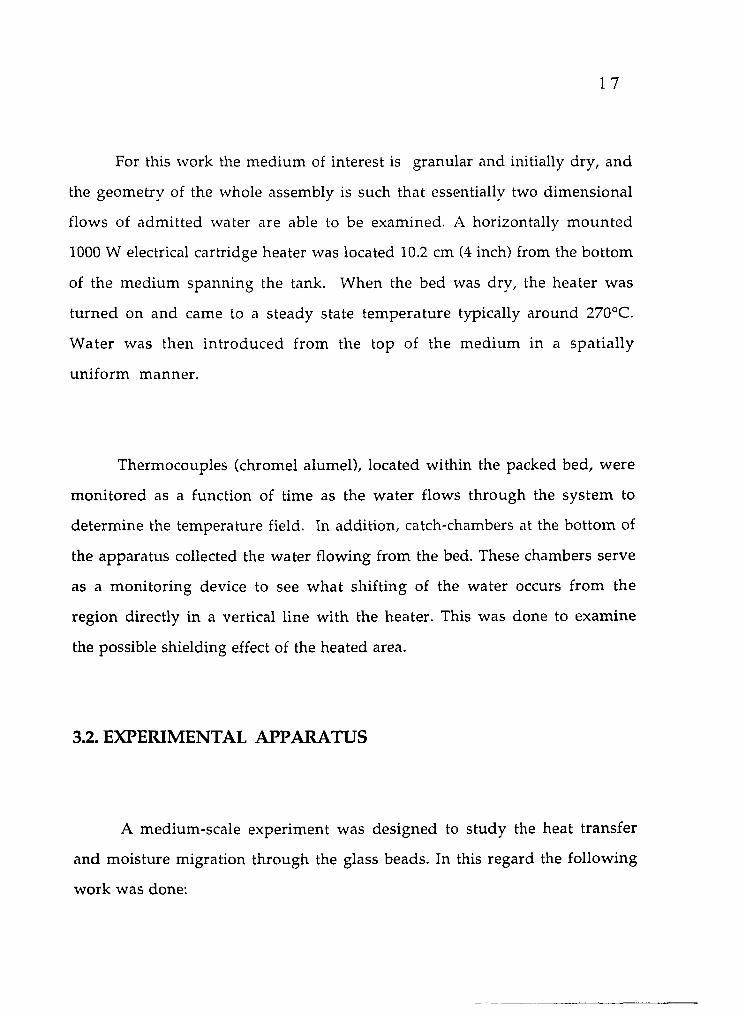
For this work the m edium of interest is granular and initially dry, and
the geom etry of the whole assembly is such that essentially two dim ensional
flows of adm itted w ater are able to be examined. A horizontally m ounted
1000 W electrical cartridge heater was located 10.2 cm (4 inch) from the bottom
of the m edium spanning the tank. W hen the bed was dry, the heater was
tu rned on and came to a steady state tem perature typically around 270°C.
W ater was then in troduced from the top of the m edium in a spatia lly
uniform m anner.
Thermocouples (chromel alumel), located within the packed bed, w ere
m onitored as a function of time as the w ater flows through the system to
determ ine the tem perature field. In addition, catch-chambers at the bottom of
the apparatus collected the w ater flowing from the bed. These chambers serve
as a m onitoring device to see w hat shifting of the w ater occurs from the
region directly in a vertical line w ith the heater. This was done to exam ine
the possible shielding effect of the heated area.
32. EXPERIMENTAL APPARATUS
A medium -scale experim ent was designed to study the heat transfer
and m oisture m igration through the glass beads. In this regard the following
w ork was done;

1 8
1. Designed and fabricated the experim ental apparatus which includes an
inflow system, an outflow system, and a tank to hold the glass beads
and water.
2. Drawings of the apparatus setup and individual part components were
m ade using Macintosh CAD draw ing software.
A schematic of the experim ental apparatus is shown in Figure 2. This
consisted of :
a. Plastic box filled with quartz beads : The m ain part of the
experimental setup is 15.24 cm x 43.18 cm x 30.48 cm (6 x 17 x
12 in) in dimensions and considered to be the test section.
b. Inflow system ; The top part of the setup constitutes the
inflow system which is designed to give a spatially
uniform distribution of the w ater to the quartz beads-filled box.
c. Outflow system: The bottom part of the setup constitutes
the outflow system and is used to m easure the spatial
distribution of the w ater exiting the test section.
1 9
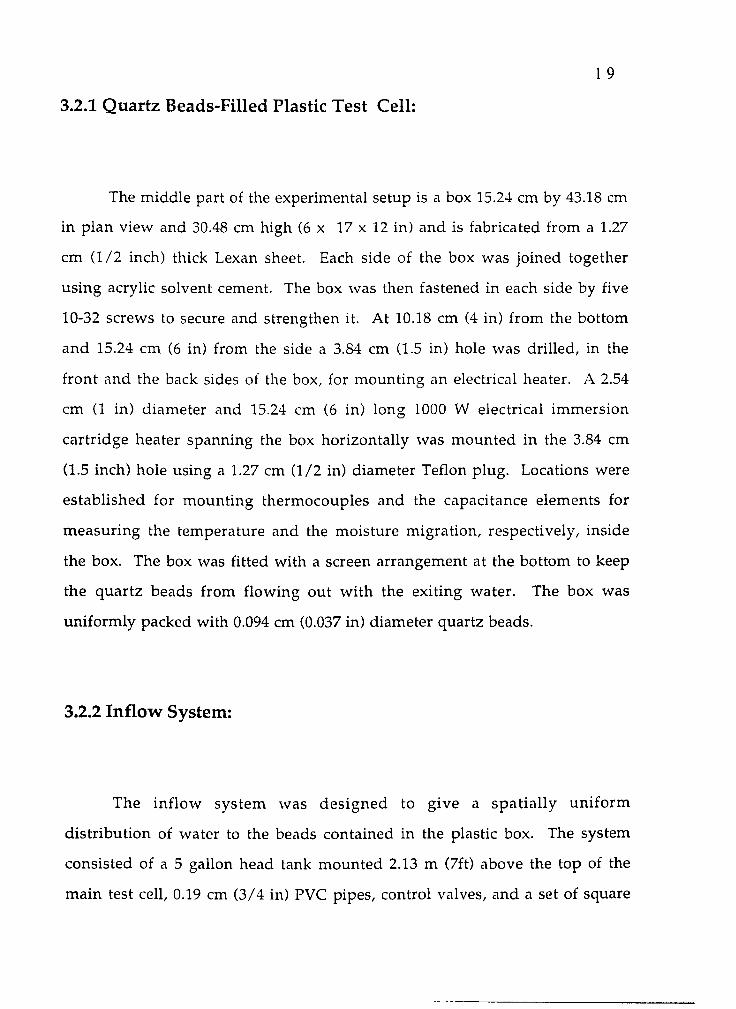
3.2.1 Quartz Beads-Filled Plastic Test Cell:
The m iddle part of the experimental setup is a box 15.24 cm by 43.18 cm
in plan view and 30.48 cm high (6 x 17 x 12 in) and is fabricated from a 1.27
cm (1 /2 inch) thick Lexan sheet. Each side of the box was joined together
using acrylic solvent cement. The box was then fastened in each side by five
10-32 screws to secure and strengthen it. At 10.18 cm (4 in) from the bottom
and 15.24 cm (6 in) from the side a 3.84 cm (1.5 in) hole was drilled, in the
front and the back sides of the box, for m ounting an electrical heater. A 2.54
cm (1 in) diam eter and 15.24 cm (6 in) long 1000 W electrical im m ersion
cartridge heater spanning the box horizontally was m ounted in the 3.84 cm
(1.5 inch) hole using a 1.27 cm (1/2 in) diam eter Teflon plug. Locations were
established for m ounting therm ocouples and the capacitance elem ents for
m easuring the tem perature and the m oisture m igration, respectively, inside
the box. The box was fitted with a screen arrangem ent at the bottom to keep
the quartz beads from flow ing out w ith the exiting w ater. The box was
uniform ly packed with 0.094 cm (0.037 in) diam eter quartz beads.
3.2.2 Inflow System:
The inflow system was d esigned to give a spa tia lly uniform
distribution of w ater to the beads contained in the plastic box. The system
consisted of a 5 gallon head tank m ounted 2.13 m (7ft) above the top of the
m ain test cell, 0.19 cm (3 /4 in) PVC pipes, control valves, and a set of square

2 0
patterned spray nozzles. The square nozzles were m ounted on a 12.7 cm by
43.18 cm (5x17 in) plastic plate which was fitted on top of the m ain test cell.
Each nozzle was m ounted at 13.34 cm (5 1 /4 in) apart, and was attached to a
control valve w hich was placed above the nozzles in-flow line to allow
control of the am ount of w ater as well as to balance the flows betw een the
lines leading to the three spray nozzles. The nozzles were connected to the
head tank by a 183 cm long PVC pipe as shown in Figure 2.
The system was m odified to connect the in-flow line to the city w ater
line in order to control the pressure drop which might affect the uniform ity
of the flow. The m odification was as follows: A 3.05 m (10 ft) hose was
connected to the city w ater line by a control valve. A ball valve and pressure
gage were attached to the hose and the in-flow line, then the line w as split
into two lines by a tee joint. The two lines distributed the flow to the three
nozzles as show n in figure 3. Since the flow in the middle nozzle will have
twice the flow of the end nozzles, a gate valve was connected to the m iddle
nozzle to control the flow and insure a uniform flow from the three nozzles.
3.2.3 O utflow System:
The out-flow system consisted of a 15.24 cm by 43.18 cm in p lan and
15.24 cm high (6 x 17 x 6 in) plastic box fabricated from a 1.27 cm (1 /2 in)
Acrylic sheet. Twelve grooves were machined in the front and the back sides
for placing a partition plate. Then the box sides were joined together using

2 1
acrylic solvent cement and fastened by three 10-32 screws. Twelve partition
plastic plates spaced approxim ately 2.54 cm (1 in) apart were placed in the
groves and sealed by silicon sealant to create thirteen partitions of dimensions
15.24 cm by 2.54 cm by 15.24 cm ( 6 x 1 x 6 in). Partitions work as catch
chambers. With the partitions to catch the exiting water, it is possible to infer
the one-dim ensional spatial d istribu tion of w ater flowing out of the test
section. A 15.24 cm by 43.18 cm (6x17 in) Acrylic plate w ith thirteen drain
valves was attached to the bottom of the box.
3.3 Instrumentation
Instrum entation w ithin the m edium consisted of two types of devices
that are placed in various locations on small positioning wires. The devices
in c lu d e capacitance elem ents for in fe rrin g m o istu re p resence, and
thermocouples for m easuring bed tem peratures.
E leven sm all-d iam eter 30 gauge (0.012") w ire chrom el-alum el
therm ocouples are located in specific places around the heater element, as
show n in Figure 5.
Capacitance elem ents are being developed in our laboratory for
m apping m oisture presence throughout the apparatus [Hansen, 1993]. Since
point m easurem ents are desired then capacitance elements are desirable

2 2
Inflow System
Main Experimental Tank
Outflow System
To city water
Ball Valve
Flow Distributor ( spray nozzles)
Instrument RakePorous mediaWAW
1" OD looow Firerod Heater •VA'Teflon
Ceramic
CollectionPartitions
DrainValves
Figure 4: Sketch of the m odified experimental apparatus system .( not to scale)

23
d ev ices that will differentiate betw een porous m edia conditions that are
unsa tu ra ted and saturated with liquid water. The idea for this sensor is to
d e tec t the presence of w ater through a change in capacitance of the
ex p erim en t m edia. The elem ents are m ade from sim ple duplex solid
conducto r w ire, small diam eter 24 gauge (0.056 in), w ith tips on one end
s trip p ed of insulation and the two wires epoxied on each side of a small
dielectric spacer as show n in Figure 6. The conductor for this w ire was a
copper conductor. The gap between the probe was reduced to less than .094
cm (.037 in) which is the size of the glass beads. A probe gap smaller than the
beads should minimize any interference from the porous m edium itself. Six
of these capacitance elem ent probes were built. The d istribu tion of these
devices is show n in Figure 7.
3.4 A ssem bly of the Experimental Apparatus
A platform to support the apparatus 53.34 cm (21 in) off the floor was
fabricated from wood. On top of the platform thirteen holes were drilled to
p o rt the outflow system drainage lines. The outflow system box was then
placed on the platform with the screen frame m ounted on top. N ext the test
cell box w as placed and sealed on the screen fram e by silicon. The
therm ocouple probes and capacitance elements w ere positioned on small
w ire on a U -shaped screen and placed inside the test cell box. An electrical
cartridge heater was then m ounted in the box. W ith all instrum entation
installed , the bed was packed w ith 0.094 cm (0.037 in) quartz beads. The
packing m ethod consisted of shaking and tapping the box w hile filling to

2 4
insure consistent bed porosity. Finally the square nozzles were m ounted on a
12.70 cm by 43.2 cm (5 x 17 in) plastic plate which was fitted on top of the
main test cell. The nozzles were then attached to the head tank by a set of
control valves, ball valve , and 1.91 cm (3 /4 in) PVC pipe. The test section
was insulated completely by 7.62 cm (3 in) thick polyurethane foam.
The system was connected to a Labview data acquisition program . This
program includes libraries of functions and developm ent tools designed
specifically for data acquisition and instrum ent control. More details of this
program are given in A ppendix II. This system also allows the ability to view
the data while it is being collected, as well as to save it for further processing.

25
r
jjWMSS B5?5jSSSH?5BSiftS
4"mmmmm
^SSSSSSmSSSS^mSSSi
Porous m edia •<
[4] f
Teflon
sjssssssmssss ssssssms ^
6"
2"
17"
Figure 5: Location of thermocouple placements inthe center plane of the bed via a front view of the apparatus.

2 6
DetailShownBelow
Not to scale
ga WireÉ M | m i i ] i i i l i i i ? i i i t ) i it i i i h i i h i i i ï ï i î iIM M IIIU IIM IIM IIM iM M IIM III IN M III
Glass Spacer
Side View
GlassSpacer
Epoxy
End View
Figure 6. Design of the capacitance elem ents used for determining moisture content.
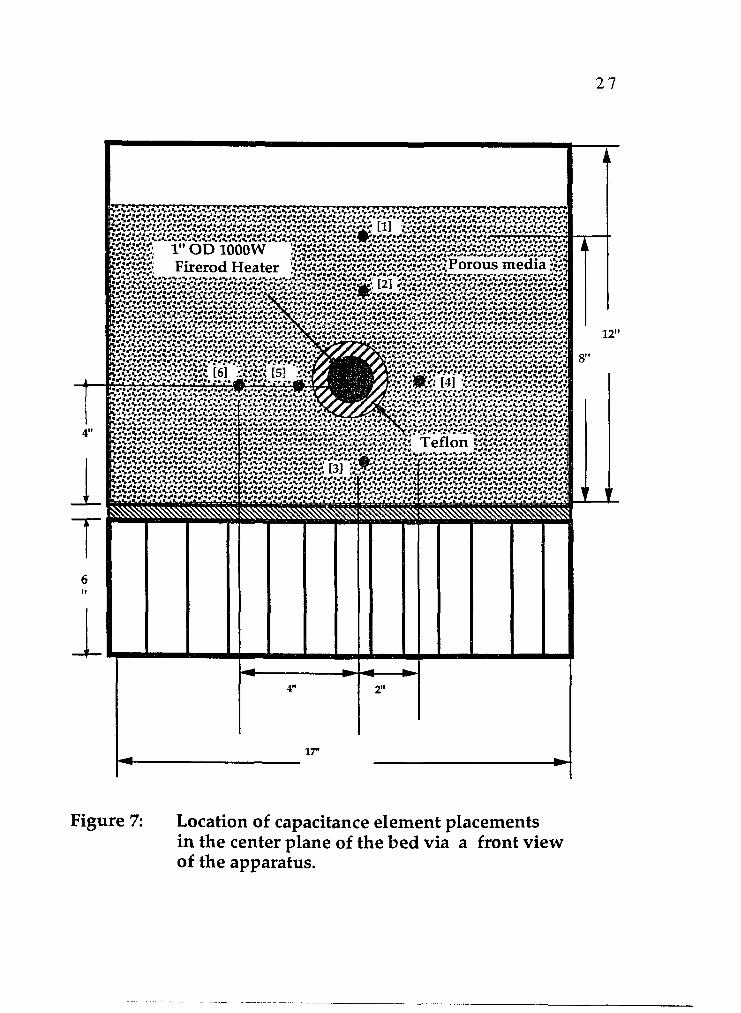
2 7
1" OD lOOOW Firerod Heater Porous media
î Teflon
Figure 7: Location of capacitance elem ent placementsin the center plane of the bed via a front view of the apparatus.

CHAPTER 4
OPERATION OF THE EXPERIMENT
4.1 Preliminary Procedure
The different instrum ents used in the experim ent w ere adjusted and
calibrated before the actual experim ental run. First, the inflow system was
ad justed and calibrated to insure a uniform flow in each nozzle. The
procedure involved an iterative process of adjusting the control valve until a
desirable flow was reached in each nozzle. Next the capacitance elem ents
w ithin glass beads were calibrated in both dry and fully saturated conditions
w ith liqu id w ater. The resu lts of these calibrations are show n in the
28
2 9
appendices. However, in order to calibrate these elements a circuit was built
to convert a capacitance reading into a voltage reading which was easier to
use w ith the data acquisition program . Finally, the relative perm eability of
the beads, which is a constant of p roportionality relating to the ease with
w hich a flu id passes th ro u g h a p o ro u s m ed ium , w as m easu red
experim entally. This was done using the falling head m ethod (a detailed
description is given in A ppendix III) by passing w ater through the m edium
and m easuring the associated head drop. The permeability was determ ined to
be 1.35 X 10'^^ m^ with 40% porosity.
Prior to packing the beads, the thermocouples and capacitance elements
w hich w ere to be located w ithin the bed w ere fixed in position and their
locations recorded. The therm ocouples and the sensors were placed in
approxim ately 5.08 cm (2 in) increm ents from the heater.
The complete experiment was run for several times w ithout the heater
on in order to see the distribution of the w ater exiting the test section. The
w ater collected in each partition w as m easured and recorded. The test cell
was unloaded and the wet quartz beads were dried. Then the bed was packed
w ith dry beads using the same packing m ethod as before to insure consistent
bed loading. The system was then ready for operation.
3 0
4.2 Operational Procedure
Once the test cell was loaded, the apparatus was ready for the next test.
The heater pow er was adjusted at the desired level to give the desired test
tem perature. The thermocouples and capacitance elem ents were connected
to the Labview data acquisition program and tu rned on. The program
recorded the tem peratures and m oisture sensor ou tpu ts at regu lar time
periods up to steady state. The system required 4-7 hours to reach steady state
conditions. Once steady state is established, the Labview program is changed
to record data every five seconds. Five m inutes later, the w ater is introduced
in a spatially-uniform , time varying m anner from a head tank above the
experim ent into the d ry bed. Then the system is allow ed to run to steady
state which took from 1-3 hours. After steady state is reached, the pow er was
turned off, the Labview program was stopped, and the data saved. The water
collected in the partitions of the outflow system was m easured and recorded.
It is w o rth no ting tha t the experim ental data was collected using the
apparatus in Figure 2 and the m odified apparatus show n in Figure 4. The
ap p ara tu s show n in Figure 2 was used to collect the tem peratu re field
inform ation w hile the apparatus in Figure 4 was used to determ ine the
m oisture content data. This way the results of the m oisture content can be
used to confirm the tem perature field results.

CHAPTER 5
EXPERIMENTAL RESULTS AND ANALYSIS
5.1 Temperature Profiles
The purpose of this experim ent w as to determ ine tem perature profiles
and m oisture migration as a function of time. Figures 8 through 10 show the
experim ental results for tem perature profiles obtained from the steady state
condition. A transient condition occurred for a certain period of tim e after
the w ater w as adm itted into the test section.
The tem perature of the 1000 W cylindrical cartridge heater was set to
app rox im ate ly 273 °C, w hich is the m axim um form ation tem perature
currently expected from nuclear w aste storage. The tem peratures w ithin the
3 1
3 2
bed exhibited the expected trends of linear tem perature profiles in the steady-
state condition. However, the heater pow er was controlled at 490 W to give
the steady state tem perature, which was recorded by thermocouple 7, of 274.0
°C, and 1.5 gal of water was adm itted into the bed during a 35 second time
period.
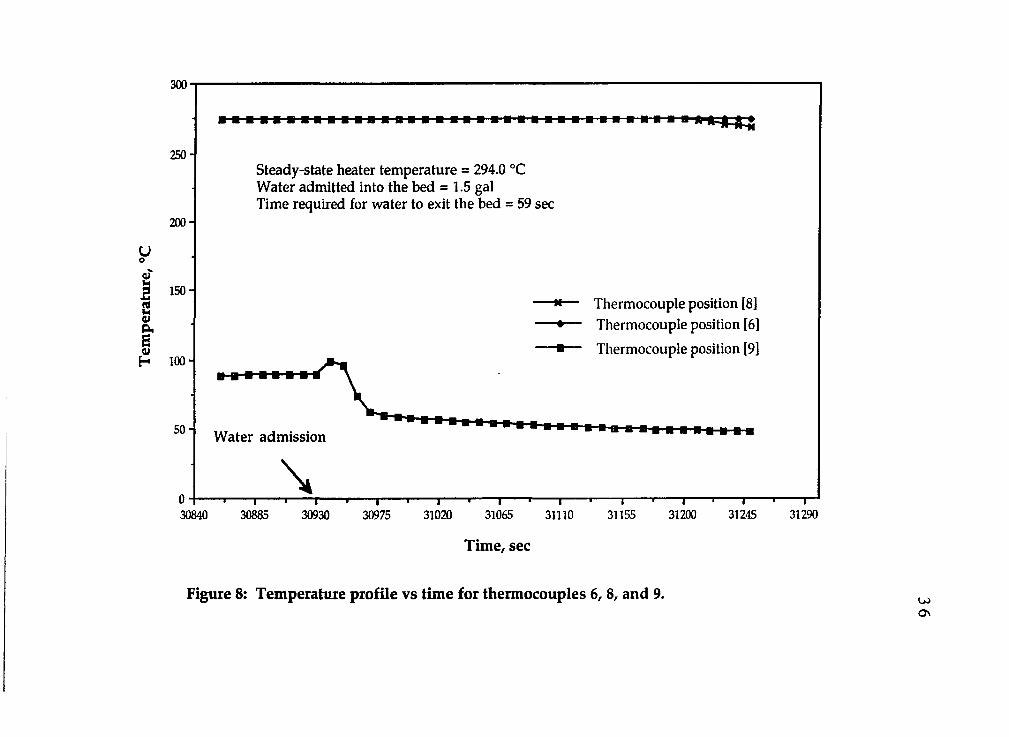
Figure 8 gives an example of the tem perature field obtained in the
vertical m edian plane of the heater w ith therm ocouples located as shown in
Figure 5. From the tem perature profiles obtained it appears that the heat
transfer is dom inated by conduction in the porous medium. Temperatures in
location 8 show a very small change which is an indication of that area being
a vapor region. At steady-state conditions the tem perature in location 9,
w hich is 10.16 cm (4 in) above the heater, is below the boiling point. As the
w ater reaches this location the tem perature takes a sharp drop and stays below
the boiling point. This indicates the effects of being saturated w ith liquid
w ater. Therefore the effects of boiling, vapor, and condensate flow are
apparen t in a line vertically through the heater area. Vapor is driven away
from the heater region (locations 6 and 8) to w here cooler tem peratures
(location 9) cause it to condense. This sets up a saturation profile. There is
essentially no tem perature variation in location 6 indicating there is no fluid
reaching this location.
The tem peratures on the horizontal line from the heater are shown in
F igure 9. Therm ocouple 7 w as at the top surface of the heater, and
thermocouples 4 and 10 were 5.08 cm (2 in) aw ay from the heater axis at each
33
side as show n in Figure 5. Thermocouples 10 and 11 were 10.16 cm (4 in)
aw ay from the heater. Thermocouples 7 and 10 show the steady state dry
tem peratures w ith apparently no water reaching this location. Accordingly, a
d ry-out region was developed closer to the heater due to the therm al shield
created by the high temperature field (274 °C). As the water flows toward the
heat source, boiling occurred, creating a v apor zone. C onsequently, the
tem perature at location 4 takes a slight dip bu t stayed above the boiling point
of w ater, which is an indication of presence of superheated vapor. However,
the straight line portions of the tem perature profiles in Figure 9 imply that
conduction is the dom inant heat transfer m echanism in these regions.
T em peratures in locations 1 and 11 show a sim ilar behavior w here the
tem perature takes a small increase sensing vapor before w ater reaches that
location. The high porosity of the m edium allow s the w ater vapor to travel
faster to this point than the liquid water. These tem peratures simply flatten
as sufficient time elapsed which is attributed to the condensate of the vapor
convecting heat away from the boiling zone.
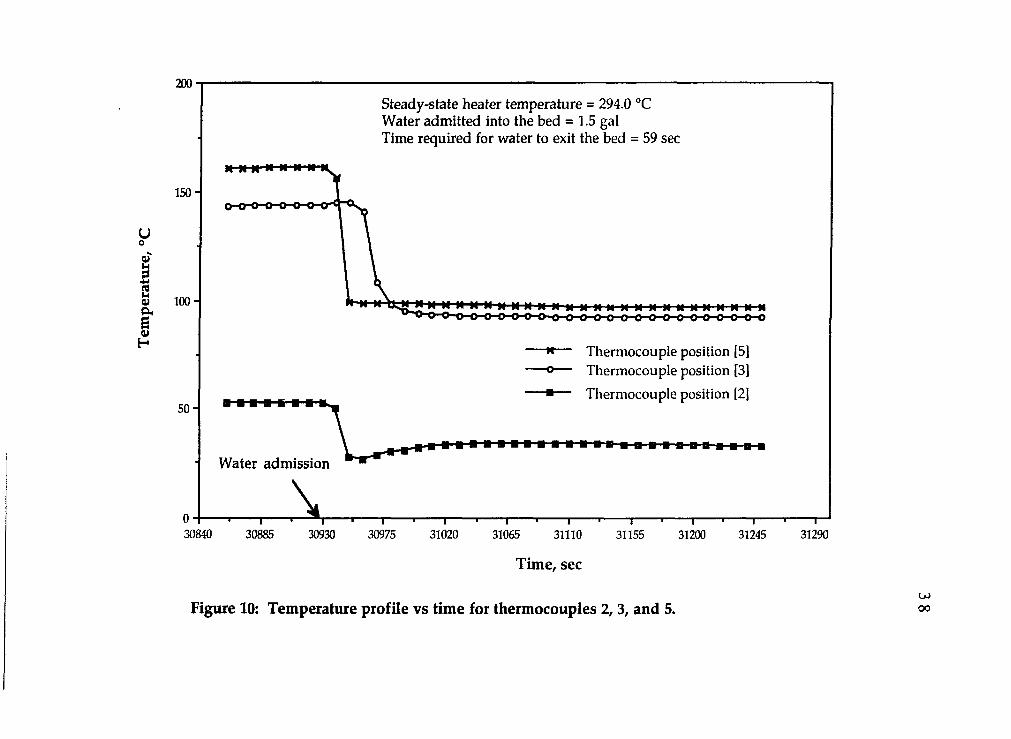
Figure 10 shows the tem perature profiles in the plane away from the
heater. As the water reaches positions 3 and 5 these tem peratures take a sharp
d ro p , and after a short time the tem peratu re profiles fla tten out. This
represents the effects of these thermocouples being bathed in the high heat
capacity fluid. The tem peratures at these positions indicated that the phase
change has occurred in this region. This region, which can be identified as a
m ixing zone, is located between the vapor zone (location 4) and the liquid
zone (locations 1 and 2). Here water is evaporated at the intersection with the
vapor zone and the vapor is condensed w ithin the mixing zone. The return

3 4
flow of condensate back toward the boiling region establishes a heat transfer
m echanism called the "heat pipe" effect. In the heat pipe region, the heat
transfer mechanism is driven by the convection of latent heat. Therefore, the
flattening of the tem perature profile in Figure 10 is prim arily attributed to the
heat pipe effect. Thermocouple 2 is located in the liquid zone because the
tem perature there takes a small drop w hich indicates the effects of being
sa tu ra ted w ith liquid water. Since therm ocouple 2 is located in a cooler
region of the bed w ater vapor condenses and deposits its latent heat of
vaporization there. This is indicated by the jum p in the tem perature profile
at that point.
Figure 11 schematically sum m arizes the results recorded in the water's
infiltration period during the experim ental run. These conditions were
clearly visualized by looking through the transparen t front wall of the test
cell. Visual inform ation was attained by distinguish ing betw een the liquid
regions (darker contrast) and the dryer regions (lighter contrast). This visual
inform ation was supported by the experim ental results which show that the
heater is surrounded by a dry zone in w hich heat transfer was undoubtedly
dom inated by conduction. Accordingly, h igh rate heating was capable of
driving steam away from the heat source faster than the rate which liquid can
flow tow ard the heat source, thereby causing a dry-out zone to form. At some
distance away, a two-phase zone, the heat-pipe region, m ay be present, where
the vapor and liquid are mixed. In the heat-pipe region heat flow is primarily
convective. Beyond the two-phase zone a liquid region is present which is
dom inated by conductive heat transfer, w here tem peratures are too low for
evaporation or for the heat-pipe effect to occur.

35
The results of this study were in good agreem ent w ith the numerical
and semi-analytical results presented by Pruess et al.[1988]. In their study a
m odel of mass and energy transport was used to develop semi-analytical
solutions for tem perature, saturation fields, and pressure around the heat
source. The study results show three domains may exist around a cylindrical
heat source em placed in a partia lly satu ra ted form ation: a conduction
dom inated inner vapor zone, a tw o-phase zone, and a liqu id outer
conduction zone. A lso com parisons w ith the p rev io u sly repo rted
experim ental studies of Udell et al. [1985] and Cioulachtjian et al. [1989]
indicate an agreem ent betw een their results and experim ental results
reported here. Accordingly, these results confirm U dell's, Pruess's, and
Cioulachtjian's findings that under steady-state conditions, three distinct
regions may appear around the heat source in porous media.
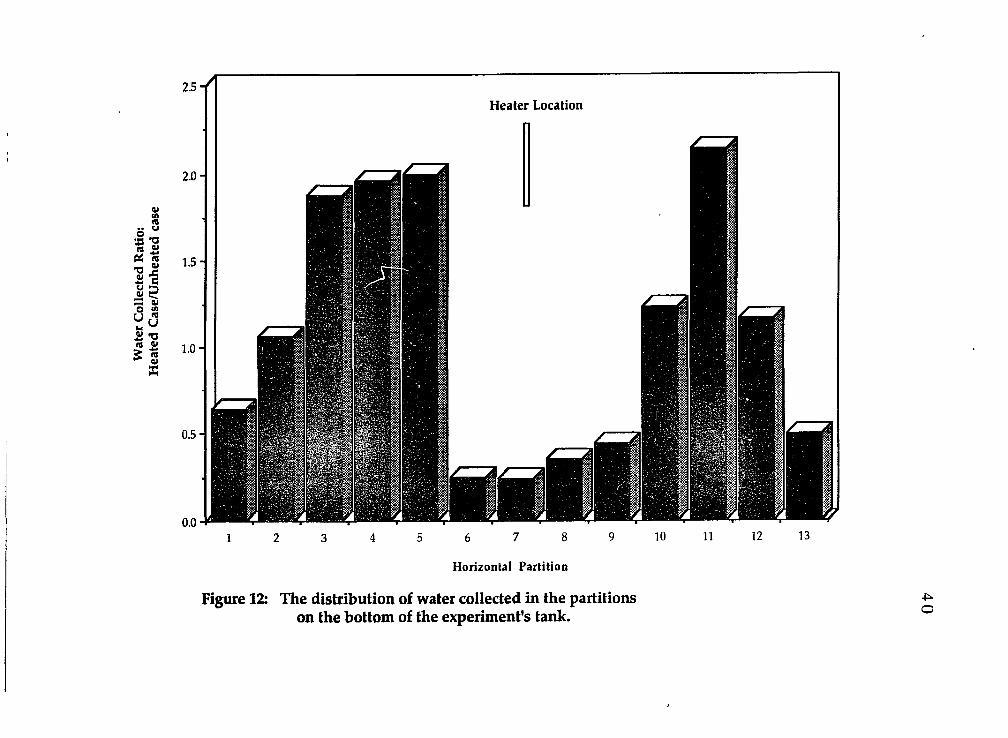
Finally, the distribution of w ater collected in partitions on the bottom
of the experim ent's test cell is shown in Figure 12. The result in Figure 12
shows the ratio (heated case over unheated case) of the am ount of water
collected in each partitio n at the end of experim ental run . Several
characteristics are to be noted. It is apparent there is some water deficiency
under the heater location which is attributed to divergence of the w ater
around the heater. W ater is decreased by 70-77% in partitions 6, 7, and 8 and
56% in partition 9. In contrast, partitions 2, 3, 4, 5, and 11 show an increase of
47-53%. A nother item of significance is that the w ater collection is not
symmetrical which is attributed to chaimeling that occurs due to packing the
y
II
300
250-Steady-state heater temperature = 294.0 °C Water admitted into the bed = 1.5 gal Time required for water to exit the bed = 59 sec
200 -
Thermocouple position [8] Thermocouple position [6] Thermocouple position [9]
100
50- Water admission
30840 30885 30930 30975 31020 31065 31110 31155 31200 31245
Time, sec
31290
Figure 8: Temperature profile vs time for thermocouples 6, 8, and 9. wOn

300
250-Steady-state heater temperature = 294.0 °C Water admitted into the bed = 1.5 gal Time required for water to exit the bed = 59 sec
200 -
U Thermocouple position [1] Thermocouple position [4] Thermocouple position [7] Thermocouple position [10] Thermocouple position [11]
sSrH
150-
100-
50-Water admission
30840 30885 30930 30975 31065 3124531020 31110 31155 31200 31290
Time, sec
Figure 9: Temperature profile vs time for thermocouples 1,4, 7,10, and 11. w<1
uoCJ
ÎAIH
200
Steady-state heater temperature = 294.0 °C Water admitted into the bed = 1.5 gal Time required for water to exit the bed = 59 sec
150-o-o-o-o-o-o
100 -
Thermocouple position [5] Thermocouple position [3]Thermocouple position [2]
50-
Water admission
30840 30885 30930 30975 31020 31065 31110
Time, sec
31155 31200 31245
Figure 10: Temperature profile vs time for thermocouples 2,3, and 5.
31290
OJ00

3 9
C O '
m
I I
IIi l
1 1
Jn l iU
Heater Location
6 7 8
Horizontal Partition
Figure 12: The distribution of water collected in the partitions on the bottom of the experiment's tank. o

4 1
bed w ith instrum entation present. A final item of note is th a t differences
between cases are always seen. This is due to the repacking of the bed that
m ust occur each time. Note that repacking of the bed m ust occur both in the
heated and unheated cases if w ater is admitted.
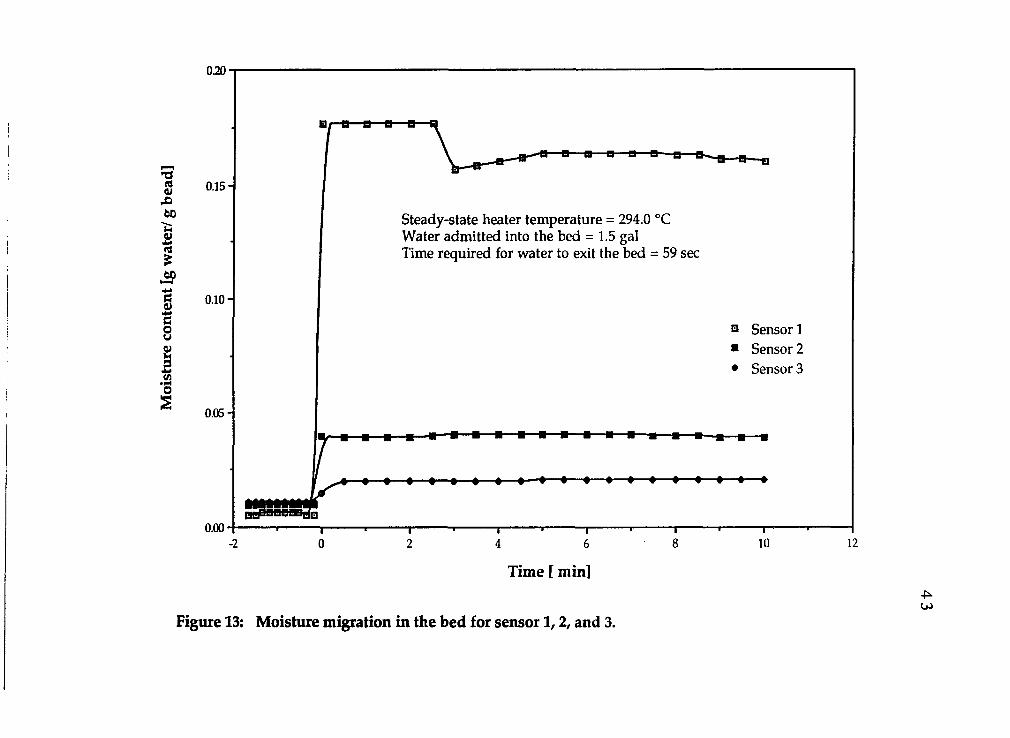
5.2 Moisture Migration Profiles
M oisture m igration in the bed was m onitored using capacitance
elem ent sensors as a function of time. The results are depicted in Figure 13
through 14. Each figure consists of three plots that show the m oisture profile
in vertical and horizontal locations in the bed. The results show n here are
for the system w hen it reaches steady state conditions and the w ater was
sprayed on the bed. It is im portan t to notice that the m oisture content in
these figures represents the ratio of mass of w ater to mass of dry beads w here
zero is a dry condition and 0.174 is a fully saturated condition.
Figure 13 show s sam ple results for the sensors located in the vertical
m edian plane of the heater. These sensors were placed in approxim ately 5.08
cm (2 in) increm ents from the heater axis as shown in Figure 7. The sensor in
location 1 show s a m oisture content change from dry to fu lly sa tu ra ted
conditions w hen the w ater is adm itted to the bed. As tim e p rogress, the
m oisture profile takes small drop which is an indication of the w ater drain
ou t of the test cell. The saturation level stays high in this location which
confirms the tem perature profile result m entioned above as being in a liquid
4 2
region. W hen the sensor in location 2 indicates the liquid front has arrived,
it takes a slight jum p but stays in the low saturation region. This m ight be
attributed to be in the vapor region as shown in Figure 11. Finally the
location 3 m oisture profile is shown to be in a dryer region which is a good
indication of being in a dry-out zone as is confirmed by the tem perature
results.
The profiles of m oisture content indications in a horizontal line are
shown in Figure 14. The sensor in location 4 shows a quicker jum p and a
settling in the in term ediate saturation region. The m oisture profile in
location 4, w hich is located in the vapor zone, shows a series of cycling
patterns. Such a cycling pattern is attributed to cyclic evaporation phases
where the vapor flows away from the heat source and the condensate returns
back tow ard the heat source. Location 5 shows a small m oisture change
profile. This represents the possibility that the location is in a dry-out zone.
Finally location 6 shows the expected trend of a sharp increase to fully
saturated conditions since it is in a region far away from the heater. As time
progresses the m oisture profile takes a small dip which is due to drainage of
water into the partitions of the outflow system.
By exam ination of the behavior of sensors 2, 3, 4, and 5 an im portant
observation can be made. It can be seen that the distribution of m oisture was
not radially symmetric relative to the heater axis. This might be attributed to
uneven packing of the bed with instrumentation.
0.15-
W) Steady-state heater temperature = 294.0 °C Water admitted into the bed = 1.5 gal Time required for water to exit the bed = 59 sec
0.10-
Q Sensor ■ Sensor ♦ Sensor
0.05-
0.008 10 12-2 0 2 4 6
Time [ min]
Figure 13: Moisture migration in the bed for sensor 1 , 2, and 3.u>

Steady-state heater temperature = 294.0 °C Water admitted into the bed = 1.5 gal Time required for water to exit the bed = 59 sec
0.15-
0OD Sensor
I SensorSensor
0.1 0 -
0.05-
0.00-2 0 2 8 124 106
Time [mini
Figure 14: Moisture migration in the bed for sensor 4, S , and 6.

CHAPTER 6
SUMMARY AND CONCLUSION
This study exam ined the impact of therm al conditions on fluid flow in
an unsa tu ra ted porous m edium . Most of the attention in this w ork was
focused on the tem perature field and m oisture content profiles in the near
field of a horizontal cartridge heater. This illustrated the basic effects of the
heat source on the m ovem ent of w ater and energy in unsa tu ra ted porous
media. In general, the fluid flow is influenced the tem perature field through
the form ation of a heat p ipe and creation of a boiling zone. The heat
convective effects in the heat pipe region have a local, transient effect on the
tem perature d istribu tion and m oisture change. H ow ever, the increase in
tem perature induces evaporation and vapor transport aw ay from the heat
source region w hich results in the developm ent of a d ry zone surrounding
the heat source and increased liquid saturation levels aw ay from the heater ,
due to condensation.
4 5
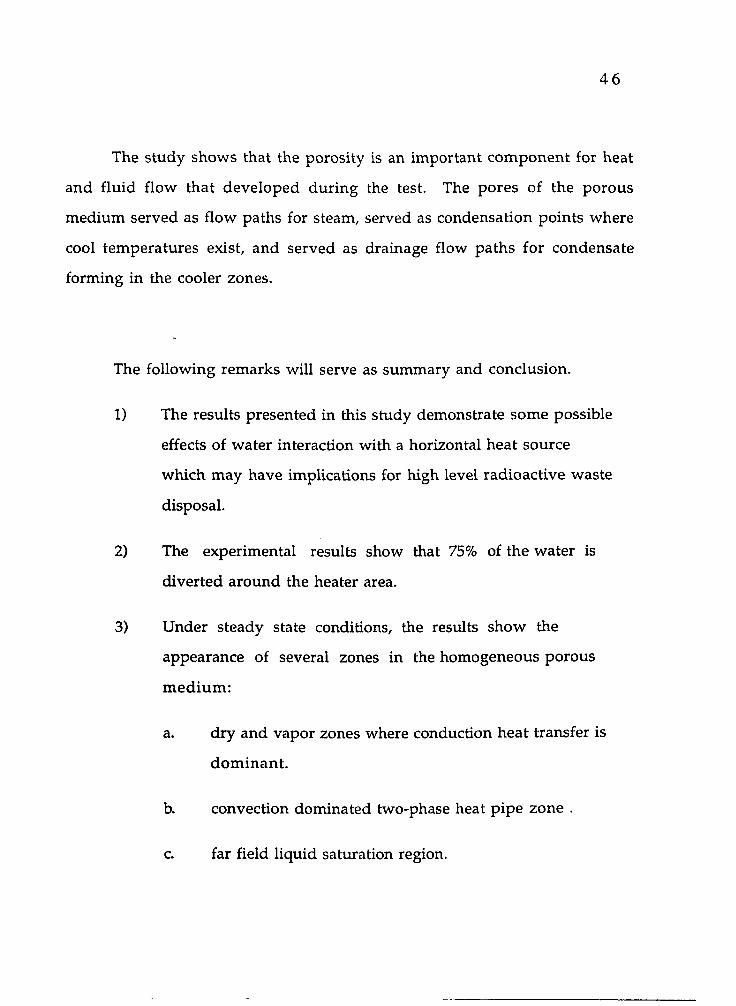
4 6
The study show s that the porosity is an im portant com ponent for heat
and flu id flow that developed during the test. The pores of the porous
m edium served as flow paths for steam, served as condensation points w here
cool tem peratures exist, and served as drainage flow paths for condensate
form ing in the cooler zones.
The following rem arks will serve as sum m ary and conclusion.
1) The results presented in this study dem onstrate som e possible
effects of w ater interaction with a horizontal heat source
w hich m ay have implications for high level radioactive waste
disposal.
2) The experimental results show that 75% of the w ater is
diverted around the heater area.
3) U nder steady state conditions, the results show the
appearance of several zones in the hom ogeneous porous
m ed ium :
a. dry and vapor zones where conduction heat transfer is
dom inan t.
b. convection dom inated two-phase heat pipe zone .
c. far field liquid saturation region.
4 7
4) The results of this study resemble a degree of agreem ent w ith
the experimental results of Udell and Cioulachtjian et al.,
and the numerical results of Pruess et al. presented in the
literature survey.
Future w ork can be done to im prove the experim ent in several areas.
First, from the p rio r w ork in this general area, it is ap p a ren t that the
perm eability (and thus the porosity) of the m edium play an im portan t role in
the outcom e of the results. Therefore, experimental w ork needs to be done
using a range of porous m edia w ith different permeabilities (and porosities).
Also the experim ent can be run w ith a range of tem peratures instead of one
tem pera tu re to determ ine the effect of this im portant variable. Finally,
im provem ent of the inflow system should be done to in su re consistent
uniform ity of the input spray.

CHAPTER 7
BIBLIOGRAPHY
Buscheck, T. A., and Nitao, J. J., 1993, "THE ANALYSIS OF REPOSITORY- HEAT DRIVEN HYDROTHERMAL FLOW AT YUCCA MOUNTAIN," Proceedings of the Fourth Annual International High Level Radioactive Waste Managemeyit Conference, ANS/ASCE, pp. 847-867.
Buscheck, T. A., Wilder, D. G., and Nitao, J. J., 1993, "LARGE-SCALE IN SITU TESTS FOR HYDROTHERMAL CHARACTERIZATION AT YUCCA MOUNTAIN," Proceedings of The Fourth Annual International High Level Radioactive Waste Management Conference, ANSIASCE, pp. 1854-1872.
Buscheck, T. A., and Nitao, J. J., 1994, "THE IMPACT OE BUOYANT, GAS- PHASE FLOW AND HETEROGENEITY ON THERMO- HYDROLOGICAL BEHAVIOR AT YUCCA MOUNTAIN," Proceedings of The Fifth Annual International High Level Radioactive Waste Management Conference, ANS/ASCE, pp. 2450-2474.
4 8

4 9Cioulachtjian, S., Tadrist, L., Occelli, R., Santini, R., and Pantaloni, J., 1989,
"HEAT TRANSFER IN POROUS MEDIA CROSSED BY A FLOWING FLUID," Physicochemical Hydrodynamics, PCH, 11(5), pp. 671-679.
Doughty, Christine, and Pruess, K., 1988, "A SEMI ANALYTICAL SOLUTION EOR HEAT-PIPE EFEECTS NEAR HIGH-LEVEL NUCLEAR WASTE BURIED IN PARTIALLY SATURATED GEOLOGICAL MEDIA," International J. Heat and Mass Transfer, 31(1), pp. 79-90.
Doughty, Christine, and Pruess, K., 1990, "A SIMILARITY SOLUTION FOR TWO-PHASE FLUID AND HEAT FLOW NEAR HIGH-LEVEL NUCLEAR WASTE PACKAGES EMPLACED IN POROUS MEDIA," International J. Heat and Mass Transfer, 33(6), pp. 1205-1222.
Gomaa, E. E. , and Somerton, W. H., 1974, "THERMAL BEHAVIOR OF MULTIFLUID-SATURATED FORMATIONS PART II: EFFECT OF VAPOR SATURATION HEAT PIPE CONCEPT AND APPARENT THERMAL CONDUCTIVITY," SPE Paper 4896-B, Proc. Society of Petroleum Engineers California Regional Meeting, San Francisco.
Hanson, Eric M., 1993, "SIMPLE MEASUREMENT OF SATURATED SOIL CONDITIONS," Senior Design Report, Department of M echanical Engineering, UNLV.
Ho, Clifford K., Marki, K. S., and Glass, R. J., 1994, "STUDIES OF NON- ISOTHERMAL FLOW IN SATURATED AND PARTIALLY SATURATED POROUS MEDIA," Proceedings of The Fifth Annual International High Level Radioactive Waste Management Conference, ANS/ASCE, pp. 2450-2474.
Izzeldin, A bdullah A., Hanson, E., and Boehm, R. E., 1994,"UNSATURATED ELOW EXPERIMENT WITH PHASE CHANGE THE HEAT PIPE EFFECT," Proceeding of The Fifth Annual

5 0
International High Level Radioactive Waste Management Conference, ANS/ASCE, pp. 2450-2474.
Izzeldin, Abdullah A., Chen, Yi-Tung, and Boehm, R. P., 1995, " HEAT TRANSEER WITH PHASE CHANGE IN UNSATURATED FLOWS,” Accepted for the Fourth ASME/JSME Thermal Engineering Joint Conference.
LabView for Windows, 1992, "User Manual," National Instrum ents, Austin, Texas.
Liu, C., and Evett, J., 1990, Soil Properties, Second Edition, Prentice Hall, Inc., N ew Jersey.
Ogniewicz, Y., and Tien, C. L., 1979, "ANALYSIS OF THE HEAT PIPE PHENOMENON ON POROUS MEDIA," AIAA 14th Thermophysics Conference.
Pollock, D. W., 1986, "SIMULATION OF FLUID FLOW AND ENERGY TRANSPORT PROCESSES ASSOCIATED WITH HIGH-LEVEL RADIOACTIVE WASTE DISPOSAL IN UNSATURATED ALLUVIUM," Water Resources Research, 22(5), pp. 765-775.
Pruess, K., Tsang, Y. W., and Wang, J. S. Y., 1985, "MODELING OE STRONGLY HEAT-DRIVEN ELOW IN PARTIALLY SATURATED FRACTURED POROUS MEDIA," Proceedings of The 17th International Congress on The Hydrogeology of Rocks of Low Permeability, lAH, pp. 486-497.
Su, Ho-Jeen, and Somerton, W. H., 1979, " THERMAL BEHAVIOR OE FLUID SATURATED POROUS MEDIA WITH PHASE CHANGES," Proceedings of the 16th hiter^iational Thermal Conductivity Conference, pp. 193-204.

5 1
Udell, Kent S., 1985, " HEAT TRANSFER IN POROUS MEDIACONSIDERING PHASE CHANGE AND CAPILLARY- THE HEAT PIPE EFFECT," International J. Heat and Mass Transfer, 28(2), pp. 485-495.
Udell, Kent S., 1983, "HEAT TRANSEER IN POROUS MEDIA HEATED FROM ABOVE WITH EVAPORATION, CONDENSATION, AND CAPILLARY EFFECTS," International J. Heat and Mass Transfer,105(3), pp. 485-492.

APPENDIX I
Capacitance Element Calibrations
The m oistu re sensors used in this experim ent are a so lid state
capacitive type w hich w ere built in our laboratory. These sensors w ork w ith
sensing th e changes of m o istu re by conductance, re su ltin g in linear
capacitance changes as a function of moisture content.
C apacitance elem ent sensors can easily be in terfaced to a data
acquisition system by converting the capacitance read ing in to a voltage
output. F igure 15 shows the schematic diagram of the capacitance to voltage
converter circuit. The circuit features the use of an op era tio n a l cmos
am plifier (ICL 7556) and precision instrum entation capacitors and resistors.
The circuit requires a 2.5 V DC input. This design will m aintain excellent DC
accuracy d o w n to m icro-volts. The circuit ou tpu t was connected to the
Labview data acquisition system for automatic monitoring.
52

+2.5 V +2.5 V+2.5 V+2.5 V.5V
lOOK65K:
Ul/A Ul/B0.1 }iF
DIS DISlÜK7556 755610 M CAPACITANCE
ELEMENTSSENSOR
TRG cm OUTTRG
eu euTHR THR
220 pF
10 K
:= 10 pF
Figure 15: Schematic diagram of capacitance-to-voltage converter circuit for the use w ith the capacitance element sensors.
LnOJ
5 4
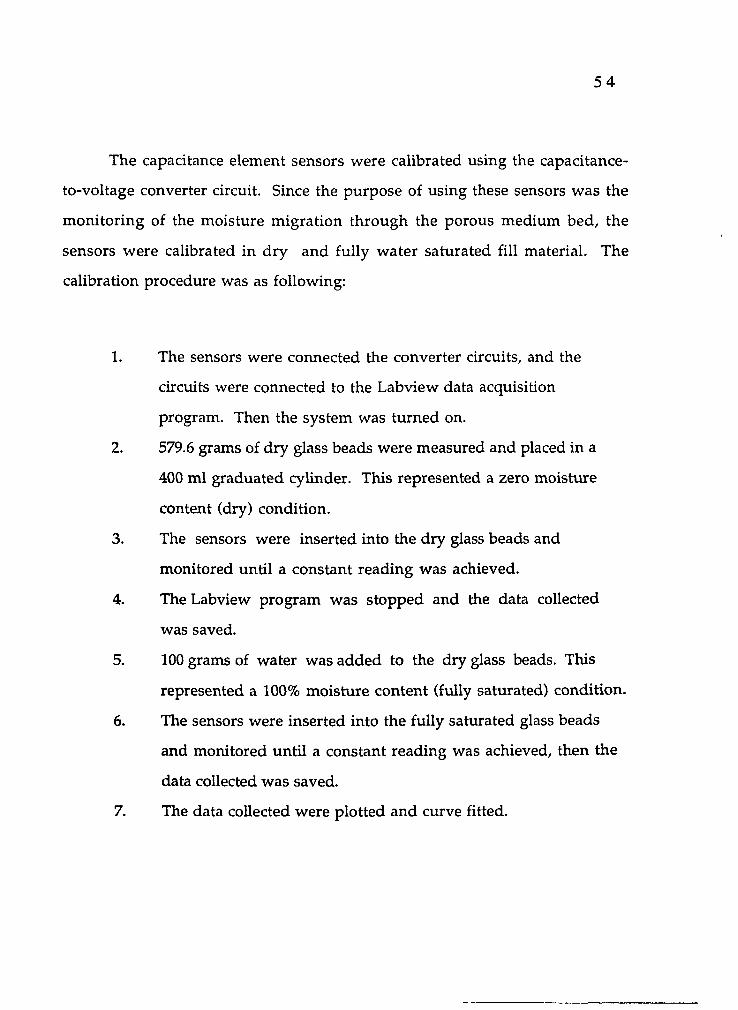
The capacitance element sensors were calibrated using the capacitance-
to-voltage converter circuit. Since the purpose of using these sensors w as the
m onitoring of the m oisture m igration th rough the porous m edium bed, the
sensors w ere calibrated in d ry and fully w ater saturated fill material. The
calibration procedure was as following:
1. The sensors were connected the converter circuits, and the
circuits were connected to the Labview data acquisition
program. Then the system was turned on.
2. 579.6 grams of dry glass beads were m easured and placed in a
400 ml graduated cylinder. This represented a zero moisture
content (dry) condition.
3. The sensors were inserted into the dry glass beads and
m onitored until a constant reading was achieved.
4. The Labview program was stopped and the data collected
was saved.
5. 100 grams of w ater was added to the dry glass beads. This
represented a 100% m oisture content (fully saturated) condition.
6. The sensors were inserted into the fully saturated glass beads
and m onitored until a constant reading was achieved, then the
data collected was saved.
7. The data collected w ere plotted and curve fitted.

55
Figures 16a through 16f show the results of the sensor calibrations.
The ratio of the moisture content (mass of w ater over mass of glass beads) in
these figures was plotted versus the voltage reading and curve fitted using a
first order polynomial equation. The resulting equation was used in the data
collected from the experim ental run to generate the m oisture content plot.

5 6020
y= - 3.6330e-2 + 8.6500e-2x
0.15-
IaS
0 .1 0 -
a5.2os
0.05-
0.000 31 2
Sensor reading [veils]
Figure 16a : Calibration of capacitance element [sensor 1].
0.20
y= - 2.78710-2 + 8.3696e-2x
3t o 0.15 -
a
0.1 0 -II • II 0.05-
I0.00
0 321
Sensor reading [volts]
Figure 16b : Calibration of capacitance element [sensor 2].

5 70.20
y= -2.1217e-2 + 8.1604e-2x
M) 0.15 -
0.1 0 -
0.05-
0.000 321
Sensor reading [volts] Figure 16c : Calibration of capacitance element [sensor 3].
y = - 3.28910-2 + 8.5432e-2x
sA60 0.15 -
S60
0.10 -
III 0.05-
0.0030 21
Sensor reading [volts]
Figure 16d : Calibration of capacitance element [sensor 4].

5 8
y= - 2.9438e-2 + 8.4349e-2x
0 .1 0 -II ■3 0.05- «
I0.00
0 2 31
Sensor reading [volts] Fignrel6e : Calibration of capacitance element [sensor 5].
y= -1.99376-2 + 8.0390e-2x
CtO0 .1 0 -
(o 0.05 -
0.0030 21
Sensor reading [volts]
Figure 16f : Calibration of capacitance element [sensor 6].
APPENDIX II
Labview Data A cquisition
LabView is a program developm ent applications package which uses a
graphical program m ing language to create program s in block-diagram form
instead of text-based languages (that create lines of code). In addition LabView
is a general purpose program m ing system that includes libraries of functions
an d developm en t tools designed specifically for data acquisition and
in stru m en t control. LabView program s are called "virtual instrum ents"
because their appearance and operation im itate actual instrum ents. A virtual
instrum ent is a software construction that has the characteristics of an actual
in stru m en t. The program has two m ain functions that are com bined
together for the program to work. These functions are an interactive user
interface which is called a front panel and receiver instructions know n as a
block diagram . The front panel is a p rogram representing an assem bly of
electronic com ponents that perform the v irtual instrum ent functions, and a
5 9
6 0
calling interface for com m unication w ith other v irtual instrum ents. The
block diagram is the v irtu a l in stru m en t source code w hich contains
in p u t/o u tp u t, com p u ta tio n a l, and sub -v irtua l in stru m en t com ponents
interconnected by wires directing the flow of data.
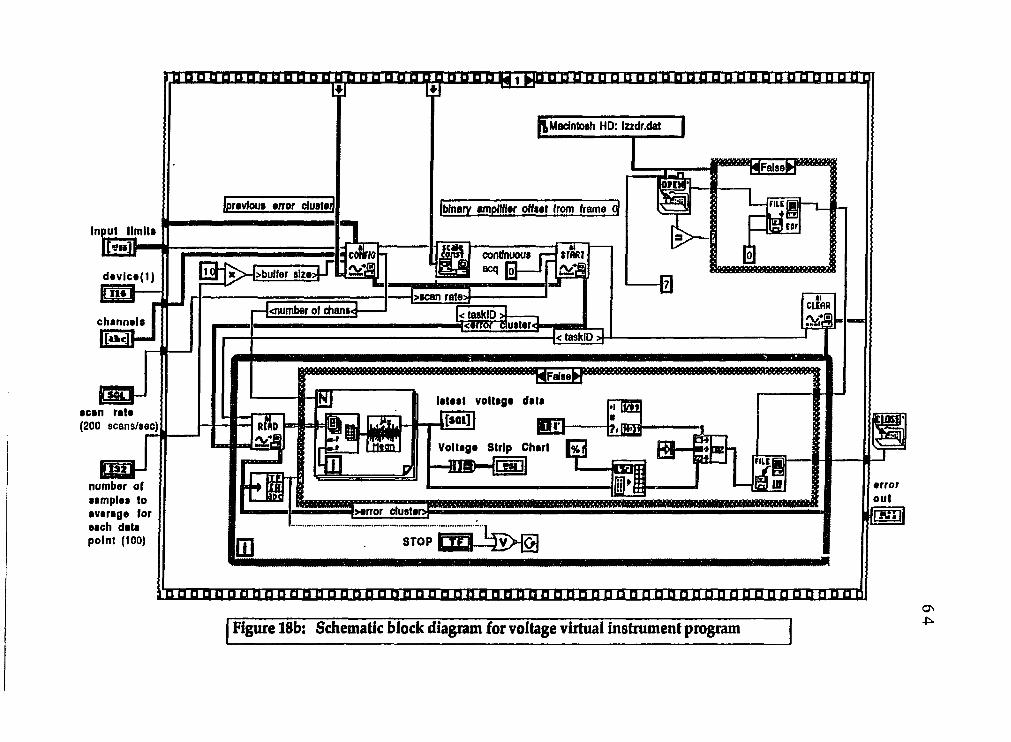
T herm ocoup le a n d v o ltag e v irtu a l in s tru m e n t p rog ram s are
developed to collect data from the experim ental apparatus. These program s
acquire data from an SCXI-1100 (Signal C ond ition ing ex tension for
Instrum entation), linearize it, and save it into a file. SCXI-1100 is a high
perform ance, signal cond ition ing and data acquisition system that can
accom m odate 32 differential channels. SCXI-1100 is a m odule for signal
conditioning of therm ocouples, volt, and millivolt sources. Figures 17 and 18
show schem atic d iag ram s for the therm ocouple p rogram and voltage
program , respectively.

device(l)
channels(sc11 mdl 10:15)
scl I mdl 10:10
offset channel (sol calgnd)
idl
scl I mdl I calgndcold junction channel (sc Imdl I mtemp)
scl I mdl I mtempnumber of samples to aveijage for each data point(IOO)
200
scan rate(100 scans/sec)
g |40.0
Input limits (+0.001V to -0.001V)
I D
thermocouple type (J)
K
Interchannel Delay in seconds (20 usees)
20.0E-6
String Written to file21:39:03 75.8406 75.845345 75.856743 75.866570 75.877975 75.883865 75.899200 75.908638 75.921608 75.931435 75.934975
[latest temperature data ] [STOP
I channel] gO
Iugh limitj liDw llmil0.010 i -0.010
75 8errorout
code source
ERROR -10846 1 [Analog Input Buffer Read |
Figure 17 a: Schematic front panei for thermocoupie virtual instrument program.ON

|device(lj)
| î ^channels(s|:
•Hinput limits[5ns]
interchanne Delay in
11 ij !J U U L ll! L i.U iJ .lli n i l I II n i l U-U !-! 1 ' 11 1 \ U 2 WU 1 ! previous error clusterjLJJ l±) mjblnary amplifier olrsei] '
I I I I I I I I ! I I I I I I ! I [ LI I I I I I I I I I I I I I I I I I I I I IEnter file name c \excel\lesf.dat
I ,*V ru^
oVcmI>lnterchannel Delay
— >scan rale>|<numberof ctians<
<error cluster<< laskID >
scan rate
fefring Written to filenumber of sam ples to
erroroutII
CLEflRMean
>error cluster>
thermocouple type (j||sTop|f-fr
g j |cold junction temp (ambient temp) [[ 1 1 I I 1 1 1 1 1 1 1 I I 1 1 I I 1 1 1 1 1 1 I I 1 1 1 1 1 ! 1 1 1 1 1 1 1 1 1 1 1 1 1 1 i i i i I I 1 1 1 1 1 1 1 1 1 1 1 1 1 1 1 1 i i f [ 1 1 I I I I 1 1 1 ! I i I I 1 1 1 1 I I
Figure 17b: Schematic block diagram for thermocouple virtual Instrument program.ONK)

device(l)
channels (obO I scl I mdl I 0:3)
bbO ! scl I mdl 10:5
offse t channel(obO I scl I mdl I calgnd)
obO I scl I mdl I calgnd
Strip Chart
" S .
num ber of sam ples to average for eaCh data point
I200
scan rate
<1 0.04
4 0.02
RH3 Id
RH4 Id
RH5 d
1
11 0 0~ 1
) 14
la te s t vo ltage data S T O P
(200 scans/sec) RH6 |d 0.02 "T jchanneipo | L n a i3 2 0 .0 I
e rro rInput limits (no change) o u t
E high limit low limit
113.000 I r — IEcode source
Figure 18a: Front panel for voltage virtual instrument programOvU)
Input limit#
•ca n rat#(200 scan s/iec )
number of •am ple# to average tor each datapoin t (100)
B n a n n n n n p t n j B p g n o o n o o i g o h n in i h t h h b itttb n n a n n cm b gTTPPtrn n btth o o o
Madntoeh HD: lzzdr.dat
loreWou# error du»teH Iblnaty amplifier off#at from Ira m e q
continuous acq>buller sized a v lc e ( l )
>#can rate)— («number of chans ctasklD
[« iro rauste r< task D >
la tes t v o ltage data
B DV oltage Strip Chart
>error duster*
STOP
□ Ü B B Ü □ n il n a tjn □ P n □ □ □ □ B B B B B B B B BB'P B B B B B B B B ü ü b a n Ü D d ü B n a a ü n n ü d
Figure 18b: Schematic block diagram for voltage virtual instrument programG \4:

APPENDIX III
Coefficient of Permeability via the Falling-Head Method
Permeability generally relates to the propensity of a porous m edium to
allow w ater to move through its void spaces. According to Darcy's law, the
flow rate of water q th rough a porous m edia of cross-sectional area A is
directly proportional to the im posed gradient (slope) i, or q = kiA. The
constant k is known as the coefficient of perm eability which indicates the ease
w ith w hich a fluid passes th ro u g h a porous m edium . The falling head
m ethod is one of the general laboratory m ethods that is available for
determ ining the coefficient of perm eability of a porous m edia directly. The
coefficient of perm eability is necessary to determ ine the time for fluid to
travel between two points. This m ethod is accurate to w ithin about one order
of m agnitude.
6 5
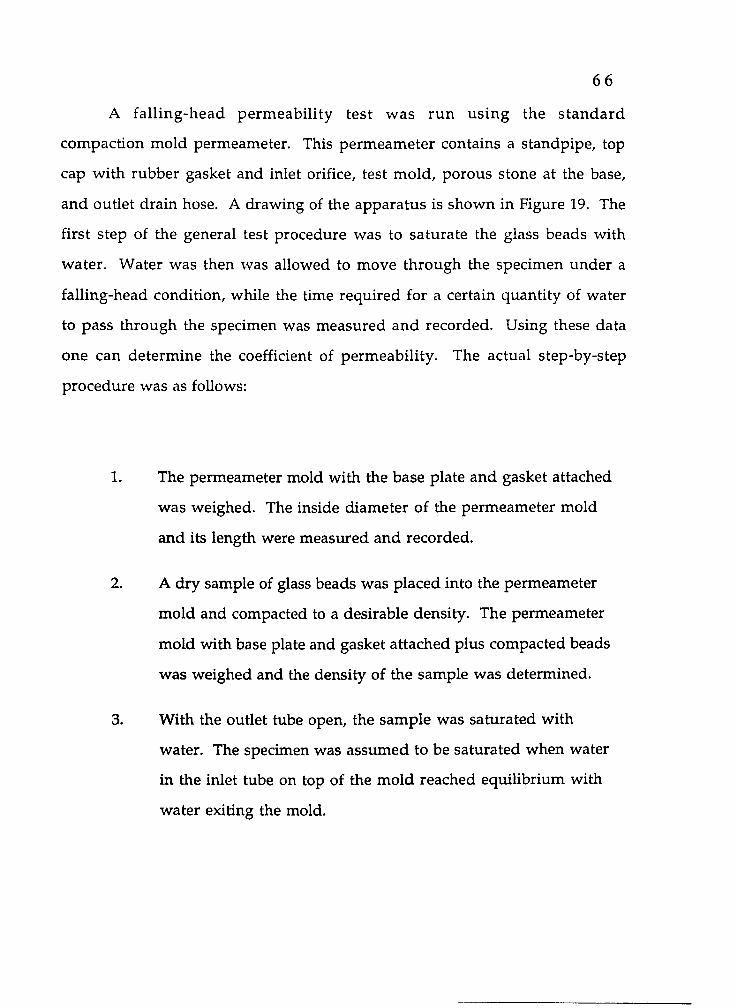
6 6
A fa lling -head perm eability test w as ru n using the s tan d a rd
com paction m old permeameter. This perm eam eter contains a standpipe, top
cap w ith rubber gasket and inlet orifice, test m old, porous stone at the base,
and outlet drain hose. A drawing of the apparatus is show n in Figure 19. The
first step of the general test procedure was to saturate the glass beads with
w ater. W ater was then was allowed to move through the specimen under a
falling-head condition, while the time required for a certain quantity of water
to pass through the specimen was m easured and recorded. Using these data
one can determ ine the coefficient of perm eability. The actual step-by-step
procedure was as follows:
1. The permeameter mold w ith the base plate and gasket attached
was weighed. The inside diam eter of the perm eam eter mold
and its length were m easured and recorded.
2. A dry sample of glass beads was placed into the permeameter
m old and compacted to a desirable density. The permeameter
m old with base plate and gasket attached plus compacted beads
was weighed and the density of the sample was determined.
3. W ith the outlet tube open, the sam ple was saturated with
water. The specimen was assum ed to be saturated when water
in the inlet tube on top of the m old reached equilibrium with
w ater exiting the mold.

6 7
A
Ring stand
Cap and inlet , orifice P
Standpipe
Porous stone
Test mold
O utlet drain tube
Figure 19a : Sketch details of the falling-head test apparatus.

6 8
Cap
Inlet orifice
Gasket
Pan 7.10 cm
330 cm
Gasket
Base
Porous stoneOutlet drain
tube
Figure 19b: Sketch details of the test mold.

6 9
4. After the specimen was saturated the outlet tube was clamped.
The standpipe was then filled to a convenient h e ig h t, and the
hydraulic head across the sample was m easured.
5. The test was started by opening the outlet tube and
sim ultaneously the test was timed. The w ater was allowed to
flow through the sample until the standpipe was alm ost empty.
The outlet tube was clamped and the elapse time was recorded.
The hydraulic head was measured.
6. The standpipe was refilled to the same height as in step 4 and
step 5 and was repeated five times.
The coefficient of perm eability was calculated using the form ula [Liu
and Evett, 1990]
w here k-p = coefficient of permeability, m /s
a = cross-sectional area of standpipe, m^
1 = length of specimen, m
A = cross-sectional area of glass beads specimen, m^

7 0
h% = hydraulic head at beginning of test, m
h2 = hydraulic head at end of test, m
t = total time for water in standpipe to drop from h% to h2 , s
The com puted coefficient of perm eability was the value for w ater at 24
°C at the time w hen the test was conducted. It was necessary to correct this
. perm eability to that for 20 °C by m ultiplying the com puted value by the ratio
of the viscosity (a) of w ater at 24 °C to viscosity of water at 20 °C. The ratio of
the viscosity (a) of 24 °C w ater to that of 20 °C water was 0.9095 [Liu and Evett,
1990].
Falling Head Data Sheet
Sample Dimensions: D = 3.30 cm Area = 8.55 cm^
Mass beads + pan init. = 941.9 g H t = 7.10 cm
Mass beads + pan final = 1037.6 g
Mass of the sample = 95.7 g
Vol = 60.73 cm3
Density = 1.576 g /cm ^
Area standpipe = 0.40 cm^ Temperature = 24 °C

Test data
alk ^ = — In
0.4 X 7.1 39.5 cm‘ = 8 .5 5 x 28.3 '" Ï 6 7 =
k»., = a k ^ = 0.9095 x 0.00989 = 9.0x10
7 1
I t no. h | , cm h 2 , cm t , s
1 39.5 16.7 28.23
2 40.2 17.0 28.02
3 39.5 16.8 28.16
4 39.5 16.4 29.00
5 39.5 17.1 30.75
20 T ........................ sec
The following equation was used to determ ine the permeability:
K =^ 2 0 "
Ph 2o ®

7 2
where K = permeability, m^
k = coefficient of permeability at 20 °C, m /s
|i = viscosity of the water, N s /m ^
p = density of the water, K g/m ^
g = acceleration of gravity, m /s^
Then the perm eability is
— X1468xlO = 135x10 ^^m^1000x9.80


![Experimental Study of Fluid Flow and Heat Transfer ... · turbulence. Narayan et al [2] experimentally studied the flow field surface pressure and heat transfer of turbulent slot](https://img.pdfslide.us/doc/110x75/6067eb6ba9923c000b09603f/experimental-study-of-fluid-flow-and-heat-transfer-turbulence-narayan-et-al.jpg)