Embed Size (px)
Citation preview
Experimental study of H2 formation on grainsoverview and recent results
F. Dulieu
Experimental study of H2 formation on grainsoverview and recent results
J. H. Fillion !
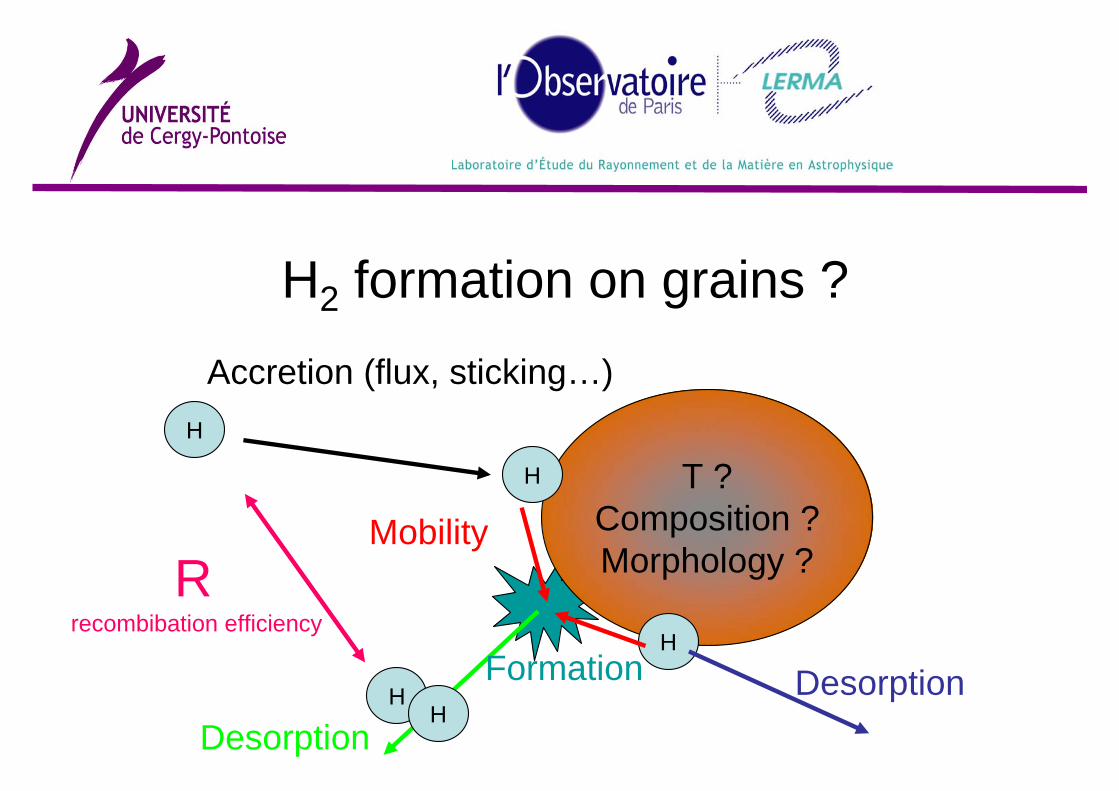
H2 formation on grains ?
T ?Composition ?Morphology ?
H
H
H
Accretion (flux, sticking…)H
Mobility
HDesorption
Formation Desorption
Rrecombibation efficiency
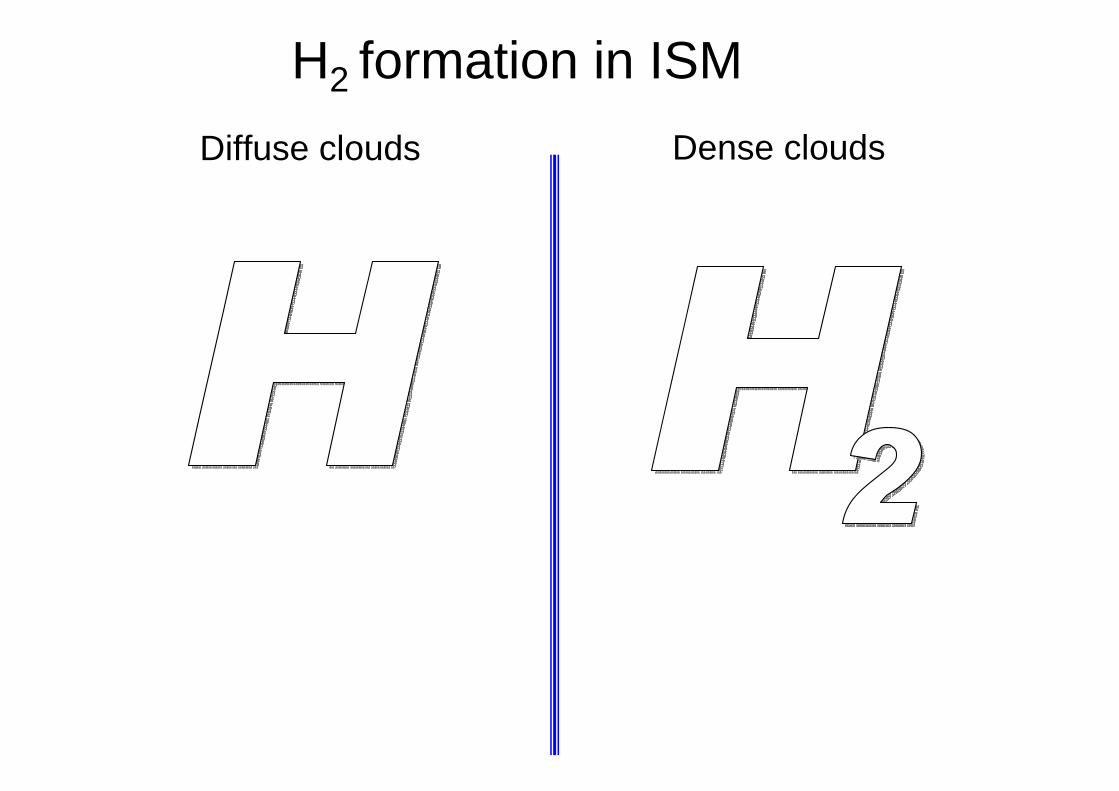
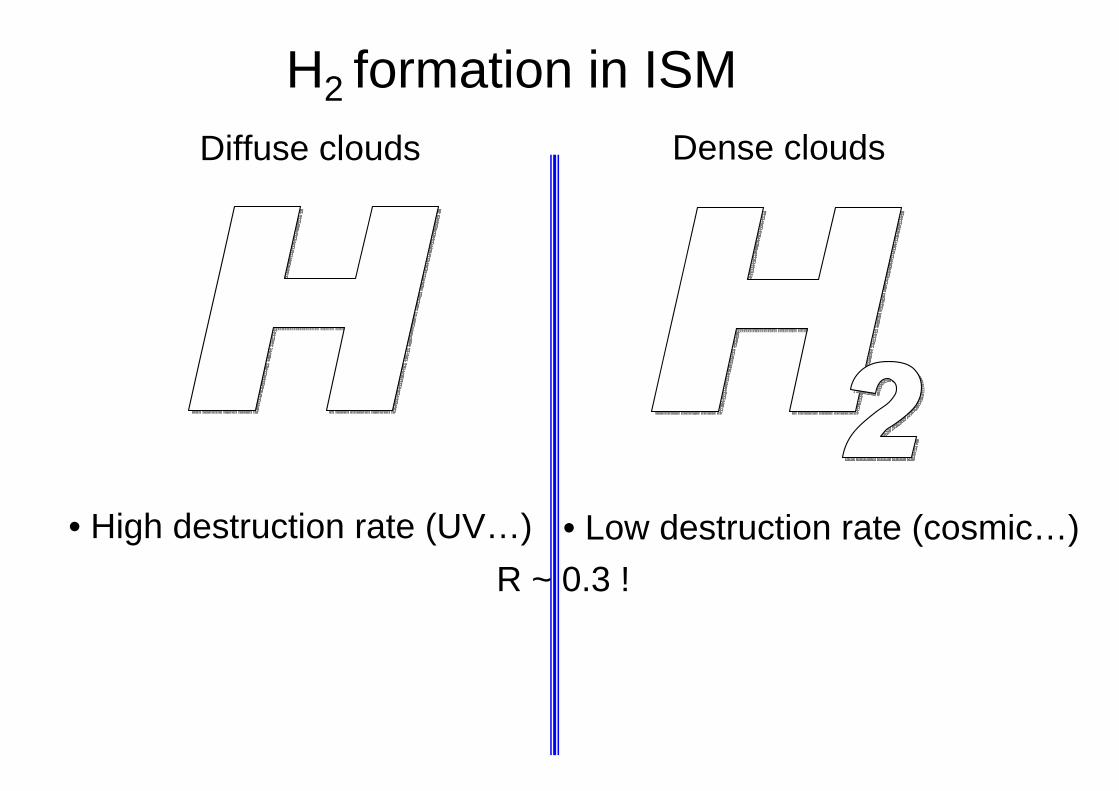
H2 formation in ISMDiffuse clouds Dense clouds
H2 formation in ISMDiffuse clouds Dense clouds
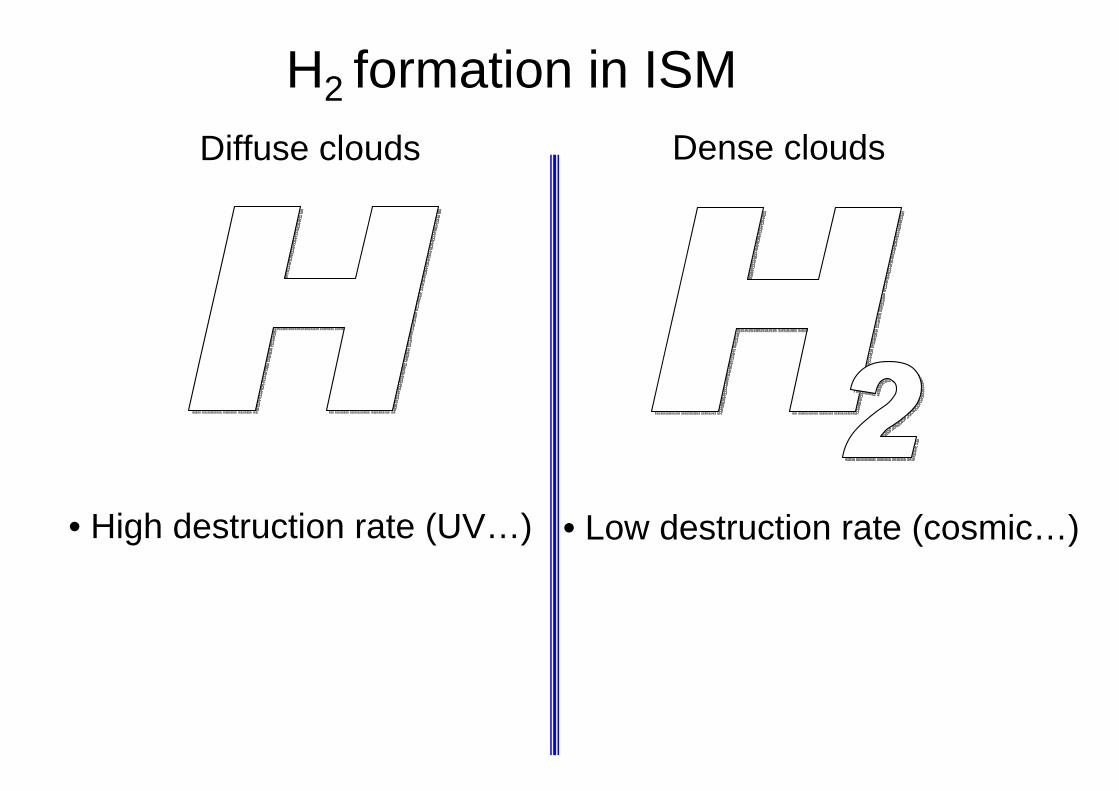
• High destruction rate (UV…) • Low destruction rate (cosmic…)
H2 formation in ISMDiffuse clouds Dense clouds
• High destruction rate (UV…) • Low destruction rate (cosmic…)R ~ 0.3 !
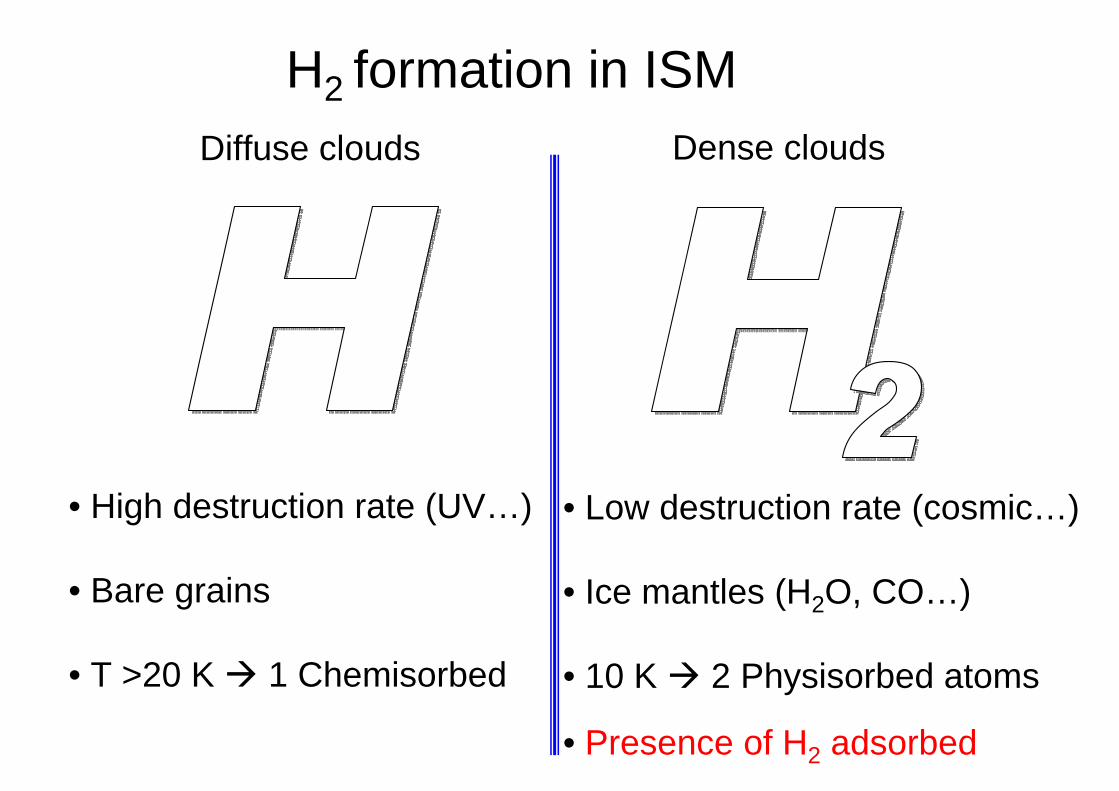
H2 formation in ISMDiffuse clouds Dense clouds
• High destruction rate (UV…)
• Bare grains
• T >20 K 1 Chemisorbed
• Low destruction rate (cosmic…)
• Ice mantles (H2O, CO…)
• 10 K 2 Physisorbed atoms
• Presence of H2 adsorbed
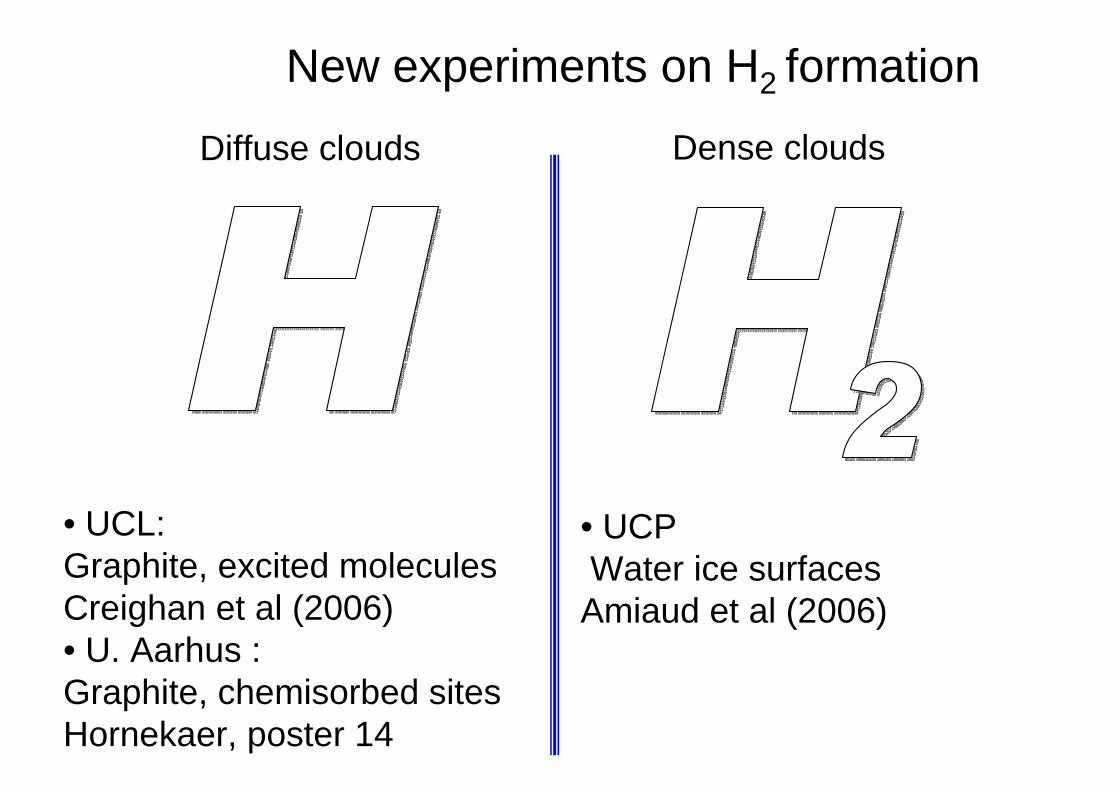
New experiments on H2 formation
Diffuse clouds Dense clouds
• UCL:Graphite, excited moleculesCreighan et al (2006) • U. Aarhus :Graphite, chemisorbed sitesHornekaer, poster 14
• UCP Water ice surfacesAmiaud et al (2006)
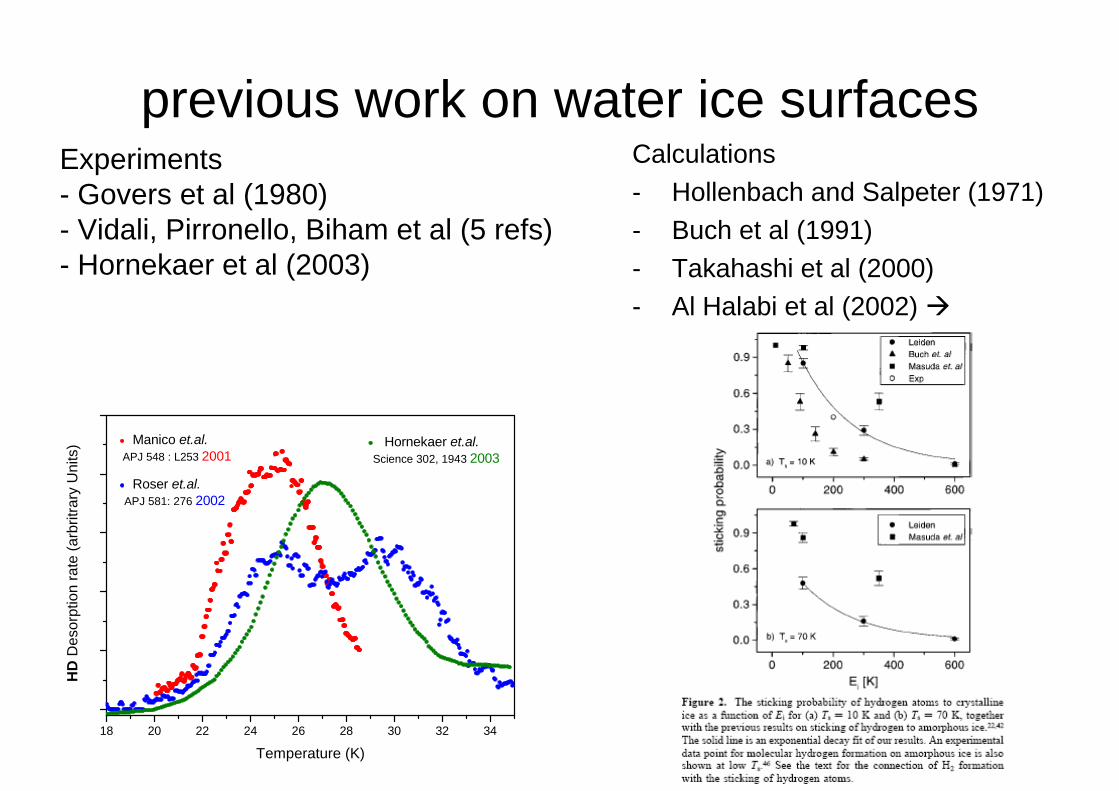
previous work on water ice surfacesCalculations- Hollenbach and Salpeter (1971)- Buch et al (1991)- Takahashi et al (2000)- Al Halabi et al (2002)
Experiments- Govers et al (1980)- Vidali, Pirronello, Biham et al (5 refs)- Hornekaer et al (2003)
18 20 22 24 26 28 30 32 34
Manico et.al. APJ 548 : L253 2001
Roser et.al. APJ 581: 276 2002
HD
Des
orpt
ion
rate
(arb
ritra
ry U
nits
)
Temperature (K)
Hornekaer et.al. Science 302, 1943 2003

UCP experimental strategy
• Compare D2 vs D+D, during and after irradiation (thermal ramp = TPD)
• Use ice as template of physisorption study(Porosity and adsorption sites can be changed)
• Caracterize as much as possible differentexperimental parameters
• And not H+D studies (Vidali, Pirronello, Biham et al, Hornekaer et al)
UCPJ. L. LemaireJ. H. FillionA. Momeni
S. BaoucheL. AmiaudL. Kristensen
E. SomsonJ.J. BousquetS. Diana
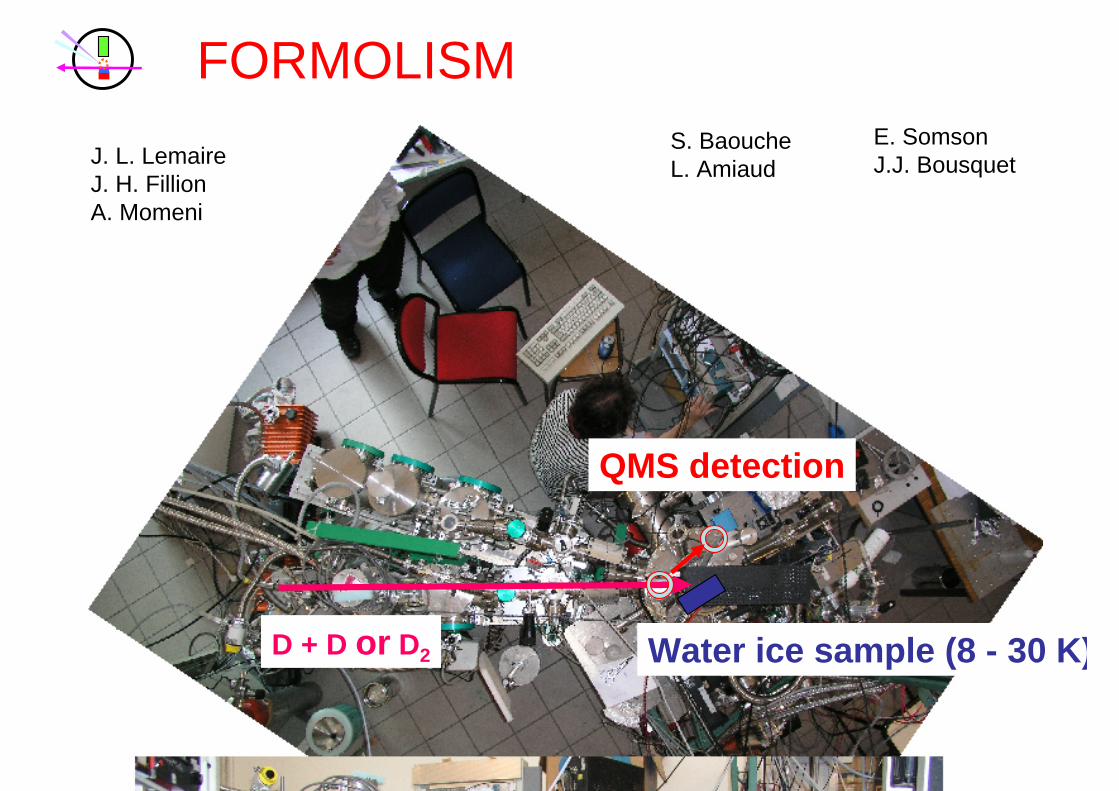
FORMOLISMJ. L. LemaireJ. H. FillionA. Momeni
S. BaoucheL. Amiaud
E. SomsonJ.J. Bousquet
D + D or D2 Water ice sample (8 - 30 K)
QMS detection
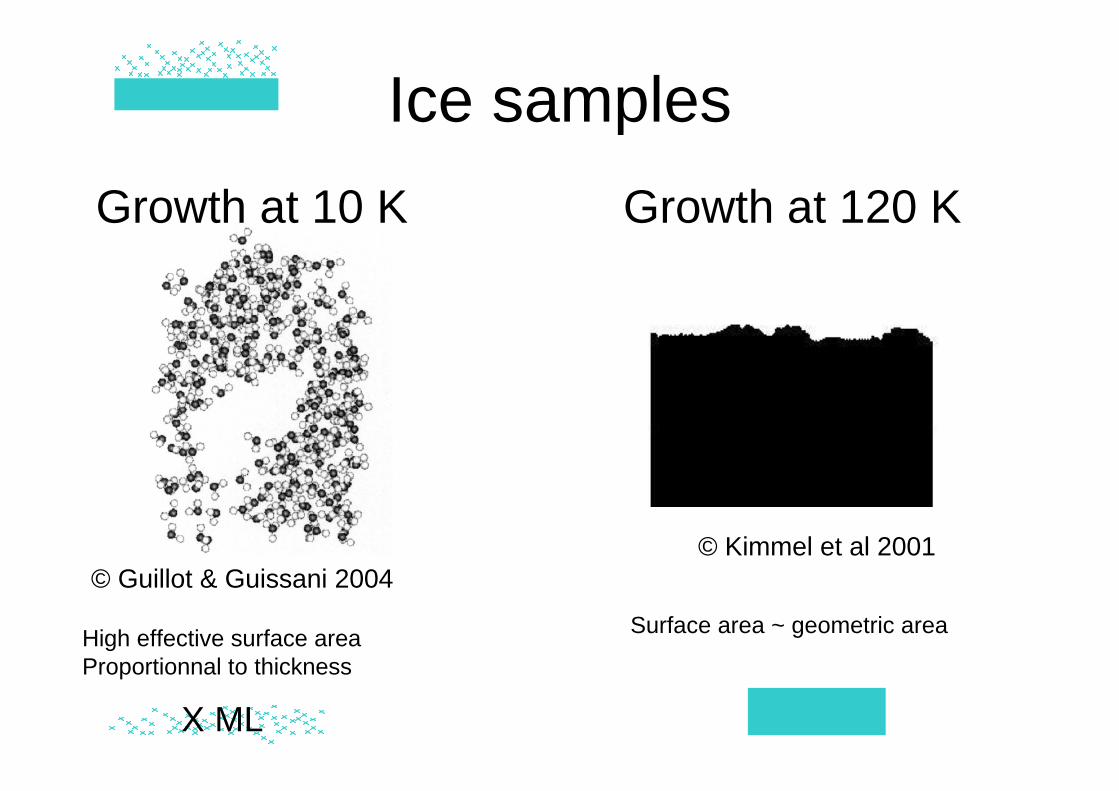
Ice samplesGrowth at 10 K Growth at 120 K
© Guillot & Guissani 2004
High effective surface areaProportionnal to thickness
X ML
© Kimmel et al 2001
Surface area ~ geometric area
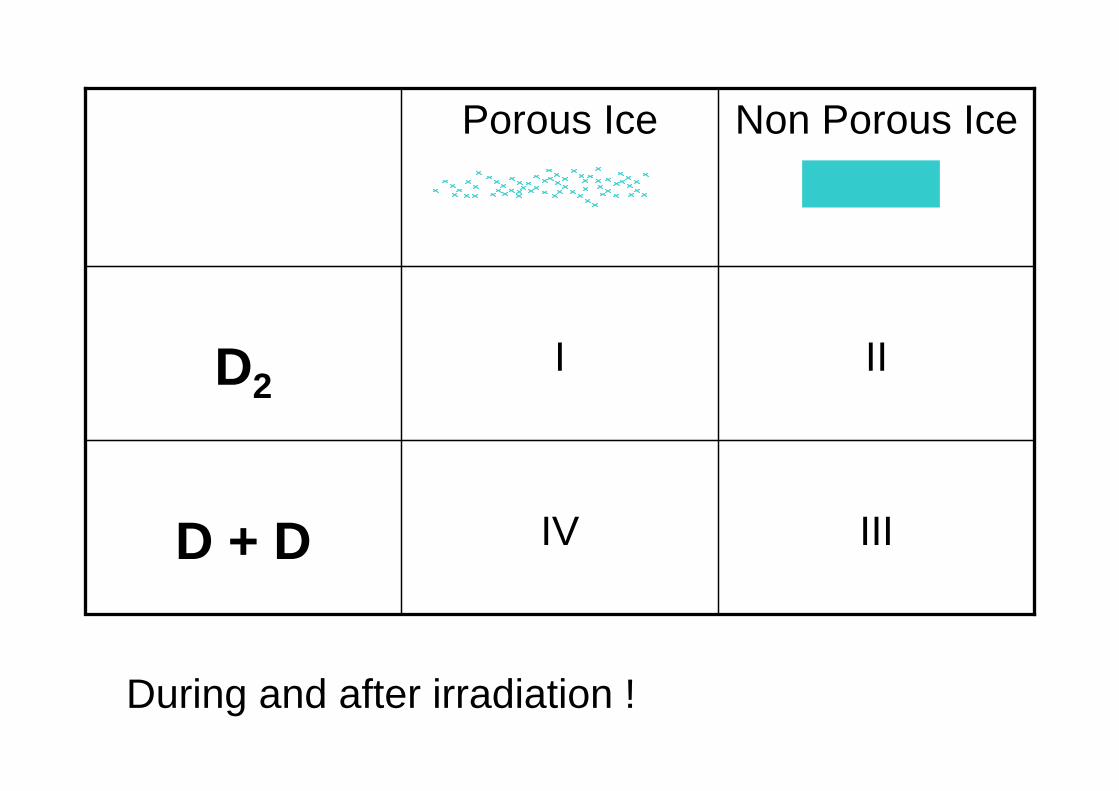
IIIIVD + D
IIID2
Non Porous IcePorous Ice
During and after irradiation !
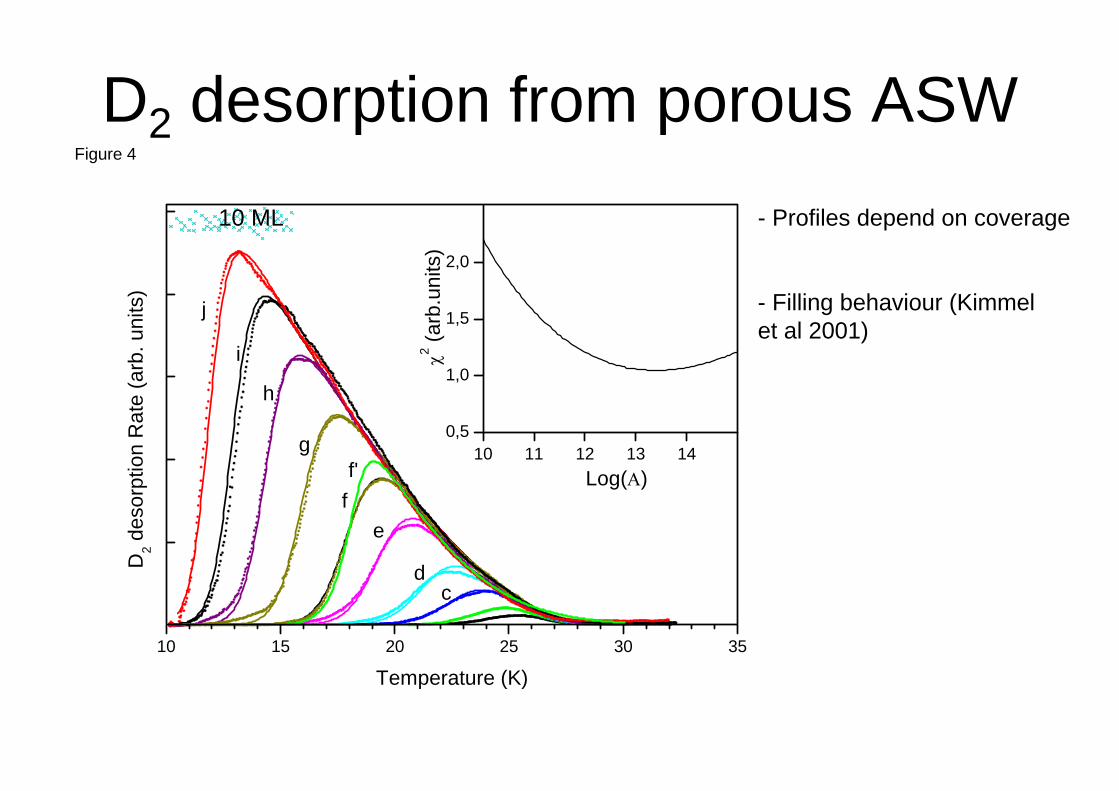
D2 desorption from porous ASW
10 11 12 13 140,5
1,0
1,5
2,0
10 15 20 25 30 35
f'
D2 d
esor
ptio
n R
ate
(arb
. uni
ts)
Temperature (K)
Figure 4
c
j
i
h
g
d
ef
χ2 (arb
.uni
ts)
Log(Α)
- Profiles depend on coverage
- Filling behaviour (Kimmelet al 2001)
10 ML
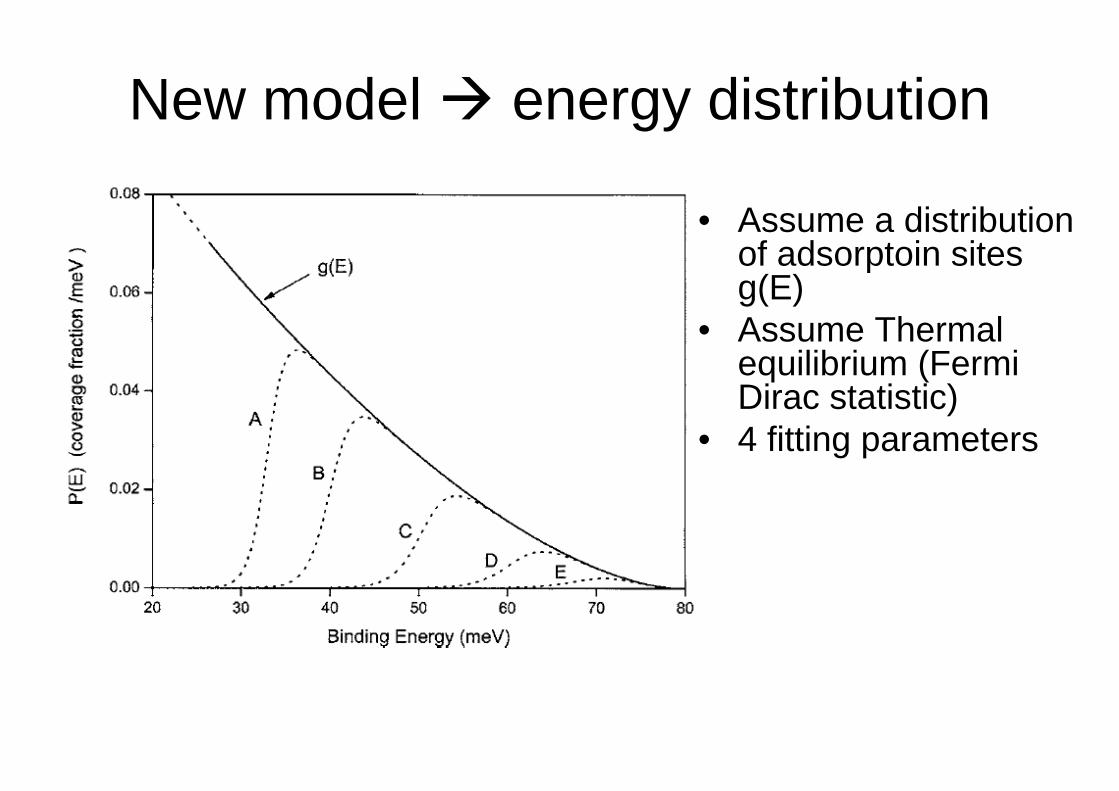
New model energy distribution
• Assume a distribution of adsorptoin sites g(E)
• Assume Thermal equilibrium (Fermi Dirac statistic)
• 4 fitting parameters
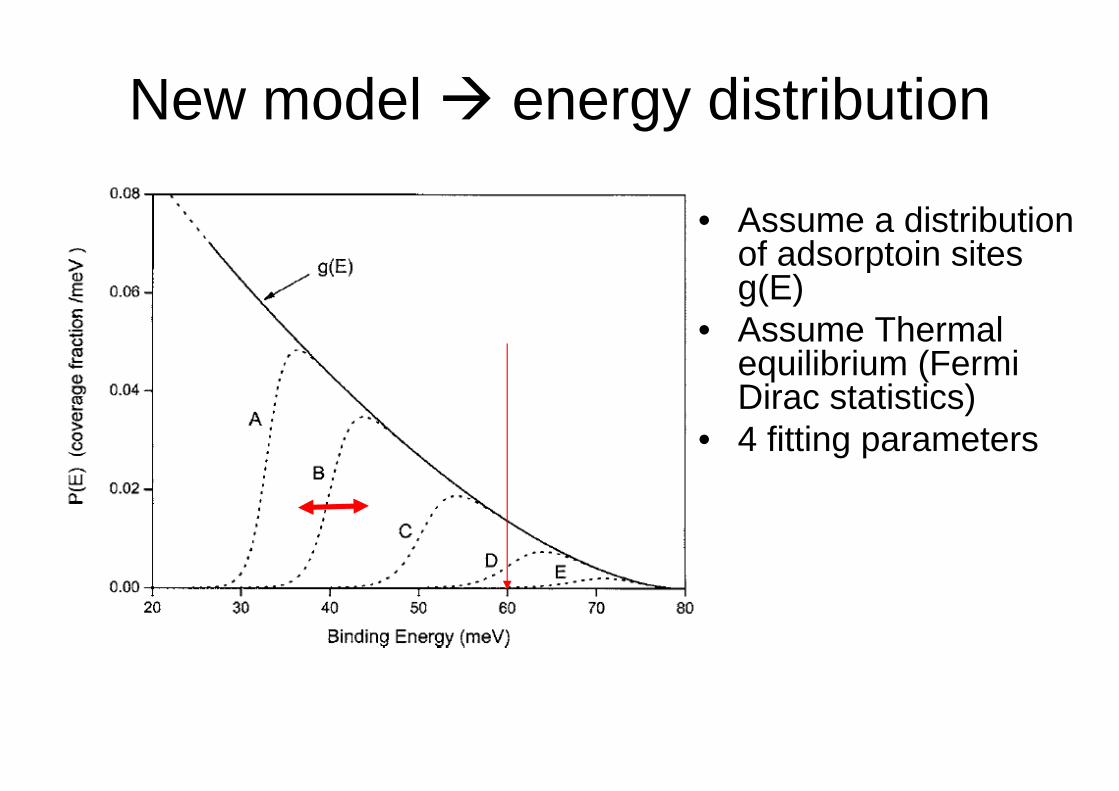
New model energy distribution
• Assume a distribution of adsorptoin sites g(E)
• Assume Thermal equilibrium (Fermi Dirac statistics)
• 4 fitting parameters
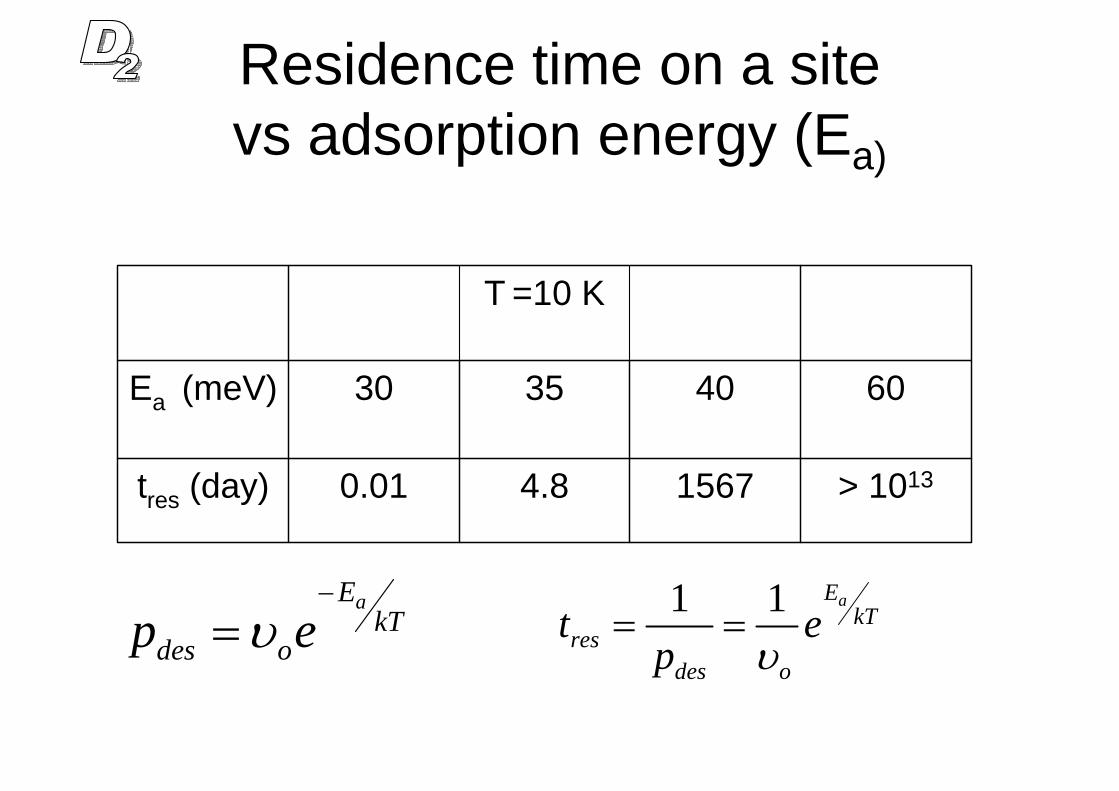
Residence time on a sitevs adsorption energy (Ea)
> 101315674.80.01tres (day)
60403530Ea (meV)
T =10 K
aEkT
des op eυ−
=1 1 aE
kTres
des o
t ep υ
= =
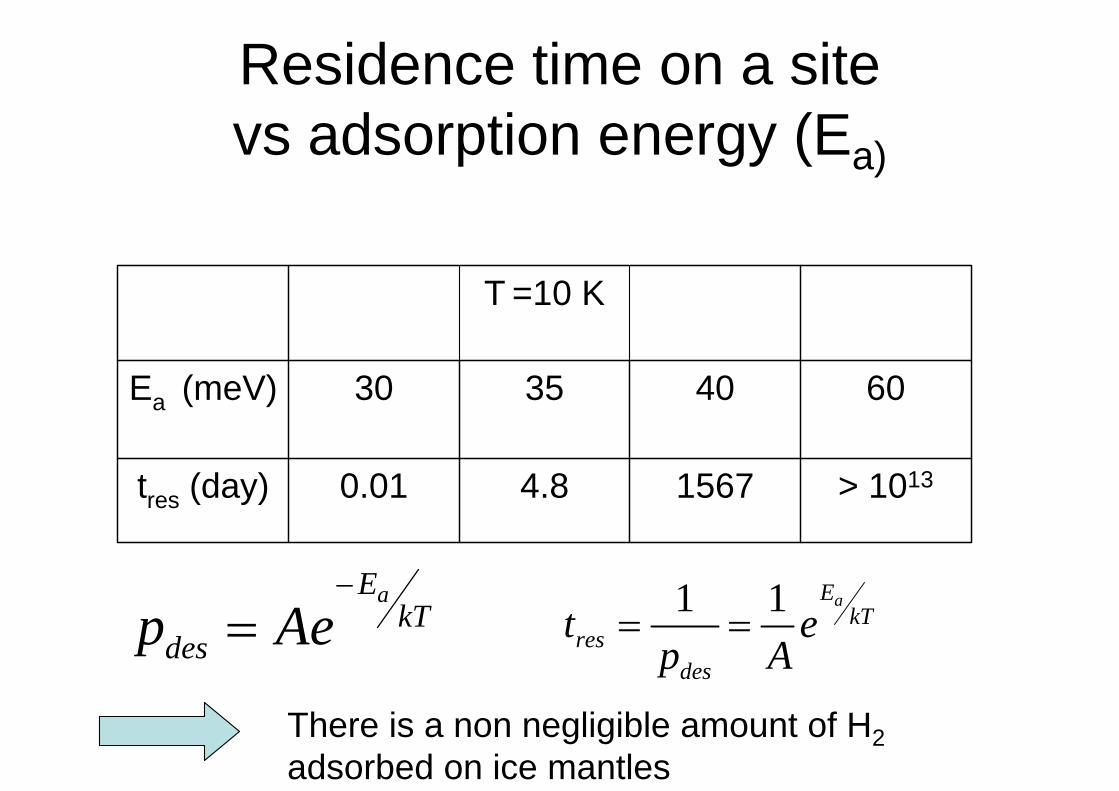
Residence time on a sitevs adsorption energy (Ea)
> 101315674.80.01tres (day)
60403530Ea (meV)
T =10 K
aEkT
desp Ae−
= 1 1 aEkT
resdes
t ep A
= =
There is a non negligible amount of H2adsorbed on ice mantles
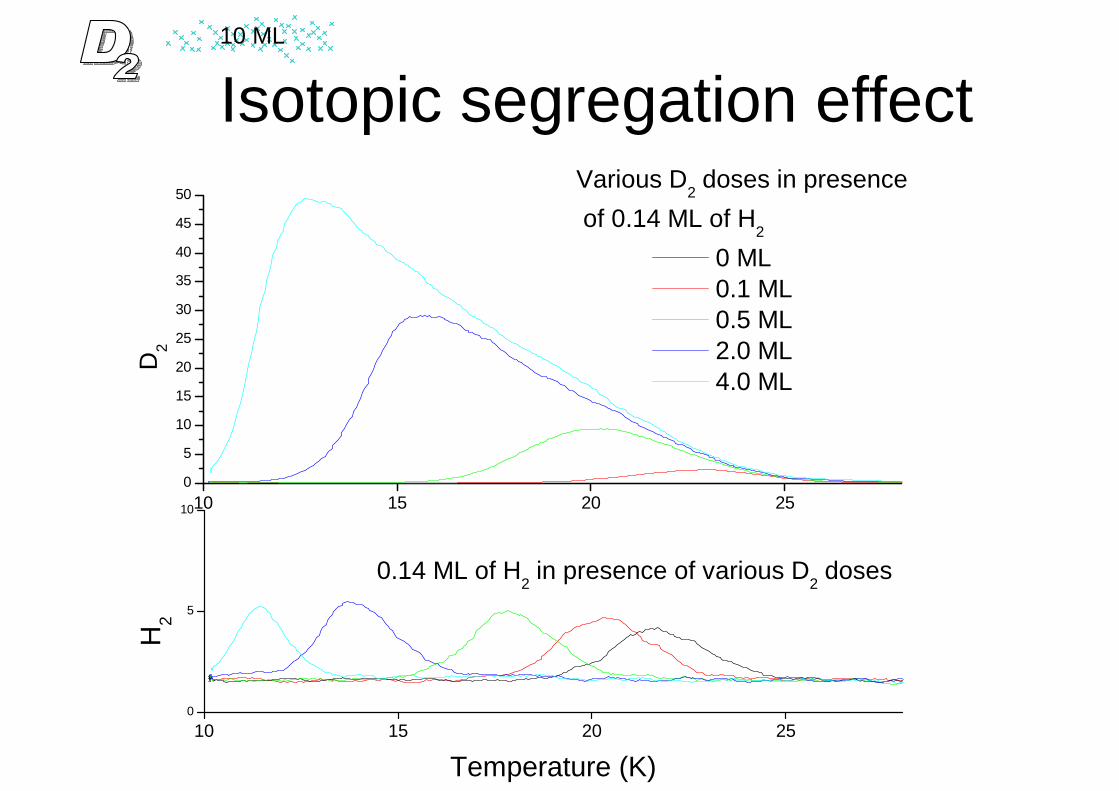
Isotopic segregation effect
10 15 20 250
5
1010 15 20 250
5
10
15
20
25
30
35
40
45
50
0.14 ML of H2 in presence of various D2 doses
Various D2 doses in presence of 0.14 ML of H2
0 ML 0.1 ML 0.5 ML 2.0 ML 4.0 ML
H2
Temperature (K)
D2
10 ML

Isotopic segregation effect10 ML
- Enrichment of deuterated moleculeson ice mantles (see poster 18)- TPD profiles of H2 HD and D (seebelow) are very sensitive to thepresence D2 (even 10%)
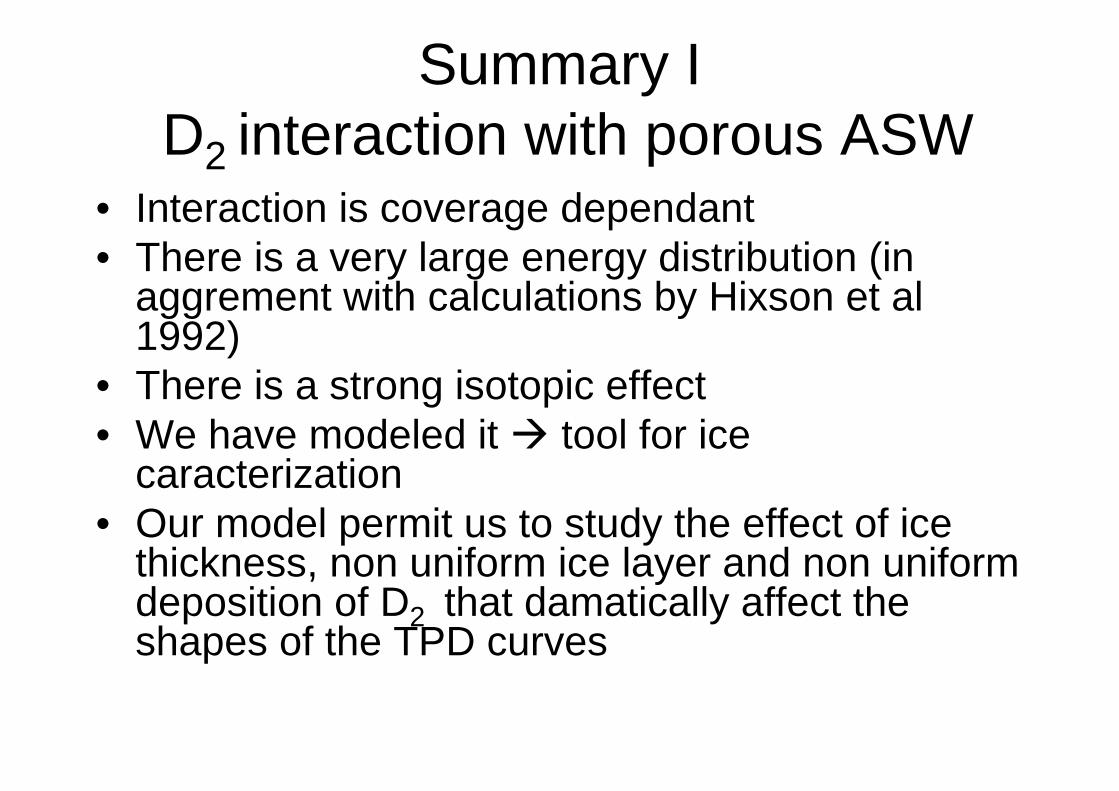
Summary I D2 interaction with porous ASW
• Interaction is coverage dependant• There is a very large energy distribution (in
aggrement with calculations by Hixson et al1992)
• There is a strong isotopic effect• We have modeled it tool for ice
caracterization• Our model permit us to study the effect of ice
thickness, non uniform ice layer and non uniformdeposition of D2 that damatically affect theshapes of the TPD curves
10 12 14 16 18 20 220
2000
4000
6000
8000
A
B
0,0 0,1 0,2 0,3 0,4 0,5 0,60
10000
20000
30000
40000
50000
Inte
grat
ed A
rea
(cps
K)
Exposure Dose (ML)
D2 S
igna
l (c
ps)
Surface temperature (K)
A
B
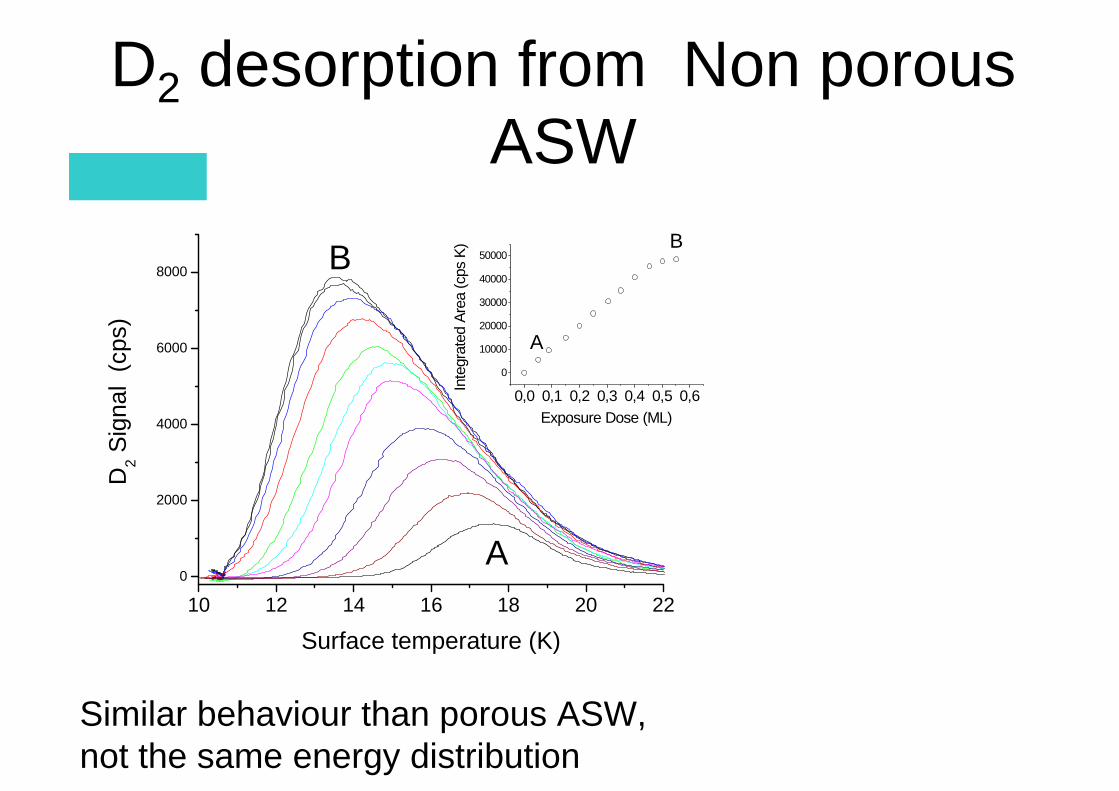
D2 desorption from Non porousASW
Similar behaviour than porous ASW, not the same energy distribution

10 12 14 16 18 20 220
2000
4000
6000
8000
A
B
0,0 0,1 0,2 0,3 0,4 0,5 0,60
10000
20000
30000
40000
50000
Inte
grat
ed A
rea
(cps
K)
Exposure Dose (ML)
D2 S
igna
l (c
ps)
Surface temperature (K)
A
B
D2 desorption from Non porousASW
Similar behaviour than porous ASW, not the same energy distribution
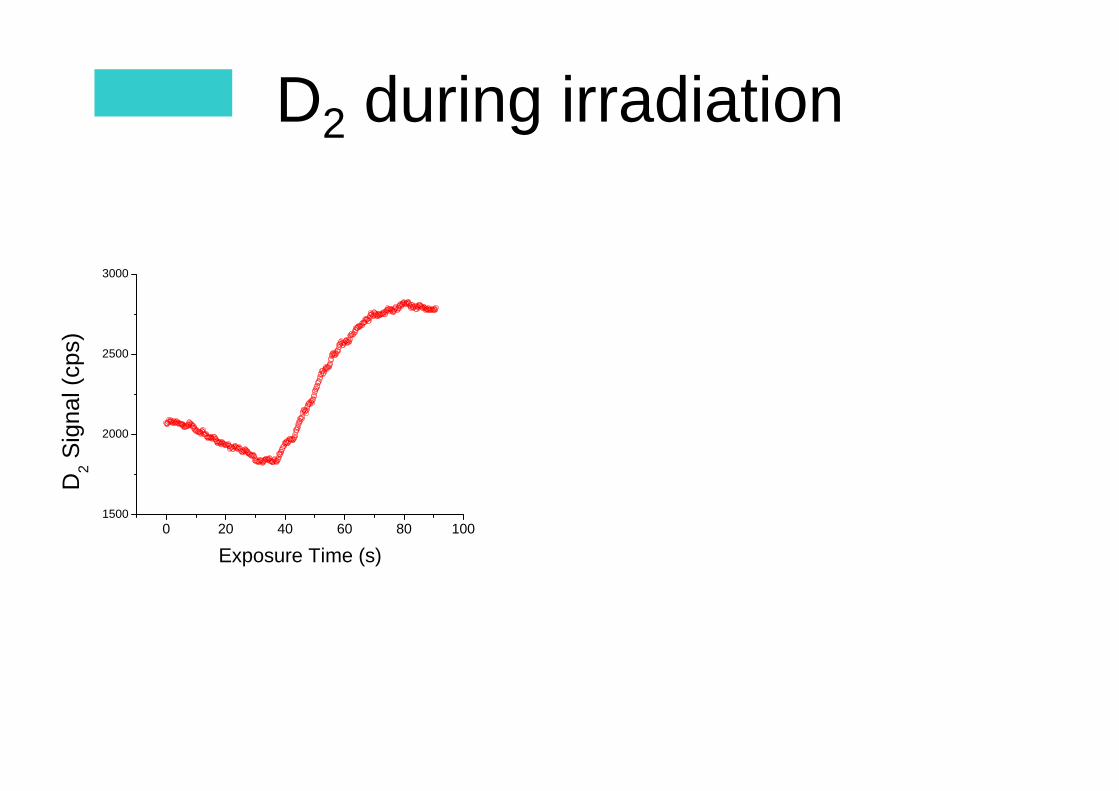
D2 during irradiation
0 20 40 60 80 1001500
2000
2500
3000
D2 S
igna
l (cp
s)
Exposure Time (s)
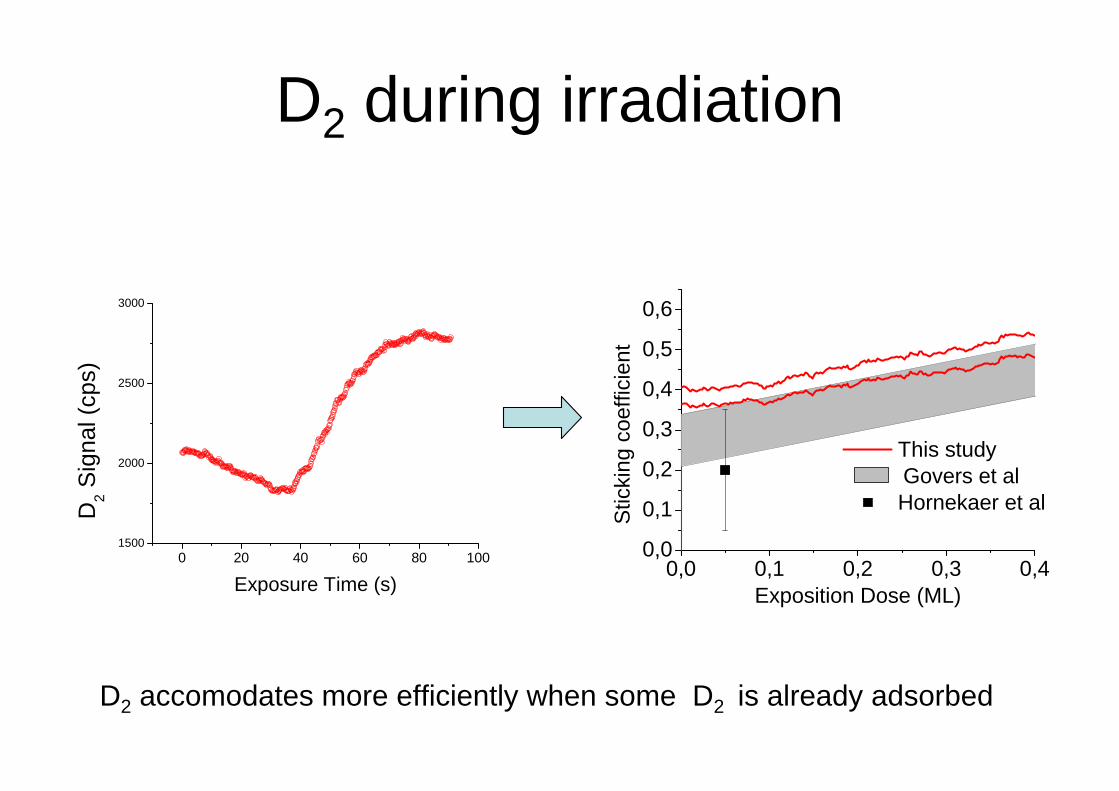
D2 during irradiation
0 20 40 60 80 1001500
2000
2500
3000
D2 S
igna
l (cp
s)
Exposure Time (s)0,0 0,1 0,2 0,3 0,4
0,0
0,1
0,2
0,3
0,4
0,5
0,6
This study Govers et al
Hornekaer et al
Stic
king
coe
ffici
ent
Exposition Dose (ML)
D2 accomodates more efficiently when some D2 is already adsorbed
Summary II:D2 interaction with non porous ice
• Follow the « filling behaviour »• Distribution of adsorption energy is
significantly shifted to lower bindingenergies
• Sticking coefficient is dependant on thepresence of already adsorbed molecules

D + D during irradiatiton
0 100 200 300 400 500 6000
400
800
1200
D+D irradiation Non dissociated part
D2 S
igna
l (cp
s)
Exposure time (s) 0,0 0,2 0,4 0,6 0,80,00
0,02
0,04
0,06
0,08
0,10
0,12
Frac
tion
of a
tom
s re
actin
g
D2 Exposed (ML)
Ts = 10 K
- Prompt reaction occurs- Recombination efficiency depends on stiking that isenhanced by adsorbed molecules- Ea(D) ~ 0.6 Ea(D2) (as expected from polarisability)
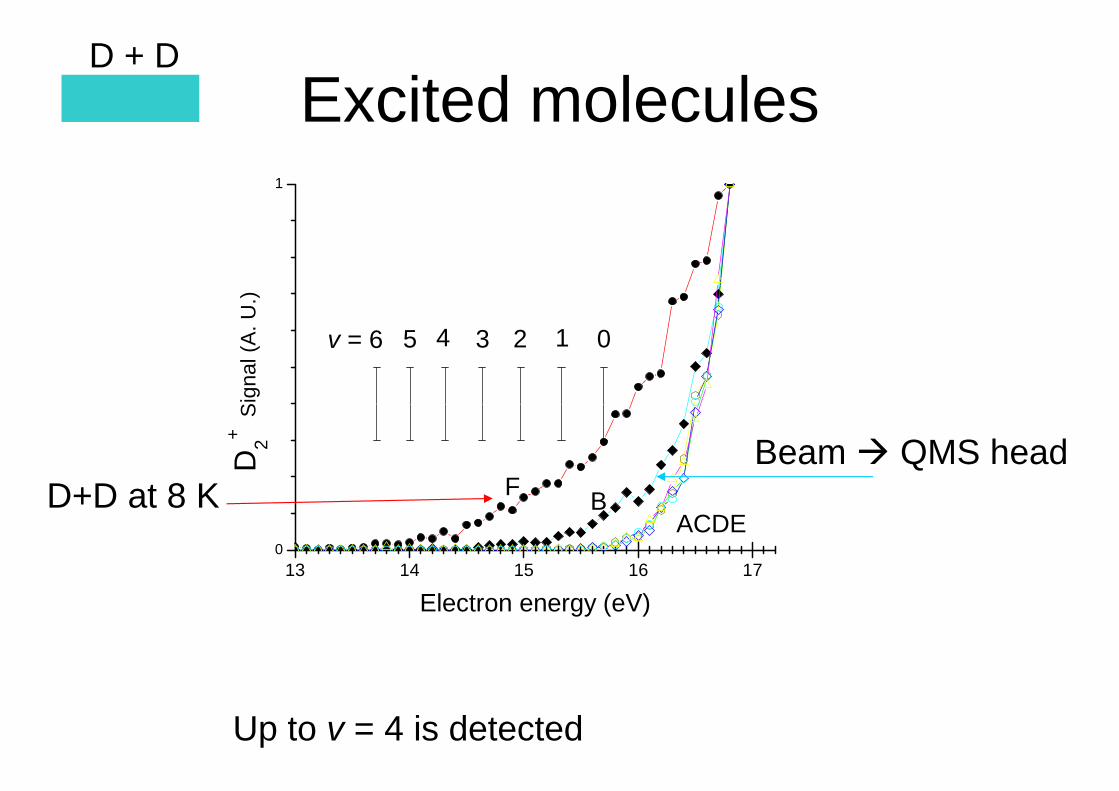
Excited moleculesD + D
13 14 15 16 170
1
012345
ACDEF
D2+ S
igna
l (A
. U.)
Electron energy (eV)
B
v = 6
Up to v = 4 is detected
D+D at 8 KBeam QMS head
Summary III D2 formation on Non porous ice
• Prompt reaction that leads to excitedmolecules at 10 K
• Ea(D2) > Ea(D) > Ediff(D) in agreementwith calculations
• Molecules already adsorbed enhance therecombination efficiency (see also Goverset al)
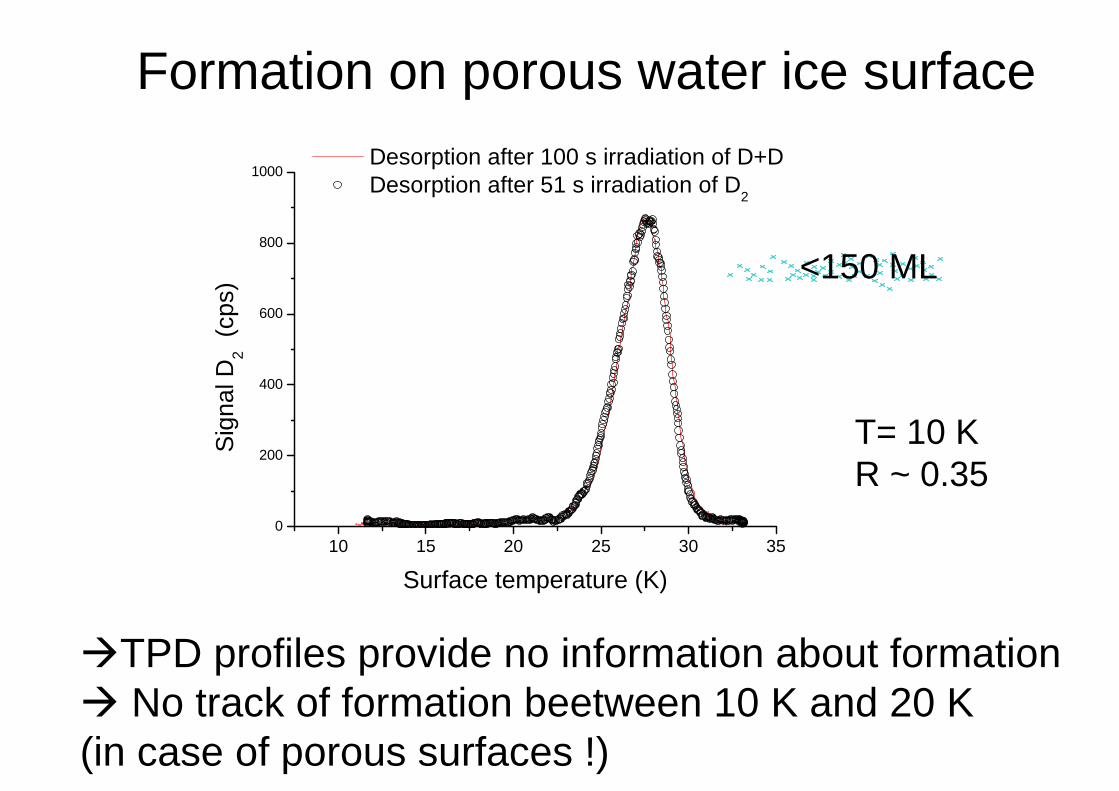
Formation on porous water ice surface
10 15 20 25 30 350
200
400
600
800
1000
Sig
nal D
2 (cp
s)
Surface temperature (K)
Desorption after 100 s irradiation of D+D Desorption after 51 s irradiation of D2
<150 ML
TPD profiles provide no information about formationNo track of formation beetween 10 K and 20 K
(in case of porous surfaces !)
T= 10 KR ~ 0.35
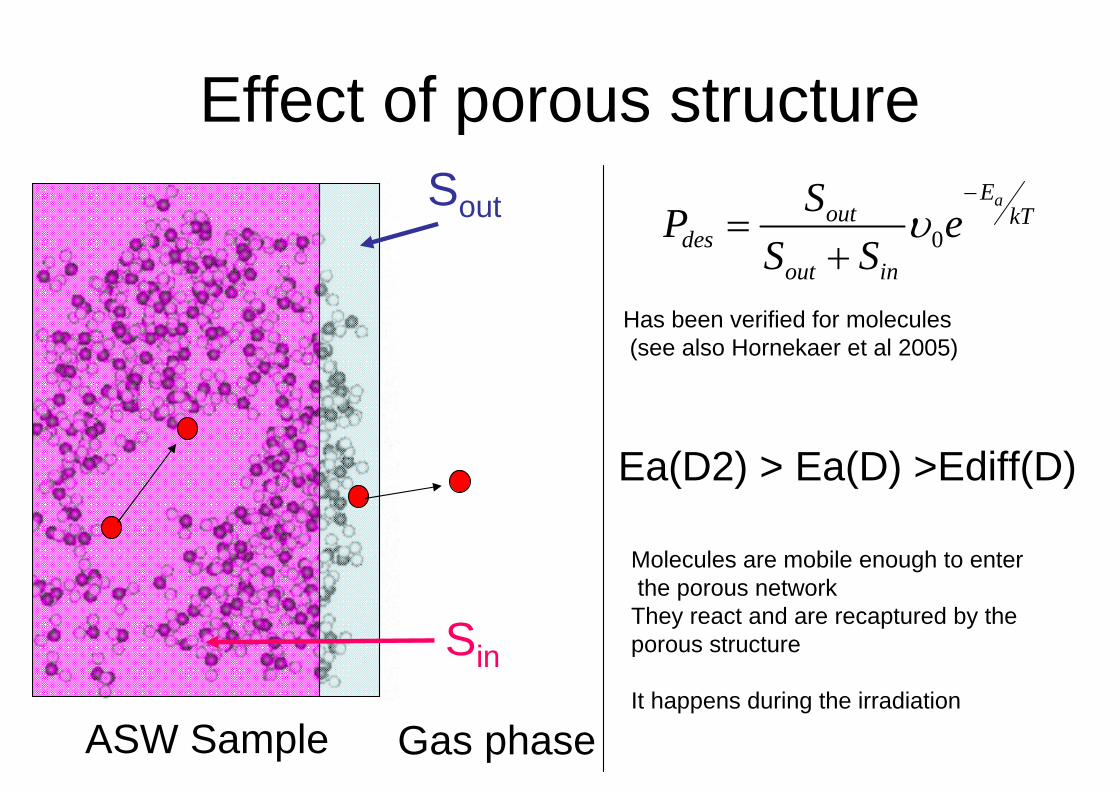
Effect of porous structure
ASW Sample Gas phase
Sout
Sin
0
aEout kT
desout in
SP eS S
υ−
=+
Has been verified for molecules(see also Hornekaer et al 2005)
Ea(D2) > Ea(D) >Ediff(D)
Molecules are mobile enough to enter the porous network
They react and are recaptured by the porous structure
It happens during the irradiation
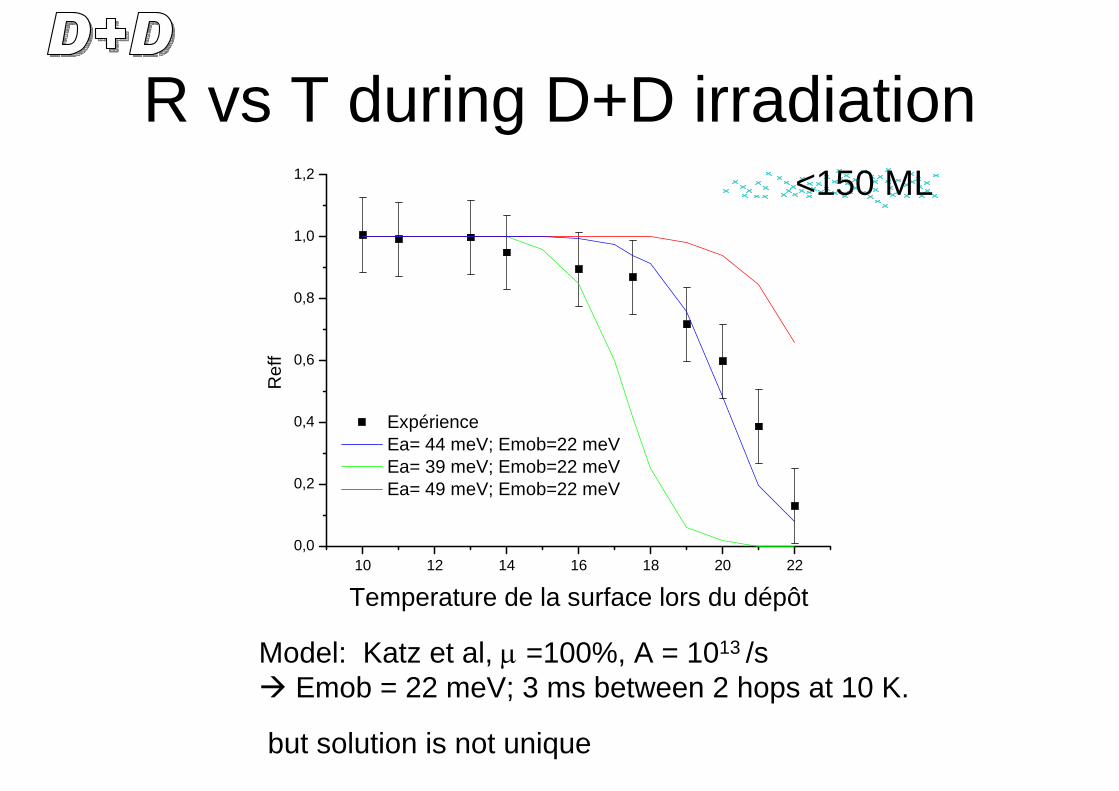
R vs T during D+D irradiation
10 12 14 16 18 20 220,0
0,2
0,4
0,6
0,8
1,0
1,2
Ref
f
Temperature de la surface lors du dépôt
Expérience Ea= 44 meV; Emob=22 meV Ea= 39 meV; Emob=22 meV Ea= 49 meV; Emob=22 meV
Model: Katz et al, µ =100%, A = 1013 /sEmob = 22 meV; 3 ms between 2 hops at 10 K.
but solution is not unique
<150 ML
Outline of D+D experimentson porous amorphous ice
• Kinetics of formation is blurred by porous structure of the ice, TPDs reveal only molecular desorption
• Ea(D2) > Ea(D) >Ediff(D)• at 10 K diffusion is fast enough to allow atoms to enter
the porous network and to react but the molecules formed are recaptured by the porous network
• The recombination efficiency is 0.35 at 10 K and is mostly governed by the sticking probability
Question to elucidate:• What about the effect of adsorbed molecules ?• Diffusion energy, Adsorption energy should have a
distribution (see Buch et al 1991) need another approach
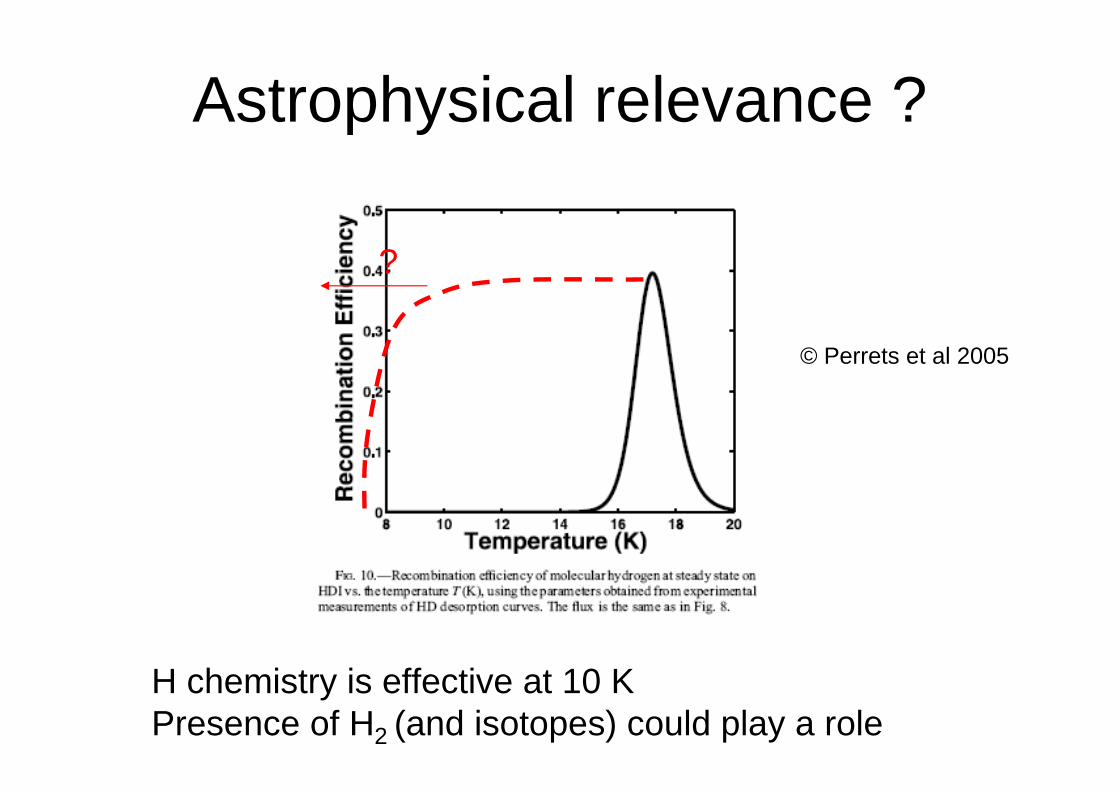
Astrophysical relevance ?
© Perrets et al 2005
?
H chemistry is effective at 10 KPresence of H2 (and isotopes) could play a role
Future work
• IR characterization of H2 / H interaction with ASW
• Energetic balance (REMPI + imaging)• Interaction with other samples
(carbonaceous)• Formation of water

Thank you !