Embed Size (px)
Citation preview
Full Terms & Conditions of access and use can be found athttp://www.tandfonline.com/action/journalInformation?journalCode=tpmr20
Download by: [Hogskolebiblioteket I Skovde] Date: 27 September 2017, At: 00:22
Production & Manufacturing ResearchAn Open Access Journal
ISSN: (Print) 2169-3277 (Online) Journal homepage: http://www.tandfonline.com/loi/tpmr20
Experimental study of cognitive aspects affectinghuman performance in manual assembly
Anna Brolin, Peter Thorvald & Keith Case
To cite this article: Anna Brolin, Peter Thorvald & Keith Case (2017) Experimental study ofcognitive aspects affecting human performance in manual assembly, Production & ManufacturingResearch, 5:1, 141-163, DOI: 10.1080/21693277.2017.1374893
To link to this article: http://dx.doi.org/10.1080/21693277.2017.1374893
© 2017 The Author(s). Published by InformaUK Limited, trading as Taylor & FrancisGroup
Published online: 26 Sep 2017.
Submit your article to this journal
View related articles
View Crossmark data
Production & Manufacturing research, 2017VoL. 5, no. 1, 141–163https://doi.org/10.1080/21693277.2017.1374893
Experimental study of cognitive aspects affecting human performance in manual assembly
Anna Brolina,b, Peter Thorvalda and Keith Caseb
aschool of engineering science, university of skövde, skövde, sweden; bdepartment of Mechanical, electrical and Manufacturing engineering, Loughborough university, Loughborough, uK
ABSTRACTThis study investigate different ways of presenting material and information at workstations while using mixed assembly mode with product variants. The experimental set up annotated an assembly line involving 36 subjects. The material presentation factor involved the use of a material rack compared to using an unstructured kit as well as a structured kit. The information presentation factor involved using a text and number instruction compared to a photograph instruction, and situations with and without component variation were considered. Results show that assembly times and workload ratings were lower when using a kit, whereas using a material rack resulted in perceived decreased workflow and increased stress and frustration. Moreover, assembly times and workload ratings were lower when using photographs, whereas using text and numbers increased mental workload. The results could be useful when planning work places and production systems in order to obtain a better workflow and an increased human performance.
1. Introduction
Modern manufacturing systems are shifting from mass production to mass customisation, meaning that they must be able to manage more rapid and frequent changes in customer demands and requirements, new technology and environmental demands. Which of course makes the system complicated, especially if trying to maintain a low cost in the production system (Hu et al., 2011), while at the same time upholding the quality of the products. In order to stay competitive, manufacturers have begun to design production systems that are more flexible and efficient. For example, the Swedish vehicle industry accommodates a large range of different vehicle models on one production line, so called mixed mode assembly, ultimately causing a high variant flora of products to be assembled. Although automation is increasing in production systems of vehicle manufacturers, manual assembly is still a vital part of the assembly system and thus has to be considered in the development of manufacturing systems.
KEYWORDSManual assembly; manufacturing; information presentation; material supply; kitting; cognitive workload; human performance
ARTICLE HISTORYreceived 7 March 2017 accepted 2 august 2017
© 2017 the author(s). Published by informa uK Limited, trading as taylor & francis group.this is an open access article distributed under the terms of the creative commons attribution License (http://creativecommons.org/licenses/by/4.0/), which permits unrestricted use, distribution, and reproduction in any medium, provided the original work is properly cited.
CONTACT anna Brolin [email protected]
OPEN ACCESS
Dow
nloa
ded
by [
Hog
skol
ebib
liote
ket I
Sko
vde]
at 0
0:22
27
Sept
embe
r 20
17
142 A. BROLIN ET AL.
In the automotive industry, well designed and presented information is important for the assembly personnel to perform effective and accurate assembly operations. It is important to understand how to perceive and to best present information, so that the assembler is able to perform a correct task based on the given information. The overarching aim of this work is therefore to improve the work situation for the assembler by investigating usability and cognitive aspects that affect human performance in a mixed mode assembly, meaning that the assembly line contains both standard products as well as product variations at the same time.
Complicating issues with this kind of system is that the assembler needs be prepared for both types of product configurations. But as the likelihood of a volume product will occur more often compared to a variant product, there is a high risk that the assembler will end up in a previous assembly pattern, using an automated behaviour (Reason, 1990; Wickens & Hollands, 2000), and assemble a volume product, when it should have been a variant. From a human factors perspective, this way of arranging assembly work puts considerable strain on the assembler. Therefore an experimental study was initiated to investigate this issue further. The objective of this experimental study was hence to investigate previously identified factors (as will be discussed in Section 2) that affect the cognitive aspects of human performance in a mixed mode assembly system.
2. Background
A worker performing an assembly task is constantly exposed to situations with varying cognitive demands. In the context of manual assembly, this can be experienced through for instance the amount of information, high variant flora of components, system complexity and physical layout of workstations. However, each of these factors can be handled with relative ease so long as the time pressure is low, but when combining these with the triggering factor of high time pressure, an increased mental load will occur. Hence, poor information design, which is an issue in many manual assembly environments, can be better dealt with as long as there is no time pressure.
As mentioned, several factors affect the assembler at the workstation. Various investiga-tions have shown that increases in product variants increase the complexity in manufactur-ing (Calinescu, 2002; ElMaraghy, ElMaraghy, Tomiyama, & Monostori, 2012; ElMaraghy & Urbanic, 2003; Gullander et al., 2011; Hu, Zhu, Wang, & Koren, 2008; Hu et al., 2011; Mattsson et al., 2014). In addition, increased product variation has a negative effect on overall performance, i.e. quality and productivity (Fisher & Ittner, 1999) as well as human factors aspects in manual assembly (Lim & Hoffmann, 2015; Peter, 2011; Säfsten, Winroth, & Löfving, 2014; Shalin, Prabhu, & Helander, 1996). Other interesting manufacturing aspects relevant to this work also include the field of production logistics and especially relevant to this experiment is material supply, which is relevant when looking at the handling and flow of material, also affecting the assembler at the workstation. An increase in product variants means that the assemblers often are faced with a larger number of components at the workstation which need to be handled. One of the most interesting areas within material supply systems is the principle of kitting. The kitting method was primarily introduced as a logistic tool, to solve the problem of material racks that expanded alongside of the assem-bly line. The use of kitting means that pre-sorted kits of components are delivered to the workstation either by so called traveling kits or stationary kits (Bozer & McGinnis, 1992). When using continuous supply in mixed mode assembly, the assembler at each workstation needs to identify the right components to assemble on each assembly object. This further means that, compared to kitting, continuous supply often is associated with a direct flow
Dow
nloa
ded
by [
Hog
skol
ebib
liote
ket I
Sko
vde]
at 0
0:22
27
Sept
embe
r 20
17
PRODUCTION & MANUFACTURING RESEARCH 143
of materials within the assembly plant, and not first being gathered into kits. Within the literature, kitting has been stated to be associated with a number of effects, both benefits and drawbacks (Christmansson et al., 2002; Hanson & Medbo, 2012; Johansson, 1991; Medbo, 2003; Sellers & Nof, 1989). However, the effects are mostly regarding quality, productivity (Finnsgård, Medbo, Wänström, & Neumann, 2008; Wänström & Medbo, 2008), man hour consumption, space requirements near the final assembly line (Bukchin & Meller, 2005) and flexibility issues (Bozer & McGinnis, 1992; Sellers & Nof, 1986). A kit can also be regarded as a carrier of information that complements, supports or even replaces conventional assembly instructions. Medbo (2003) argues that, correctly structured, a kit can support assembly by functioning as a work instruction. If the parts are placed in the kit in a manner that reflects the assembly operations, kitting can facilitate learning and, consequently, reduce learning times and improve product quality (Johansson, 1991). The benefit, from an ergo-nomics perspective, is that the assembler only has to focus on the assembly process, i.e. how to assemble, and does not need to be concerned with what parts to assemble, which ultimately can result in high support of product quality (Bäckstrand, 2009). Further, several researchers have associated kitting with ergonomic aspects (Christmansson et al., 2002), for instance stating that the configuration of a kit supports the assembly work (Medbo, 2003). This insight is in line with the subject matter of this work, and will therefore be included in the experimental study.
Further, recently a useful framework and method of considering cognitive aspects that can be connected to manual assembly has been suggested. This has resulted in an assessment method called CLAM, Cognitive Load Assessment for Manufacturing method (Lindblom & Thorvald, 2014; Thorvald & Lindblom, 2014). For more detailed information regarding these manufacturing areas, see Brolin (2016).
2.1. Exploration studies leading to hypotheses of experimental study
From previous studies (Brolin, Bäckstrand, Thorvald, Högberg, & Case, 2012; Hanson & Brolin, 2013), areas concerning manufacturing and human performance were considered more interesting, compared to other investigated research areas included in the abovemen-tioned studies, e.g. logistics. Especially, how information is presented to the assembler at the workstation, how material is presented to the assembler at the workstation as well as how component variants affect the assembler at the workstation. These factors therefore formed the basis for the hypotheses for the experimental study, see Section 2.2.
2.1.1. Factor 1: How to present material – KittingAs aforementioned, one interesting area within material supply systems is the principle of kitting. Further, in previous research two types of kits have been identified (Hanson & Brolin, 2013): unstructured and structured kits, both of which can be perceived as carriers of information, albeit differently organised. However, to investigate their discrepancies and argued effects, in terms of cognitive aspects, as well as assembly time and assembly error, these kits were tested against the use of continuous supply in the experimental study. This then constituted the three levels within the material presentation factor;
• Using a traditional material rack where material was presented in boxes on a shelf.• Using an unstructured kit where the required components were presented in a large
box with no unnecessary components.
Dow
nloa
ded
by [
Hog
skol
ebib
liote
ket I
Sko
vde]
at 0
0:22
27
Sept
embe
r 20
17
144 A. BROLIN ET AL.
• Using a structured kit where the required components were presented in a box and placed in the box according to the assembly sequence.
2.1.2. How to present information – SyntaxA common way of presenting information to the assembler is by using computer monitors. They are mainly used to show component variants, number of components to assemble, component numbers and in what order they should be picked. However, compared to some paper instructions, the computer instructions often display information in a more structured way, using a distinct highlight (colour) of the assembly task currently being per-formed, which is one of the features to be improved from the paper instructions, although still communicating through text and numbers. The monitor can also display symbols of a simpler kind. However, one problem with this way of presenting information is that it provides the assembler with too much information rather the appropriate information, for example component numbers and order numbers. A lot of information is usually also displayed in a small area, making it difficult for the reader to quickly distinguish, extract and interpret specific information which often is the case in the automotive industry. A previous investigation (Brolin et al., 2012) showed that the most common information the assembler is in need of concerns the type of product variant, and thus what components to pick and assemble.
In the experimental study it was therefore of interest to investigate if different forms of instructions had an effect on the assembler. Based on previous research (Brolin, Bäckstrand, Högberg, & Case, 2011; Brolin et al., 2012; Hanson & Brolin, 2013), the suggestion was to use text & number instructions as they still are a common way to present information in manual assembly, as well as using photograph instructions, to test a more visual alternative. Therefore these presentation alternatives were chosen to constitute the different levels within the information presentation factor.
Traditionally, text and number instructions consist of a list with article numbers and a brief description. The article numbers usually consist of 6–8 digits, which often are shortened to the last three digits for better and faster interpretation, as used in this experiment. As pointed out, another way of presenting information is by using pictures or photographs, which potentially may ease and speed up the interpretation of information. This difference constituted the two different levels of the second factor, information presentation:
• Using a traditional sheet of paper containing component text & numbers.• Using photographs depicting the correct assembly.
2.1.3. Component variationIt has been noted in earlier studies that component variation is a factor that potentially could affect the assembly operator (Brolin et al., 2011, 2012; Hanson & Brolin, 2013), as well as greatly increase complexity of work (Lindblom & Thorvald, 2014; Thorvald & Lindblom, 2014). Therefore this factor was also included in the experimental study, as the third factor, Component variant:
• Using no component variation.• Using component variation (five variants out of a pool of nine).
Dow
nloa
ded
by [
Hog
skol
ebib
liote
ket I
Sko
vde]
at 0
0:22
27
Sept
embe
r 20
17
PRODUCTION & MANUFACTURING RESEARCH 145
2.2. Hypotheses
The hypotheses (HA to HE) used for this factorial experiment concerns the different lev-els of the factors: Material presentation (HA-HC), Information presentation (HD) and Component variation (HE). As previously mentioned, the hypotheses are based on task time and number of errors:
H1A: The performance when using a structured kit is better than the performance when using a material rack.
H0A: The performance when using a structured kit is worse than or equal to the performance when using a material rack.
H1B: The performance when using an unstructured kit is better than the performance when using a material rack.
H0B: The performance when using an unstructured kit is worse than or equal to the perfor-mance when using a material rack.
H1C: The performance when using a structured kit is better than the performance when using an unstructured kit.
H0C: The performance when using a structured kit is worse than or equal to the performance when using a structured kit.
H1D: The performance when using a photograph is better than the performance when using text & numbers.
H0D: The performance when using photography is worse than or equal to the performance when using text & numbers.
H1E: The performance when assembling products with no component variation is better than the performance when assembling products with components variation.
H0E: The performance when assembling products with no component variation is worse than or equal to the performance when assembling products with component variation.
3. Experimental set up
This paper describes an experimental study where material presentation, information pres-entation and the effects of mixed mode assembly are evaluated. The purpose of the study was to investigate the performance outcome of these factors (i.e. assembly time and assembly errors) as well as perceived mental workload, see Section 3.1.2.
One of the major starting points of this research, and other research in the field, was that the complexity of work arises from several different sources. For example, an assembler receives information, not only from the instructions but also from the assembly material, environment and peers. It is usually not only one isolated factor at a time that affects the work situation, but several factors in different combinations. Thus, this experimental study explored how different factors affected the assembly operator at a workstation.
This experiment used a mixed method design (Creswell & Clark, 2007) which included both a quantitative study, including time and errors as dependant measures, and a quali-tative study, including workload ratings and a questionnaire. The quantitative study acted
Dow
nloa
ded
by [
Hog
skol
ebib
liote
ket I
Sko
vde]
at 0
0:22
27
Sept
embe
r 20
17
146 A. BROLIN ET AL.
as a base for the hypotheses whereas the qualitative data mostly acted as support to verify and strengthen the quantitative study and thus the hypotheses.
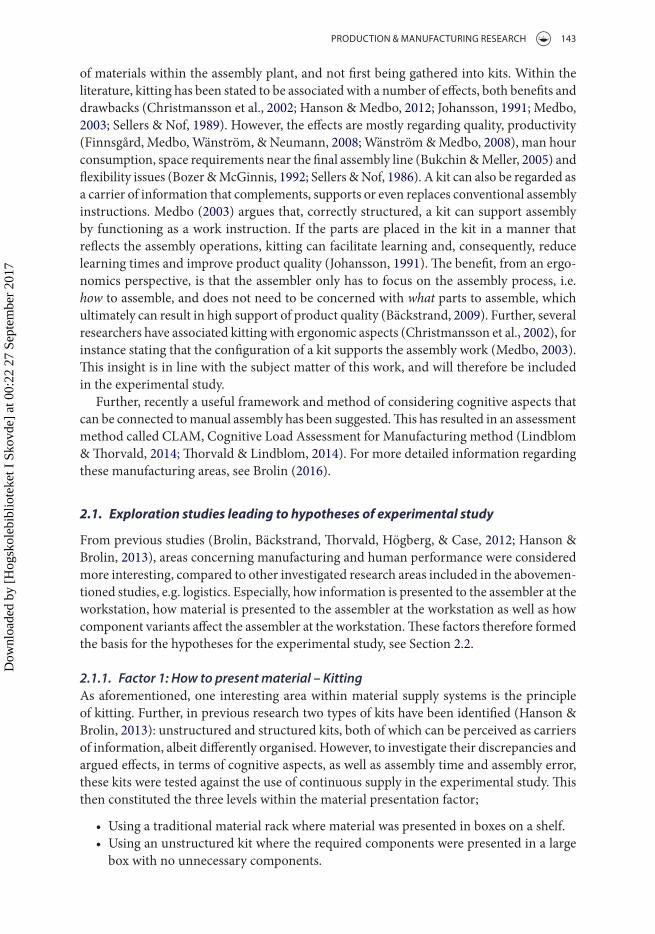
The experiment took place in an advanced assembly laboratory environment. The exper-iment made use of an assembly workstation in an assembly line laboratory where a pedal car was partly assembled (Figure 1).
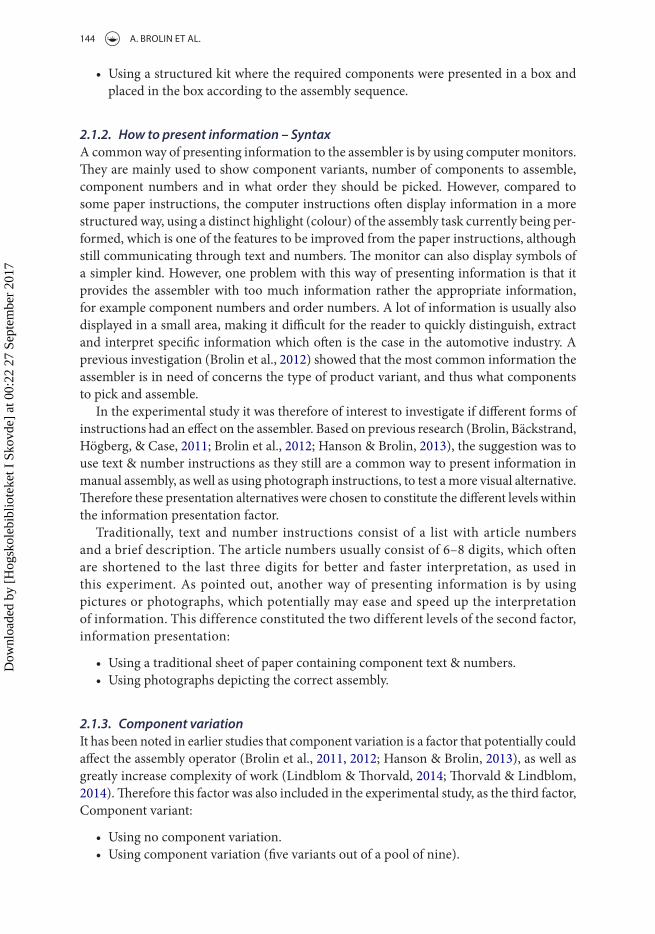
These hypotheses were tested through a full factorial experimental design, consisting of 2 × 2 × 3 factors, where the levels of the three factors involved in the hypotheses were com-bined in all possible combinations to be able to reject the null hypotheses for each factor (Figure 2). However, in this paper, only the results from the main effects will be reported.
Figure 1. the assembly product used in this experiment, a pedal car.
Figure 2. illustration of the involved factors and the possible combinations.Dow
nloa
ded
by [
Hog
skol
ebib
liote
ket I
Sko
vde]
at 0
0:22
27
Sept
embe
r 20
17
PRODUCTION & MANUFACTURING RESEARCH 147
3.1. Variables
As previously stated, the independent variables that were used in this experiment were:
• Material presentation;
º Material rack (MR) º Unstructured kit (USK) º Structured kit (SK)
• Information presentation;
º Text & numbers (TEXT) º Photographs (in combination with a brief descriptive word or number) (PHOTO)
• Component variation;
No component variation (NO)Component variation (VAR)
These factors represent common ways of presenting information to the assembler, which is needed to perform the assembly tasks.
3.1.1. Dependant variablesAs for measurement, the dependent variables in the experiment were the following:
• Assembly time; how long it takes for one person to assemble a pedal car, measured in seconds (s).
• Assembly error; number of errors that occurred during the assembly task.
The primary measurement used in this experiment was time, since it was considered reliable and easy to measure but is also expected from industry in terms of productivity. Since productivity is such an important aspect in the automotive industry, it can be argued that stress, and subsequently workload, comes along with this, making this a valuable measurement.
Another measurement was error, which is very common measurement in the field (Bäckstrand, Thorvald, De Vin, Högberg, & Case, 2008; Thorvald, Brolin, Högberg, & Case, 2010). In this experiment there were two types of errors that were recorded: picking the wrong component while assembling it correctly and/or picking the correct component but assembling it incorrectly.
3.1.2. Supporting measurementsTo verify and strengthen the results of the quantitative study, additional qualitative data was gathered to capture the user experience and assemblers’ opinions.
• NASA TLX workload rating, a workload assessment tool to assess both the mental and physical workload that the subject perceived during the assembly task.
• Questionnaire; gathering the users’ opinions and experiences regarding the different ways of presenting and perceiving the information and material.
The NASA TLX workload assessment method (Hart, 2006; Hart & Staveland, 1988) was used as a method to quantify subjective responses of perceived workload according to a
Dow
nloa
ded
by [
Hog
skol
ebib
liote
ket I
Sko
vde]
at 0
0:22
27
Sept
embe
r 20
17
148 A. BROLIN ET AL.
predefined template. This mental assessment tool aims at rating the performance of a task on six different workload subscales: mental demand, physical demand, temporal demand, performance, effort and frustration. Each scale was divided into 20 intervals. These ratings were then converted into scores that vary from 0 to 100. The outcome provides an overall workload score, based upon the weighting of the different subscales.
The questionnaire contained both ratings and open questions regarding to what extent the instructions and the material presentation affected the assembly operation as well as which instruction was easiest or hardest to understand. The questionnaire was written in Swedish, since all of the subjects spoke Swedish, for further details see Brolin (2016).
3.2. Subjects
Thirty-six subjects volunteered for the experiment. Most were engineering students at the University of Skövde, but there were also a few students from the computer science departments as well as some teachers. The ages ranged from 19 to 62 years. A few subjects had previously taken a course on production engineering, which involved assembling pedal cars in this specific laboratory and had therefore gained experience of the product and the assembly operations. The subjects consisted of 19 women and 17 men, which is a slightly more even gender distri-bution in this experiment compared to the reality in the automotive industry, where men are overly represented. No disabilities were reported that would have any effect on the outcome.
3.3. Equipment and environment
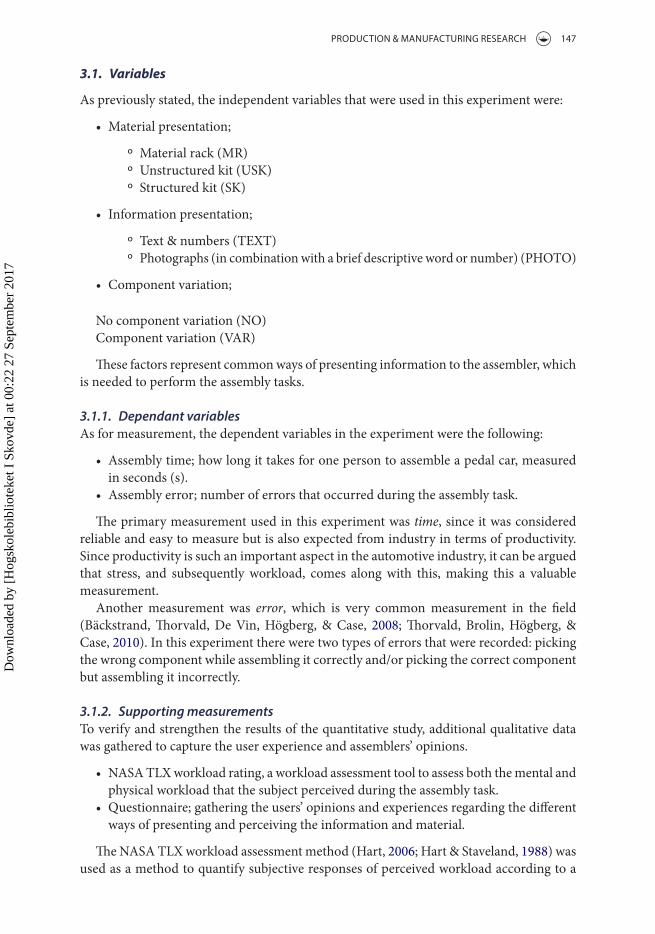
The experiment took place in a production laboratory at the University of Skövde. The room was equipped with hand tools and machines (Figure 3) and there were safety rules that had to be followed.
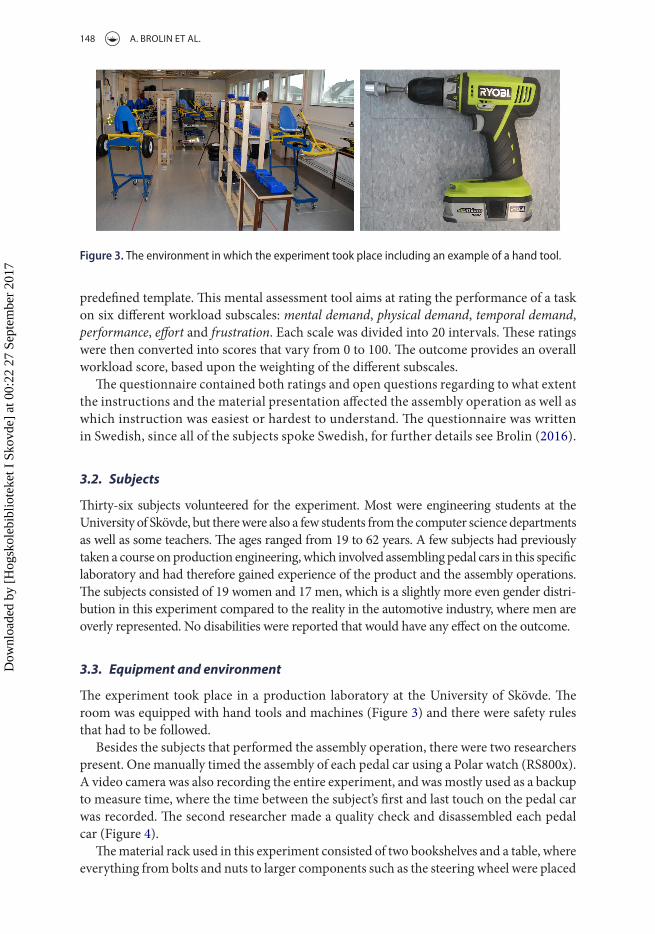
Besides the subjects that performed the assembly operation, there were two researchers present. One manually timed the assembly of each pedal car using a Polar watch (RS800x). A video camera was also recording the entire experiment, and was mostly used as a backup to measure time, where the time between the subject’s first and last touch on the pedal car was recorded. The second researcher made a quality check and disassembled each pedal car (Figure 4).
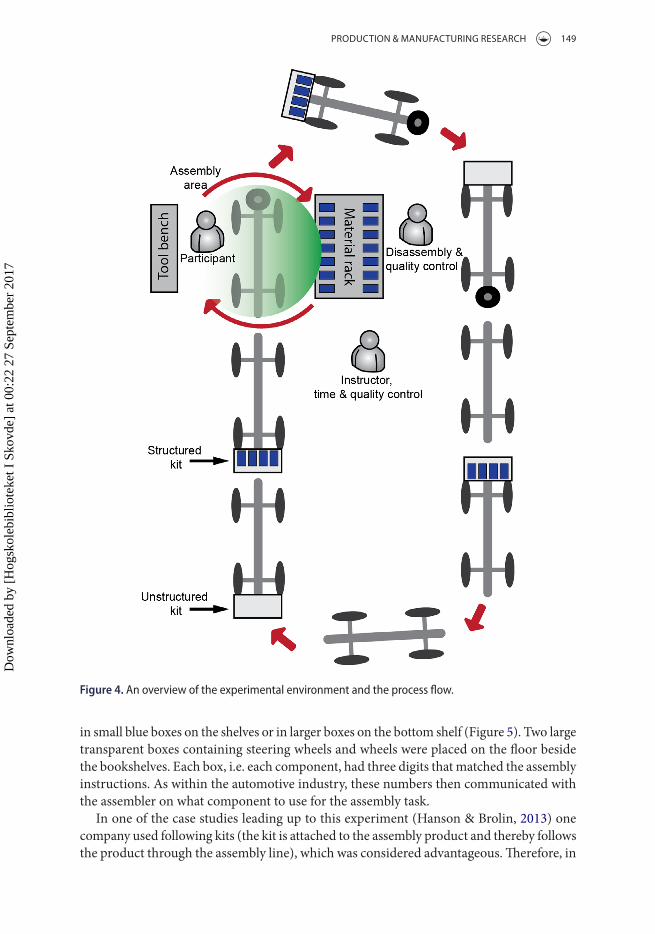
The material rack used in this experiment consisted of two bookshelves and a table, where everything from bolts and nuts to larger components such as the steering wheel were placed
Figure 3. the environment in which the experiment took place including an example of a hand tool.
Dow
nloa
ded
by [
Hog
skol
ebib
liote
ket I
Sko
vde]
at 0
0:22
27
Sept
embe
r 20
17
PRODUCTION & MANUFACTURING RESEARCH 149
in small blue boxes on the shelves or in larger boxes on the bottom shelf (Figure 5). Two large transparent boxes containing steering wheels and wheels were placed on the floor beside the bookshelves. Each box, i.e. each component, had three digits that matched the assembly instructions. As within the automotive industry, these numbers then communicated with the assembler on what component to use for the assembly task.
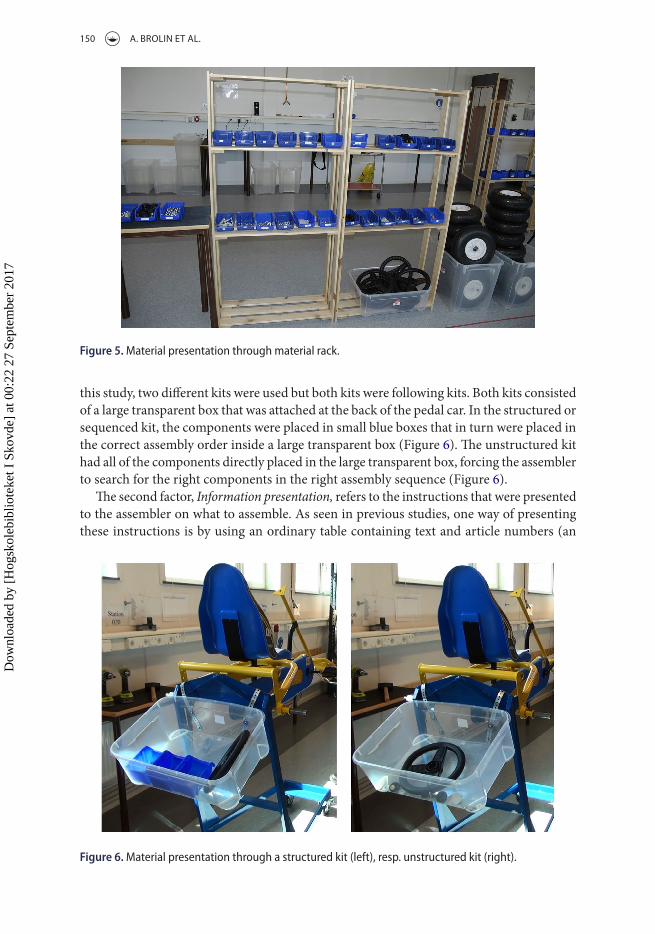
In one of the case studies leading up to this experiment (Hanson & Brolin, 2013) one company used following kits (the kit is attached to the assembly product and thereby follows the product through the assembly line), which was considered advantageous. Therefore, in
Figure 4. an overview of the experimental environment and the process flow.
Dow
nloa
ded
by [
Hog
skol
ebib
liote
ket I
Sko
vde]
at 0
0:22
27
Sept
embe
r 20
17
150 A. BROLIN ET AL.
this study, two different kits were used but both kits were following kits. Both kits consisted of a large transparent box that was attached at the back of the pedal car. In the structured or sequenced kit, the components were placed in small blue boxes that in turn were placed in the correct assembly order inside a large transparent box (Figure 6). The unstructured kit had all of the components directly placed in the large transparent box, forcing the assembler to search for the right components in the right assembly sequence (Figure 6).
The second factor, Information presentation, refers to the instructions that were presented to the assembler on what to assemble. As seen in previous studies, one way of presenting these instructions is by using an ordinary table containing text and article numbers (an
Figure 5. Material presentation through material rack.
Figure 6. Material presentation through a structured kit (left), resp. unstructured kit (right).
Dow
nloa
ded
by [
Hog
skol
ebib
liote
ket I
Sko
vde]
at 0
0:22
27
Sept
embe
r 20
17
PRODUCTION & MANUFACTURING RESEARCH 151
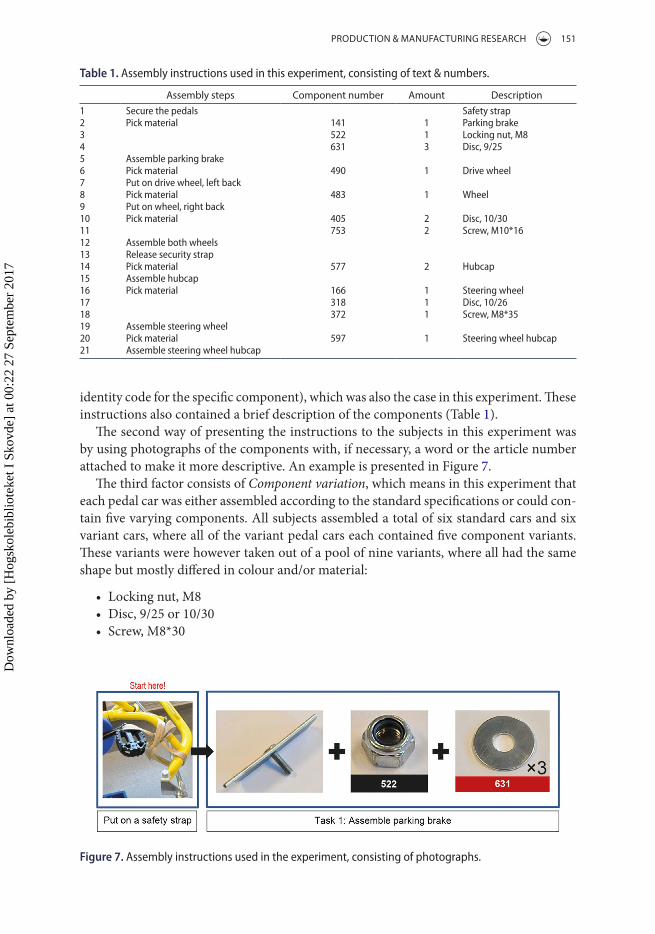
identity code for the specific component), which was also the case in this experiment. These instructions also contained a brief description of the components (Table 1).
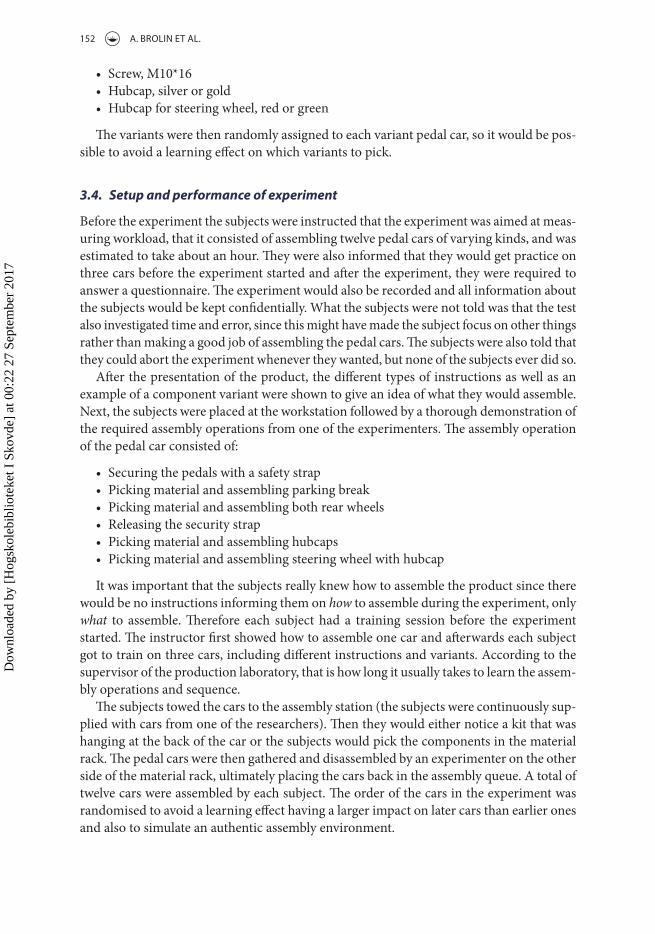
The second way of presenting the instructions to the subjects in this experiment was by using photographs of the components with, if necessary, a word or the article number attached to make it more descriptive. An example is presented in Figure 7.
The third factor consists of Component variation, which means in this experiment that each pedal car was either assembled according to the standard specifications or could con-tain five varying components. All subjects assembled a total of six standard cars and six variant cars, where all of the variant pedal cars each contained five component variants. These variants were however taken out of a pool of nine variants, where all had the same shape but mostly differed in colour and/or material:
• Locking nut, M8• Disc, 9/25 or 10/30• Screw, M8*30
Table 1. assembly instructions used in this experiment, consisting of text & numbers.
Assembly steps Component number Amount Description1 secure the pedals safety strap2 Pick material 141 1 Parking brake3 522 1 Locking nut, M84 631 3 disc, 9/255 assemble parking brake6 Pick material 490 1 drive wheel7 Put on drive wheel, left back8 Pick material 483 1 Wheel9 Put on wheel, right back10 Pick material 405 2 disc, 10/3011 753 2 screw, M10*1612 assemble both wheels13 release security strap14 Pick material 577 2 hubcap15 assemble hubcap16 Pick material 166 1 steering wheel17 318 1 disc, 10/2618 372 1 screw, M8*3519 assemble steering wheel20 Pick material 597 1 steering wheel hubcap21 assemble steering wheel hubcap
Figure 7. assembly instructions used in the experiment, consisting of photographs.
Dow
nloa
ded
by [
Hog
skol
ebib
liote
ket I
Sko
vde]
at 0
0:22
27
Sept
embe
r 20
17
152 A. BROLIN ET AL.
• Screw, M10*16• Hubcap, silver or gold• Hubcap for steering wheel, red or green
The variants were then randomly assigned to each variant pedal car, so it would be pos-sible to avoid a learning effect on which variants to pick.
3.4. Setup and performance of experiment
Before the experiment the subjects were instructed that the experiment was aimed at meas-uring workload, that it consisted of assembling twelve pedal cars of varying kinds, and was estimated to take about an hour. They were also informed that they would get practice on three cars before the experiment started and after the experiment, they were required to answer a questionnaire. The experiment would also be recorded and all information about the subjects would be kept confidentially. What the subjects were not told was that the test also investigated time and error, since this might have made the subject focus on other things rather than making a good job of assembling the pedal cars. The subjects were also told that they could abort the experiment whenever they wanted, but none of the subjects ever did so.
After the presentation of the product, the different types of instructions as well as an example of a component variant were shown to give an idea of what they would assemble. Next, the subjects were placed at the workstation followed by a thorough demonstration of the required assembly operations from one of the experimenters. The assembly operation of the pedal car consisted of:
• Securing the pedals with a safety strap• Picking material and assembling parking break• Picking material and assembling both rear wheels• Releasing the security strap• Picking material and assembling hubcaps• Picking material and assembling steering wheel with hubcap
It was important that the subjects really knew how to assemble the product since there would be no instructions informing them on how to assemble during the experiment, only what to assemble. Therefore each subject had a training session before the experiment started. The instructor first showed how to assemble one car and afterwards each subject got to train on three cars, including different instructions and variants. According to the supervisor of the production laboratory, that is how long it usually takes to learn the assem-bly operations and sequence.
The subjects towed the cars to the assembly station (the subjects were continuously sup-plied with cars from one of the researchers). Then they would either notice a kit that was hanging at the back of the car or the subjects would pick the components in the material rack. The pedal cars were then gathered and disassembled by an experimenter on the other side of the material rack, ultimately placing the cars back in the assembly queue. A total of twelve cars were assembled by each subject. The order of the cars in the experiment was randomised to avoid a learning effect having a larger impact on later cars than earlier ones and also to simulate an authentic assembly environment.
Dow
nloa
ded
by [
Hog
skol
ebib
liote
ket I
Sko
vde]
at 0
0:22
27
Sept
embe
r 20
17
PRODUCTION & MANUFACTURING RESEARCH 153
In this case the car numbers were also randomised in order to get data that was not affected by the order in which the different assembly tasks (pedal cars) were performed, since the cars differed in combination of levels of the different factors and thus potentially also in difficulty. Table 2 shows the entire design of experiment, including the level of the factors.
To be able to obtain relevant results out of all the data, both qualitative and quantitative, it was necessary to figure out the statistical framework in which the analysis would take place. This experiment was a full factorial experiment where each subject performed all possible combinations, and a repeated measure analysis was conducted. This was performed with the quantitative data but also with the NASA TLX workload ratings, even though these measurements mainly acted as a support along with the data from the questionnaire. In the repeated analysis, and in this paper, the main effects were of interest since they either confirm or reject the hypotheses, depending on them being significant or not (Section 4).
4. Results
Since the sample size was considered large (with 36 subjects), a normal distribution of the data was assumed (Field, 2014), which was also confirmed by initial analyses.
4.1. Results from the main effects concerning time
Analyses of the results show that all of the main effects were significant. In more detail, analysis of material presentation, using a pairwise comparison analysis (Table 3), show that there was a significant difference between material rack and unstructured kit (p < 0.001) as well as material rack and structured kit (p < 0.001). However, the difference between the kits was non-significant.
The table also shows that the mean difference was large between material rack and kits (49.8 s resp. 60.2 s). The results clearly show that there was a significant difference between using the different kits and the use of a material rack. Analysis on the main effect informa-tion presentation show that there was a significant difference between text and numbers compared to photographs (p < 0.001), where the mean difference was 16.8 s. Analysis on the main effect of component variation show that there was a significant difference between using products with no component variation compared to products having component variation (p < 0.001), albeit small with the mean difference being ~10.5 s.
Table 2. the design of the factorial experiment, including the factors and possible component variants.
Car nr. Component variation Information presentation Material presentation1 no component variation Photographs structured kit2 component variation Photographs structured kit3 no component variation text & numbers structured kit4 component variation text & numbers structured kit5 no component variation Photographs unstructured kit6 component variation Photographs unstructured kit7 no component variation text & numbers unstructured kit8 component variation text & numbers unstructured kit9 no component variation Photographs Material rack10 component variation Photographs Material rack11 no component variation text & numbers Material rack12 component variation text & numbers Material rack
Dow
nloa
ded
by [
Hog
skol
ebib
liote
ket I
Sko
vde]
at 0
0:22
27
Sept
embe
r 20
17
154 A. BROLIN ET AL.
The results clearly show that there was a significant difference between using either kit and the use of a material rack. It was therefore possible to reject the null hypothesis H0A, since using a structured kit was better than using a material rack. The null hypothesis H0B could also be rejected, since using an unstructured kit was better than using a material rack. The null hypothesis H0C could however not be rejected as the difference between using an unstructured kit and a structured kit was not statistically significant.
The effect sizes of the significant effects are based on the contrast analysis presented in Table 4.
As Table 4 provides the effect sizes, it was first necessary to check if it was possible to confirm the hypotheses concerning the main effects.
Using a material rack (MR) compared to a structured kit (SK) was significant with F(1, 35) = 65.86, p < 0.001 and r = 0.81, which was a very large effect size according to Cohen (1988, 1992), where r > 0.5 is regarded large, r > 0.3 = medium and r > 0.1 is regarded small. With an effect size considered as large, the hypotheses H1A could be confirmed meaning that using a structured kit was better than using a material rack.
Using a material rack compared to an unstructured kit (USK) was significant with F(1, 35) = 88.75, p < 0.001 and r = 0.85, which also was a very large effect size. This also con-firmed the hypothesis H1B, meaning that using an unstructured kit was better than using a material rack.
Using an unstructured kit compared to a structured kit was significant with F(1, 35) = 4.98, p = 0.032 and r = 0.35 which was a medium effect size. This contradicted the post hoc test pairwise comparison (Table 3) which stated that the difference between the
Table 3. a combined table showing pairwise comparison of the main effects, measured in time [s], cor-rected using a Bonferroni adjustment.
Based on estimated marginal means.*the mean difference is significant at the 0.05 level. aadjustment for multiple comparisons: Bonferroni.
Test level A Test level BMean differ-ence (A−B) Std. Error Sig.a
95% Confidence interval for differencea
Lower bound Upper bound
Material presentationMaterial rack unstructured kit 49.840* 5.290 0.000 36.537 63.143Material rack structured kit 60.153 7.412 0.000 41.514 78.791unstructured kit structured kit 10.312 4.620 0.096 −1.306 21.931
Information presentationtext & numbers Photographs 16.778* 3.474 0.000 9.725 23.831
Component variationno variation Variation −10.528* 3.270 0.003 −17.166 −3.890
Table 4. contrast analysis regarding the main and interaction effects, as well as the effect size (r).
SourceMaterial
presentationInformation presentation
Component variation df F Sig. r
Material Presentation usK vs. Mr 1 88.752 0.000 0.85sK vs. Mr 1 65.858 0.000 0.81usK vs. sK 1 4.98 0.032 0.35
information Presentation
Photographs vs. text & numbers
1 23.322 0.000 0.63
component variation Variation vs. no variation
1 10.367 0.003 0.48
Dow
nloa
ded
by [
Hog
skol
ebib
liote
ket I
Sko
vde]
at 0
0:22
27
Sept
embe
r 20
17
PRODUCTION & MANUFACTURING RESEARCH 155
kits was non-significant. Consequently, this result did not confirm the non-rejection of hypothesis H1C, but rather showed that there was a difference between the kits, i.e. a struc-tured kit was better compared to an unstructured kit. Consequently, this result needed to be interpreted and handled carefully, and was therefore analysed further discussed in the Discussion section (Section 5).
4.2. Results from the NASA TLX workload ratings
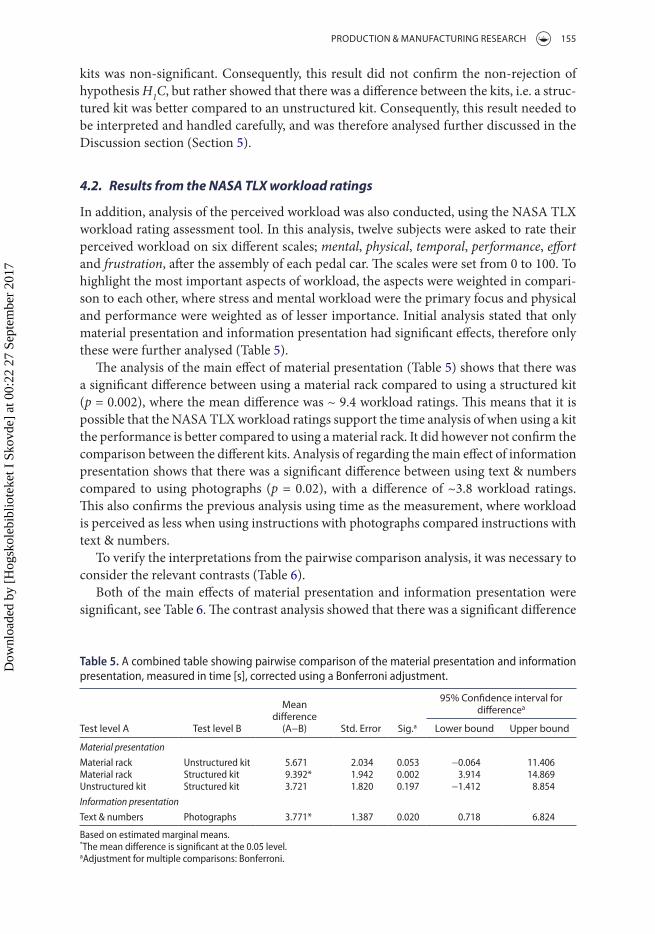
In addition, analysis of the perceived workload was also conducted, using the NASA TLX workload rating assessment tool. In this analysis, twelve subjects were asked to rate their perceived workload on six different scales; mental, physical, temporal, performance, effort and frustration, after the assembly of each pedal car. The scales were set from 0 to 100. To highlight the most important aspects of workload, the aspects were weighted in compari-son to each other, where stress and mental workload were the primary focus and physical and performance were weighted as of lesser importance. Initial analysis stated that only material presentation and information presentation had significant effects, therefore only these were further analysed (Table 5).
The analysis of the main effect of material presentation (Table 5) shows that there was a significant difference between using a material rack compared to using a structured kit (p = 0.002), where the mean difference was ~ 9.4 workload ratings. This means that it is possible that the NASA TLX workload ratings support the time analysis of when using a kit the performance is better compared to using a material rack. It did however not confirm the comparison between the different kits. Analysis of regarding the main effect of information presentation shows that there was a significant difference between using text & numbers compared to using photographs (p = 0.02), with a difference of ~3.8 workload ratings. This also confirms the previous analysis using time as the measurement, where workload is perceived as less when using instructions with photographs compared instructions with text & numbers.
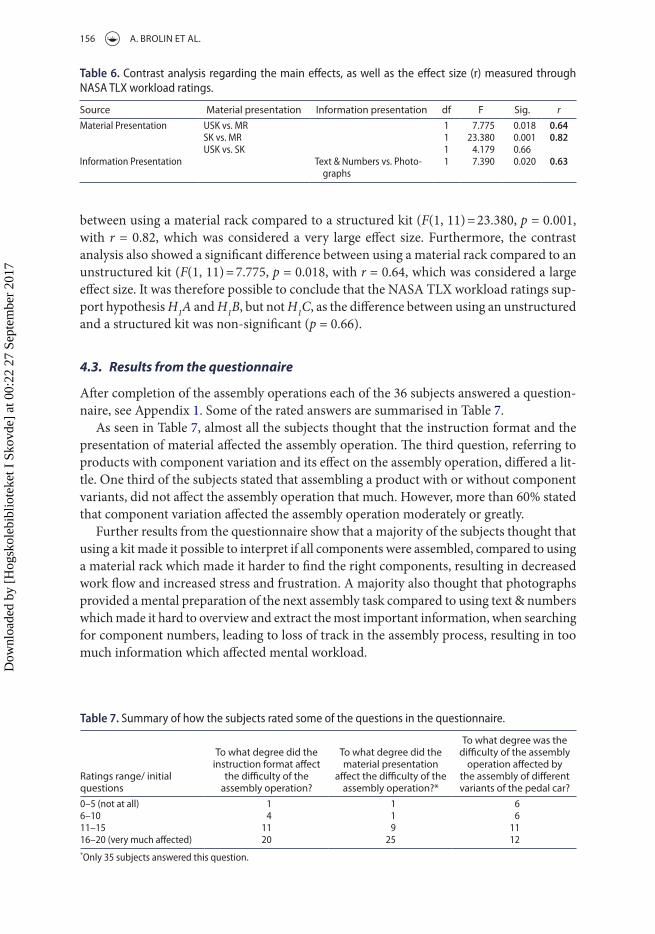
To verify the interpretations from the pairwise comparison analysis, it was necessary to consider the relevant contrasts (Table 6).
Both of the main effects of material presentation and information presentation were significant, see Table 6. The contrast analysis showed that there was a significant difference
Table 5. a combined table showing pairwise comparison of the material presentation and information presentation, measured in time [s], corrected using a Bonferroni adjustment.
Based on estimated marginal means.*the mean difference is significant at the 0.05 level.aadjustment for multiple comparisons: Bonferroni.
Test level A Test level B
Mean difference
(A−B) Std. Error Sig.a
95% Confidence interval for differencea
Lower bound Upper bound
Material presentationMaterial rack unstructured kit 5.671 2.034 0.053 −0.064 11.406Material rack structured kit 9.392* 1.942 0.002 3.914 14.869unstructured kit structured kit 3.721 1.820 0.197 −1.412 8.854
Information presentationtext & numbers Photographs 3.771* 1.387 0.020 0.718 6.824
Dow
nloa
ded
by [
Hog
skol
ebib
liote
ket I
Sko
vde]
at 0
0:22
27
Sept
embe
r 20
17
156 A. BROLIN ET AL.
between using a material rack compared to a structured kit (F(1, 11) = 23.380, p = 0.001, with r = 0.82, which was considered a very large effect size. Furthermore, the contrast analysis also showed a significant difference between using a material rack compared to an unstructured kit (F(1, 11) = 7.775, p = 0.018, with r = 0.64, which was considered a large effect size. It was therefore possible to conclude that the NASA TLX workload ratings sup-port hypothesis H1A and H1B, but not H1C, as the difference between using an unstructured and a structured kit was non-significant (p = 0.66).
4.3. Results from the questionnaire
After completion of the assembly operations each of the 36 subjects answered a question-naire, see Appendix 1. Some of the rated answers are summarised in Table 7.
As seen in Table 7, almost all the subjects thought that the instruction format and the presentation of material affected the assembly operation. The third question, referring to products with component variation and its effect on the assembly operation, differed a lit-tle. One third of the subjects stated that assembling a product with or without component variants, did not affect the assembly operation that much. However, more than 60% stated that component variation affected the assembly operation moderately or greatly.
Further results from the questionnaire show that a majority of the subjects thought that using a kit made it possible to interpret if all components were assembled, compared to using a material rack which made it harder to find the right components, resulting in decreased work flow and increased stress and frustration. A majority also thought that photographs provided a mental preparation of the next assembly task compared to using text & numbers which made it hard to overview and extract the most important information, when searching for component numbers, leading to loss of track in the assembly process, resulting in too much information which affected mental workload.
Table 6. contrast analysis regarding the main effects, as well as the effect size (r) measured through nasa tLX workload ratings.
Source Material presentation Information presentation df F Sig. rMaterial Presentation usK vs. Mr 1 7.775 0.018 0.64
sK vs. Mr 1 23.380 0.001 0.82usK vs. sK 1 4.179 0.66
information Presentation text & numbers vs. Photo-graphs
1 7.390 0.020 0.63
Table 7. summary of how the subjects rated some of the questions in the questionnaire.
*only 35 subjects answered this question.
Ratings range/ initial questions
To what degree did the instruction format affect
the difficulty of the assembly operation?
To what degree did the material presentation
affect the difficulty of the assembly operation?*
To what degree was the difficulty of the assembly
operation affected by the assembly of different variants of the pedal car?
0–5 (not at all) 1 1 66–10 4 1 611–15 11 9 1116–20 (very much affected) 20 25 12
Dow
nloa
ded
by [
Hog
skol
ebib
liote
ket I
Sko
vde]
at 0
0:22
27
Sept
embe
r 20
17
PRODUCTION & MANUFACTURING RESEARCH 157
5. Discussion and conclusion
The main findings in this experiment were that using a material rack takes a longer time and generates higher workload compared to using a kit, which was to some extent also expected. As the subjects stated, this probably had to do with the increased need for searching and fetching components when using a material rack. Instead, when using a kit, all of the com-ponents were placed in one small area (attached to the assembly product), the structured kit even had the components order in a structured way according to the assembly process, completely removing the need to search for components. Associated with this there was still an issue of whether or not the correct components had been placed in the box by the instructor or experimenter. Related to the manual assembly industry, the idea here is that the decision of what to assemble, and thus which components should be placed in a kit, is moved from the assembly line to a kitting area of some sort (either centralised or locally) in the factory plant. This then makes it possible for the assembler to only focus on how to assemble, which is more related to the assembly skills and technique which have been taught to the assembly worker during training sessions at the beginning of the employment. When dealing with the kitting area, it is therefore possible to really focus on appropriate information support to the kitting personnel of what to assemble, or perhaps even making this process automated.
Using photograph instructions generated shorter assembly times and lower workload compared to using text & number instructions. This could be explained through using photographs provided a mental preparation of the next assembly sub task, as the assem-blers were able to get an overview of the entire assembly operation and thus scan through the instructions and extract relevant information. This corresponds to several usability and design principles such as visibility but also aesthetics and minimalist design (Nielsen, 1993), as when using photographs only the relevant information is visible. This in turn made the entire assembly operation not only faster but also easier to handle from a cognitive point of view as it was possible to stay ahead of the information and the task. The focus on the relevant information became better and therefore the opportunity arose to discard unnecessary information. Subjects claimed that photographs made it possible to identify differences between the components such as colour, size and material, and thus they needed only to search for these exceptions. This could indicate that the subjects changed their search path, from primarily numbers (when using text & numbers) to visual attributes, as these are more prominent, further enhancing the use of photographs to the design and usability principles of for example mapping (matching) and visibility (Nielsen, 1993; Norman, 2002). In contrast, instructions consisting of text & numbers failed to show irregularities clearly, with the result that it was hard to overview the instructions and extract the most important information when searching for component numbers. Consequently this not only led to loss of track in the assembly process but also too much information which affected the cognitive workload (Lindblom & Thorvald, 2014; Thorvald & Lindblom, 2014).
Furthermore, contradictory results between using an unstructured kit and a structured kit were found when assembly time was analysed. Even though the hypothesis H1C was confirmed through the contrast analysis stating that using a structured kit is better than using an unstructured kit, this issue needs to be handled carefully. Moreover, the NASA TLX workload ratings found no perceived difference between using the different kits. Additional information from the contrast analyses showed a medium effect size of r = 0.35 and a quite
Dow
nloa
ded
by [
Hog
skol
ebib
liote
ket I
Sko
vde]
at 0
0:22
27
Sept
embe
r 20
17
158 A. BROLIN ET AL.
small F-value F(1, 35) = 4.98, indicated that the difference between the kits was not as large as between the different kits and the material rack. However, even a small difference (in this experiment, 5 s) can have an impact when applied in a production context where there are short assembly cycles. However, it is probably safe to say that there is a difference between the kits, but the difference is most likely not as big as between the use of kits and the use of a material rack. One can probably say that a structured kit costs more in terms of space, working hours, extra work in terms of picking components and putting them in the box as well as more decisions (although outside of the assembly line). When regarding the unstructured kit one can state that it probably increases the search and thus the number of decisions, but the production system as a whole does not have to provide as much effort for structuring the kit. So what is the difference between the kits, except that using a structured kit in this experiment took about ten seconds less than using a structured kit? One possible difference is that structured information, as a structured kit, provides information about the assembly process to a higher degree and in a more precise way compared to unstructured components. This consequently decreases the need to search and interpret more information other than the kit itself. This in turn not only leads to a better focus on the assembly task but also decreases the information load and thus the cognitive workload for the assembler, which is partly what this experimental study did set out to investigate.
5.1. Future work
Although field studies are expensive and often involve considerable effort, in comparison to many laboratory studies, recommendations for further work are to investigate the findings from this research further in the field. This includes for instance the study of a possible limit for the number of components to put in a kitting box. This might be a greater concern when using an unstructured kit, since this kit involves a high risk of searching for compo-nents in the box. This would add complexity to the question of finding the magic number of components to put in the kits. While discussing the limit of components in the kits, it is also interesting to further study the use of similar components in the kits such as screws or bolts, since this would also add complexity, especially when using an unstructured kit. This further adds the question of how much complexity a kit can handle. It might be possible to say that a structured kit can handle more complexity, but this would most definitely also lead to higher cost in terms of, for instance, preparation, i.e. pre-sorting and pre-picking.
The results from the experimental study reported in this paper are merely a snapshot of the main findings from a much larger analysis including deeper examination of the data (Brolin, 2016). Further analysis has been undertaken with regard to the combination of the main effects. Since when performing observations at the various factories it was possible to get a more holistic perspective of the often very complex settings. Modern production systems differ greatly depending on, for instance, company and factory size, product com-plexity and economics. This provided the insight that it is not only one factor at a time that affects the assembler but several combined factors that form the complex manual assembly environment. These findings will be reported in future publications.
Disclosure statement
No potential conflict of interest was reported by the authors.
Dow
nloa
ded
by [
Hog
skol
ebib
liote
ket I
Sko
vde]
at 0
0:22
27
Sept
embe
r 20
17
PRODUCTION & MANUFACTURING RESEARCH 159
ORCID
Peter Thorvald http://orcid.org/0000-0002-8369-5471
References
Bäckstrand, G. (2009). Information flow and product quality in human based assembly. (Doctoral Thesis). Loughborough University, Loughborough.
Bäckstrand, G., Thorvald, P., De Vin, L., Högberg, D., & Case, K. (2008). The impact of information presentation on work environment and product quality: A case study. In Proceedings of the 40th annual Nordic Ergonomic Society Conference (NES). Reykjavik Iceland: NES
Bozer, Y. A., & McGinnis, L. F. (1992). Kitting versus line stocking: A conceptual framework and a descriptive model. International Journal of Production Economics, 28(1), 1–19.
Brolin, A. (2016). An investigation of cognitive aspects affecting human performance in manual assembly. (Doctor of Philosophy Doctoral). Loughborough University, Loughborough.
Brolin, A., Bäckstrand, G., Högberg, D. & Case, K. (2011). The use of kitting to ease assemblers’ cognitive workload. Proceedings of the 43rd annual Nordic Ergonomics Society Conference, (pp. 77–82), Oulu, Finland.
Brolin, A., Bäckstrand, G., Thorvald, P., Högberg, D., & Case, K. (2012). Kitting as an information source in manual assembly. In S. Trzcielinski, & W. Karwowski (Eds.), Advances in ergonomics in manufacturing (pp. 346–353). CRC Press.
Bukchin, Y., & Meller, R. (2005). A space allocation algorithm for assembly line components. IIE Transactions, 37, 51–61.
Calinescu, A. (2002). Manufacturing complexity: An integrative information-theoretic approach (Doctoral Thesis). University of Oxford, Oxford.
Christmansson, M., Medbo, L., Hansson, G. Å., Ohlsson, K., Unge Byström, J., Möller, T., & Forsman, M. (2002). A case study of a principally new way of materials kitting–an evaluation of time consumption and physical workload. International Journal of Industrial Ergonomics, 30, 49–65.
Cohen, J. (1988). Statistical power analysis for the behavioural sciences (2nd ed.). New York, NY: Academic Press.
Cohen, J. (1992). A power primer. Psychological Bulletin, 112, 155–159.Creswell, J. W., & Clark, V. L. P. (2007). Designing and conducting mixed methods research (2nd ed.).
Thousand Oaks, CA: Sage.ElMaraghy, W., ElMaraghy, H., Tomiyama, T., & Monostori, L. (2012). Complexity in engineering
design and manufacturing. CIRP Annals-Manufacturing Technology, 61, 793–814.ElMaraghy, W., & Urbanic, R. (2003). Modelling of manufacturing system complexity. CIRP Annals
– Manufacturing Technology, 52, 363–366.Field, A. (2014). Discovering statistics using IBM SPSS statistics: And sex and drugs and rock ‘n’ roll
(4th ed.). London: Sage.Finnsgård, C., Medbo, L., Wänström, C. & Neumann, P. (2008). The impact of materials exposure
on the conditions at the workstation. In Proceedings of EurOMA Conference. Groningen, The Netherlands.
Fisher, M. L., & Ittner, C. D. (1999). The impact of product variety on automobile assembly operations: Empirical evidence and simulation analysis. Management Science, 45, 771–786.
Gullander, P., Davidsson, A., Dencker, K., Fasth, Å., Fässberg, T., Harlin, U., & Stahre, J. (2011). Towards a production complexity model that supports operation, re-balancing and man-hour planning. In Proceedings of the 4th Swedish Production Symposium (SPS). Lund, Sweden.
Hanson, R., & Brolin, A. (2013). A comparison of kitting and continuous supply in in-plant materials supply. International Journal of Production Research, 51, 979–992.
Hanson, R., & Medbo, L. (2012). Kitting and time efficiency in manual assembly. International Journal of Production Research, 50, 1115–1125.
Hart, S. G. (2006). Nasa-task load index (NASA-TLX); 20 years later. Proceedings of the human factors and ergonomics society annual meeting, 50, 904–908.
Dow
nloa
ded
by [
Hog
skol
ebib
liote
ket I
Sko
vde]
at 0
0:22
27
Sept
embe
r 20
17
160 A. BROLIN ET AL.
Hart, S. G., & Staveland, L. E. (1988). Development of NASA-TLX (Task Load Index): Results of empirical and theoretical research. Advances in psychology, 52, 139–183.
Hu, S. J., Ko, J., Weyand, L., ElMaraghy, H., Lien, T., Koren, Y., … Shpitalni, M. (2011). Assembly system design and operations for product variety. CIRP Annals-Manufacturing Technology, 60, 715–733.
Hu, S., Zhu, X., Wang, H., & Koren, Y. (2008). Product variety and manufacturing complexity in assembly systems and supply chains. CIRP Annals-Manufacturing Technology, 57, 45–48.
Johansson, M. I. (1991). Kitting systems for small parts in manual assembly systems. In Production Research–Approaching the 21st Century, Edited by: Pridham, M and O’Brien, C., Edited by: Pridham, M and O’Brien, C. (pp. 225–230). London: Taylor & Francis.
Lim, J. T., & Hoffmann, E. R. (2015). Strategies in performing a manual assembly task. International Journal of Industrial Ergonomics, 50, 121–129.
Lindblom, J., & Thorvald, P. (2014). Towards a framework for reducing cognitive load in manufacturing personnel. In K. Stanney & K. S. Hale (Eds.), Advances in cognitive engineering and neuroergonomics (pp. 233–244). Krakow: AHFE Conference.
Mattsson, S., Karlsson, M., Gullander, P., Van Landeghem, H., Zeltzer, L., Limère, V., … Stahre, J. (2014). Comparing quantifiable methods to measure complexity in assembly. International Journal of Manufacturing Research, 9, 112–130.
Medbo, L. (2003). Assembly work execution and materials kit functionality in parallel flow assembly systems. International Journal of Industrial Ergonomics, 31, 263–281.
Nielsen, J. (1993). Usability (Engineering ed.). San Francisco, CA: Morgan Kaufmann.Norman, D. A. (2002). The design of everyday (things ed.). New York, NY: Basic books.Peter, T. (2011). Presenting information in manual assembly (Doctoral Thesis). Loughborough
University, Loughborough.Reason, J. (1990). Human (Error ed.). New York, NY: Cambridge University Press.Säfsten, K., Winroth, M., & Löfving, M. (2014). Usability of a manufacturing strategy framework
developed for SMEs. Proceedings of the 6th Swedish Production Symposium (SPS). Sweden.Sellers, C., & Nof, S. (1986). Part kitting in robotic facilities. Material flow, 3, 163–174.Sellers, C., & Nof, S. (1989). Performance analysis of robotic kitting systems. Robotics and Computer-
Integrated Manufacturing, 6, 15–24.Shalin, V. L., Prabhu, G. V., & Helander, M. G. (1996). A cognitive perspective on manual assembly.
Ergonomics, 39, 108–127.Thorvald, P., Brolin, A., Högberg, D. & Case, K. (2010). Using mobile information sources to increase
productivity and quality. In W. Karwowski & S. Gavriel (Eds.), Proceedings of 3rd international conference on applied human factors and ergonomics. Miami, USA: USA Publishing.
Thorvald, P., & Lindblom, J. (2014). Initial development of a cognitive load assessment tool. In K. Stanney & K. S. Hale (Eds.), Advances in cognitive engineering and neuroergonomics (pp. 223–232). Krakow: AHFE Conference.
Wänström, C., & Medbo, L. (2008). The impact of materials feeding design on assembly process performance. Journal of Manufacturing Technology Management, 20, 30–51.
Wickens, C., & Hollands, J. (2000). Engineering psychology and human performance (3rd ed.). Upper Saddle River, NJ: Prentice Hall Inc..D
ownl
oade
d by
[H
ogsk
oleb
iblio
teke
t I S
kovd
e] a
t 00:
22 2
7 Se
ptem
ber
2017
PRODUCTION & MANUFACTURING RESEARCH 161
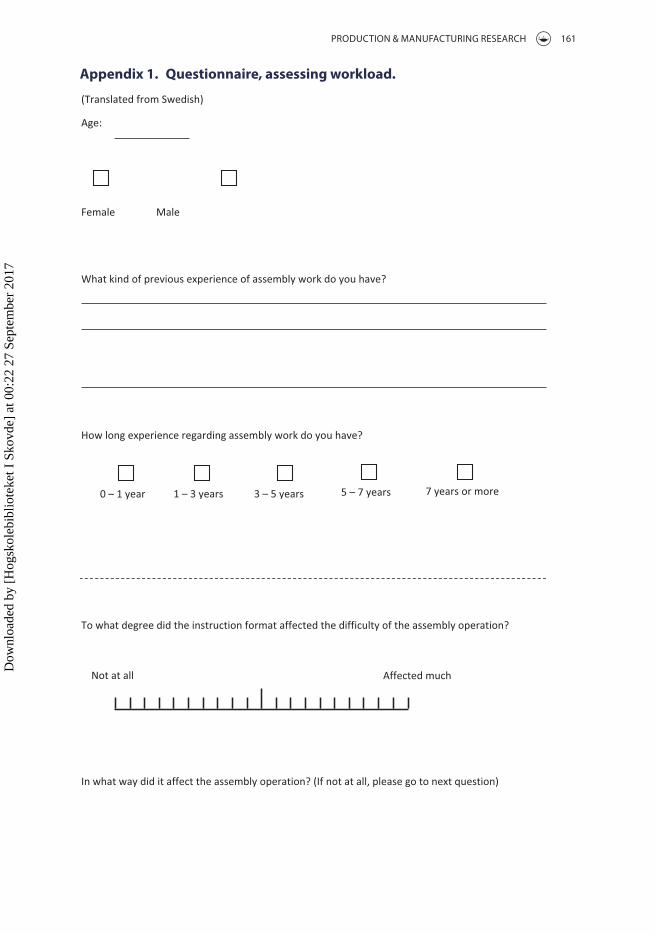
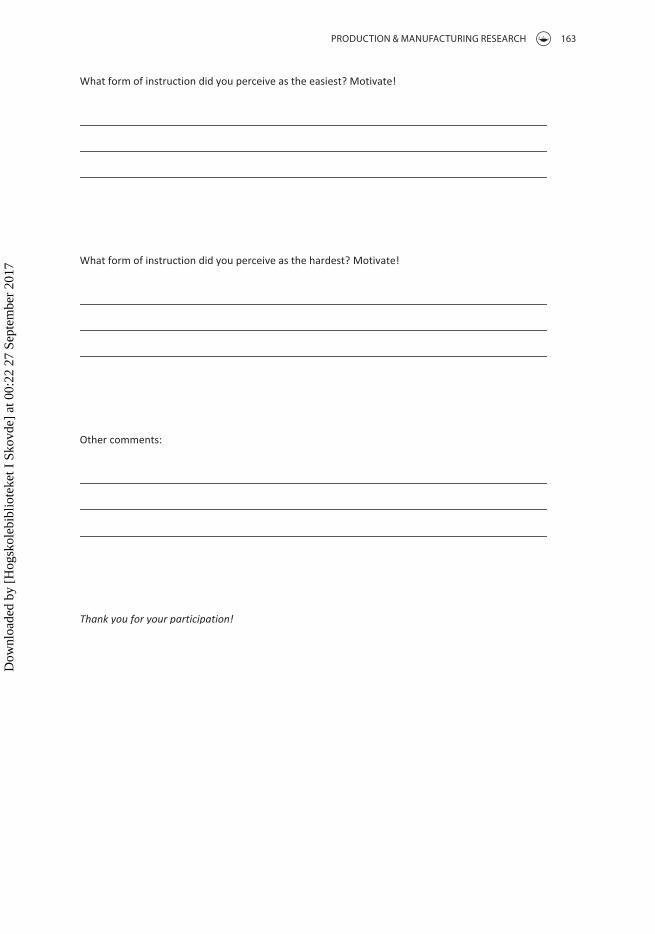
Appendix 1. Questionnaire, assessing workload.
Dow
nloa
ded
by [
Hog
skol
ebib
liote
ket I
Sko
vde]
at 0
0:22
27
Sept
embe
r 20
17
162 A. BROLIN ET AL.
Dow
nloa
ded
by [
Hog
skol
ebib
liote
ket I
Sko
vde]
at 0
0:22
27
Sept
embe
r 20
17
PRODUCTION & MANUFACTURING RESEARCH 163
Dow
nloa
ded
by [
Hog
skol
ebib
liote
ket I
Sko
vde]
at 0
0:22
27
Sept
embe
r 20
17