Embed Size (px)
Citation preview
Experimental studies
on the behaviour of rare earth elements and tin in granitic systems
DISSERTATION
zur Erlangung des Doktorgrades der Naturwissenschaften
der Geowissenschaflichen Fakultät
der Eberhard-Karls-Universität Tübingen
vorgelegt von
QUACH DUC TIN aus Hanoi (Vietnam)
- 2007 -
Tag der mündlichen Prüfung:
Dekan: Prof. Dr. Peter Grathwohl
1. Berichterstatter: Prof. Dr. Hans Keppler
2. Berichterstatter: Priv. Doz. Dr. Wolfgang Siebel

iii
Acknowledgements
This thesis is the results of the scientific research mainly at Institute for Geosciences,
University of Tuebingen (EBERHARD-KARLS-UNIVERSITÄT TÜBINGEN). Some parts
were carried out at the University of Hannover and Swiss Federal Institute of Technology in
Zürich (ETH Zürich). With a great sense of appreciation, I take the opportunity to thank those
people who have helped, supported and encouraged me along the way. I would like to thank
my colleagues and other people I had the opportunity to work with.
I am greatly indebted to my supervisor, Prof. Dr. Hans Keppler, whose comments, valuable
scientific discussions and critical ideas are highlights of various aspects of this research.
Without his financial aid, sound guidance, supervision, motivation, kindness and continual
support, this research would have not reached its present form. With his patience and
encouragement, he gave me the confidence to complete this thesis. I also highly appreciate his
support by sending me to other scientific institutions to do the research as well as solving the
financial matters related to the research. Moreover, his personal qualities, inter-personal skills
and good humor created an excellent working environment at Institute for Geosciences.
Most of this work was funded by the DFG Leibniz award of my supervisor, Prof. Hans
Keppler. In addition, the German Academic Exchange Service (DAAD) fellowship program
sponsored this work.
I would also like to acknowledge and extend my thanks to Dr. Andreas Audetat for his ideas
about inclusion trapping experimental set-up and for many helpful discussions and
suggestions during the course of the research. I thank him for arranging the working session
in ETH Zürich, for providing technical assistance with Laser-ablation ICP-MS and for his
patience and creativity when working with me.
My thanks and appreciation go out to all the others who helped me with scientific and
technical aspects of this project, including PD. Dr. Thomas Wenzel for teaching and
providing me technical assistance in working with electron microprobe (JEOL 8900), Dr.
Christoph Berthold for helping me to carry out X-ray diffraction analysis, Prof. Detlef
Günther and Kathrin Hametner for arranging the LA- ICP-MS analysis in ETH, Zurich, Prof.
Marcus Nowak for arranging the experiments at Hannover University and Mr. Norbert
iv
Walker for his assistance in maintaining the high temperature and pressure vessels system in
the lab.
Great appreciation is given to my colleagues and friends in the Institute for Geosciences, who
were always willingly to discuss and never hesitated to help me out in whatever way they
could. To name a few, Mrs. Dagmar Dimitrovice, Dr. Katrin Mierdel, Dr. Nguyen Thi Bich
Thuy, Dr. Bernd Binder, Dr. Johannes Baier, Dr. Syvatoslav Shcheka, Dr. Udo Neumann,
Dipl. Volker Presser, Dr. Baldorj Baatartsogt, Dr. Michael Dorn, Dr. Giovanna Laudisio, Mr.
Gregor Seidel, Mr. Alexander Konschak, Dr. Michael Marks, Dr. Martin O’Connell, Miss.
Jasmin Koehler, Miss. Gesa Graser, Mr. Thomas Krumrei and all my friends in the institute.
Last but not least, I would like to express special thanks to my parent, sisters, brothers, my
wife and daughter, who all supported and encouraged me in pursuing my study. Without them
a little could have been achieved. They make my life filled with love and happiness.

v
Table of contents
Acknowledgements ............................................................................................................................ iii
Table of contents ..................................................................................................................................v
List of figures ................................................................................................................................... viii
List of tables .......................................................................................................................................xv
Abstract ........................................................................................................................................ xviii
Zusammenfassung.............................................................................................................................xxi
Part I: Monazite and xenotime solubility in haplogranitic melts.......................................2
1. Introduction.............................................................................................................................3
1.1. General geochemistry of rare earth elements ...........................................................................3
1.2. The abundances of lanthanides in various reservoirs ...............................................................5
1.3. REE in the mantle .....................................................................................................................8
1.4. The oxidation state of REE in geological systems .................................................................10
1.5. Rare earth elements in basaltic systems..................................................................................11
1.5.1. Partition coefficient.................................................................................................................11
1.5.2. REE in different basaltic setting .............................................................................................12
1.6. REE partition coefficient patterns for some major basaltic minerals .....................................14
1.6.1. Olivine ....................................................................................................................................14
1.6.2. Clinopyroxene.........................................................................................................................15
1.6.3. Orthopyroxene ........................................................................................................................16
1.6.4. Garnet......................................................................................................................................17
1.6.5. Plagioclase ..............................................................................................................................18
1.7. Rare earth elements in granitic systems..................................................................................19
1.7.1. Distribution of REE in granitic rocks .....................................................................................19
vi
1.7.2. Crystal structure of monazite and xenotime ...........................................................................20
1.7.3. Monazite and xenotime solubility in granitic melts................................................................22
1.8. Lanthanide tetrad effect ..........................................................................................................26
2. Experimental procedures and methods ..............................................................................29
2.1. Starting materials and preparation of sample capsules ...........................................................29
2.1.1. Synthesis of glasses ................................................................................................................29
2.1.2. Hydrothermal growth of monazite and xenotime ...................................................................33
2.1.3. Preparation of sample capsules for monazite and xenotime solubility experiments ..............36
2.2. High pressure apparatus and technique...................................................................................37
2.2.1. Cold seal systems (CSS) .........................................................................................................37
2.2.2. Internally heated pressure vessels (IHPV)..............................................................................40
2.3. Investigation of run products ..................................................................................................40
2.3.1. Electron Microprobe Analyses (EMPA).................................................................................40
2.3.2. Powder X-ray diffraction (XRD)............................................................................................42
2.3.3. Near Infrared (FTIR) measurement of hydrous glasses..........................................................42
2.3.4. Raman spectroscopy ...............................................................................................................45
3. Results ....................................................................................................................................46
3.1. The influence of phosphorus on the solubility of monazite in haplogranitic melts................46
3.2. The effect of the alkali/aluminium ratio on monazite and xenotime solubility in haplogranitic melts .............................................................................................................................54
3.3. The effect of fluorine on REE solubility in haplogranitic melts.............................................69
3.4. The effect of temperature on solubility...................................................................................74
4. Discussion and geological applications ...............................................................................76
4.1. The dissolution mechanism of monazite and xenotime in haplogranitic melts ......................76
4.2. Rare earth element fractionation by monazite and xenotime..................................................77
4.3. The origin of the lanthanide tetrad effect in granitic rocks.....................................................78

vii
4.4. The use of monazite solubilities as geothermometer..............................................................81
References ..........................................................................................................................................83
Part II: Solubility of tin in magmatic-hydrothermal fluids ........................................96
II- 1. Introduction .................................................................................................................... ..........97
II- 2. Methods.....................................................................................................................................99
II- 2.1. Inclusion synthesis by the etched plate technique..................................................................99
II- 2.2. Inclusion synthesis by the in-situ cracking technique..........................................................100
II- 2.3. Analytical methods...............................................................................................................102
II- 3. Results .....................................................................................................................................105
II- 4. Discussion ...............................................................................................................................112
II- 5. Implications for fluid–melt partitioning..................................................................................115
II- 6. Conclusions .............................................................................................................................117
References ........................................................................................................................................118

viii
List of figures
Figure 1.1.Schematic chondrite normalized diagram showing idealized REE patterns
(Redrawn from Hollings and Wyman, 2004) ......................................................................7
Figure 1.2. A rare earth plot showing rare earth patterns for primitive mantle (McDonough
and Frey, 1989), lower continental crust (LCC), upper mantle crust (UCC) (Taylor
and McLennan, 1985) and depleted mantle (Salters and Stracke, 2004).............................9
Figure 1.3. A rare earth plot showing rare earth patterns for ocean island basalt (OIB) (Sun
and McDonough, 1989) and mid ocean ridge basalt (MORB) (Taylor and
McLennan, 1985)...............................................................................................................13
Figure 1.4. Rare earth elements patterns of some major mineral in basalts melts. Data sources:
Olivine: Kennedy et al. (1993); Orthopyroxene and Clinopyroxene: Green, T. H. et
al. (2000); Hornblende: Fujimaki et at (1984); Phlogopite and Plagioclas: Arth
(1976); Garnet: Barch (1997).............................................................................................14
Figure 1.5. Plot of the partition coefficient for REE between plagioclase and melt (log scale
vs. atomic number).............................................................................................................18
Figure 1.6. Chondrite normalized diagram showing negative Eu anomalies characteristic of
plagioclase fractionation (Hollings and Wyman, 2004) ....................................................18
Figure 1.7. Typical monazite (CePO4) and xenotime (YPO4) structure. Both arrangements are
based on [001] chains of alternating phosphate tetrahedra and REEO8 polyhedra in
xenotime or REEO9 polyhedra in monazite (Modified after Taylor and Ewing,
1978) ..................................................................................................................................21
Figure 1.8. Unit-Cell volume of pure REE(PO4) vs. REE ionic radii (Redrawn from Gratz and
Heinrich, 1997) ..................................................................................................................22
Figure 1.9. Solubility of monazite (expressed as REE concentration of melt in ppm) in felsic
melts (almost subaluminous compositions) containing approximately 6 wt% H2O
(Modified after Montel et al., 1993) ..................................................................................24

ix
Figure 1.10. Solubility of REEPO4 crystals at 800°C, 2 kbar, under water-saturated
conditions, in SiO2-A1203-Na2O-K20 melts.......................................................................24
Figure 1.11. Typical examples of M- and W-type tetrad effect observed in REE patterns of
granites and seawaters. M1- (Irber, 1999) and M2 patterns (Bau, 1996) are though
to be formed by the chemical complexation in an aqueous-like fluid system during
the final stage of granite crystallization. W1 (De Baar et al., 1985) and W2
(Piepgras and Jacobsen, 1992) showing a well-defined lanthanide tetrad effect with
four concave segments in seawater....................................................................................27
Figure 2.1. Temperature profile for glass synthesis. (a) Decarbonisation and (b) melting................33
Figure 2.2. Raman data showing changes in the crystal structure of the synthetic REE
phosphates. Spectra were obtained using Labram2 Raman spectrometer equipped
with Olympus microscope. ................................................................................................34
Figure 2.3. Typical samples of monazite (LaPO4) and xenotime (HoPO4) X-ray diffraction
patterns ...............................................................................................................................35
Figure 2.4. XRD data for different crystal structures of the synthetic REE phosphates ....................35
Figure 2.5. Rietveld refinement of the GdPO4 sample using XRD data yielded a mix of
separate crystals with 80-90 wt% monazite and 10-20 wt% xenotime, respectively. .......35
Figure 2.6. Monazite (CePO4) and xenotime (HoPO4) imaged by SEM ..........................................36
Figure 2.7. (a) Schematic overview of a cold seal system. (b) Cross section of a cold seal
vessel (bomb): 1- Socket for internal thermocouple; 2- Thermocouple mount; 3-
Screw; 4- Closure cone; 5- small retainer ring; 6- Pressured tubing; 7- Compression
seal; 8- Metal adaptor; 9- Closure bolt; 10- Closure nut; 11-Retainer collar; 12-
Double sealing cone; 13- Pressure vessel (outer - ∅∅∅∅ 39 mm); 14- Filler rod (nickel);
15- Type-K internal thermocouple; 16- Sample chamber (∅∅∅∅ 7 mm); 17- Capsule; 18
– External thermocouple well. ...........................................................................................38
Figure 2.8. Measuring point (MH302) and measuring profile (MH412) of run product at
800oC and 2 kbar. Step interval away from the crystal glass interface is 20.05 µµµµm..........41

x
Figure 2.9. Near-infrared absorption spectra obtained from a haplogranitic glass containing 6
wt% water. Sample thickness: 224 µµµµm. Dashed line is linear baseline ............................43
Figure 3.1. Phase identification of mica from sample 4P75 (A) Raman spectrum obtained
using a Labram2 spectrometer equipped with Olympus microscope with a red laser
at 632.8 nm and (B) XRD result. .......................................................................................46
Figure 3.2. Gadolinium concentration profile in glass adjacent to a monazite crystal at 800oC
and 2 kbar for 30-31 days. The solid curve represents the best-fit line of the
diffusion model. The model provide an estimated saturation concentration of REE
(Co) in alkaline haplogranite (ASI =0.8) ...........................................................................50
Figure 3.3. Gadolinium concentration profile in glass adjacent to a monazite crystal at 800oC
and 2 kbar for 30-31 days. The solide curve represents the best-fit line of the
diffusion model. The model provide an estimated saturation concentration of REE
(Co) in metaluminous haplogranite(ASI =1) .....................................................................51
Figure 3.4. Plot of the average phosphate vs. average REE concentration for solubility
experiments of monazite in haplogranite. A) peralkaline (ASI = 0.8) and B)
metaluminous (ASI = 1) melt composition. The straight line is a fit linear function
of y = A + B/x, where x being phosphate concentration, y being a rare earth
concentration, and A is the equilibrium constant K1, while B is the product of K1
and K2. Fit function used only data of this study. .............................................................53
Figure 3.5. Plot of the average phosphate vs. estimated saturation REE concentration for
solubility experiments of monazite in haplogranites. A) peralkaline (ASI = 0.8) and
B) metaluminous (ASI = 1) melt composition. The straight line is a fit linear
function of y = A + B/x, where x being phosphate concentration, y being a rare
earth concentration, and A is the equilibrium constant K1, while B is the product of
K1 and K2 ..........................................................................................................................53
Figure 3.6. The effect of P2O5 on the apparent solubility product of monazite in water
saturated haplogranite melt at 2 kbar and 800oC. ASI refers to the molar Al/(Na+K)
of the melt. The error bars (1σσσσ) are smaller than the symbol size. ....................................54
xi
Figure 3.7. Graph showing the solubility of REE phosphates in haplogranite melt with 6 wt.%
H2O from EPMA analyses of the run products at 800oC and 2 kbar. Error bars
indicate standard deviations of replicated measurement. Shown are both average
microprobe data of the glasses analysed and rare earth concentrations obtained by
extrapolating diffusion profiles measured around a crystal to the crystal/melt
interface. In subfigures G and H, average data are shown only. .......................................63
Figure 3.8. Effect of melt composition, represented by ASI as defined in text, on the solubility
of REE phosphates in haplogranite melts. Error bars indicate ±±±± 1σσσσ error. The
slopes of the linear fitting curves, in the alkaline to sub-metaluminous range
(ASI<1), shows the relationship between melt composition and the REE solubility
in ppm at 800oC and 2 kbar. Data used for fitting is mainly from this study, except
the elements Ce, Sm and Yb, which were coupled with data from Montel (1986)
and Keppler (1993). The REE solubility increases with decreasing ASI of the melt
quite drastically in the peralkaline range, while it is constant in peraluminous melt. ......67
Figure 3.9. Monazite and xenotime solubility in hydrous haplogranitic melt doped with 2 and
4 wt.% at 800oC and 2 kbar ..............................................................................................69
Figure 3.10. Comparison of the solubility of REE phosphates in metaluminous, water
saturated haplogranitic melts (ASI=1; 6 wt.% H2O) at 800oC and 2 kbar with and
without fluorine. Vertical error bars represent 1σσσσ error...................................................72
Figure 3.11. Monazite and xenotime solubility in hydrous haplogranitic melts at 800 and 1100
˚C as derived from average electron microprobe analyses of run products. Error
bars indicate standard deviations of replicated measurement. ...........................................74
Figure 3.12. The effect of temperature on REE solubility in hydrous granitic melts. ASI refers
to the molar of Al/(Na+K) of the melt. The nominal composition of starting
materials has ASI = 1. ........................................................................................................75
Figure 4.1. Comparison of the REE abundance in the Abu Dabbab granite from Egypt with
clear tetrad pattern (after Bau, 1996) and the monazite and xenotime solubility of a
fluorine-bearing, slightly peraluminous hydrous haplogranite. Assuming ideal
miscibility in the monazite and xenotime crystals, the solubilities are directly

xii
proportional to the melt/monazite and melt/xenotime partition coefficients of the
respective REE. The similarity between the two patterns is striking. The negative
Eu anomaly seen in the Abu Dabbab pattern is due to plagioclase fractionation and
therefore does not occur in the solubility pattern...............................................................79
Figure 4.2. Shapes of f-orbitals (After Huheey, 1983).......................................................................80
Figure 4.3. Temperatures calculated from experimentally determined monazite solubilities
using the model of Montel (1993). In reality, all the experiments were carried out at
800˚C (A) and at 1100oC (B) .............................................................................................82
Figure II- 2.1. Fluid inclusions grown by the etched plate technique. (A) Photograph of a
polished quartz plate after 5 days residence in a 25 wt.% NaCl solution at 700 °C /
140 MPa (transmitted light). Overgrowth of new quartz led to the entrapment of
numerous fluid inclusions and cassiterite grains in etch channels along the former
quartz surface. (B) Close view of a sample synthesized in a 15 wt.% NaCl solution.
Most fluid inclusions are still in the process of necking down, trying to reduce their
surface-to-volume ratio. Inclusion P, for example, still is connected by a small neck
to a cassiterite grain ("cass"). If the run had been taken down one day later, this
inclusion would have become separated from the cassiterite grain, an therefore
would have isolated fluid that for a considerable amount of time was in equilibrium
with quartz and cassiterite only, without having access to the capsule wall.
Inclusion Q probably once was connected to the same cassiterite grain, too, and
therefore likely represents such an "equilibrium-type" inclusion. (C) Cartoon
showing the mechanism of fluid entrapment and subsequent re-organization of
large, irregular inclusions into several smaller inclusions of lower surface energy.
Two "equilibrium-type" inclusions that formed by necking down from a cassiterite-
bearing inclusion are marked by arrows ..........................................................................101
Figure II- 2.2. Fluid inclusions grown by the in-situ cracking technique. (A) After one week of
pre-equilibration, isobaric quenching from 700 °C to 20 °C and immediate re-
heating to 700 °C lead to the development of numerous small cracks in the quartz
core. The cracks partly healed out in the days following the in-situ cracking

xiii
(transmitted light). (B) Close view of a portion of the sample shown in A. Note the
small size of the fluid inclusions compared to those produced by the etched plate
technique (transmitted light). ...........................................................................................102
Figure II- 2.3. Coexisting melt inclusions (MI) and fluid inclusions (FI) in a sample
synthesized in a 10 wt.% NaF solution. The melt inclusions unmixed into glass,
fluid and villaumite crystals during the cooling at the end of the experiment
(transmitted light photomicrograph). ...............................................................................104
Figure II- 3.1.Summary of Sn-solubilities measured by LA-ICP-MS analysis of synthetic fluid
inclusions grown at 700 °C / 140 MPa. (A) HCl vs. NaCl-bearing fluids; (B) HF vs.
NaF-bearing fluids. Results from previous studies conducted at similar P/T -
conditions are shown for comparison. In all studies, fO2 was buffered near NNO..........107
Figure II- 3.2. Fluid inclusions synthesized in a 4m HCl-solution. Typical views (A) before,
and (B) after diffusive re-equilibration at 670 °C / 130 MPa and a high (but
unknown) oxygen fugacity. After equilibration, each inclusion contains a relatively
large daughter crystal of cassiterite (identified by Raman spectroscopy), in
agreement with Sn contents of 2.5-3.9 wt.% determined by LA-ICP-MS
(transmitted light photomicrographs). .............................................................................107
Figure II- 3.3. Tin content of individual fluid inclusions plotted against ligand concentration
(all concentrations expressed as mole fractions). The graphs allow testing for the
cassiterite dissolution reactions 1, 2, 5 and 6 as explained in the text. Each data
point represents a single fluid inclusion analysis, with full symbols denoting
"normal inclusions", and empty symbols denoting "equilibrium-type" inclusions. ........110
Figure II- 4.1. (A) Chemographic reconstruction of the melt composition in the fluid-
saturated system SiO2–NaF–H2O at 700 °C / 140 MPa, based on Na : Si -ratios
determined by LA-ICP-MS analysis of exposed melt inclusions, and the phase
assemblages produced in the different starting compositions. Runs NaF5, NaF10,
NaF15 and NaF25 contained quartz, fluid and melt, whereas Run NaF35
additionally was saturated in villaumite, implying that this starting composition is
situated on a cotectic line. Intersection of this line with the array of recalculated
NaF : SiO2 -ratios defines the melt composition somewhere in the dark grey area.

xiv
(B) An isobaric, isothermal cut through the eutectic point E in the system
NaAlSi3O8 – NaF – H2O at 688 °C / 100 MPa is shown for comparison (Koster van
Groos and Wyllie; 1968). All compositions are plotted in terms of weight ratios. .........114

xv
List of tables
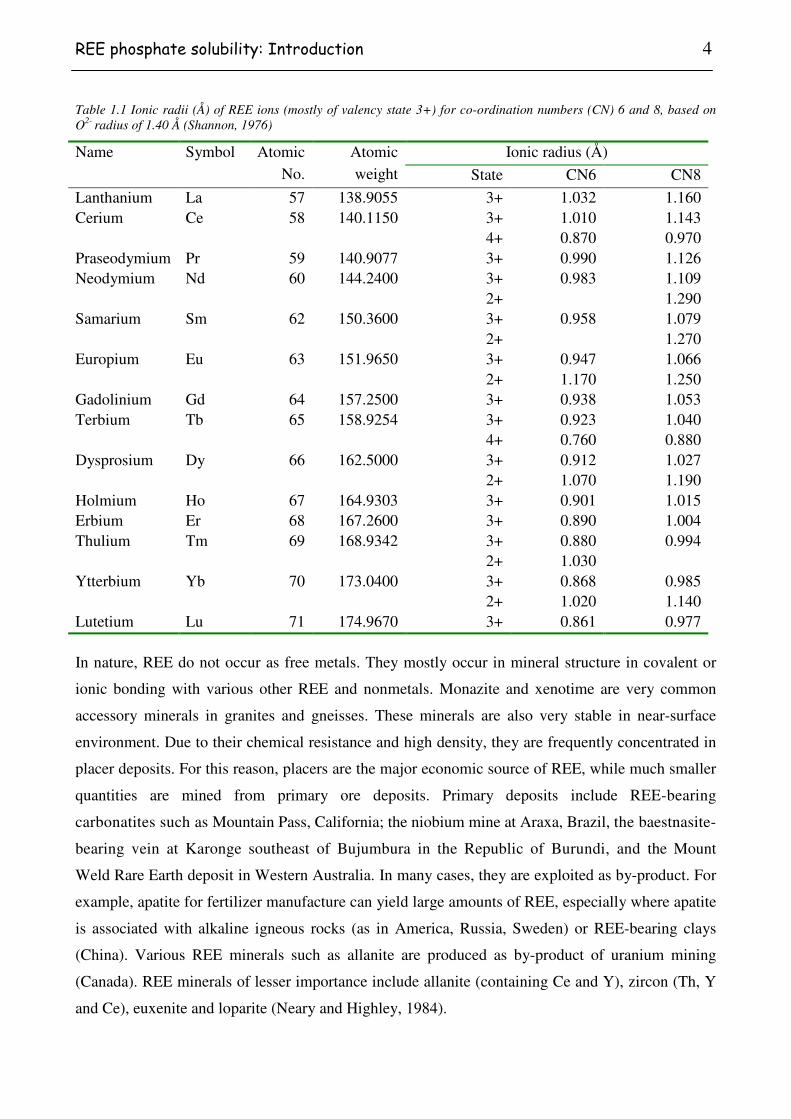
Table 1.1 Ionic radii (Å) of REE ions (mostly of valency state 3+) for co-ordination numbers
(CN) 6 and 8, based on O2- radius of 1.40 Å (Shannon, 1976) ............................................4
Table 1.2. Rare earth element abundances in various geochemical reservoirs (in ppm, except
as noted) ...............................................................................................................................6
Table 2.1. Chemicals used for the synthesis of glasses ......................................................................29
Table 2.2. Theoretical compositions of mixtures for glass synthesis (in weight percent) .................30
Table 2.3. Melting procedure of the dry glasses used as starting material.........................................31
Table 2.4. Average electron microprobe analyses of water saturated starting materials at
800oC/ 2 kbar in cold seal system. Run duration is 10-12 days. Values given in
weight % and relative error limits were estimated from the standard deviation (1δδδδ)
based on replicate analyses. Water content was measured by FTIR. ................................32
Table 2.5. Material of the vessels .......................................................................................................39
Table 2.6. Typical EMPA measurement conditions at 20 kV accelerating voltage and 50 nA
beam current with a defocused beam of 20 µm diameter ..................................................42
Table 3.1. Experimental data on the solubility of GdPO4 in haplogranitic melts (ASI = 0.8 and
ASI = 1) with variable phosphorus content at 800oC and 2 kbar as derived from
average microprobe analyses of quenched glasses. ...........................................................45
Table 3.2. Calculated speciation of GdPO4 (molecular GdPO4 or Gd3+) dissolved in
haplogranitic melt at 800oC and 2 kbar derived from average EMPA data.......................45
Table 3.3. Experimental data on the solubility of GdPO4 in haplogranitic melts (ASI = 0.8 and
ASI = 1) with variable phosphorus content at 800oC and 2 kbar as derived from the
extrapolation of measured diffusion profiles. ....................................................................49
xvi
Table 3.4. Estimated saturation concentration Gd in melt (Co) and calculated values of mol
fraction (MF) of rare earth phosphate solubility in silicate melts, coordination with
phosphor at 800oC and 0.2GP............................................................................................54
Table 3.5. Experimental data on the solubility of rare earth phosphates (monazite and
xenotime) in haplogranitic melts with variable alkali saturation index (ASI) at
800oC and 2 kbar as derived from average microprobe analyses of quenched
glasses. ...............................................................................................................................56
Table 3.6. Experimental data on the solubility of rare earth phosphates (monazite and
xenotime) in haplogranitic melts with an alkali saturation index (ASI) of 1.1 at
800oC and 2 kbar as derived from average microprobe analyses of quenched glasses
from experiments with two months duration. The pressure during the run was
increased to 2.5 kbar just immediately before the quench to avoid bubble
nucleation. ..........................................................................................................................58
Table 3.7. Experimental data on the solubility of rare earth phosphates (monazite and
xenotime) in haplogranitic melts with an alkali saturation index (ASI) of 1.2 at
1100oC and 2 kbar as derived from average microprobe analyses of quenched
glasses. Run duration was 7 days.......................................................................................59
Table 3.8. Experimental data on the solubility of rare earth phosphates (monazite and
xenotime) in haplogranitic melts with an alkali saturation index (ASI) of 1.2 at
800oC and 2 kbar as derived from average microprobe analyses of quenched glasses
from 2 months reversed experiments. The pressure during the run was increased to
2.5 kbar just immediately before the quench to avoid bubble nucleation .........................60
Table 3.9. Experimental data on the solubility of rare earth phosphates (monazite and
xenotime) in haplogranitic melts with variable alkali saturation index (ASI) at
800oC and 2 kbar as derived from the extrapolation of measured diffusion profiles. .......61
Table 3.10. Fit parameters for the linear curves describing the dependence of the logarithm of
rare earth solubility on aluminium saturation index for peralkaline to metaluminous
melts (ASI<1) according to Eq.3.8 ....................................................................................66

xvii
Table 3.11. . Experimental data on the solubility of rare earth phosphates (monazite and
xenotime) in haplogranitic melts doped with 2 and 4 wt.% F at 800oC and 2 kbar as
derived from average microprobe analyses of quenched glasses from experiments
of 30 -31 days duration. The pressure during the run was increased to 2.5 kbar just
immediately before the quench to avoid bubble nucleation. The relative error limits
were estimated from the standard deviation (1σ) based on replicate analysis (n). ............70
Table 3.12. Experimental data on the solubility of rare earth phosphates (monazite and
xenotime) in haplogranitic melts doped with 2 and 4 wt.% F at 800oC and 2 kbar as
derived from the extrapolation of measured diffusion profiles. ........................................71
Table 3.13. Fit parameters for the linear equation (Eq.3.9) relating REE phosphate solubility
to fluorine content. .............................................................................................................71
Table 3.14. Fit parameters for the linear equation (Eq.3.10) describing the temperature
dependence of monazite solubility in hydrous, metaluminous granitic melts. ..................75
Table II- 3.1. LA-ICP-MS analyses of individual fluid inclusions produced by the etched plate
technique ..........................................................................................................................108
Table II- 3.2. LA-ICP-MS analyses of individual fluid inclusions produced by the in-situ
cracking technique ...........................................................................................................109

xviii
Abstract
In this thesis, the behavior of rare earth elements and of tin during the crystallization of a
granitic magma and the release of hydrothermal fluids has been studied in two series of
experiments in hydrothermal cold seal bombs.
Part I: Monazite and xenotime solubility in haplogranitic melts
Crystals of pure rare earth phosphates were synthesized for each rare earth element (except
Pm) by the reaction of rare earth oxides with aqueous solutions of phosphoric acids at 800 oC
and 2 kbar. The light rare earths from La to Gd formed crystals of monazite, while the heavy
rare earths from Gd to Lu formed xenotime. The GdPO4 samples were a mixture of the
monazite and xenotime polymorph.
The solubility of the rare earth phosphates in hydrous (6 wt. % H2O) haplogranitic melts with
aluminum saturation index ranging from 0.7 to 1.2 was investigated at 2 kbar and 800 oC with
run durations between one and two months. The influence of phosphorus and fluorine rare
earth phosphate solubility was also studied under the same conditions. One additional series
of experiments was carried out at 1100 ˚C and 2 kbar. Run products were investigated by
electron microprobe. Equilibrium rare earth concentrations were estimated both from average
microprobe analyses and from the extrapolation of measured diffusion profiles around
dissolving crystals to the crystal-melt interface. To demonstrate equilibrium, runs with
variable duration and reversed experiments were carried out as well.
Monazite solubility decreases with phosphorus concentration in the melt. This effect can be
quantitatively modeled if one assumes that monazite partially dissolves as ionic and molecular
species (Gd3+ and GdPO4). Equilibrium constant for the dissolution reactions as well as
quantitative data on speciation have been derived from the solubility data. Monazite and
xenotime solubility strongly increase with the peralkalinity of the melt. This effect is mostly
due to an increase in the solubility of the ionic species, which are probably stabilized by non-
bridging oxygen atoms in the melt. Lanthanum is the only rare earth element, which does not
appear to show a major increase in monazite solubility in peralkaline melts. In peraluminous
melts, the solubility of monazite and xenotime is nearly constant. Fluorine has no major effect

xix
on monazite and xenotime solubility; in fact, the solubility appears to slightly decrease with
fluorine content.
The solubility of rare earth phosphates is not a simple continuous function of atomic number
or ionic radius. Rather, the solubility shows a typical “tetrad” pattern with several local
maxima of solubility at individual rare earth elements. The solubilities of neighboring rare
earth elements sometimes differ by more than a factor of two; these effects are far outside any
analytical error. The tetrad pattern is particularly clearly seen in some of the peralkaline melts
and in the fluorine-rich metaluminous melts. Some features, however, such as solubility
maximum at ytterbium, are seen in virtually all melts.
The lanthanide tetrad effect in some highly evolved granites is therefore likely to be a result
of monazite and xenotime fractionation. The ultimate cause of the tetrad effect is probably
electronic repulsion between the partially filled f-orbitals of the rare earth and the surrounding
oxygen atoms. If the coordination geometry is different in the melt and the solid phase, the
rare earth partition coefficients or solubilities will depend on the precise electronic
configuration in the 4f shell, not just on the effective ionic radius. The solubility of monazite
and xenotime in silicate melt probably shows this tetrad effect, because of the very unusual
coordination of the rare earth elements in these phosphate minerals.
The lanthanide tetrad effect in some highly evolved granites is real. However, it cannot be
used as an indicator of fluid/rock or fluid/melt interaction experienced by these granites, since
the effect can be experimentally reproduced in the laboratory in the absence of any fluids.
Part II: Solubility of tin in magmatic-hydrothermal fluids
Synthetic fluid inclusions in quartz were grown from cassiterite-saturated fluid in cold-seal
pressure vessels at 700 °C / 140 MPa / fO2 ~ NNO and subsequently analyzed by Laser-
Ablation ICP-MS. Most inclusions were synthesized using a new technique that allows
entrapment of fluid that had no immediate contact to the capsule walls, such that potential
disequilibrium effects due to alloying could be avoided. Measured Sn solubilities increase
with increasing ligand concentration in the fluid, ranging from 100 to 800 ppm in NaCl-
bearing fluids (5-35 wt.% NaCl), from 70 to 2000 ppm in HF-bearing fluids (0.5-3.2 m HF),
and from 0.8 to 11 wt.% in HCl-bearing fluids (0.5-4.4 m HCl). Runs performed by in-situ
xx
cracking after one week of pre-equilibration demonstrate that fluid inclusions grown by the
new technique failed to reach equilibrium in the most acid HCl and HF solutions because the
inclusion production rate was too fast. Graphical evaluation of the solubility data suggests that
Sn may have been dissolved as Sn(OH)Cl in the NaCl-bearing fluids, as Sn(OH)Cl and SnCl2
in the HCl-bearing fluids, and as SnF2 in the HF-bearing fluids. Experiments with NaF-
bearing fluids produced an additional melt phase with an approximate composition 53 wt.%
SiO2, 25 wt.% H2O, 14 wt.% NaF and 8 wt.% SnO, which caused the composition of the
coexisting fluid to be buffered at 0.5 wt.% NaF and 150 ppm Sn. Fluorine-rich, peralkaline
melts may therefore serve as important transport medium for Sn in the final crystallization
stages of tin granites. Based on the available cassiterite solubility data in fluids and melts, DSn,
fluid/melt in natural granite systems is estimated to be in the order of 0.1-4 (depending on their
aluminosity), suggesting that Sn cannot easily be mobilized by magmatic-hydrothermal fluids.
This interpretation is in accordance with the high degrees of Sn enrichment commonly
observed in highly fractionated melt inclusions. DSn, fluid/melt is primarily controlled by the HCl
concentration in the fluid. Compared to HCl, the effect of fluorine on DSn, fluid/melt is
subordinate.

xxi
Zusammenfassung
In dieser Dissertation wurde das Verhalten der Seltenen Erden und von Zinn bei der
Kristallisation eines Granitmagmas und bei der Freisetzung hydrothermaler Fluide
experimentell untersucht. Die Experimente wurden in hydrothermalen Autoklaven vom
“Cold-seal”-Typ ausgeführt.
Teil I: Monazit- and Xenotim-Löslichkeit in haplogranitischen Schmelzen
Kristalle von reinen Seltenerd-Phosphaten wurden für jede Seltene Erde (außer Pm)
synthetisiert durch Reaktion der Oxide mit wäßrigen Lösungen von Phosphorsäure bei 800 ˚C
und 2 kbar. Die leichten Seltenen Erden von La bis Gd bildeten Kristalle von Monazit,
während die schweren Seltenen Erden von Gd bis Lu Xenotim bildeten. Die GdPO4-Proben
waren eine Mischung der Monazit- und Xenotim-Modifikation.
Die Löslichkeit der Seltenerd-Phosphate in wasserhaltigen (6 Gew. % Wasser)
haplogranitischen Schmelzen mit einem ASI von 0,7 bis 1,2 wurde bei 2 kbar und 800 ˚C
untersucht mit Versuchsdauern zwischen einem und zwei Monaten. Der Einfluß von
Phosphor und Fluor auf die Seltenerd-Phosphat-Löslichkeit wurde ebenfalls unter den
gleichen Bedingungen untersucht. Eine zusätzliche Serie von Experimenten wurde bei 1100
˚C ausgeführt. Versuchsprodukte wurden untersucht mit Hilfe der Elektronenstrahl-
Mikrosonde. Gleichgewichts-Konzentrationen der Seltenen Erden wurden abgeschätzt sowohl
aus gemittelten Mikrosonden-Analysen als auch durch die Extrapolation von gemessenen
Diffusionsprofilen um Kristalle zur Grenzfläche Kristall-Schmelze. Um
Gleichgewichtseinstellung nachzuweisen, wurden Experimente mit variabler Versuchsdauer
und reversible Experimente ausgeführt.
Die Löslichkeit von Monazit nimmt mit der Konzentration von Phosphor in der Schmelze ab.
Dieser Effekt kann quantitativ modelliert werden, wenn man annimmt, dass Monazit teilweise
in ionischer und teilweise in molekularer Form gelöst wird (als Gd3+ und GdPO4).
Gleichgewichtskonstanten für die Lösungs-Reaktion sowie quantitative Daten zur Speziation
wurden aus den gemessenen Löslichkeiten abgeleitet. Die Löslichkeit von Monazit und
Xenotim nimmt mit der Peralkalinität der Schmelze stark zu. Dieser Effekt beruht

xxii
überwiegend auf einer Zunahme der Löslichkeit der ionischen Spezies, welche stabilisiert
werden durch nicht-brückenbildende Sauerstoffatome in der Schmelze. Lanthan ist die einzige
Seltene Erde, für die keine wesentliche Zunahme der Monazit-Löslichkeit mit der
Paralkalinität beobachtet wurde. In peraluminischen Schmelzen ist die Löslichkeit von
Monazit und Xenotim etwa konstant. Fluor hat keinen wesentlichen Effekt auf die Löslichkeit
von Monazit und Xenotim; die Löslichkeit scheint bei Gegenwart von Fluor sogar leicht
abzunehmen.
Die Löslichkeit der Seltenerd-Phosphate ist keine einfache kontinuierliche Funktion der
Ordnungszahl oder des Ionenradius. Die Löslichkeit zeigt ein typisches „Tetraden“-Muster
mit mehreren lokalen Maxima der Löslichkeit bei einzelnen Seltenerd-Elementen. Die
Löslichkeiten benachbarter Seltenerd-Elemente unterscheiden sich manchmal um mehr als
einen Faktor von zwei; diese Effekte sind weit größer als die analytischen Fehler. Das
Tetraden-Muster ist besonders deutlich in einigen peralkalischen Schmelzen sowie in Fluor-
reichen metaluminischen Schmelzen. Einige Effekte, wie etwa das Löslichkeits-Maximum bei
Ytterbium, konnten bei allen Schmelzzusammensetzungen beobachtet werden.
Der Lanthaniden-Tetraden-Effekt in einigen hochdifferenzierten Graniten ist daher
wahrscheinlich ein Resultat der Fraktionierung von Monazit und Xenotim. Die letztliche
Ursache für den Tetraden-Effekt liegt wahrscheinlich in der Abstoßung zwischen den
Elektronen der teilweise gefüllten f-Orbitale der Seltenen Erd-Kationen und den umgebenden
Sauerstoff-Atomen. Sofern die Koordinationsgeometrie in der Schmelze und der
koexistierenden festen Phase unterschiedlich ist, werden die Löslichkeiten und
Verteilungskoeffizienten der Seltenen Erden nicht nur vom Ionenradius, sondern von der
genauen Besetzung der einzelnen f-Orbitale abhängen. Die Löslichkeit von Monazit und
Xenotim in Silikatschmelzen zeigt wahrscheinlich den Tetraden-Effekt, weil die
Koordinationsgeometrie der Seltenen Erden in Monazit und Xenotim sehr ungewöhnlich ist.
Der Lanthanide-Tetraden-Effekt in einigen hochdifferenzierten Graniten ist real. Dieser
Effekt kann jedoch nicht benutzt werden als ein Indikator für Fluid-Gesteins- oder Fluid-
Schmelze-Wechselwirkungen in der Entwicklung dieser Granite, da der Effekt sich im Labor
auch in Abwesenheit einer Fluidphase reproduzieren lässt.

xxiii
Tei II: Löslichkeit von Zinn in magmatisch-hydrothermalen Fluiden
Synthetische Flüssigkeitseinschlüsse in Quarz wurden aus Kassiterit-gesättigten Fluiden in
Hydrothermal-Autoklaven bei 700 °C / 140 MPa / fO2 ~ NNO gezüchtet, und anschliessend
mittels Laser-Ablation ICP-MS analysiert. Die meisten Einschlüsse wurden mit Hilfe einer
speziellen Synthese-Technik hergestellt mit der es möglich ist, Fluid einzufangen welches für
geraume Zeit nicht mit der umgebenden Goldkapsel in Kontakt war. Auf diese Weise kann
verhindert werden, dass die Zinnlöslichkeit im Fluid durch die Legierung von Zinn in die
Goldkapsel beeinflusst wird. Die gemessenen Zinn-Löslichkeiten steigen mit zunehmender
Ligand-Konzentration im Fluid, und reichen von 100 bis 800 ppm in NaCl-haltigen Fluiden
(5-35 Gew.% NaCl), von 70 bis 2000 ppm in HF-haltigen Fluiden (0.5-3.2 m HF), und von
0.8 bis 11 Gew.% in HCl-haltigen Fluiden (0.5-4.4 m HCl). Experimente bei denen die
Einschlussbildung durch in-situ Abschreckung nach einer Woche Vorequilibrierung ausgelöst
wurde zeigen, dass die neue Technik in konzentrierten HCl und HF-Lösungen versagte weil
die Einschlussbildung vor Erreichen des Lösungsgleichgewichts erfolgte. Die
Löslichkeitsdaten implizieren, dass Sn überwiegend in Form von Sn(OH)Cl in den NaCl-
haltigen gelöst war, in Form von Sn(OH)Cl und SnCl2 in HCl-haltigen Fluiden, und in Form
von SnF2 in HF-haltigen Fluiden. Experimente mit NaCl-haltigen Fluiden führten zur Bildung
einer zusätzlichen Schmelzphase mit der ungefähren Zusammensetzung 53 Gew.% SiO2, 25
Gew.% H2O, 14 Gew.% NaF und 8 Gew.% SnO. Die Präsenz dieser Schmelzphase führte
dazu, dass der NaF-Gehalt im koexistierenden Fluid bei 0.5 Gew.% NaF und 150 ppm Sn
gepuffert wurde. Diese Resultate implizieren, dass Fluor- und Alkali-reiche Schmelzen ein
wichtiges Transportmedium für Zinn im Endstadium der Kristallisation von Zinn-Graniten
darstellen könnten. Der Verteilungskoeffizient DSn, fluid/melt in natürlichen Graniten wird auf ca.
0.1-4 geschätzt, was bedeutet, dass Sn nur schwierig mittels magmatisch-hydrothermalen
Fluide mobilisiert werden kann. Diese Interpretation steht im Einklang mit der Beobachtung,
dass Sn in hochfraktionierten Schmelzeinschlüssen oft stark angereichert ist. DSn, fluid/melt ist
primär durch die HCl-Konzentration im Fluid kontrolliert, während die Konzentration von F
im Fluid eine eher untergeordnete Rolle spielt.
2
Part I: Monazite and xenotime solubility in haplogranitic melts
REE phosphate solubility: Introduction 3
1. Introduction
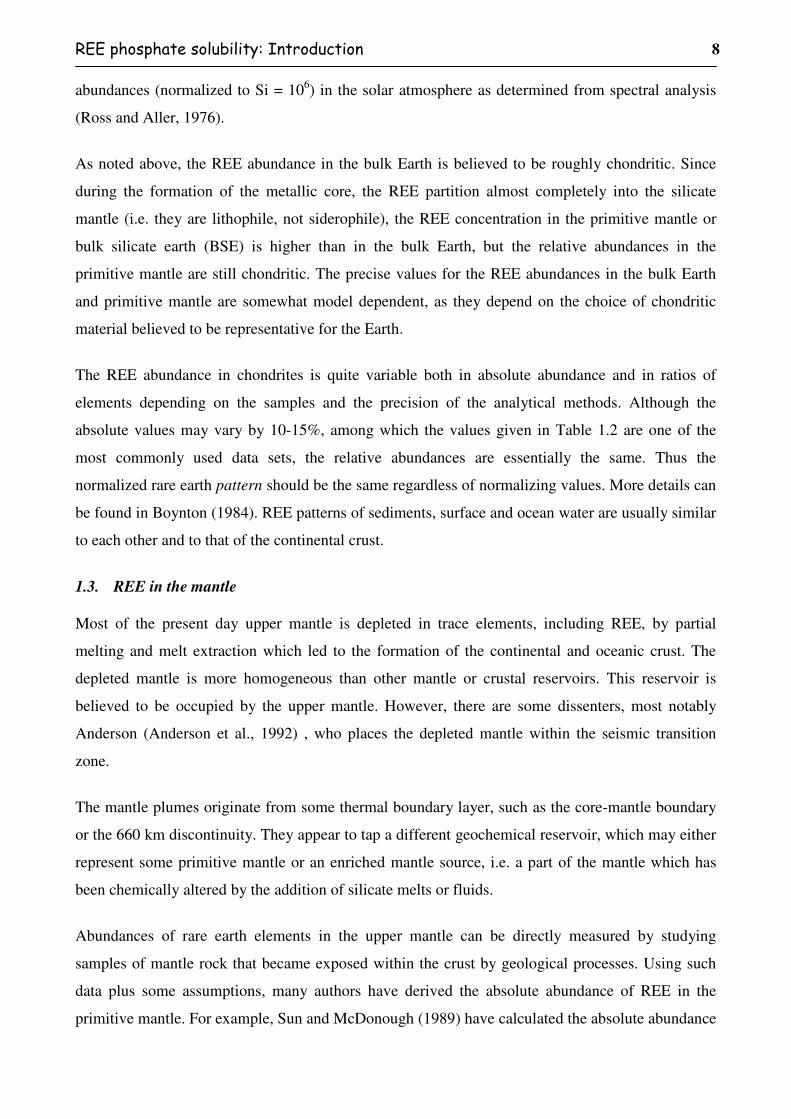
1.1. General geochemistry of rare earth elements
Rare earth elements (REE´s) or lanthanides are a group of 15 elements, beginning with lanthanum
(La, atomic number 57) and ending with lutetium (Lu, atomic number 71). All lanthanides occur in
nature, except Promethium (Pm), which is radioactive and extinct.
All rare earth atoms have the same electronic configuration in their outer two shells (5d1 6s2) and
they differ only by the number of 4f electrons, which ranges from zero for La to 14 for Lu. Because
of the identical electronic configuration in the outer two shells, the properties of all rare earth
elements are quite similar. However, the increasing number of f electrons and the simultaneously
increasing nuclear charge cause the atomic and ionic radii to decrease significantly from La to Lu
(Table 1.1). This feature is known as the lanthanide contraction and occurs because the inner
electron shell is built up rather a new shell being added. This change in atomic and ionic radii
causes a subtle and smooth change in physical and chemical properties. However, some of the
properties of the rare earth elements may be slightly influenced by crystal field effects due to the
interaction between the partially filled f orbitals and the surrounding ligands. Such an interaction is
probably responsible for the “lanthanide tetrad effect” first described by Peppard et al. (1969). This
effect implies that certain thermodynamic properties, such as solubility or partition coefficients,
have minima or maxima for those rare earth elements possessing a quarter, half or three quarter
filled f shell.
Rare earth elements are sometimes classified into two subgroups: the light rare earth or cerium
subgroup (abbreviated LREE), comprising the first seven elements from La to Eu (atomic numbers
57-63), and the heavy rare earth or yttrium subgroup (abbreviated HREE), comprising the elements
from Gd to Lu with atomic numbers 64-71. Yttrium and scandium, although they are not real rare
earth elements, have properties similar to the heavy rare earth.
Important rare earth minerals include monazite [(Ce,La,Nd,Th)(PO4)], [(REE)PO4], xenotime
[Y,REE(PO4)], bastnaesite [(Ce,La)(CO3)F] and apatite [Ca,REE)5(PO4)3(OH,F)]. The most
important commercial sources of REE have been monazite bearing placer deposits such as fluviatile
deposits in North Carolina and beach placers in Brazil, India, China and Australia (Neary and
Highley, 1984). Bastnaesite and monazite are sources of the light REE and account for about 95%
of the current REE production, while xenotime and minerals such as allanite are a source of the
heavy REE and yttrium. Monazite commonly contains thorium up to 10%, some yttrium and a
small amount of uranium.
REE phosphate solubility: Introduction 4
Table 1.1 Ionic radii (Å) of REE ions (mostly of valency state 3+) for co-ordination numbers (CN) 6 and 8, based on O2- radius of 1.40 Å (Shannon, 1976)
Ionic radius (Å) Name Symbol Atomic No.
Atomic weight State CN6 CN8
Lanthanium La 57 138.9055 3+ 1.032 1.160 Cerium Ce 58 140.1150 3+ 1.010 1.143 4+ 0.870 0.970 Praseodymium Pr 59 140.9077 3+ 0.990 1.126 Neodymium Nd 60 144.2400 3+ 0.983 1.109 2+ 1.290 Samarium Sm 62 150.3600 3+ 0.958 1.079 2+ 1.270 Europium Eu 63 151.9650 3+ 0.947 1.066 2+ 1.170 1.250 Gadolinium Gd 64 157.2500 3+ 0.938 1.053 Terbium Tb 65 158.9254 3+ 0.923 1.040 4+ 0.760 0.880 Dysprosium Dy 66 162.5000 3+ 0.912 1.027 2+ 1.070 1.190 Holmium Ho 67 164.9303 3+ 0.901 1.015 Erbium Er 68 167.2600 3+ 0.890 1.004 Thulium Tm 69 168.9342 3+ 0.880 0.994 2+ 1.030 Ytterbium Yb 70 173.0400 3+ 0.868 0.985 2+ 1.020 1.140 Lutetium Lu 71 174.9670 3+ 0.861 0.977
In nature, REE do not occur as free metals. They mostly occur in mineral structure in covalent or
ionic bonding with various other REE and nonmetals. Monazite and xenotime are very common
accessory minerals in granites and gneisses. These minerals are also very stable in near-surface
environment. Due to their chemical resistance and high density, they are frequently concentrated in
placer deposits. For this reason, placers are the major economic source of REE, while much smaller
quantities are mined from primary ore deposits. Primary deposits include REE-bearing
carbonatites such as Mountain Pass, California; the niobium mine at Araxa, Brazil, the baestnasite-
bearing vein at Karonge southeast of Bujumbura in the Republic of Burundi, and the Mount
Weld Rare Earth deposit in Western Australia. In many cases, they are exploited as by-product. For
example, apatite for fertilizer manufacture can yield large amounts of REE, especially where apatite
is associated with alkaline igneous rocks (as in America, Russia, Sweden) or REE-bearing clays
(China). Various REE minerals such as allanite are produced as by-product of uranium mining
(Canada). REE minerals of lesser importance include allanite (containing Ce and Y), zircon (Th, Y
and Ce), euxenite and loparite (Neary and Highley, 1984).

REE phosphate solubility: Introduction 5
1.2. The abundances of lanthanides in various reservoirs
When comparing concentrations of REE with other elements in various reservoirs, it becomes clear
that the REE are actually abundant, although loosely called "rare earths". In the Earth’s crust, each
REE is more abundant than silver, gold or platinum. Cerium, yttrium, neodymium and lanthanum
are more abundant than lead. As lithophile elements, REE preferentially partition into silicates and
oxides, rather than metals or sulfide. They only appear as trace elements in many minerals, being
dispersed in all reservoirs. It is rare to find high concentrations of REE in nature. They are usually
incompatible during magmatic crystallization i.e. they concentrate in the melt during the magma
evolution. But they are compatible if monazite, xenotime, allanide or zircon present in the melt.
Though REE tend to have similar geochemical characteristics in most geological environments,
their abundances are not the same. REE with even atomic numbers (e.g. Ce, atomic number 58) are
more abundant than those with odd atomic number. This feature is also found in chondritic
meteorites, which were among the first objects formed from the solar nebula. REE with even atomic
number were produced in higher abundance during nucleosynthesis because of their higher nuclear
stability. This feature produces a “zigzag” effect in the plot of REE analysis. This is also called
“Oddo-Harkins effect”, which can be normally eliminated by plotting REE analysis normalized to
average abundances in a standard such as a chondritic meteorite (i.e. the concentration of each REE
in the sample is divided by the concentration of the same REE in the reference material) (Table
1.2). Chondritic meteorites were the first choice, because they are thought to represent unaltered
and unfractionated samples of the original composition of the solar system and they should
therefore most clearly reproduce the abundance of the elements formed by nucleosynthesis at the
beginning of the solar system. Thus, they are also thought to have the same chemical composition
as the entire primitive Earth. Unfortunately the composition of chondritic meteorites is quite
variable and chondrites with “chondritic” REE abundances are rather the exception than the rule
(Boynton, 1984). This different composition of chondrites has given rise to a large number of sets
of normalizing values for the REE and to-date a number of chondritic standards have been used and
no fixed values have been adopted. “Average chondrite” and C1 chondrites are used very often, as
they are thought to be the most representative of the composition of the original solar nebula. The
X-Y plot often uses a logarithmic scale for the normalized abundance versus atomic number (or
ionic radii) of the REE. This kind of plot is also called Masuda-Coryel diagram (Henderson, 1984)
after the original proponents of the diagram (Masuda, 1962). This diagram allows determining the
fractionation of any REE relative to the normalized standards.
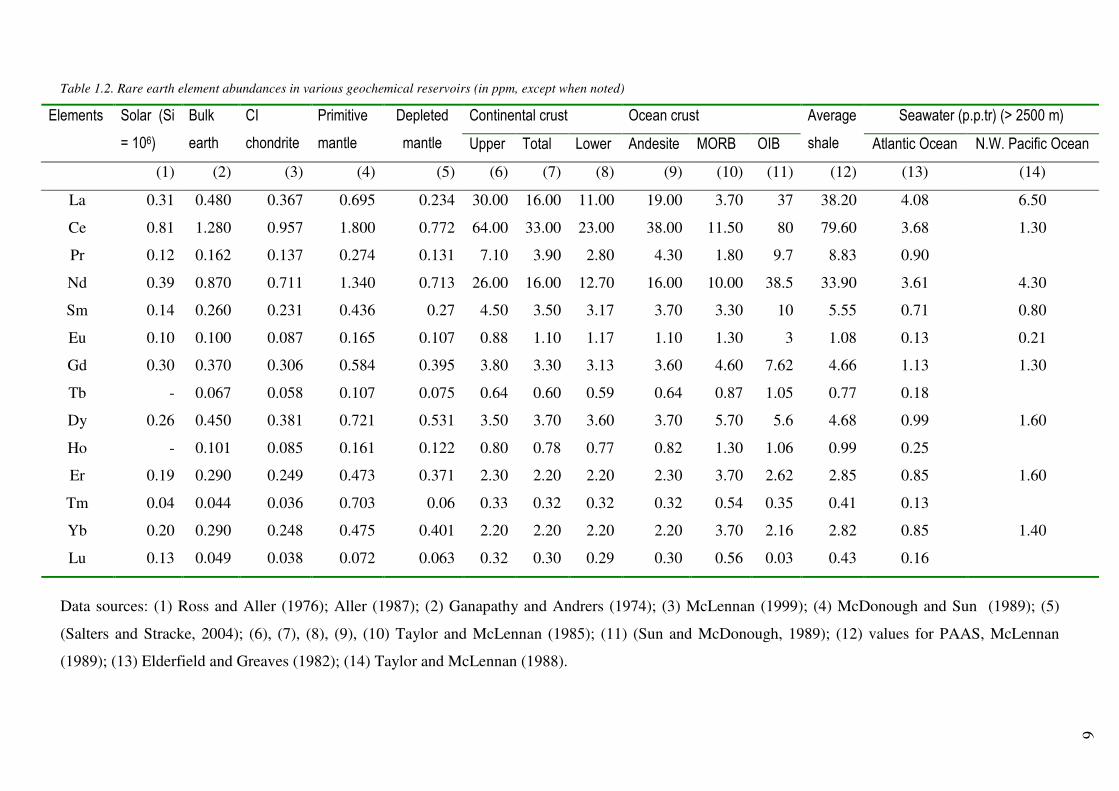
Table 1.2. Rare earth element abundances in various geochemical reservoirs (in ppm, except when noted)
Continental crust Ocean crust Seawater (p.p.tr) (> 2500 m) Elements Solar (Si
= 106)
Bulk
earth
CI
chondrite
Primitive
mantle
Depleted
mantle Upper Total Lower Andesite MORB OIB
Average
shale Atlantic Ocean N.W. Pacific Ocean
(1) (2) (3) (4) (5) (6) (7) (8) (9) (10) (11) (12) (13) (14)
La 0.31 0.480 0.367 0.695 0.234 30.00 16.00 11.00 19.00 3.70 37 38.20 4.08 6.50
Ce 0.81 1.280 0.957 1.800 0.772 64.00 33.00 23.00 38.00 11.50 80 79.60 3.68 1.30
Pr 0.12 0.162 0.137 0.274 0.131 7.10 3.90 2.80 4.30 1.80 9.7 8.83 0.90
Nd 0.39 0.870 0.711 1.340 0.713 26.00 16.00 12.70 16.00 10.00 38.5 33.90 3.61 4.30
Sm 0.14 0.260 0.231 0.436 0.27 4.50 3.50 3.17 3.70 3.30 10 5.55 0.71 0.80
Eu 0.10 0.100 0.087 0.165 0.107 0.88 1.10 1.17 1.10 1.30 3 1.08 0.13 0.21
Gd 0.30 0.370 0.306 0.584 0.395 3.80 3.30 3.13 3.60 4.60 7.62 4.66 1.13 1.30
Tb - 0.067 0.058 0.107 0.075 0.64 0.60 0.59 0.64 0.87 1.05 0.77 0.18
Dy 0.26 0.450 0.381 0.721 0.531 3.50 3.70 3.60 3.70 5.70 5.6 4.68 0.99 1.60
Ho - 0.101 0.085 0.161 0.122 0.80 0.78 0.77 0.82 1.30 1.06 0.99 0.25
Er 0.19 0.290 0.249 0.473 0.371 2.30 2.20 2.20 2.30 3.70 2.62 2.85 0.85 1.60
Tm 0.04 0.044 0.036 0.703 0.06 0.33 0.32 0.32 0.32 0.54 0.35 0.41 0.13
Yb 0.20 0.290 0.248 0.475 0.401 2.20 2.20 2.20 2.20 3.70 2.16 2.82 0.85 1.40
Lu 0.13 0.049 0.038 0.072 0.063 0.32 0.30 0.29 0.30 0.56 0.03 0.43 0.16
Data sources: (1) Ross and Aller (1976); Aller (1987); (2) Ganapathy and Andrers (1974); (3) McLennan (1999); (4) McDonough and Sun (1989); (5)
(Salters and Stracke, 2004); (6), (7), (8), (9), (10) Taylor and McLennan (1985); (11) (Sun and McDonough, 1989); (12) values for PAAS, McLennan
(1989); (13) Elderfield and Greaves (1982); (14) Taylor and McLennan (1988).
6

REE phosphate solubility: Introduction 7
For most of the elements in the same group of the periodic table, the ionic radius increases as the
atomic number increase. The REE provide an exception to this rule as the trivalent ions of these
elements shrink steadily from the lightest rare earth La (1.16Å) to the heaviest one Lu (0.977 Å)
(Table 1.1). This feature is called lanthanide contraction and occurs because the inner electron shell
is build up rather than a new shell being added. This systematic variation from light REE to heavy
REE causes significant differences in their abundances, behavior and partition coefficients. In
nature, most of REE form stable 3+ ions of similar size, thus they have very similar chemical and
physical properties. However, the progressive decrease in ionic size with increasing atomic number
can cause the REE to be fractionated relatively to one another by a variety of geochemical and
petrological processes. Because of their slightly larger sizes, LREE are generally more incompatible
in common silicate minerals than the HREE.
Therefore, the ratio between LREE and HREE is not always the same for every reservoir and it can
be used to determine the evolutionary histories of rocks. For example, primitive mantle has a
chondritic LREE/HREE ratios. Depleted mantle has a LREE/HREE ratio less than chondritic,
because during melt extraction, light REE are preferentially removed, while enriched mantle has
greater LREE/HREE (McDonough and Frey, 1989) (Figure 1.1). In practice, La/Yb and Ce/Y are
two common LREE/HREE ratios, which are used to determine the degree of fractionation of a REE
pattern. Using the REE patterns in a wide variety of rocks and minerals can help to understand the
effect of petrogenetic processes on REE abundances including fractionation and melting processes.
Figure 1.1.Schematic chondrite normalized diagram showing idealized REE patterns (Redrawn from Hollings and Wyman, 2004)
The relative abundance of REE in the solar system was estimated by analyzing the concentration of
elements in carbonaceous chondrites and in the sun. Table 1.2 shows the results of the relative
REE phosphate solubility: Introduction 8
abundances (normalized to Si = 106) in the solar atmosphere as determined from spectral analysis
(Ross and Aller, 1976).
As noted above, the REE abundance in the bulk Earth is believed to be roughly chondritic. Since
during the formation of the metallic core, the REE partition almost completely into the silicate
mantle (i.e. they are lithophile, not siderophile), the REE concentration in the primitive mantle or
bulk silicate earth (BSE) is higher than in the bulk Earth, but the relative abundances in the
primitive mantle are still chondritic. The precise values for the REE abundances in the bulk Earth
and primitive mantle are somewhat model dependent, as they depend on the choice of chondritic
material believed to be representative for the Earth.
The REE abundance in chondrites is quite variable both in absolute abundance and in ratios of
elements depending on the samples and the precision of the analytical methods. Although the
absolute values may vary by 10-15%, among which the values given in Table 1.2 are one of the
most commonly used data sets, the relative abundances are essentially the same. Thus the
normalized rare earth pattern should be the same regardless of normalizing values. More details can
be found in Boynton (1984). REE patterns of sediments, surface and ocean water are usually similar
to each other and to that of the continental crust.
1.3. REE in the mantle
Most of the present day upper mantle is depleted in trace elements, including REE, by partial
melting and melt extraction which led to the formation of the continental and oceanic crust. The
depleted mantle is more homogeneous than other mantle or crustal reservoirs. This reservoir is
believed to be occupied by the upper mantle. However, there are some dissenters, most notably
Anderson (Anderson et al., 1992) , who places the depleted mantle within the seismic transition
zone.
The mantle plumes originate from some thermal boundary layer, such as the core-mantle boundary
or the 660 km discontinuity. They appear to tap a different geochemical reservoir, which may either
represent some primitive mantle or an enriched mantle source, i.e. a part of the mantle which has
been chemically altered by the addition of silicate melts or fluids.
Abundances of rare earth elements in the upper mantle can be directly measured by studying
samples of mantle rock that became exposed within the crust by geological processes. Using such
data plus some assumptions, many authors have derived the absolute abundance of REE in the
primitive mantle. For example, Sun and McDonough (1989) have calculated the absolute abundance

REE phosphate solubility: Introduction 9
of REE in the primitive mantle (Table 1.2) by assuming that: (i) the HREE contents of upper and
lower mantle are similar, (ii) abundances of refractory lithophile elements in the mantle are in
chondritic proportion, and (iii) the mantle Yb content is in the range of 0.45 to 0.5 ppm. The result
implies that the primitive mantle is enriched in REE and all other refractory lithophile elements by a
factor of 2.2±0.1 as compared to ordinary chondrites.
There is an agreement that the REE abundances in the bulk earth are similar to those of chondrite,
i.e., the REE pattern of the bulk earth should be flat. Ideally, there are only two reservoirs, which
contain a significant amount of REE, the crust and the mantle. Thus, if the crust is enriched in
LREE, then the mantle should be depleted in LREE. The REE pattern in lower continental crust is
relatively smooth, while there is a negative Eu anomaly in the upper continental crust. This anomaly
is very common in continental crustal rocks; it is related to the retention of Eu as Eu2+ in residual
plagioclase during partial melting, as will be discussed below.
0.1
10.0
1000.0
La Ce Pr Nd Sm Eu Gd Tb Dy Ho Er Tm Yb Lu
CI ch
on
dri
te N
orm
alize
d A
bu
nd
an
ce
.
Upper continental crust (UCC)
Primitive mantle
Lower continental crust (LCC)
Depleted mantle
Figure 1.2. A rare earth plot showing rare earth patterns for primitive mantle (McDonough and Frey, 1989), lower continental crust (LCC), upper mantle crust (UCC) (Taylor and McLennan, 1985) and depleted mantle (Salters and Stracke, 2004)
Rare earth patterns for primitive mantle, depleted mantle, lower continental crust (LCC) and upper
continental crust (UCC) are shown in Figure 1.2. The abundance of rare earth elements in the
primitive mantle is higher than in the chondrites. This is due to the fact that the REE are lithophile,
i.e. in equilibrium with a metal phase, they do not partition into the metal but into the coexisting
silicates. Therefore, during the formation of core and mantle from a chondritic starting material, all
the rare earth partitioned into the mantle.
REE phosphate solubility: Introduction 10
Moreover, rare earth elements are incompatible, because their ionic radius is usually too large for
them to fit easily into rock-forming minerals. This effect is particularly strong for the light rare
earth elements, as they have the largest ionic radius. Therefore, upon melting, the rare earth
partition into the melt phase and become depleted in the residual. This is the explanation why the
crust is more enriched in rare earth than the primitive mantle and why the depleted mantle is
depleted in rare earth compared to the primitive mantle.
1.4. The oxidation state of REE in geological systems
REEs are strongly electropositive and most of their chemistry is dominated by ionic bonding. Most
of the REE are trivalent over a wide range of oxygen fugacity. The oxidation states +2 of Eu+2,
Sm+2 and Yb+2 can be seen at low oxygen fugacity. However, only Eu+2 appears to occur in nature
(Morris and Haskin, 1974). The negative anomalies and the concentration of Yb in some inclusions
in a carbonaceous chondrite were explained by the appearance of Yb+2. However, this explanation
seems not satisfactory, because Yb+2 requires extremely reducing conditions and alternative
explanations are possible. The observed depletion may be due to the higher volatility of Yb as
compared to other REE (Boynton, 1984). The presence of Sm+2 in minerals was first suggested by
Goldschmidt (1954), but this hypothesis has not been substantiated and is unlikely. The oxidation
state of +4 is known for Ce and Tb, but in natural system, only Ce can be partly or wholly in the +4
state. There is no record of the presence of Tb+4 in any mineral or natural aqueous system
(Henderson, 1984).
Among the non-trivalent REE, Eu2+ and Ce4+ are the most important ones and they have been used
a lot to model petrologic processes. Eu2+ only occurs at highly reducing condition. Its size is similar
to Sr2+, Ca2+ and Na+ while Eu3+ is much smaller. Therefore, Eu2+ easily substitutes for those
elements particularly in plagioclase, resulting in anomalous REE distribution patterns. The
anomalous Eu behavior in magmatic rocks is a sign of relatively shallow igneous processes,
because plagioclase is stable only to about 40 km depth in the Earth crust. In contrast, Ce4+ requires
oxidizing condition, which commonly occurs in secondary processes like weathering and early
marine diagenesis. Under these conditions, Ce4+ dominates and tends to form highly insoluble
hydroxide complexes that will fractionate Ce from other REE and therefore will cause anomalous
REE patterns (McLennan, 1994).
REE phosphate solubility: Introduction 11
1.5. Rare earth elements in basaltic systems
1.5.1. Partition coefficient
In basalt systems, most rare earth elements are dissolved in the common rock-forming minerals
(olivine, pyroxenes, etc) and their concentrations can often be understood in terms of equilibrium
thermodynamics. Partition coefficients (D) are thermodynamic variables that vary with pressure
(P), temperature (T) and phase composition (X). Knowledge of variations in mineral-melt partition
coefficients as a function of P, T, mineral and melt composition is therefore of great value in the
interpretation and modeling of magma evolution processes, including partial melting, fractional
crystallization, and assimilation coupled with fractional crystallization.
The partition coefficient of REE between minerals and melt can be defined in a simple way as the
ratio of concentration of the element (E) in the mineral (α) divided by its concentration in the
molten silicate melt (β) in equilibrium with that mineral.
DE,αααα/ββββ = C(Eαααα) / C(Eββββ) (Eq. 1. 1)
where DE,α/β is the Nernst partition coefficient, C (Eα) is the concentration of the element (E) in
mineral and C (Eβ) is its concentration in coexisting melt in ppm or wt%.
In literature, the term “distribution coefficient” and “partition coefficient” are often used
interchangeably (McKay, 1989). Because the concentration of element E in the solid phase is
normalized to its concentration in the melt, in the simplest case DE,α/β will be independent on
absolute concentration of element E. A mineral/melt partition coefficient (DE,α/β) of less than
1.0 implies that the concentration of the element in the mineral is less than in the coexisting melt;
in this case, the element is called incompatible. DE,α/β of 1.0 indicates that the element is equally
distributed between the mineral and the melt. An element which is concentrated in the mineral as
compared to the melt has DE,α/β greater than 1.0 and is called compatible.
REE contents in minerals are usually very low in comparison with major elements, thus, they are
entirely passive and have negligible influence on a particular process. However, they are complex
functions of crystal composition, melt structure and composition, temperature, defect equilibria,
oxygen fugacity, pressure, and kinetic effects, leading to the great number of published data for
partition coefficient. The behavior of REE is very sensitive to the presence or absence of particular
phases, which may vary with depth. Partial melting has strong effects on REE concentrations. It is
likely that much of the incompatible element variations observed in magmas and magmatic rocks
are related to variations in the degree of melting. For example, LREEs are incompatible in garnet,
REE phosphate solubility: Introduction 12
whereas HREEs are more compatible and preferentially enter the garnet structure. This can be
useful in determining whether the melt generation took place in the presence of a garnet phase or
not. This can also help in determining the depth of the melting. The presence of garnet in the
residue causes a strong HREE depletion and LREE enrichment of the melt.
In general, several workers have recently developed predictive models for D-values. These models
are based on either natural observations or experimental data, and are either empirical (McKay,
1989), theoretical (Van Westrenen et al., 2000), or a combination of both (Wood and Blundy 1997).
1.5.2. REE in different basaltic setting
Basalt is the most common rock type in the Earth's oceanic crust. In fact, most of the ocean floor is
made of basalt and huge outpourings of lava called "flood basalts" are found on the surface of many
continents. Basaltic magma is commonly produced by direct melting of the Earth's mantle. Thus,
the internal differentiation history of the mantle can be ascertained from studies of the chemical
signature brought to the surface by melts. It is important to note that the rare earth patterns in the
two most common types of basalts, mid-ocean-ridge basalt (MORB) and ocean-island basalt (OIB)
are distinctly different. This reflects the sources of the parental magmas, the extent of partial
melting and petrogenetic processes associated with melt formation and magma evolution. This
section briefly reviews the systematic of REE in these basalts.
1.5.2.1 Mid-Ocean Ridge Basalts (MORB)
In general, MORB melts are thought to be formed at shallow depth beneath a ridge axis by
anhydrous decompression melting. Initial melting may appear at depth of 60-80 km, and
segregation occurs at about 20 km (Hollings and Wyman, 2004). The normalized REE patterns are
smooth and characterized by LREE depleted patterns with general unfractionated HREE (Figure
1.3). The LREE depletion result from the fact that the MORB originates from a depleted upper
mantle, i.e. a part of the mantle that has already seen melts extraction before.
MORB basalts are mainly olivine tholeiites with a narrow range of major element composition. The
variation of major and trace element reflect the degree of partial melting and magma fractionation
and the existence of mantle heterogeneities.

REE phosphate solubility: Introduction 13
The most common MORB is normal MORB (N-MORB), which is known to be derived from
mantle source that is depleted in the most incompatible elements. Holling and Wyman (2004) noted
that, other kinds of MORB are enriched in incompatible elements and radiogenic isotopes. Their
REE abundance and incompatible element composition are transitional from plume MORB (P-
MORB), transitional MORB (T-MORB) and enriched MORB (E-MORB) to that of ocean island
basalts (OIB). The REE pattern of E-MORB is almost the same as that of OIB, which is explained
by the mix of depleted MORB mantle and an enriched OIB like source.
0,1
10,0
1000,0
La Ce Pr Nd Sm Eu Gd Tb Dy Ho Er Tm Yb Lu
CI
chondrite
Norm
aliz
ed A
bundance
OIB
MORB
Primitive mantle
Figure 1.3. A rare earth plot showing rare earth patterns for ocean island basalt (OIB) (Sun and McDonough, 1989) and mid ocean ridge basalt (MORB) (Taylor and McLennan, 1985)
1.5.2.2 Ocean island basalts (OIB)
It is generally accepted that OIBs are derived from mantle plumes. They can be either tholeiitic or
alkalic and are generated by partial melting of multi-component sources including: High-µ (HIMU)
recycled ocean crust; enriched mantle near primitive mantel (EM1); enriched mantle recycled
lithosphere (EM2) and depleted MORB mantle (DMM). The tholeiitic OIB represent a greater
degree of partial melting (20-30%) than the alkaline OIB (5-15%) (Wilson, 1989). OIB is typically
LREE enriched compared to N-MORB, likely as a result of their deviation from mixture of DMM
with HIMU, EM1 and EM2 sources.
The wide range of fluctuations of REE and other trace elements seen in the OIB when compared
with the much more homogeneous N-MORB suggests that the upper layer of the mantle is better
mixed than the composition of the lower layer.
REE phosphate solubility: Introduction 14
1.6. REE partition coefficient patterns for some major basaltic minerals
Shapes of the partition coefficients patterns of the major minerals involved in basalts petrogenesis
are illustrated in Figure 1.4.
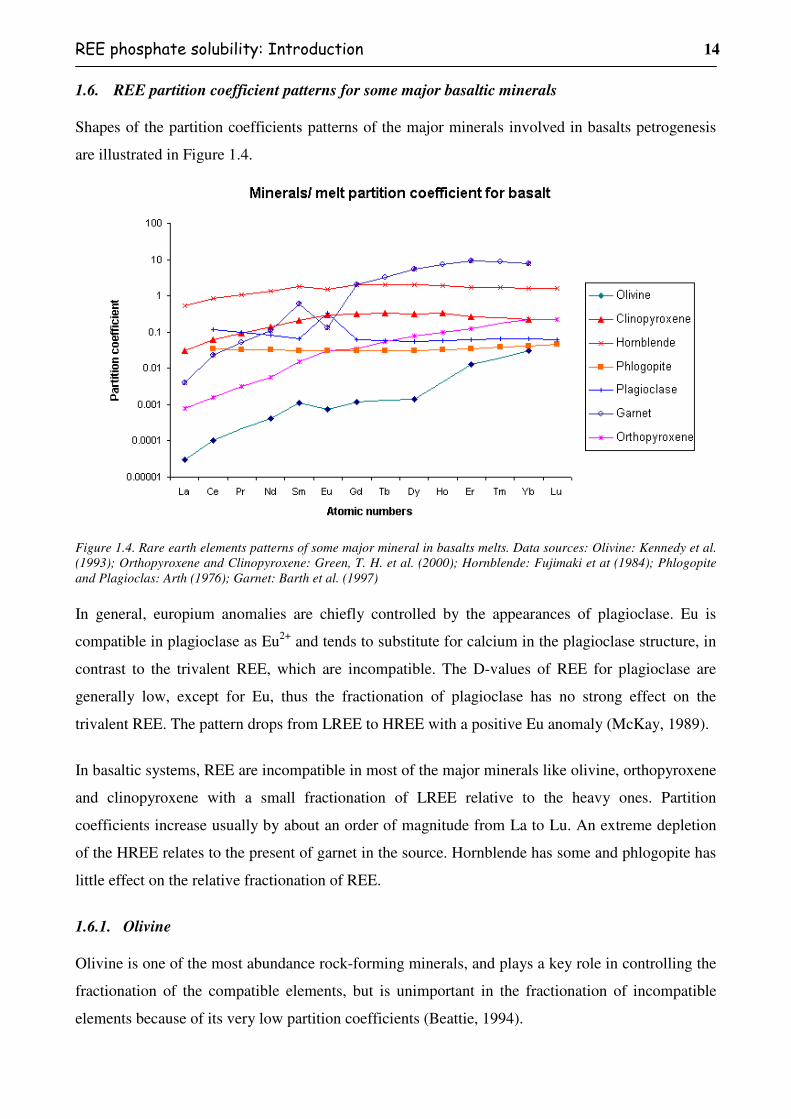
Figure 1.4. Rare earth elements patterns of some major mineral in basalts melts. Data sources: Olivine: Kennedy et al. (1993); Orthopyroxene and Clinopyroxene: Green, T. H. et al. (2000); Hornblende: Fujimaki et at (1984); Phlogopite and Plagioclas: Arth (1976); Garnet: Barth et al. (1997)
In general, europium anomalies are chiefly controlled by the appearances of plagioclase. Eu is
compatible in plagioclase as Eu2+ and tends to substitute for calcium in the plagioclase structure, in
contrast to the trivalent REE, which are incompatible. The D-values of REE for plagioclase are
generally low, except for Eu, thus the fractionation of plagioclase has no strong effect on the
trivalent REE. The pattern drops from LREE to HREE with a positive Eu anomaly (McKay, 1989).
In basaltic systems, REE are incompatible in most of the major minerals like olivine, orthopyroxene
and clinopyroxene with a small fractionation of LREE relative to the heavy ones. Partition
coefficients increase usually by about an order of magnitude from La to Lu. An extreme depletion
of the HREE relates to the present of garnet in the source. Hornblende has some and phlogopite has
little effect on the relative fractionation of REE.
1.6.1. Olivine
Olivine is one of the most abundance rock-forming minerals, and plays a key role in controlling the
fractionation of the compatible elements, but is unimportant in the fractionation of incompatible
elements because of its very low partition coefficients (Beattie, 1994).
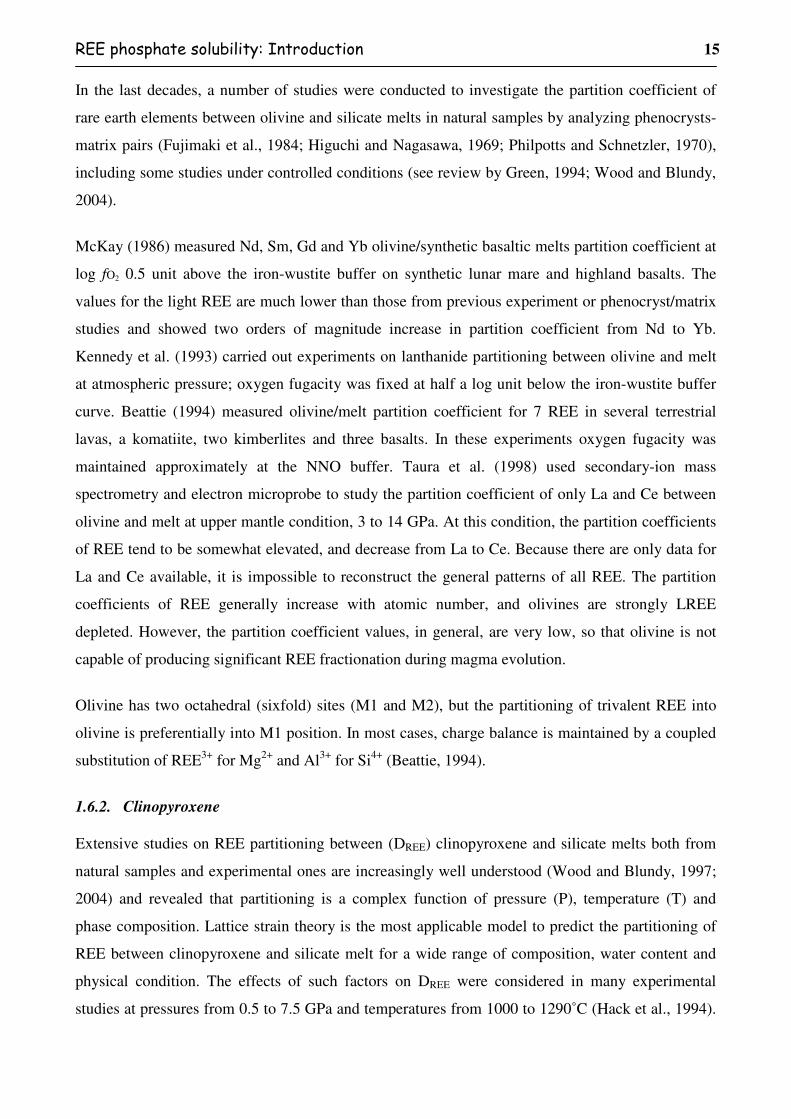
REE phosphate solubility: Introduction 15
In the last decades, a number of studies were conducted to investigate the partition coefficient of
rare earth elements between olivine and silicate melts in natural samples by analyzing phenocrysts-
matrix pairs (Fujimaki et al., 1984; Higuchi and Nagasawa, 1969; Philpotts and Schnetzler, 1970),
including some studies under controlled conditions (see review by Green, 1994; Wood and Blundy,
2004).
McKay (1986) measured Nd, Sm, Gd and Yb olivine/synthetic basaltic melts partition coefficient at
log fO2 0.5 unit above the iron-wustite buffer on synthetic lunar mare and highland basalts. The
values for the light REE are much lower than those from previous experiment or phenocryst/matrix
studies and showed two orders of magnitude increase in partition coefficient from Nd to Yb.
Kennedy et al. (1993) carried out experiments on lanthanide partitioning between olivine and melt
at atmospheric pressure; oxygen fugacity was fixed at half a log unit below the iron-wustite buffer
curve. Beattie (1994) measured olivine/melt partition coefficient for 7 REE in several terrestrial
lavas, a komatiite, two kimberlites and three basalts. In these experiments oxygen fugacity was
maintained approximately at the NNO buffer. Taura et al. (1998) used secondary-ion mass
spectrometry and electron microprobe to study the partition coefficient of only La and Ce between
olivine and melt at upper mantle condition, 3 to 14 GPa. At this condition, the partition coefficients
of REE tend to be somewhat elevated, and decrease from La to Ce. Because there are only data for
La and Ce available, it is impossible to reconstruct the general patterns of all REE. The partition
coefficients of REE generally increase with atomic number, and olivines are strongly LREE
depleted. However, the partition coefficient values, in general, are very low, so that olivine is not
capable of producing significant REE fractionation during magma evolution.
Olivine has two octahedral (sixfold) sites (M1 and M2), but the partitioning of trivalent REE into
olivine is preferentially into M1 position. In most cases, charge balance is maintained by a coupled
substitution of REE3+ for Mg2+ and Al3+ for Si4+ (Beattie, 1994).
1.6.2. Clinopyroxene
Extensive studies on REE partitioning between (DREE) clinopyroxene and silicate melts both from
natural samples and experimental ones are increasingly well understood (Wood and Blundy, 1997;
2004) and revealed that partitioning is a complex function of pressure (P), temperature (T) and
phase composition. Lattice strain theory is the most applicable model to predict the partitioning of
REE between clinopyroxene and silicate melt for a wide range of composition, water content and
physical condition. The effects of such factors on DREE were considered in many experimental
studies at pressures from 0.5 to 7.5 GPa and temperatures from 1000 to 1290˚C (Hack et al., 1994).

REE phosphate solubility: Introduction 16
In general, DREE between clinopyroxene and melt are very low and have smooth patterns, in which
D-values in the LREE part increase steeply from La to Eu, whereas in the HREE apart from Eu to
Lu, the pattern is relatively constant. DREE has positive correlations with Ca concentration in
pyroxene, and Al concentration in pyroxene and melts. DREE varies by over a factor of 2 for any
given bulk composition, and by up to a factor of 10 over the range of compositions from alkali
basalt to island arc basalts to mid-ocean ridge basalt (Hack et al., 1994). DREE slightly increases
with decreasing temperature, except DLu that shows a small but consistent increase as temperature
increases from 1050 to 1200 oC. DREE has positive correlation with pressure for clinopyroxene from
relatively silica rich composition (Green and Pearson, 1985), but has negative correlation with
pressure for clinopyroxene from basalts (Adam et al., 1994; 2003; Dunn, 1987). These correlations
between partition coefficient and pressure may be related to changes in site volumes and
electrostatic potentials accompanying shifts in the relative concentrations of AlIV and Na.
At high and constant pressure, DREE is also controlled by water content of the melt. The effect of
water on clinopyroxene-melt partition coefficient overwhelms the effect of temperature. This leads
to increasing fractionation of light from heavy REE compared to anhydrous experiments (Green et
al., 2000). The effect of H2O on the activities of DREE does not depend on the composition of the
clinopyroxene, but increase in water content leads to substantial decreases in REE partition
coefficients (Wood and Blundy, 2002).
1.6.3. Orthopyroxene
A number of researchers have measured the REE partition coefficient (DREE) between
orthopyroxene and coexisting melt under controlled conditions (Colson et al., 1988; Kennedy et al.,
1993; McKay et al., 1986; Nielsen et al., 1992). Although the experiments were conducted under
different conditions and on different bulk composition, the results are generally in good agreement.
DREE depends on the Fe/Mg ratio. It is supposed to be controlled by composition in the combined
data sets as well as other physical parameters (Colson et al., 1988; McKay, 1986). At temperatures
from 1050 – 1400oC, McKay (1986) and Nielsen et al. ( 1992) found a strong correlation between
DREE and wollastonite content of pyroxene, but the trends are not identical. The DREE from McKay
(1986) is lower at given Ca content than the result of Nielsen et al. (1992). This was explained by
the effect of different experimental conditions, melt composition or the precision of the analytical
instrument. In general, however, DREE increase as a function of Ca content in the pyroxene.
The DREE between orthopyroxene and melt are similar to olivine and are also very low. However, in
contrast to clinopyroxene, this pattern is steep and smoother, increasing from La to Lu as illustrated
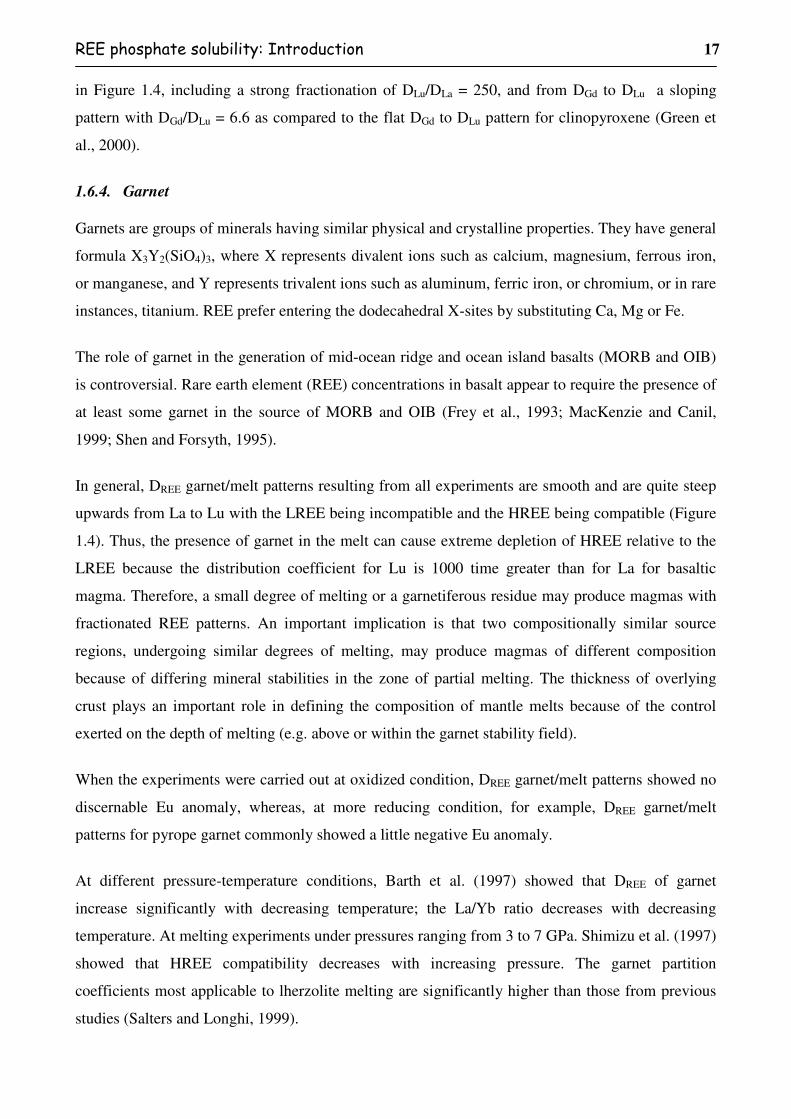
REE phosphate solubility: Introduction 17
in Figure 1.4, including a strong fractionation of DLu/DLa = 250, and from DGd to DLu a sloping
pattern with DGd/DLu = 6.6 as compared to the flat DGd to DLu pattern for clinopyroxene (Green et
al., 2000).
1.6.4. Garnet
Garnets are groups of minerals having similar physical and crystalline properties. They have general
formula X3Y2(SiO4)3, where X represents divalent ions such as calcium, magnesium, ferrous iron,
or manganese, and Y represents trivalent ions such as aluminum, ferric iron, or chromium, or in rare
instances, titanium. REE prefer entering the dodecahedral X-sites by substituting Ca, Mg or Fe.
The role of garnet in the generation of mid-ocean ridge and ocean island basalts (MORB and OIB)
is controversial. Rare earth element (REE) concentrations in basalt appear to require the presence of
at least some garnet in the source of MORB and OIB (Frey et al., 1993; MacKenzie and Canil,
1999; Shen and Forsyth, 1995).
In general, DREE garnet/melt patterns resulting from all experiments are smooth and are quite steep
upwards from La to Lu with the LREE being incompatible and the HREE being compatible (Figure
1.4). Thus, the presence of garnet in the melt can cause extreme depletion of HREE relative to the
LREE because the distribution coefficient for Lu is 1000 time greater than for La for basaltic
magma. Therefore, a small degree of melting or a garnetiferous residue may produce magmas with
fractionated REE patterns. An important implication is that two compositionally similar source
regions, undergoing similar degrees of melting, may produce magmas of different composition
because of differing mineral stabilities in the zone of partial melting. The thickness of overlying
crust plays an important role in defining the composition of mantle melts because of the control
exerted on the depth of melting (e.g. above or within the garnet stability field).
When the experiments were carried out at oxidized condition, DREE garnet/melt patterns showed no
discernable Eu anomaly, whereas, at more reducing condition, for example, DREE garnet/melt
patterns for pyrope garnet commonly showed a little negative Eu anomaly.
At different pressure-temperature conditions, Barth et al. (1997) showed that DREE of garnet
increase significantly with decreasing temperature; the La/Yb ratio decreases with decreasing
temperature. At melting experiments under pressures ranging from 3 to 7 GPa. Shimizu et al. (1997)
showed that HREE compatibility decreases with increasing pressure. The garnet partition
coefficients most applicable to lherzolite melting are significantly higher than those from previous
studies (Salters and Longhi, 1999).
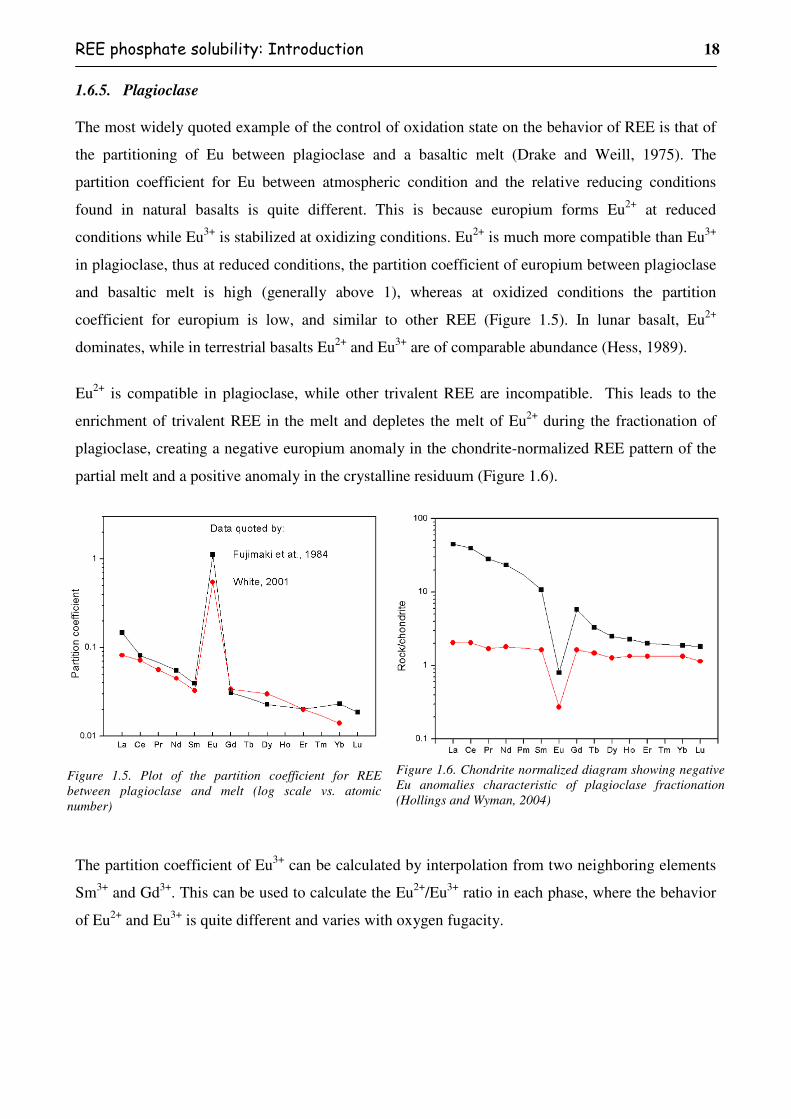
REE phosphate solubility: Introduction 18
1.6.5. Plagioclase
The most widely quoted example of the control of oxidation state on the behavior of REE is that of
the partitioning of Eu between plagioclase and a basaltic melt (Drake and Weill, 1975). The
partition coefficient for Eu between atmospheric condition and the relative reducing conditions
found in natural basalts is quite different. This is because europium forms Eu2+ at reduced
conditions while Eu3+ is stabilized at oxidizing conditions. Eu2+ is much more compatible than Eu3+
in plagioclase, thus at reduced conditions, the partition coefficient of europium between plagioclase
and basaltic melt is high (generally above 1), whereas at oxidized conditions the partition
coefficient for europium is low, and similar to other REE (Figure 1.5). In lunar basalt, Eu2+
dominates, while in terrestrial basalts Eu2+ and Eu3+ are of comparable abundance (Hess, 1989).
Eu2+ is compatible in plagioclase, while other trivalent REE are incompatible. This leads to the
enrichment of trivalent REE in the melt and depletes the melt of Eu2+ during the fractionation of
plagioclase, creating a negative europium anomaly in the chondrite-normalized REE pattern of the
partial melt and a positive anomaly in the crystalline residuum (Figure 1.6).
Figure 1.5. Plot of the partition coefficient for REE between plagioclase and melt (log scale vs. atomic number)
Figure 1.6. Chondrite normalized diagram showing negative Eu anomalies characteristic of plagioclase fractionation (Hollings and Wyman, 2004)
The partition coefficient of Eu3+ can be calculated by interpolation from two neighboring elements
Sm3+ and Gd3+. This can be used to calculate the Eu2+/Eu3+ ratio in each phase, where the behavior
of Eu2+ and Eu3+ is quite different and varies with oxygen fugacity.
REE phosphate solubility: Introduction 19
1.7. Rare earth elements in granitic systems
1.7.1. Distribution of REE in granitic rocks
Many hydrothermal and pegmatitic ore deposits are closely associated with granites. They provide
the most important source for metals such as copper, silver, tin, tungsten and molybdenum etc. In
some of these deposits, ore metals are enriched more than one million times relative to their average
content in the Earth’s crust. This enrichment is usually a result of source enrichment, magmatic
fractionation and sometimes the separation of a free fluid phase. Searching for new ore deposits in
the field requires a solid understanding of these processes and the ability to reconstruct the
fractionation path of a granitic magma from field relationships and geochemical data.
All of the REE have been commonly considered to be incompatible, i.e. they preferentially partition
into magmatic liquid relative to the coexisting crystalline assemblage, and thus crystal fractionation
should result in progressive enrichment of those elements in the remaining melt. The exception is
that heavy rare earth elements behave as compatible elements in cases where garnet or amphibole
appears as important constituents of the solid assemblage. In felsic igneous rocks, some studies
have shown that LREE concentration decreases rapidly during differentiation, suggesting that the
REE are not incompatible; rather, their abundance is controlled by the separation of some LREE
bearing accessories minerals (Miller and Mittlefehld, 1982).
In granite, most of the rare earth elements are not in the common rock-forming minerals (feldspars,
micas, etc), rather they are contained in tiny traces of accessory minerals. Thus the geochemical
behavior of REEs is controlled by the solubility of these accessory minerals like zircon, monazite,
apatite, allanite, xenotime, thorite, and huttonite (Seydoux et al., 2002). During crystallization, REE
behavior is controlled by the nature of the crystallizing accessories, the kinetics of nucleation and
crystal growth, and the dynamics of solid melt segregation. During partial melting, REE
concentration in melts is controlled by the solubility, solution kinetics, and accessibility of the
accessories to the melt. Understanding that process can help to reconstruct the origin and
fractionation of granitic magmas from trace element abundances measured in natural samples. This
is obviously something of great importance for understanding the origin of economic ore deposits.
A main focus of the present study will be on rare earth elements and the behavior of accessory
minerals such as monazite and xenotime. Both monazite and xenotime often control the
concentration of rare earth element during the fractionation of granite.
Monazite and xenotime are the most common accessory minerals in both peralumious granitoids,
intermediate to high grade metapelictic rocks and in some hydrothermal veins (Franz et al., 1996;
Nabelek and Glascock, 1995; Zhu and O'Nions, 1999) and they are the main accessory minerals
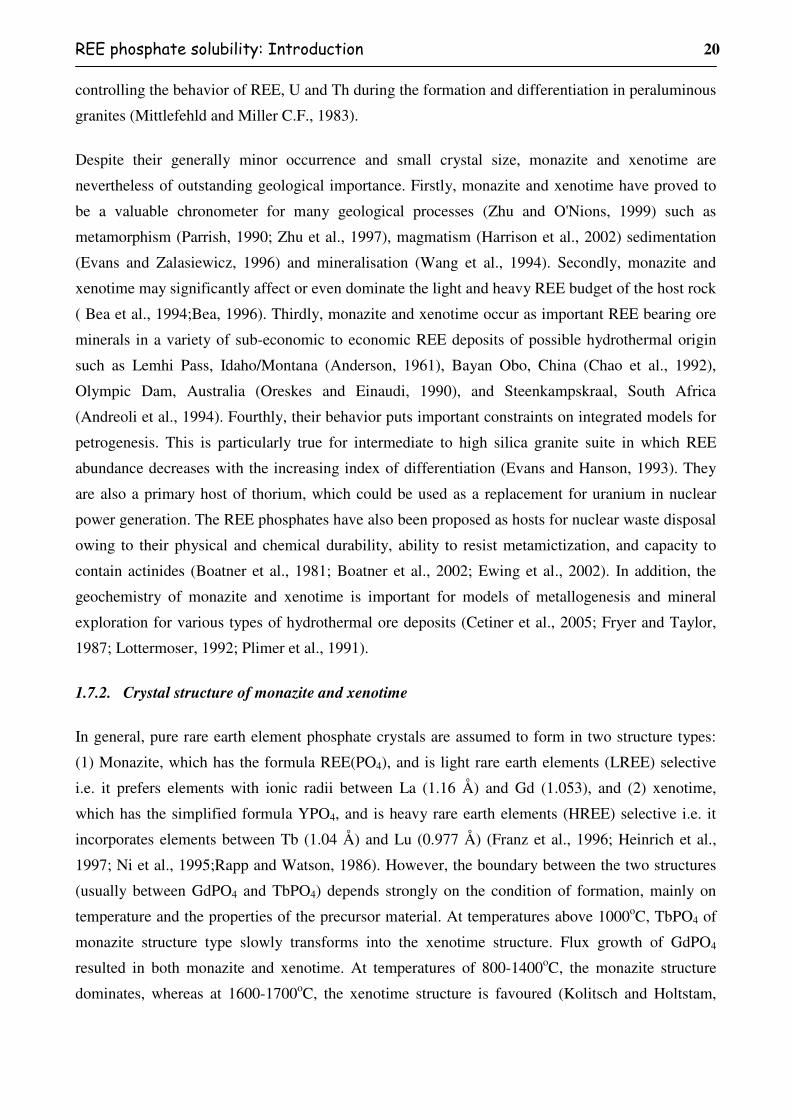
REE phosphate solubility: Introduction 20
controlling the behavior of REE, U and Th during the formation and differentiation in peraluminous
granites (Mittlefehld and Miller C.F., 1983).
Despite their generally minor occurrence and small crystal size, monazite and xenotime are
nevertheless of outstanding geological importance. Firstly, monazite and xenotime have proved to
be a valuable chronometer for many geological processes (Zhu and O'Nions, 1999) such as
metamorphism (Parrish, 1990; Zhu et al., 1997), magmatism (Harrison et al., 2002) sedimentation
(Evans and Zalasiewicz, 1996) and mineralisation (Wang et al., 1994). Secondly, monazite and
xenotime may significantly affect or even dominate the light and heavy REE budget of the host rock
( Bea et al., 1994;Bea, 1996). Thirdly, monazite and xenotime occur as important REE bearing ore
minerals in a variety of sub-economic to economic REE deposits of possible hydrothermal origin
such as Lemhi Pass, Idaho/Montana (Anderson, 1961), Bayan Obo, China (Chao et al., 1992),
Olympic Dam, Australia (Oreskes and Einaudi, 1990), and Steenkampskraal, South Africa
(Andreoli et al., 1994). Fourthly, their behavior puts important constraints on integrated models for
petrogenesis. This is particularly true for intermediate to high silica granite suite in which REE
abundance decreases with the increasing index of differentiation (Evans and Hanson, 1993). They
are also a primary host of thorium, which could be used as a replacement for uranium in nuclear
power generation. The REE phosphates have also been proposed as hosts for nuclear waste disposal
owing to their physical and chemical durability, ability to resist metamictization, and capacity to
contain actinides (Boatner et al., 1981; Boatner et al., 2002; Ewing et al., 2002). In addition, the
geochemistry of monazite and xenotime is important for models of metallogenesis and mineral
exploration for various types of hydrothermal ore deposits (Cetiner et al., 2005; Fryer and Taylor,
1987; Lottermoser, 1992; Plimer et al., 1991).
1.7.2. Crystal structure of monazite and xenotime
In general, pure rare earth element phosphate crystals are assumed to form in two structure types:
(1) Monazite, which has the formula REE(PO4), and is light rare earth elements (LREE) selective
i.e. it prefers elements with ionic radii between La (1.16 Å) and Gd (1.053), and (2) xenotime,
which has the simplified formula YPO4, and is heavy rare earth elements (HREE) selective i.e. it
incorporates elements between Tb (1.04 Å) and Lu (0.977 Å) (Franz et al., 1996; Heinrich et al.,
1997; Ni et al., 1995;Rapp and Watson, 1986). However, the boundary between the two structures
(usually between GdPO4 and TbPO4) depends strongly on the condition of formation, mainly on
temperature and the properties of the precursor material. At temperatures above 1000oC, TbPO4 of
monazite structure type slowly transforms into the xenotime structure. Flux growth of GdPO4
resulted in both monazite and xenotime. At temperatures of 800-1400oC, the monazite structure
dominates, whereas at 1600-1700oC, the xenotime structure is favoured (Kolitsch and Holtstam,

REE phosphate solubility: Introduction 21
2004). The transition from monazite to xenotime structure occurs between Gd and Tb at condition
of 25oC and 1 bar (Ni et al., 1995).
Monazite is monoclinic, a = 6.79, b = 7.01, c = 6.46, β = 104.4o, Z = 4 with space group P21/n and
point group 2/m and has a ninefold coordination for the REE. Crystals are usually small, tabular, or
prismatic, often forming granular masses. Xenotime is tetragonal, with space group I41/amd and is
isostructural with zircon and thorite, which is the dimorph of huttonite. Both atomic arrangements
are based on [001] chains of alternative edge-sharing phosphate tetrahedra and REE polyhedra, with
a REEO8 polyhedron in xenotime and a REEO9 polyhedron in monazite (Figure 1.7). Monazite is
isostructural with crocoite, PbCrO4 and huttonite (ThSiO4). Both monazite and xenotime show a
linear correlation between cell volume and ionic radious of their respective REE (Gratz and
Heinrich, 1997). The biggest cell volume of the monazite suite is 305.7Å3 (LaPO4) and gradually
decreases to 279.1 Å3 (GdPO4) as the ionic radii decrease from La to Gd, while the biggest cell
volume of the xenotime suite decreases from 291.1 Å3 (TbPO4) to 273.6 Å3 (LuPO4) as the radii
decrease from Tb to Lu (Figure 1.8).
PCeP
O
Ce
O
‘b‘c
‘c
MONAZITEMonoclinicSpace group P2 /nCeO -PO
1
9 4
XENOTIMETetragonalSpace group I4 /amdYO -PO
1
8 4
Y P Y
P
O O
‘b
Figure 1.7. Typical monazite (CePO4) and xenotime (YPO4) structure. Both arrangements are based on [001] chains of
alternating phosphate tetrahedra and REEO8 polyhedra in xenotime or REEO9 polyhedra in monazite (Modified after
Taylor and Ewing, 1978)
In nature, there is no pure single rare earth element monazite. Rather, monazite is a solid solution
including all of the rare earths, but Ce, La and Th are usually the dominant large cations. The three
most common monazite types are distinguished as monazite-Ce {(Ce, La, Nd, Th, Y)PO4},
monazite-La {(La, Ce, Nd)PO4} and monazite-Nd {(Nd, La, Ce)PO4}. Silica or SiO4, is often
present in natural monazite replacing a small percentage of the phosphate groups. Uranium is also a
trace element in some specimens. Like in monazite, Y in xenotime also can be replaced by other
REE or uranium and thorium to form a solid solution series.
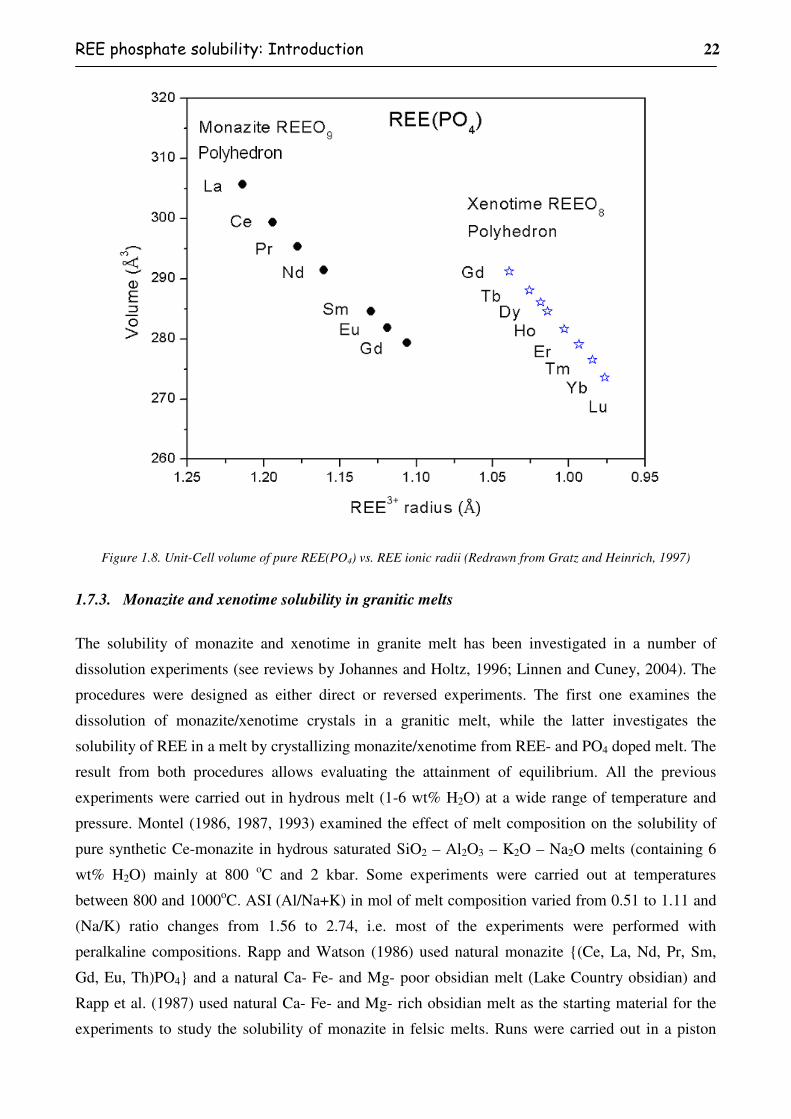
REE phosphate solubility: Introduction 22
Figure 1.8. Unit-Cell volume of pure REE(PO4) vs. REE ionic radii (Redrawn from Gratz and Heinrich, 1997)
1.7.3. Monazite and xenotime solubility in granitic melts
The solubility of monazite and xenotime in granite melt has been investigated in a number of
dissolution experiments (see reviews by Johannes and Holtz, 1996; Linnen and Cuney, 2004). The
procedures were designed as either direct or reversed experiments. The first one examines the
dissolution of monazite/xenotime crystals in a granitic melt, while the latter investigates the
solubility of REE in a melt by crystallizing monazite/xenotime from REE- and PO4 doped melt. The
result from both procedures allows evaluating the attainment of equilibrium. All the previous
experiments were carried out in hydrous melt (1-6 wt% H2O) at a wide range of temperature and
pressure. Montel (1986, 1987, 1993) examined the effect of melt composition on the solubility of
pure synthetic Ce-monazite in hydrous saturated SiO2 – Al2O3 – K2O – Na2O melts (containing 6
wt% H2O) mainly at 800 oC and 2 kbar. Some experiments were carried out at temperatures
between 800 and 1000oC. ASI (Al/Na+K) in mol of melt composition varied from 0.51 to 1.11 and
(Na/K) ratio changes from 1.56 to 2.74, i.e. most of the experiments were performed with
peralkaline compositions. Rapp and Watson (1986) used natural monazite {(Ce, La, Nd, Pr, Sm,
Gd, Eu, Th)PO4} and a natural Ca- Fe- and Mg- poor obsidian melt (Lake Country obsidian) and
Rapp et al. (1987) used natural Ca- Fe- and Mg- rich obsidian melt as the starting material for the
experiments to study the solubility of monazite in felsic melts. Runs were carried out in a piston

REE phosphate solubility: Introduction 23
cylinder apparatus at 8 kbar over a temperature range of 1000-1400oC, and a wide range of water
contents (1-6 wt % H2O). These were partial dissolution experiments in a short time (4 hours to 2
weeks), in which the REE diffused gradually from crystal into melt as a function of time,
temperature and distance. The saturation level was thought to be at the interface between crystals
and melt, and was calculated from the gradient of concentration in the glass around the crystals.
Wolf and London (1995) studied the relative solubility of apatite, monazite and xenotime in
peraluminous granitic melt at 750oC and 2 kbar. Natural apatite {Ca5(PO4)3} (with 1.4 wt%
REE2O3), monazite {(Ce, Nd, Sm, Gd)(PO4)} and xenotime {(Y, Dy, Yb, Er)(PO4)} were mixed
with Ca-free haplogranite. The initial composition has ASI ranging from 1.05 to 1.2 and projects
slightly to the feldspar side of the 2 kbar, water saturated minimum haplogranite (Tuttle and Bowen,
1958). Under conditions of 800oC and 2 kbar, Keppler (1993) investigated the role of F on the
solubility of some rare earth phosphate crystals (LaPO4, GdPO4 and YbPO4) in SiO2 – Al2O3 – K2O
– Na2O melt with the ASI equal to 1.
In spite of various experimental techniques and conditions, the results have shown that the
solubility of monazite/xenotime in the melt mainly depends on: (1) the temperature, (2) the melt
composition (3) the water content, and may be (4) other volatile or non-metallic elements including
P, F, Cl, etc. Pressure has little effect on the solubility of monazite/xenotime in melt.
Figure 1.9, adapted from Johannes and Holtz (1996) and/or Montel (1993) illustrates the
temperature dependence of monazite solubility. However, the diagram also shows some of the
original data by Rapp and Watson (1986), which were arbitrarily excluded from the plot of
Johannes and Holtz and which do not fall on their regression line.
The most important compositional parameter controlling monazite solubility in a felsic melt is the
aluminum saturation index (ASI). ASI can be defined as the molar ratio Al2O3/(Na2O + K2O) or, for
a Ca-bearing granite, as Al2O3/(CaO + Na2O + K2O). Granites are classified according to ASI as:
(1) peralkaline (ASI < 1); (2) metaluminous (ASI closes to 1 and [Na2O+K2O] < [Al2O3]<
[CaO+Na2O+K2O]) and (3) peraluminous (ASI> 1 for Ca-bearing granite or ASI > 1.15 for high P
rare element granite) (Linnen and Cuney, 2004 ). Peralkaline granites are characterized by very high
concentration of REE, up to thousands ppm. Peraluminous granites contain extremely low REE
concentrations, even lower than the average upper crustal abundance. Most of the rare-element
granites contain only few ppm REE or less (Linnen and Cuney, 2004). This is in agreement with the
experimental results that monazite/xenotime solubility in water-saturated haplogranite melt depends
strongly on the melt composition, ranging from >1000 ppm in strongly peralkaline composition to
few hundred ppm for high-silica peraluminous composition at >800oC and 2 kbar to only few tens
ppm for low temperature peraluminous granite (see Figure 1.10). While monazite solubility
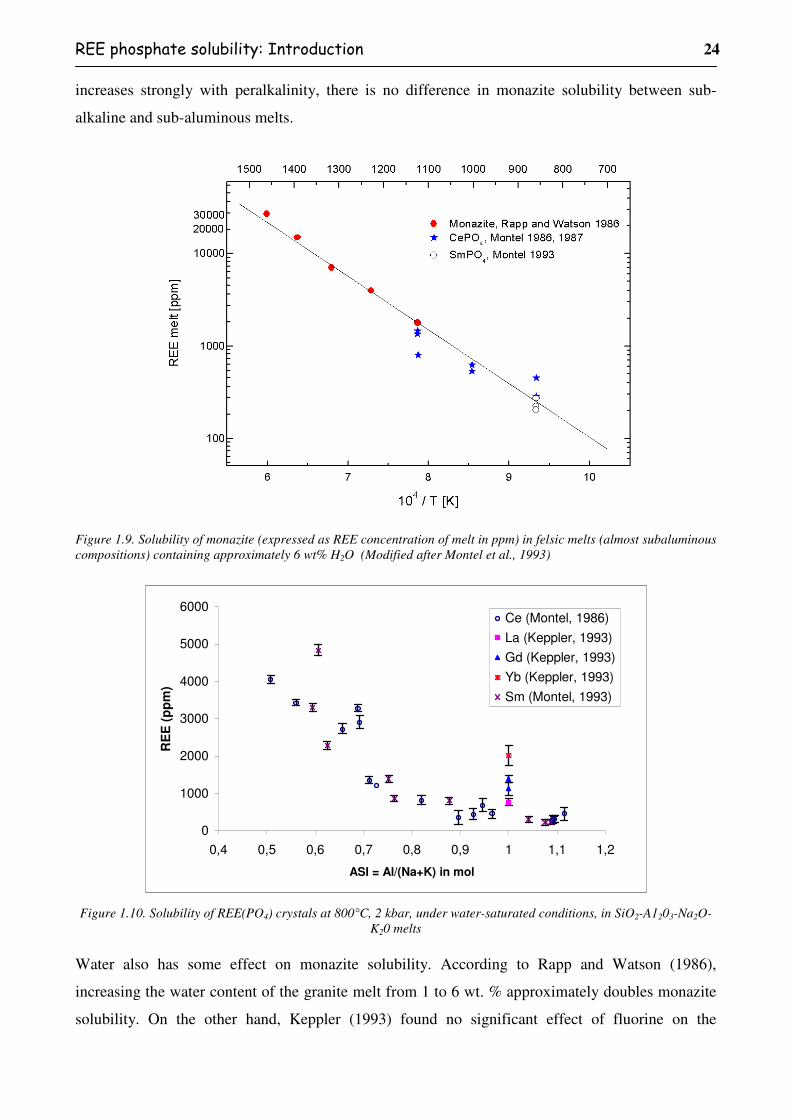
REE phosphate solubility: Introduction 24
increases strongly with peralkalinity, there is no difference in monazite solubility between sub-
alkaline and sub-aluminous melts.
Figure 1.9. Solubility of monazite (expressed as REE concentration of melt in ppm) in felsic melts (almost subaluminous compositions) containing approximately 6 wt% H2O (Modified after Montel et al., 1993)
0
1000
2000
3000
4000
5000
6000
0,4 0,5 0,6 0,7 0,8 0,9 1 1,1 1,2
ASI = Al/(Na+K) in mol
RE
E (
pp
m)
Ce (Montel, 1986)
La (Keppler, 1993)
Gd (Keppler, 1993)
Yb (Keppler, 1993)
Sm (Montel, 1993)
Figure 1.10. Solubility of REE(PO4) crystals at 800°C, 2 kbar, under water-saturated conditions, in SiO2-A1203-Na2O-
K20 melts
Water also has some effect on monazite solubility. According to Rapp and Watson (1986),
increasing the water content of the granite melt from 1 to 6 wt. % approximately doubles monazite
solubility. On the other hand, Keppler (1993) found no significant effect of fluorine on the
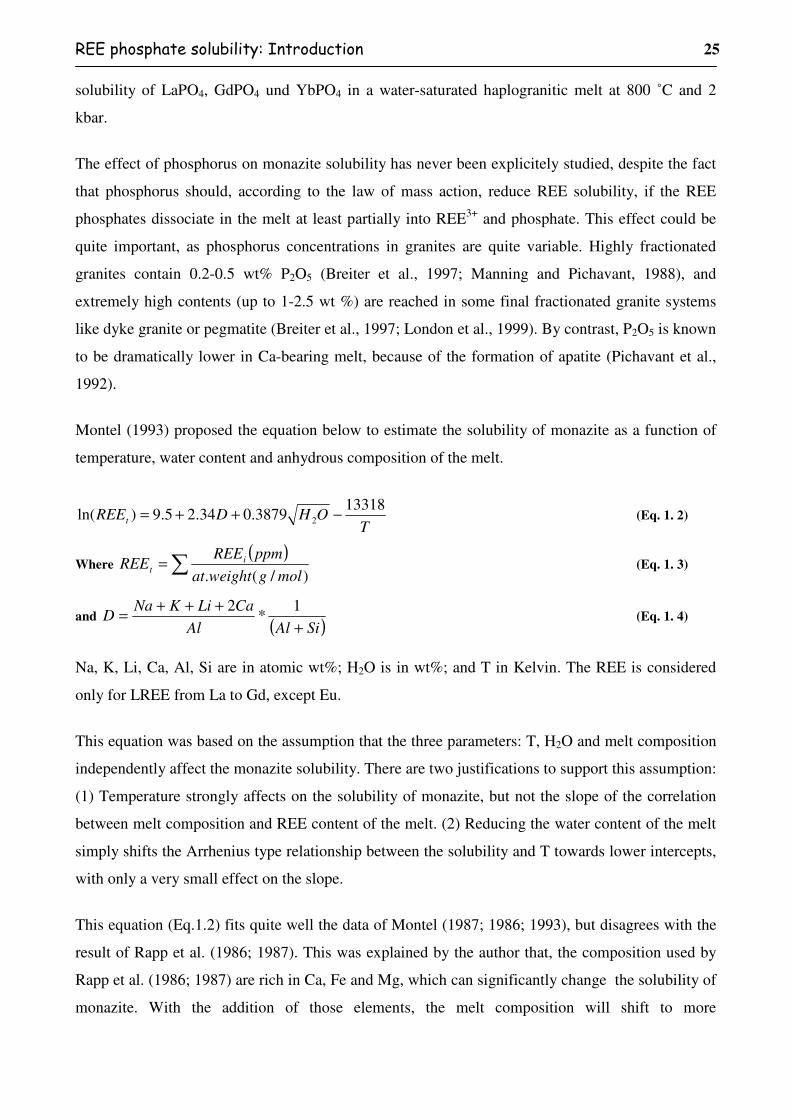
REE phosphate solubility: Introduction 25
solubility of LaPO4, GdPO4 und YbPO4 in a water-saturated haplogranitic melt at 800 ˚C and 2
kbar.
The effect of phosphorus on monazite solubility has never been explicitely studied, despite the fact
that phosphorus should, according to the law of mass action, reduce REE solubility, if the REE
phosphates dissociate in the melt at least partially into REE3+ and phosphate. This effect could be
quite important, as phosphorus concentrations in granites are quite variable. Highly fractionated
granites contain 0.2-0.5 wt% P2O5 (Breiter et al., 1997; Manning and Pichavant, 1988), and
extremely high contents (up to 1-2.5 wt %) are reached in some final fractionated granite systems
like dyke granite or pegmatite (Breiter et al., 1997; London et al., 1999). By contrast, P2O5 is known
to be dramatically lower in Ca-bearing melt, because of the formation of apatite (Pichavant et al.,
1992).
Montel (1993) proposed the equation below to estimate the solubility of monazite as a function of
temperature, water content and anhydrous composition of the melt.
TOHDREEt
133183879.034.25.9)ln( 2 −++= (Eq. 1. 2)
Where ( )
∑=)/(. molgweightat
ppmREEREE i
t (Eq. 1. 3)
and ( )SiAlAl
CaLiKNaD
+
+++=
1*
2 (Eq. 1. 4)
Na, K, Li, Ca, Al, Si are in atomic wt%; H2O is in wt%; and T in Kelvin. The REE is considered
only for LREE from La to Gd, except Eu.
This equation was based on the assumption that the three parameters: T, H2O and melt composition
independently affect the monazite solubility. There are two justifications to support this assumption:
(1) Temperature strongly affects on the solubility of monazite, but not the slope of the correlation
between melt composition and REE content of the melt. (2) Reducing the water content of the melt
simply shifts the Arrhenius type relationship between the solubility and T towards lower intercepts,
with only a very small effect on the slope.
This equation (Eq.1.2) fits quite well the data of Montel (1987; 1986; 1993), but disagrees with the
result of Rapp et al. (1986; 1987). This was explained by the author that, the composition used by
Rapp et al. (1986; 1987) are rich in Ca, Fe and Mg, which can significantly change the solubility of
monazite. With the addition of those elements, the melt composition will shift to more

REE phosphate solubility: Introduction 26
metaluminous composition, which then affects the solubility of monazite in the melt. Also, the
appearance of Ca in melt will produce allanite at the expense of monazite (Cuney and Friedrich,
1987; Lee and Bastron, 1967).
The proposed equation was extrapolated by using data on the solubility of monazite with different
rare earth elements (Ce, Sm) and did not consider the effect of many elements like Fe, Mg, P, F or
Cl, etc. In addition, Montel (1993) did not quote the data from Rapp et al. (1986) individually, but
sum up as total REE solubility in the melt. This equation may therefore be applicable to only Ca, Fe
and Mg poor compositions, with a molar ratio of REE/P equal to 1 and to peralkaline rocks.
Moreover, there are several additional problems with this equation: (1) It does not discriminate
between different REE elements, (2) the effect of phosphorus on the solubility product of REE
phosphates is not considered at all, (3) the equation would predict a continuous change of solubility
with ASI both in the peralkaline and the peraluminous field, while experimental data show no
variation in the peraluminous field at all.
1.8. Lanthanide tetrad effect
A “lanthanide tetrad effect” was first discovered by Peppard et al. (1969) during a study of REE
distribution between organic liquids and an aqueous phase. Peppard et al. (1969) showed that the
partitioning behavior of the lanthanides was not a smooth function of atomic number, but rather
showed a periodicity corresponding to quarter, halve and three quarter filled f-orbital levels.
Accordingly, this effect is probably related to some interactions between the f-orbitals and the
surrounding ligands, similar to the crystal field effects seen in transition metal ions. The lanthanide
tetrad effect has since then drawn the attention of geochemists and petrologists. Literature on
lanthanide tetrad effects in natural geological materials and experimental products has recently
increased with a lot of significant achievements from many authors (Akagi et al., 1993; Bau, 1996;
Coppin et al., 2002; Irber et al., 1997; Irber, 1999; Kawabe, 1995; Liu and Zhang, 2005; Masau et
al., 2000; Masuda and Akagi, 1989; Monecke et al., 2002; Pan and Bau, 1997; Takahashi et al.,
2002; Takahashi et al., 2003; Wu et al., 2004; Zhao et al., 1992). Several authors (Byrne and Li,
1995; McLennan, 1994) have, however, questioned its existence in natural geological samples and
often ascribed it to analytical problems or to artifacts of the normalization procedure. However, this
problem has been overcome by the advent of new analytical methods such as ICP-MS analyses,
which produce a complete REE spectrum with high enough precision (Monecke et al., 2002).
The lanthanide tetrad effect can be observed as a split of rare earth element abundance or
distribution patterns into four rounded segments: (1). La–Nd, (2). Pm–Gd, (3). Gd–Ho, and (4). Er–
Lu, and each tetrad forms a smooth convex or concave pattern, which is further termed the M-type
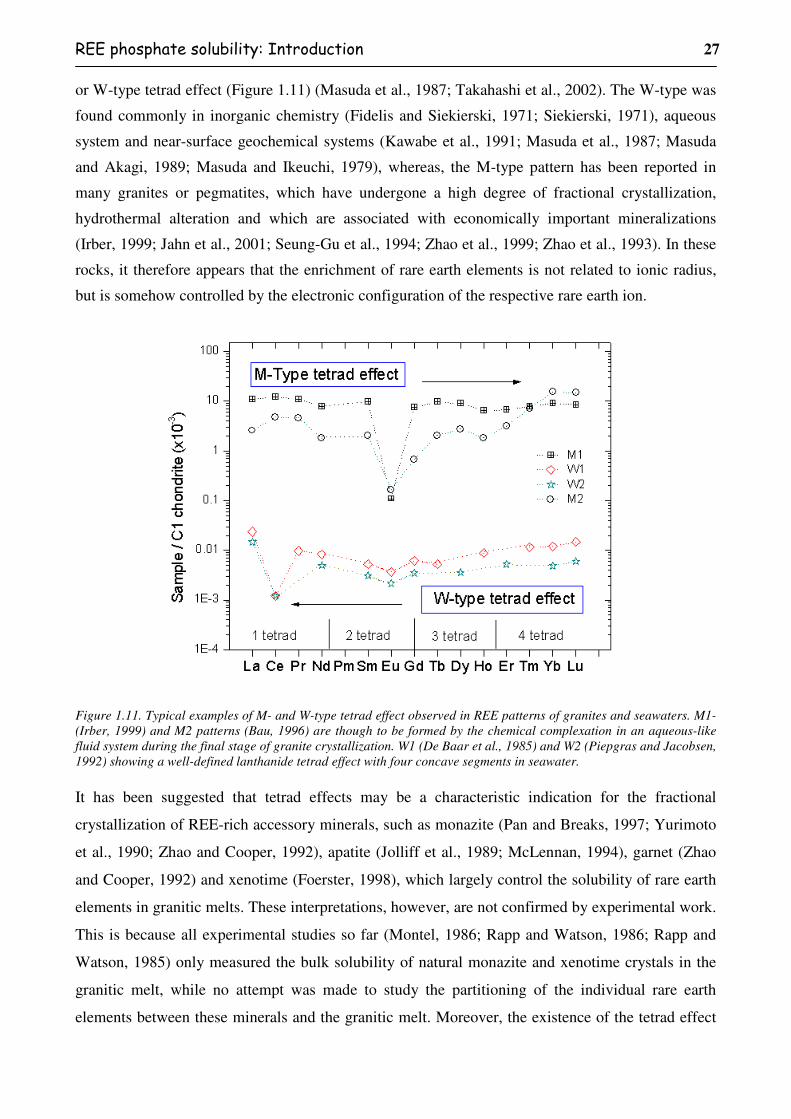
REE phosphate solubility: Introduction 27
or W-type tetrad effect (Figure 1.11) (Masuda et al., 1987; Takahashi et al., 2002). The W-type was
found commonly in inorganic chemistry (Fidelis and Siekierski, 1971; Siekierski, 1971), aqueous
system and near-surface geochemical systems (Kawabe et al., 1991; Masuda et al., 1987; Masuda
and Akagi, 1989; Masuda and Ikeuchi, 1979), whereas, the M-type pattern has been reported in
many granites or pegmatites, which have undergone a high degree of fractional crystallization,
hydrothermal alteration and which are associated with economically important mineralizations
(Irber, 1999; Jahn et al., 2001; Seung-Gu et al., 1994; Zhao et al., 1999; Zhao et al., 1993). In these
rocks, it therefore appears that the enrichment of rare earth elements is not related to ionic radius,
but is somehow controlled by the electronic configuration of the respective rare earth ion.
Figure 1.11. Typical examples of M- and W-type tetrad effect observed in REE patterns of granites and seawaters. M1- (Irber, 1999) and M2 patterns (Bau, 1996) are though to be formed by the chemical complexation in an aqueous-like fluid system during the final stage of granite crystallization. W1 (De Baar et al., 1985) and W2 (Piepgras and Jacobsen, 1992) showing a well-defined lanthanide tetrad effect with four concave segments in seawater.
It has been suggested that tetrad effects may be a characteristic indication for the fractional
crystallization of REE-rich accessory minerals, such as monazite (Pan and Breaks, 1997; Yurimoto
et al., 1990; Zhao and Cooper, 1992), apatite (Jolliff et al., 1989; McLennan, 1994), garnet (Zhao
and Cooper, 1992) and xenotime (Foerster, 1998), which largely control the solubility of rare earth
elements in granitic melts. These interpretations, however, are not confirmed by experimental work.
This is because all experimental studies so far (Montel, 1986; Rapp and Watson, 1986; Rapp and
Watson, 1985) only measured the bulk solubility of natural monazite and xenotime crystals in the
granitic melt, while no attempt was made to study the partitioning of the individual rare earth
elements between these minerals and the granitic melt. Moreover, the existence of the tetrad effect
REE phosphate solubility: Introduction 28
both in minerals and their host rocks is difficult to explain by the fractional crystallization of such
accessory minerals. This led to the suggestion that the tetrad effect of highly evolved peraluminous
magmas and granite-related rare metal deposits may result from melt/fluid interaction (Bau, 1997;
Irber, 1999; Liu and Zhang, 2005) or the transitional nature of volatile rich evolved magmatic
liquids (Bau, 1996).
The distribution of rare earth elements (REE) in hydrothermal system has been studied in black
smoker vent fluids (Klinkhammer et al., 1994), in dispersed flows at the ocean floor (Michard et al.,
1993), in fumaroles and thermal spring waters (Moeller, 2000). The REE abundance in fluids is
supposed to be mainly controlled by accessory minerals, REE exchange with rock-forming minerals
and their amorphous surface coatings, and coprecipitation of REE with alteration minerals (Moeller
et al., 2004). However, a tetrad effect was not observed in the REE patterns in many hydrothermal
systems, especially of related vein fluorite samples. The tetrad effect is observed only at the related
granite and it is thought to be due to extensive magmatic differentiation, during which there are was
intense interaction between the residual melts and aqueous hydrothermal fluid, probably rich in F
and Cl (Jahn et al., 2001). Therefore, it is unlikely that the convex tetrad effect in the samples from
the magmatic environment can be explained by removal of a respective complementary REE
pattern by a coexisting hydrothermal fluid. It is suggested that the tetrad effect formed within the
magma-fluid system before phase separation caused a split of this system into fluid and magma
subsystems. Alternatively, the tetrad effect may also be inherited from an external fluid influencing
the system during or after the emplacement of the magma (Monecke et al., 2002).
In conclusion, the tetrad effect is very common in highly fractionated granites with strong
hydrothermal interaction or deuteric alteration. However, the causes of the tetrad effect in natural
granites are not yet fully understood.

REE phosphate solubility: Experimental procedures and methods 29
2. Experimental procedures and methods
2.1. Starting materials and preparation of sample capsules
2.1.1. Synthesis of glasses
Three series of experiments were carried out in this study. The first one was designed to investigate
the effect of phosphorus on the solubility of monazite and xenotime in granitic melts. The second
one studied the relationship between REE solubility and aluminium-saturated index (ASI), and the
last one examined the effect of fluoride on monazite and xenotime solubility in the melt. In
addition, a series of reverse experiments was also done to test for equilibrium in the experiments.
Table 2.1 lists the chemicals, their purity and manufacturer used to produce the glasses, which
served as starting materials in this study. The theoretical composition of the mixtures for glass
synthesis is shown in Table 2.2.
Table 2.1. Chemicals used for the synthesis of glasses
Chemical Purity grade Manufacturer Chemical Purity grade Manufacturer
Na4P2O7.10H2O 99 Merck REE2O3* 99.9 Chempur
Na2CO3 99.9 Merck CeO2 99.9 Chempur
K2CO3 99 Merck Tb4O7 99.9 Chempur
Al(OH)3 99.9 Merck AlF3 99.9 Aldrich
SiO2 99.99 Chempur KF 99 Merck
H3PO4 Merck NaF 99 Merck
* REE abbreviated for all rare earth elements except Ce and Tb
Six different glasses (H1-H6) containing 0,1% of P2O5 were used as solid starting material for ASI
variation series experiments (Table 2.2). Two glasses doped with F (F2 and F4) were prepared by
adding NaF, KF and AlF3 to glass H4 (ASI = 1) so as to obtain the F-content of 2 and 4 wt%. In
these glasses, F was introduced so that F replaced a stoichiometrically equivalent amount of O (2F
=O) while the molar Al/(Na+K) ratio was kept constant. Two sets of different glasses doped with
P2O5 content ranging from 0.25 to 1.5 wt% were prepared (Table 2.2). The first one (H82-H86) was
based on the peralkaline composition (ASI = 0.8) and the second one (H102-H106) was based on
the metaluminous composition (ASI =1). The metaluminous composition of the glasses was 40% of
NaAlSi3O8, 25% of SiO2 and 25% KAlSi3O8 corresponding to the 2 kbar water-saturated
haplogranite minimum (Tuttle and Bowen, 1958). The theoretical ASI of the glasses was varied

REE phosphate solubility: Experimental procedures and methods 30
from peralkaline (ASI = 0.7) to peralumiunous (ASI = 1.2) by changing the Na, K and Al content,
but in all cases the ratio of Na/K = 1 and the silica content were constant. The glasses were prepared
by melting mixtures of high purity chemicals supplied by Chempur, Merck and Aldrich companies.
Before preparing the sample, all equipment was cleaned well by rinsing in distilled water and dried
in the oven up to 150oC in 2-3 hours. The chemicals of K2CO3, Na2CO3, NaF, KF, AlF3 and SiO2
were kept in the oven at 110oC for about 5 hours for drying, then they were cooled down to room
temperature in a desiccator for about 2 hours; the water-bearing chemicals such as Na4P2O7.10H2O
and Al(OH)3 were used directly. Chemicals were weighed using an electric SATORIUS – BP 211D
microbalance with an accuracy of 0,01mg. Ethanol was used to wash all the chemicals from the
weighing paper into the sample jar. The samples were then dried for 5 to 7 days at room
temperature in a fume hood. The samples were subsequently homogenized by grinding in ball-
grinder under ethanol for 30 minutes. After grinding, the samples were allowed to dry in a fume
hood for 2-3 days.
Table 2.2. Theoretical compositions of mixtures for glass synthesis (in weight percent)
Chemical (g) Calculated
Samples Na4P2O7.10H2O Na2CO3 K2CO3 Al(OH)3 SiO2 ASI P2O5
H1 0.03142 0.98349 0.75895 1.60196 7.86866 0.7 0.10
H2 0.03142 0.91900 0.70918 1.71076 7.86866 0.8 0.10
H3 0.03142 0.86244 0.66554 1.80616 7.86866 0.9 0.10
H4 0.03142 0.81245 0.62695 1.89050 7.86866 1.0 0.10
H5 0.03142 0.76793 0.59260 1.96560 7.86866 1.1 0.10
H6 0.03142 0.72803 0.56181 2.03290 7.86866 1.2 0.10
H82 0.07856 0.88185 0.69385 1.69069 7.86866 0.8 0.25
H83 0.15712 0.84929 0.68562 1.67062 7.86866 0.8 0.50
H84 0.23568 0.81673 0.67738 1.65056 7.86866 0.8 0.75
H85 0.31425 0.78417 0.66915 1.63049 7.86866 0.8 1.00
H86 0.47137 0.71906 0.65268 1.59036 7.86866 0.8 1.50
H102 0.07856 0.77707 0.61340 1.86833 7.86866 1.0 0.25
H103 0.15712 0.74576 0.60612 1.84615 7.86866 1.0 0.50
H104 0.23568 0.71444 0.59884 1.82398 7.86866 1.0 0.75
H105 0.31425 0.68313 0.59156 1.80180 7.86866 1.0 1.00
H106 0.47137 0.62050 0.57700 1.75745 7.86866 1.0 1.50
Then the samples were mixed and ground by hand once again in an agate mortar. The powder was
then slowly heated in a platinum crucible to 1000 – 1200 ˚C and kept there for 10 - 14 hours in
order to release all water and carbon dioxide (Table 2.3). The slow heating is necessary in order to

REE phosphate solubility: Experimental procedures and methods 31
avoid an explosive release of volatiles. After decarbonisation, the melted samples were immediately
quenched by dipping into distilled water in 30 seconds. After that the samples were dried in oven at
150oC for 5 hours. Those glasses were ground up and melted again at 1600oC in 3.5-6 hours as
illustrated in Figure 2.1.
Table 2.3. Melting procedure of the dry glasses used as starting material
Decarbonatisation Melting
Heating Annealing Heating Annealing
Samples
(hrs) (oC) (hrs) (oC) (hrs) (oC) (hrs) (oC)
H1 12 1100 2 1100 2.5 1600 1 1600
H2 9 1200 1 1200 2.5 1600 1.5 1600
H3 10 1000 7 1000 2.5 1600 1.5 1600
H4 12 1100 2 1000 3 1600 0.5 1600
H5 12 1000 2 1000 3 1600 2 1600
H6 12 1000 2 1000 3 1600 3 1600
H82 12 1100 1 1100 2.5 1600 1 1600
H83 12 1100 1 1100 2.5 1600 1 1600
H84 12 1100 1 1100 2.5 1600 1 1600
H85 12 1100 1 1100 2.5 1600 1 1600
H86 12 1100 1 1100 2.5 1600 1 1600
H102 12 1100 1 1100 2.5 1600 1 1600
H103 12 1100 1 1100 2.5 1600 1 1600
H104 12 1100 1 1100 2.5 1600 1 1600
H105 12 1100 1 1100 2.5 1600 1 1600
H106 12 1100 1 1100 2.5 1600 1 1600
The samples obtained after decarbonatisation were not hundred percent glassy. They contained a lot
of tiny crystals. The number of the crystals increased with increasing aluminium. However, after
melting at 1600 ˚C, the samples were hundred percent glassy. About 470 mg of these crystal-free
glasses and 30 mg H2O were welded into gold capsule (35 x 5 x 0.25 mm) to produce water-
saturated starting haplogranite glasses containing about 6 wt% H2O. These syntheses were carried
out at 2kbar and 800˚C in cold-seal vessels with a run duration of 10-12 days. The glass
composition and water content were checked by electron microprobe (EMPA), X-ray powder
diffractometry (XRD) and near infrared spectrometry (FTIR) (see detail below). The compositions
of hydrous glasses are listed in Table 2.4.

REE phosphate solubility: Experimental procedures and methods 32
Table 2.4. Average electron microprobe analyses of water saturated starting materials at 800oC/ 2 kbar in cold seal system. Run duration is 10-12 days. Values given in weight % and relative error limits were estimated from the standard deviation (1δ) based on replicate analyses (N). Water content was measured by FTIR.
Na2O K2O Al2O3 SiO2 P2O5 F Total H2O N Sample
% % % % % % % %
ASI*
G1 5.22±0.13 5.35±0.20 10.38±0.04 72.23±0.27 0.13±0.02 - 93.37±0.26 5.86 5 0.73±0.02
G2 5.58±0.20 4.20±0.02 10.75±0.08 74.00±0.91 0.12±0.04 - 94.64±0.91 5.66 5 0.79±0.02
G3 4.99±0.15 4.19±0.18 11.56±0.05 73.50±0.49 0.13±0.04 - 94.39±0.61 5.96 6 0.91±0.03
G4 4.65±0.08 3.87±0.11 12.13±0.06 74.11±0.42 0.10±0.01 - 94.96±0.22 5.31 6 1.03±0.02
G5 4.54±0.17 4.11±0.11 13.04±0.16 74.39±0.18 0.12±0.01 - 96.24±0.35 6.25 6 1.10±0.02
G6 3.90±0.14 3.81±0.14 12.74±0.16 74.24±0.13 0.11±0.01 - 94.47±0.34 5.42 7 1.22±0.02
G11 5.38±0.04 4.91±0.01 10.36±0.13 73.11±0.93 0.11±0.03 - 93.88±0.99 5.56 6 0.74±0.01
G12 5.17±0.04 4.49±0.03 10.78±0.19 74.56±0.93 0.10±0.01 - 95.10±0.86 5.81 6 0.81±0.01
G13 4.58±0.08 4.48±0.03 11.44±0.15 72.26±0.91 0.11±0.02 - 92.88±1.04 5.74 7 0.93±0.01
G14 4.22±0.09 4.47±0.02 11.91±0.11 75.13±0.33 0.10±0.02 - 95.85±0.35 5.75 7 1.02±0.02
G15 3.84±0.12 3.99±0.03 11.93±0.07 74.14±0.46 0.12±0.03 - 94.03±0.43 5.96 6 1.13±0.02
G16 3.72±0.21 3.70±0.09 12.53±0.20 75.33±0.57 0.09±0.01 - 95.39±0.73 5.58 7 1.25±0.05
AF2 4.19±0.14 4.09±0.08 12.18±0.30 70.68±0.36 0.10±0.02 1.79±0.28 93.04±0.37 5.72 20 1.08±0.04
AF4 4.25±0.14 4.23±0.05 12.16±0.30 68.59±0.40 0.10±0.02 3.88±0.12 93.23±0.91 5.64 11 1.06±0.02
G81 5.09± 0.10 4.22± 0.12 11.00± 0.13 73.39± 0.14 0.12± 0.02 - 93.83± 0.24 5.92 5 0.86± 0.02
G82 5.27± 0.44 4.58± 0.12 10.88± 0.10 73.30± 0.81 0.31± 0.02 - 94.33± 0.43 5.76 13 0.80± 0.03
G83 5.14± 0.39 4.34± 0.12 10.58± 0.15 73.69± 0.59 0.49± 0.04 - 94.24± 0.89 5.81 13 0.81± 0.02
G84 5.13± 0.40 4.44± 0.04 10.54± 0.08 73.63± 0.42 0.73± 0.03 - 94.47± 0.64 6.15 23 0.80± 0.03
G85 5.12± 0.57 4.25± 0.17 10.42± 0.15 73.92± 0.16 0.97± 0.04 - 94.68± 0.47 5.73 12 0.81± 0.04
G86 5.24± 0.48 4.11± 0.18 10.13± 0.07 73.58± 0.23 1.45± 0.05 - 94.54± 0.50 5.98 12 0.78± 0.04
G101 4.14± 0.05 3.52± 0.05 11.12± 0.08 74.32± 0.68 0.11± 0.01 - 94.49± 0.84 5.87 6 1.05± 0.04
G102 4.47± 0.39 4.03± 0.07 12.09± 0.14 74.35± 0.67 0.25± 0.02 - 95.21± 0.50 6.29 13 1.04± 0.03
G103 4.47± 0.53 3.96± 0.04 11.80± 0.09 72.66± 0.38 0.49± 0.03 - 93.39± 0.89 5.77 13 1.02± 0.02
G104 4.80± 0.08 4.13± 0.03 12.07± 0.15 73.51± 0.58 0.70± 0.02 - 95.21± 0.51 5.64 5 0.98± 0.03
G105 4.55± 0.37 3.87± 0.05 11.76± 0.21 73.40± 0.54 0.97± 0.03 - 94.55± 0.62 6.08 13 1.01± 0.04
G106 4.43± 0.26 3.82± 0.18 11.20± 0.19 73.54± 0.54 1.47± 0.09 - 94.40± 0.51 5.83 13 0.99± 0.04
*ASI = Al/(Na+K) in mol
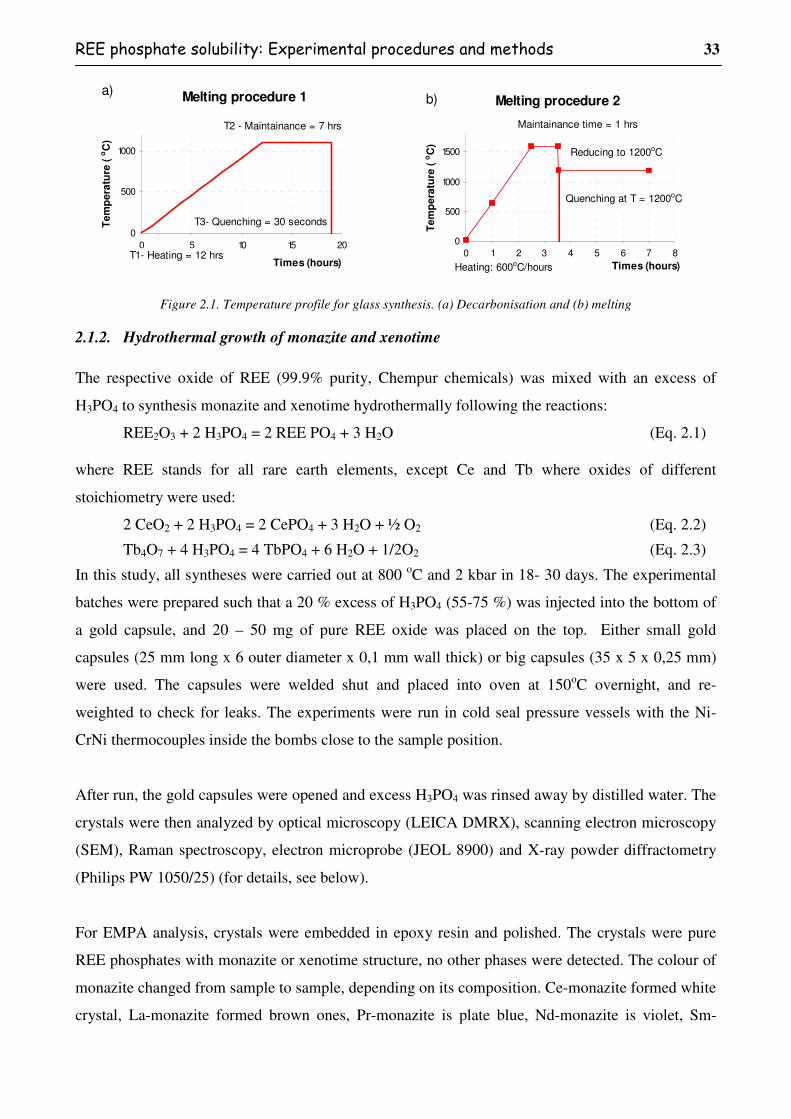
REE phosphate solubility: Experimental procedures and methods 33
Melting procedure 1
0
500
1000
0 5 10 15 20
Times (hours)
Tem
pera
ture
(oC
)
T3- Quenching = 30 seconds
T2 - Maintainance = 7 hrs
T1- Heating = 12 hrs
a)
Melting procedure 2
0
500
1000
1500
0 1 2 3 4 5 6 7 8
Times (hours)
Tem
pera
ture
(oC
)
Maintainance time = 1 hrs
Heating: 600oC/hours
Reducing to 1200oC
Quenching at T = 1200oC
b)
Figure 2.1. Temperature profile for glass synthesis. (a) Decarbonisation and (b) melting
2.1.2. Hydrothermal growth of monazite and xenotime
The respective oxide of REE (99.9% purity, Chempur chemicals) was mixed with an excess of
H3PO4 to synthesis monazite and xenotime hydrothermally following the reactions:
REE2O3 + 2 H3PO4 = 2 REE PO4 + 3 H2O (Eq. 2.1) where REE stands for all rare earth elements, except Ce and Tb where oxides of different
stoichiometry were used:
2 CeO2 + 2 H3PO4 = 2 CePO4 + 3 H2O + ½ O2 (Eq. 2.2)
Tb4O7 + 4 H3PO4 = 4 TbPO4 + 6 H2O + 1/2O2 (Eq. 2.3)
In this study, all syntheses were carried out at 800 oC and 2 kbar in 18- 30 days. The experimental
batches were prepared such that a 20 % excess of H3PO4 (55-75 %) was injected into the bottom of
a gold capsule, and 20 – 50 mg of pure REE oxide was placed on the top. Either small gold
capsules (25 mm long x 6 outer diameter x 0,1 mm wall thick) or big capsules (35 x 5 x 0,25 mm)
were used. The capsules were welded shut and placed into oven at 150oC overnight, and re-
weighted to check for leaks. The experiments were run in cold seal pressure vessels with the Ni-
CrNi thermocouples inside the bombs close to the sample position.
After run, the gold capsules were opened and excess H3PO4 was rinsed away by distilled water. The
crystals were then analyzed by optical microscopy (LEICA DMRX), scanning electron microscopy
(SEM), Raman spectroscopy, electron microprobe (JEOL 8900) and X-ray powder diffractometry
(Philips PW 1050/25) (for details, see below).
For EMPA analysis, crystals were embedded in epoxy resin and polished. The crystals were pure
REE phosphates with monazite or xenotime structure, no other phases were detected. The colour of
monazite changed from sample to sample, depending on its composition. Ce-monazite formed white
crystal, La-monazite formed brown ones, Pr-monazite is plate blue, Nd-monazite is violet, Sm-

REE phosphate solubility: Experimental procedures and methods 34
monazite is light yellow, Eu-, Gd-, Tb- and Dy-rare earth phosphate crystals are milky white, and
Er-xenotime has pink colour.
Raman spectra showed that the structure of starting material rare earth phosphate was different for
the light and heavy REE (Figure 2.2). The X-ray diffraction confirmed that the rare earth phosphate
crystals were either pure monazite or xenotime, except for gadolinium phosphate. No other solid
phases were present (Figure 2.3) and (Figure 2.4). Since GdPO4 formed both structures, a Rietveld
refinement was carried out for sample GdPO4 using TOPAS v.3 software (www.bruker-axs.com).
Basic principles about this method can be found in detail somewhere else (Rietveld, 1969).
-5000
0
5000
10000
15000
20000
25000
30000
35000
40000
45000
50000
55000
60000
65000
70000
75000
150 350 550 750 950 1150 1350 1550
Wavenumber (cm-1)
Inte
ns
ity
(a
.u.)
LaPO4
CePO4
PrPO4
NdPO4
SmPO4
EuPO4
GdPO4
TbPO4
DyPO4
HoPO4
ErPO4
TmPO4
YbPO4
LuPO4
1008
1067
963 1052
Figure 2.2. Raman data showing changes in the crystal structure of the synthetic REE phosphates. Spectra were obtained using Labram2 Raman spectrometer equipped with Olympus microscope.
Structure data of pure single monazite (GdPO4) and of xenotime (TbPO4) (Ni et al., 1995) were used
as standard for the refinement. Xenotime (TbPO4) was used instead of xenotime (GdPO4) because
there was no available data for pure xenotime (GdPO4) in the literature and because the ion radius of
Tb is close to Gd. In addition, the amount of sample is very small, leading to the low quality of the X-
ray diffraction data. Thus, the result is only approximately estimated with a very low refinement Rwp
(sometimes also referred as wR2 = weighted R-value) of less than 0.3, in most of the trial refinement
performances. The refinement showed that, the GdPO4 formed a mix of separate crystals with about
80-90 wt% monazite and 10-20 wt% xenotime, respectively (Figure 2.5).

REE phosphate solubility: Experimental procedures and methods 35
Figure 2.3. Typical samples of monazite (LaPO4) and xenotime (HoPO4) X-ray diffraction patterns
XRD of pure individual REE phosphate crystals
-30
470
970
1470
1970
2470
2970
0 10 20 30 40 50 60
2 Theta (Degree)
Inte
ns
ity (
Aib
itra
ry U
nit
s)
LuPO4
YbPO4
TmPO4
ErPO4
HoPO4
DyPO4
TbPO4
GdPO4
EuPO4
SmPO4
CePO4
PrPO4
NdPO4
LaPO4X
eno
tim
e
Mon
azite
Mix
Figure 2.4. XRD data for different crystal structures of the synthetic REE phosphates
Figure 2.5. Rietveld refinement of the GdPO4 sample using XRD data yielded a mix of separate crystals with 80-90 wt% monazite and 10-20 wt% xenotime, respectively (performed by V. Presser).

REE phosphate solubility: Experimental procedures and methods 36
The monazite/xenotime crystals produced in this study were generally large (Figure 2.6), the
average size was 30-50 µm, the biggest one was up to 120 µm in size, and the smallest one was
around 10-20 µm in length for the runs of less than 20 days. In the runs that lasted more than 20
days, some big crystals were formed, with size up to 167 µm in sample M2.
Figure 2.6. Monazite (CePO4) and xenotime (HoPO4) imaged by SEM
The crystals produced in this study were larger than those reported by Montel (1986) and Andrehs
and Heinrich (1998) who observed crystal sizes smaller than 1 µm and from 1 to 20 µm,
respectively. In some cases the samples in this study contained some very big crystals and the
remaining crystals were small, ranging from some µm to 30-40 µm. Samples without big crystals
were usually more uniform in grain size (40-50 µm), The larger crystal size obtained in our study
may be related to the higher fluid/solid ratio as compared to previous work. Monazite always
formed bigger crystal than xenotime at the same growing condition.
2.1.3. Preparation of sample capsules for monazite and xenotime solubility experiments
The solubility experiments were all prepared by carefully mixing 90 wt% of water saturated
haplogranite glass powder and 10 wt% of pure single rare earth phosphate crystals. This mixture
was then welded shut in small gold capsules of 25 mm length and 2,5 mm diameter with 0,25 mm
wall thickness. Most of them were dissolution experiments in a slow-quench cold seal system (CSS)
with 1-2 months run duration (see below). One series of dissolution experiments was run at high
temperature conditions (1100oC) using platinum (Pt) capsules (15 mm long, 5 mm outer diameter
and 0.2 mm wall thickness) in internal heated pressure vessels (IHPV) (see below). The run
products of this high temperature dissolution experiment were then used as starting material for
reverse runs in cold seal bombs at 800oC and 2 kbar for 2 months. Capsules were checked for leaks
before use.

REE phosphate solubility: Experimental procedures and methods 37
2.2. High pressure apparatus and technique
2.2.1. Cold seal systems (CSS)
Cold seal systems are among of the most popular techniques for high-pressure and temperature
experimentation. For details, see Huebner (1971), Edgar (1973), and Kerrick (1987). Cold seal
systems in their modern version were first designed by Tuttle (1949). The main component of the
cold seal system in Tuebingen is a cylindrical pressure vessels (“bomb”) and a closure assembly
shown in Figure 2.7. The cold seal pressure vessels of 39 mm outer diameter, 7 mm inner diameter,
and 235 mm length are made from “superalloys”, which can be exposed at elevated temperatures
and pressure because of their ability to retain most of their strength and resistance to oxidation even
after long exposure times at high pressure and temperature.
Superalloys are based on Group VIIIB elements and usually consist of various combinations of Fe,
Ni, Co, and Cr, as well as lesser amounts of W, Mo, Ta, Nb, Ti, and Al. The three most popular
classes of superalloys are nickel-, iron- and cobalt-based alloys (these designation reflect the
dominant chemical elements of the alloy), in which nickel-based classes have been used a lot and
are particularly well suited for many applications because of their stability and corrosion resistance
at the highest temperatures. For cold seal system, a variety of alloys may be used to examine a
wide-range of processes at the pressure and temperature of the Earth’s crust. Stellite 25, a cobalt-
based and Rene 41, a nickel-based alloy are commonly used for cold seal vessels. However, these
alloys have showed some limitations when they were used at high pressure and temperature in long
runs. According to our experiences, the Rene 41 vessels were expanded about 0.02-0.1 mm after 1-
2 months run at 800oC and 2 kbar. Thus we have tried to use new superalloys of NIMONIC 105 and
IN 713LC. Those materials showed good stability after long run durations at 800oC and 2 kbar.
Compositions of those alloys are given in Table 2.5.
Experiments were started by loading a sealed capsule into the bottom of a cold seal bomb, and
pressuring the autoclave with H2O. The capsule was close to the internal thermocouple. A nickel
filler rod was used to reduce thermal gradients (Figure 2.7). Oxygen fugacity of the experiments
was not strictly controlled, but it was believed to be close to that of Ni-NiO equilibrium, buffered
by the oxidation reaction of the pressure medium (water) with the Ni-rich alloy of the pressure
vessels and the nickel filler rod. All experiments were performed at condition of 800oC and 2 kbar.
The dissolution experiments lasted 1-2 months and reverse crystallization experiments were
performed in 2 months. Pressure inside the vessel was measured with strain-gauges calibrated
against a Heise gauge with the accuracy ± 0.03 kbar.

REE phosphate solubility: Experimental procedures and methods 38
a)
b)
Figure 2.7. (a) Schematic overview of a cold seal system. (b) Cross section of a cold seal vessel (bomb): 1- Socket for internal thermocouple; 2- Thermocouple mount; 3- Screw; 4- Closure cone; 5- small retainer ring; 6- Pressured tubing; 7- Compression seal; 8- Metal adaptor; 9- Closure bolt; 10- Closure nut; 11-Retainer collar; 12-Double sealing cone; 13- Pressure vessel (outer - ∅ 39 mm); 14- Filler rod (nickel); 15- Type-K internal thermocouple; 16- Sample chamber (∅ 7 mm); 17- Capsule; 18 – External thermocouple well.

REE phosphate solubility: Experimental procedures and methods 39
Table 2.5. Material of the vessels
Elements NIM 105 IN 713LC Rene 41 Aluminium 4.5 – 4.9 6,00 1.40-1.80 Boron 0.003 - 0.01 0.007 Carbon 0.12 max 0,05 Chromium 14-15.7 12,00 18.00-20.00 Cobalt 18-22 10.00-12.00 Copper 0.2max Iron 1 max 5.00 max Manganese 1max Molybdenum 4.5-5.5 4,50 9.00-10.50 Niobium 2,00 Nickel Balance 74,75 Remainder Silicon 1max Sulphur 0.01max Titanium 0.9-1.5 0,70 3.00-3.30 Zirconium 0.15max Plus other minor
impurities Plus other minor
impurities
Pressures were estimated to be accurate to ± 0.1 kbar for all runs. After loading the bomb, the vessel
was first charged with H2O up to the initial pressure of about 1 kbar, then it was isolated from the
H2O reservoir and water pump. The pressure inside the vessel was then increased to the final
pressure of 2 kbar by using the pressure intensifier and oil pump. The vessel was then completely
isolated from the pressure pumping system. The loaded bombs were left over night at 2 kbar to
check for leaks. They were then isobarically heated in 2 hours to reach the final run condition at
800oC. Temperatures were controlled by a K-type NiCr-Ni thermocouple placed either inside close
to the capsules or outside of the vessel in an external thermocouple well close to the hot spot zone.
The vessels were calibrated periodically and the temperature was known within of ± 15oC.
On completion, the experiments were quenched by removing the vessel from the furnace and
blowing compressed air around the vessels. Right after removing the vessel from the furnace, the
pressure inside the bomb was first isothermally increased up to 2.5 kbars to avoid bubble
nucleation. During the isobaric quenching in air, the temperature inside the vessel dropped to ∼
200oC after 4-5 minutes, then decreased to room condition in 15-20 minutes.
After quenching, the capsules were taken out the vessel, cleaned, dried, weighed and then put into
oven at 150oC over night to check for leaks. Most capsules gained a small amount of weight during
the run, probably due to alloying of the gold capsule with nickel.
REE phosphate solubility: Experimental procedures and methods 40
2.2.2. Internally heated pressure vessels (IHPV)
High temperature dissolution experiments were performed at the Institute for Mineralogy, Hannover
University, Germany by using an internally-heated pressure vessels. This system is described in
detail by Berndt et al (2002). The general features of the technique are also presented somewhere
else (Holloway, 1971; Lofgren, 1987). This series of experiments was performed at pressures of 2
kbar and 1100oC in 7 days at quartz-fayalite-magnetite (QFM) buffer conditions controlled by a
hydrogen gas buffer (fH2). The samples were fixed to a Pt-wire and were loaded into the sample
chamber in hot spot. After loading the IHPV and flushing with pure hydrogen, the vessel was first
charged with hydrogen up to the initial PH2, and then isolated from the H2-reservoir. After that the
vessel was loaded with Ar up to 1 kbar. The vessel was then completely isolated from the Ar
pressure line. The H2-line was evacuated before raising the temperature to 1100oC. The heating rate
was about 30oC/min and controlled by using Eurotherm 906 EPC controller. The insulation of the
heater consisted of steel foil, mullite, and quartz wool. The errors of temperature were less than 5oC
along the sample capsule; temperature was controlled by five S-type thermocouples. Two of them,
connected to the Eurotherm unit, were used to control the power supply of the two furnace
windings. Three additional thermocouples were inserted into the ceramic tube surrounding the
samples and were positioned about 2 mm from the capsules to determine the exact temperature of
the samples hanging inside the ceramic tube.
At the end of the experiment, the quench Pt-wire in the hot spot of the furnace was fused
electrically and the samples dropped down to the copper block unit of the cold quench area that was
in direct contact to the water cooled vessel body. The temperature of the cold-quench area was 20–
25oC continuously measured by a K-type thermocouple placed on the bottom of the copper block
unit. The quenching rate was about 150oC/s. Temperature decreased from 1100oC to 500oC within 1
minute and then decreased slowly to room temperature in 15 minutes. All temperatures and
pressures of the IHPV were logged automatically by a LabView computer monitoring system,
National Instruments, Austin, Texas and showed no oscillations or other transient failures during
the run and quenching.
2.3. Investigation of run products
2.3.1. Electron Microprobe Analyses (EMPA)
Quantitative electron microprobe analyses (EMPA) were performed at Tübingen University on a
JEOL 8900 equipped with five wavelength dispersive spectrometers. Table 2.6 shows the typical
measuring conditions for the run products. Analyses were all performed at 20 kV accelerating
voltage and 50 nA beam current with a defocused beam of 20 µm diameter. A large-diameter spot
was used to minimize volatilization (especially of Na). Test measurements showed that the Na

REE phosphate solubility: Experimental procedures and methods 41
signal was almost stable within 4 seconds. This result was slightly different from Wolf and London
(1995), who suggested that no Na loss occurs only for total analysis times up to 2 seconds.
However, the shorter time measurement will produce larger errors, thus, 4 seconds for Na
measurement was considered to be a reasonable solution. The following synthetic and natural
standards were used for the calibration (Table 2.6): Albite (Na), synthetic blank glass in REE block
(Si), sanadine (K), fluorite (F), apatite (P) and individual rare earth synthesis glass (REE and Al).
Counting time for Na was set at 4 and 2 seconds for peak and background, respectively. For F,
counting time was 60 and 15 seconds for peak and background. For K and P, it was set at 30
seconds for peak and 15 seconds for background. Analytical time for Al and Si were 16 and 8
seconds for peak and background respectively. The REE were analyzed 120 seconds at the peak and
60 seconds for background on each side of the peak. There was a minor overlap of the P peak with
some peaks from HREE and of the F peak with some peaks from P, K and/or REE. For these
particular cases, a systematic correction for P and F was applied during the calibration. The
calibration was tested routinely using synthetic REE bearing glasses prepared by Drake and Weill
(1972). We also used our individual pure REEPO4 crystals to test the calibration. About 25 random
analyses for each experiment were obtained for calculating the average content of REE in the
sample and at least 3 profile sections were analyzed to fit diffusion profiles. The measuring
positions were chosen at the center of areas consisting of pure glass (Figure 2.8 – MH302). The
profile analyses were performed in the “cleanest” areas, where the concentration of REE was
thought to be controlled by the two monazite/xenotime crystals at both ends of the profile. During
measurement, however, the profiles were always slightly shifted away from the desired line (Figure
2.8 – MH412). Analyses were obtained up to a distance of > 10 µm from monazite/xenotime
crystals. Fluorescence by the monazite/xenotime crystals will be a problem if the analytical point
was < 10 µm from the monazite/xenotime crystals.
Figure 2.8. Measuring point (MH302) and measuring profile (MH412) of run product at 800oC and 2 kbar. Step interval away from the crystal glass interface is 20.05 µm

REE phosphate solubility: Experimental procedures and methods 42
Table 2.6. Typical EMPA measurement conditions at 20 kV accelerating voltage and 50 nA beam current with a defocused beam of 20 µm diameter
Spectrum
position Measured time (s) Detection
limits
Elements
X-ray
line
Channel
Crystal
Standard
(mm) Peak Background (ppm)
Na Kα 2 TAP Albite 129.714 4 2 102
K Kα 3 PETJ Sanidine 119.731 30 15 46
Al Kα 2 TAP REE_glass 90.889 16 8 71
Si Kα 2 TAP Blank_glass 77.664 16 8 103
F Kα 1 LDE1 Fluorite 86.222 60 15 89
P Kα 3 PETJ Apatite 197.229 30 15 72
La Lα 4 LIFH La glass 185.326 120 60 79
Ce Lα 4 LIFH Ce glass 178.098 120 60 74
Pr Lα 4 LIFH Pr glass 171.267 120 60 62
Nd Lα 4 LIFH Nd glass 164.961 120 60 57
Sm Lα 4 LIFH Sm glass 153.132 120 60 72
Eu Lα 4 LIFH Eu glass 147.546 120 60 68
Gd Lα 4 LIFH Gd glass 142.391 120 60 77
Tb Lα 4 LIFH Tb glass 137.647 120 60 71
Dy Lα 4 LIFH Dy glass 132.815 120 60 82
Ho Lα 4 LIFH Ho glass 128.394 120 60 65
Er Lα 4 LIFH Er glass 124.368 120 60 73
Tm Lα 4 LIFH Tm glass 120.368 120 60 76
Yb Lα 4 LIFH Yb glass 116.559 120 60 88
Lu Lα 4 LIFH Lu glass 112.801 120 60 69
2.3.2. Powder X-ray diffraction (XRD)
In order to confirm the phases present in the samples, representative samples were analyzed by X-ray
diffraction. The X-ray investigation of the powder samples was performed on a Philips PW 1050/25
diffractometer at Tuebingen University at room temperature using a curved germanium
monochromator in Debye-Scherrer geometry. The samples were first crushed to 1-30 µm particle
size in mortar/pestle, and then pressed on a silicon sample holder. Measurement was set up at
condition of 40kV / 20mA, Cu Kα, 0,05° 2θ-scan with step size 0.05° and scan rate 0.05°/4 sec.
2.3.3. Near Infrared (FTIR) measurement of hydrous glasses
Water contents of the starting water-saturated haplogranite glasses were measured in Tübingen by a
Bruker IFS 125 HR Fourier transform infrared spectrometer (FTIR), using a tungsten light source
(W lamp), Si-coated CaF2 beam splitter and a high-sensitivity, narrow-band mercury cadmium
tellurium (MCT) detector. The spectrometer is coupled with a Bruker IR microscope containing an

REE phosphate solubility: Experimental procedures and methods 43
all-reflecting Cassegranian optics that allows measurements of small areas with apertures down to
10 µm. Each spectrum with a resolution 4 cm-1 was accumulated from hundreds of scans and was
obtained in the wavenumber range from 1000 to 10000 cm-1 (Figure 2.9). During the measurement, the
optics of the spectrometer was evacuated and the microscope was purged with a stream of H2O and
CO2-free purified air.
-0.05
0
0.05
0.1
0.15
0.2
0.25
0.3
4000 4500 5000 5500 6000
Wavenumber [cm-1]
Ab
so
rpb
an
ce
H-O-H
O-H
Figure 2.9. Near-infrared absorption spectra obtained from a haplogranitic glass containing 6 wt% water. Sample thickness: 224 µm. Dashed line is linear baseline
The background correction of absorbance spectra was carried out using a spline fit of the baseline
defined by points outside the OH stretching region. For quantitative infrared absorbance
measurements, a flat (planar on a micron scale) doubly polished sections of the volatile-containing
glass was prepared ranging in thickness from several tens to several thousands µm.
Sample chips were mounted in “crystal-bond”, and glued to microscope slides, then they were
ground and polished with alumina and diamond paste or diamond-impregnated paper (water and
cutting oil were used as lubricants). The last polish was applied with 1 µm diamond paste. After
polishing, samples were removed from the microscope slides and cleaned by acetone. Because the
volatile content was measured in the bulk sample, traces of adsorbed atmospheric water or CO2 did
not affect the results. However, special care had to be used for samples with high alkali content,
which react substantially with atmospheric water and CO2.

REE phosphate solubility: Experimental procedures and methods 44
After polishing, the sample thickness was carefully measured with a micrometer, or by visual
determination under a calibrated microscope. The error of the micrometer measurements was about
2-3 µm. For some samples, the thickness was determined by focusing with a microscope on the
upper and lower surface of the doubly-polished slab. The thickness was then calculated from the
scale of the vertical fine-adjustment of the microscope, with an uncertainty of 3 – 6 µm.
To avoid the high error of the microscopic technique and the substantial error for the thinnest
samples when using the micrometer, both methods were combined. Firstly, the maximum thickness
of the sample was measured by micrometer and secondly, at each spot used for infrared
measurements, the thickness of the sample was measured with the microscope, and then calibrated
against the maximum thickness of the sample.
The density of the hydrous glasses was calculated using equation (Eq.2.4) given by Sowerby and
Keppler (1999) for haplogranite Qz28Ab34Or38 glasses which refers to a composition similar to those
relevant for this study .
ρg/l = 2347 – 12.6 (CH2O) (Eq. 2.4)
Where: ρg/l is the density of the sample and CH2O is the water content of the starting material (in
weight %).
The total water concentrations, as well as the concentrations of hydroxyl groups and molecular
water in glass were calculated from the heights of the absorbance bands by the Beer-Lambert law
(Stolper, 1982):
A = ε . C . d (Eq. 2.5)
εd
AC = (Eq. 2.6)
⇒ ρεd
AC
*015.18= (Eq. 2.7)
Where: 18.015 is the molecular weight of H2O C: Water content (g/kg) A: absorbance (unitless) d: Sample thickness (cm) ρ: Sample density (g/L) ε: Molar absorbability (L/mol.cm) For the total water content, the formula can be rewritten as:
REE phosphate solubility: Experimental procedures and methods 45
d
A
d
AC OH
OH
OH
OHTotal
ρρ2
2
015,181015,181** ∈
+∈
= (Eq. 2.8)
Where: CTotal is the total water concentration in the sample (g/kg) AHO, and AH2O are the integrated absorbance for the OH peak at 4500 cm-1 and for the H2O peak at 5200 cm-1, respectively
ε*HO, and ε*H2O are the integrated extinction coefficients (L/mol.cm2)
Values for the integrated extinction coefficients are 1.56 L/mol.cm2 for ε*HO for the band at 4500
cm-1 and 1.79 L/mol.cm2 for ε*H2O for the band at 5200 cm-1 determined for haplogranite
compositions at room temperature (Behrens, 1995; Nowak and Behrens, 1995).
2.3.4. Raman spectroscopy
Raman spectroscopic measurements of samples were mainly performed at Tübingen University on a
LABRAM2 spectrometer equipped with a Peltier cooled CCD detector and Olympus optical
microscope BX-40, adjustable x-y table, and gratings with 600 and 1800 mm-1 grid. The
measurements were carried out mainly using the green line (514 nm) of an external Ar-ion laser and
the red line (632.8 nm) of an internal He-Ne-laser. Most of the run products were quite fluorescent
samples. The blue (488 nm) and green (514 nm) line of the argon laser caused strong fluorescence
in most of the samples containing xenotime and swamped any underlying Raman spectrum to such
an extent that it was no longer detectable. In these cases, a red laser (632.8 nm and power of 0.4
mW) was used to examine the sample, but the fluorescence was still observed for samples
containing HoPO4 and ErPO4 xenotime crystals. These two samples needed to be measured with a
near infrared (NIR) laser (785 nm diode). However, this reduced the scattering intensity, so longer
integration times were required.

REE phosphate solubility: Results 46
3. Results
3.1. The influence of phosphorus on the solubility of monazite in haplogranitic melts
A series of experiments was carried out to study the effect of phosphorus concentration in the melt
on the solubility of monazite. Experiments were carried out at 800oC and 2 kbar starting with pure
GdPO4 monazite and hydrous glasses with ASI= 0.8 or ASI = 1.0, containing variable phosphorus
contents ranging from 0.1 to 1.5 wt.%. In all successful experiments, beside hydrous glass,
monazite was the only phases identified in all run products. Mica appeared accidentally in
experiment 4P75 and was confirmed by Raman and XRD powder diffraction analyses (Figure 3.1).
The mica crystals were very small and less than 1-2 µm in size. The concentration of water in the
final solubility experiments was assumed to be the same, as in the hydrated glasses used as starting
material, ie. about 6 wt.% H2O. Glasses are homogenous as indicated by low standard deviations of
the major element analyses (Table 3.1). Mass balance calculations of the major element melt
composition indicate a small Na-loss, which could be an artifact of the microprobe analysis.
Figure 3.1. Phase identification of mica from sample 4P75 (A) Raman spectrum obtained using a Labram2 spectrometer equipped with Olympus microscope with a red laser at 632.8 nm and (B) XRD result. The compositions of the run products obtained by EMPA are given in Table 3.1. The relative error
limits tabulated with each analytical value are those estimated from the standard deviation (1σ) of
replicated analysis. The experimental data at 800oC, 2 kbar and water saturated conditions showed
that monazite/xenotime solubilities are a function of phosphorous content in the melt. In addition,
there is a contrast between the behaviour of REE in peralkaline and metaluminous melt. The
dependence of solubility on phosphorous is less pronounced as compared to the effects of ASI. At
metaluminous melt composition (ASI = 1), the solubility of monazite decreases continuously from
low phosphorous concentration (P2O5 = 0.1wt.%; Gd = 527ppm) to higher phosphorous content
(P2O5 = 1.5 wt.%; Gd2O3 = 261ppm).

REE phosphate solubility: Results
Table 3.1. Experimental data on the solubility of GdPO4 in haplogranitic melts (ASI = 0.8 and ASI = 1) with variable phosphorus content at 800oC and 2 kbar as derived from average microprobe analyses of quenched glasses.
Run products (wt.%) Kspc Run No.
Run duration
Starting materials a Na2O K2O Al2O3 SiO2 P2O5 Gd2O3 Total ASI
n Phasesb (10-5 mol2/kg2)
2P10 30 G81 + GdPO4 5.10±0.09 4.13±0.05 10.74±0.12 73.42±0.38 0.116±0.021 0.158±0.006 93.68±0.30 0.84±0.016 24 M 14.22±2.63 2P25 31 G82 + GdPO4 6.00±0.10 4.39±0.03 10.77±0.09 71.90±0.96 0.307±0.015 0.102±0.008 93.47±1.00 0.74±0.011 19 M 24.40±1.98 2P50 31 G83 + GdPO4 5.67±0.17 4.28±0.03 10.69±0.08 73.42±0.83 0.530±0.035 0.077±0.010 94.67±0.91 0.77±0.017 20 M 31.87±5.18 2P75 31 G84 + GdPO4 6.11±0.11 4.29±0.03 10.64±0.10 73.38±1.09 0.791±0.047 0.057±0.013 95.26±1.21 0.73±0.010 30 M 35.14±8.20 2P100 31 G85 + GdPO4 6.01±0.10 4.19±0.03 10.57±0.05 74.28±0.51 1.006±0.042 0.051±0.009 96.11±0.50 0.74±0.010 25 M 39.68±6.75 2P150 31 G86 + GdPO4 5.99±0.13 4.10±0.03 10.28±0.06 73.15±0.82 1.504±0.049 0.050±0.010 95.08±0.85 0.72±0.012 41 M 58.23±11.2 4P10 30 G101 + GdPO4 4.09±0.12 3.51±0.06 12.12±0.19 73.78±0.99 0.115±0.013 0.056±0.014 93.80±1.19 1.16±0.022 25 M 5.44±1.13 4P25 31 G102 + GdPO4 5.07±0.30 3.92±0.15 12.21±0.11 73.26±1.07 0.250±0.035 0.049±0.010 94.78±1.15 0.98±0.065 25 M 9.71±1.59 4P50 31 G103 + GdPO4 5.01±0.16 3.90±0.04 11.97±0.09 73.54±0.57 0.499±0.030 0.042±0.013 94.96±0.63 0.97±0.024 30 M 15.99±5.76 4P75 30 G104 + GdPO4 5.03±0.18 3.90±0.05 11.92±0.09 74.41±0.59 0.751±0.046 0.036±0.008 94.85±0.70 0.96±0.020 6 M, Mi 20.67±1.68 4P100 31 G105 + GdPO4 5.15±0.15 3.77±0.05 11.77±0.09 73.84±0.67 1.002±0.043 0.035±0.009 95.56±0.76 0.94±0.022 31 M 26.88±6.52 4P150 31 G106 + GdPO4 4.92±0.14 3.68±0.04 11.23±0.09 73.48±0.75 1.516±0.057 0.029±0.009 94.86±0.82 0.94±0.021 21 M 35.39±9.84 a Starting materials: 90 wt.% water-saturated haplogranite, i.e. contained about 6 wt.% H2O (Glasses G81-G106) + 10 wt.% pure single rare earth phosphate crystals (GdPO4). b Phases other than glass present in melt: M – monazite and Mi - mica c Solubility products ( Ksp) for reaction meltmeltmelt POREEREEPO 44 +⇔
Table 3.2. Calculated speciation of GdPO4 (molecular GdPO4 or Gd3+) dissolved in haplogranitic melt at 800oC and 2 kbar derived from average EMPA data
Run No. Aver. P2O5 Total Gd solubility in melt Solubility products (Ksp)* Gd solubility (10-3 mol/kg) in: Mol fraction (MF) between (10-2 mol/kg) (ppm) (10-5mol2/kg2) Ion (3+) Molecular Gd (3+) Gd (molecular) 2P10 0.81±0.15 1374±50 14.22±2.63 6.21 2.52 0.71 0.29 2P25 2.16±0.10 889±69 24.40±1.98 3.13 2.52 0.55 0.45 2P50 3.74±0.25 668±86 31.87±5.18 1.72 2.52 0.41 0.59 2P75 5.57±0.33 496±99 35.14±8.20 0.63 2.52 0.20 0.80 2P100 7.09±0.29 440±74 39.68±6.75 0.28 2.52 0.10 0.90 2P150 10.60±0.34 432±84 58.23±11.2 0.22 2.52 0.08 0.92 4P10 0.80±0.09 527±92 5.44±1.13 1.68 1.67 0.50 0.50 4P25 1.76±0.25 432±73 9.71±1.59 1.08 1.67 0.39 0.61 4P50 3.52±0.21 358±128 15.99±5.76 0.61 1.67 0.27 0.73 4P75 5.29±0.21 308±30 20.67±1.68 0.29 1.67 0.15 0.85 4P100 7.06±0.30 300±74 26.88±6.52 0.24 1.67 0.12 0.88 4P150 10.68±0.40 261±73 35.39±9.84 0.05 1.67 0.03 0.97
* Solubility product ( Ksp) for reaction meltmeltmelt POREEREEPO 44 +⇔
47

REE phosphate solubility: Results 48
This variation is more clearly seen in the peralkaline composition, where the solubility of monazite
is 2-3 times higher than in metaluminous melt at the same phosphorous concentration and decreases
significantly from 1374 ppm Gd at P2O5 = 0.1 wt.% to 432 ppm Gd at P2O5 = 1.5 wt.%.
The line scans and selected mapping measurements showed that the concentration of REE in the
melt decreased away from the crystal/melt interface in the experiments even after run durations of
30-64 days demonstrating that the attainment of equilibrium is extremely sluggish. However, the
concentration profile of P2O5 in glass was much less pronounced, because the amount of P resulting
from monazite/xenotime dissolution was low in comparison with the P initially added. Ideally, the
best way to demonstrate attainment of equilibrium would be to reverse the experiments (i.e., to also
approach equilibrium from crystallization experiments). We did not attempt to reverse these series
of experiments out of concern that the equilibrium would not be reached due to slow diffusion
kinetics. In order to obtain better estimates of equilibrium solubility, we extrapolated the diffusion
profiles observed around a monazite crystal to the crystal/melt interface. According to Rapp and
Watson (1986), the dissolution of monazite and xenotime in silicate melt follows Fick’s second law
of diffusion (Eq. 3.1):
)4
(,Dt
XerfcCC otx = (Eq. 3.1)
Where Cx,t is the concentration of diffusion at a distance X (cm) from the interface at time t (s), Co
is the concentration at the interface (i.e. the saturation level for the diffusing species), and D is the
diffusivity (cm2/s).
The data can be linearized by inversion through the error function, and the concentration data are
recast as:
)1(
1
4 ,
o
tx
C
CerfcDt
X
−
= (Eq. 3.2)
This model requires that one first estimates the value of Co and then the inverse error function for
each value of (o
tx
C
C ,1− ) is plotted against X. The best-fit line to the data is then determined by the
cubic least square regression method. Co at the intercept closest to zero is the best estimate of the
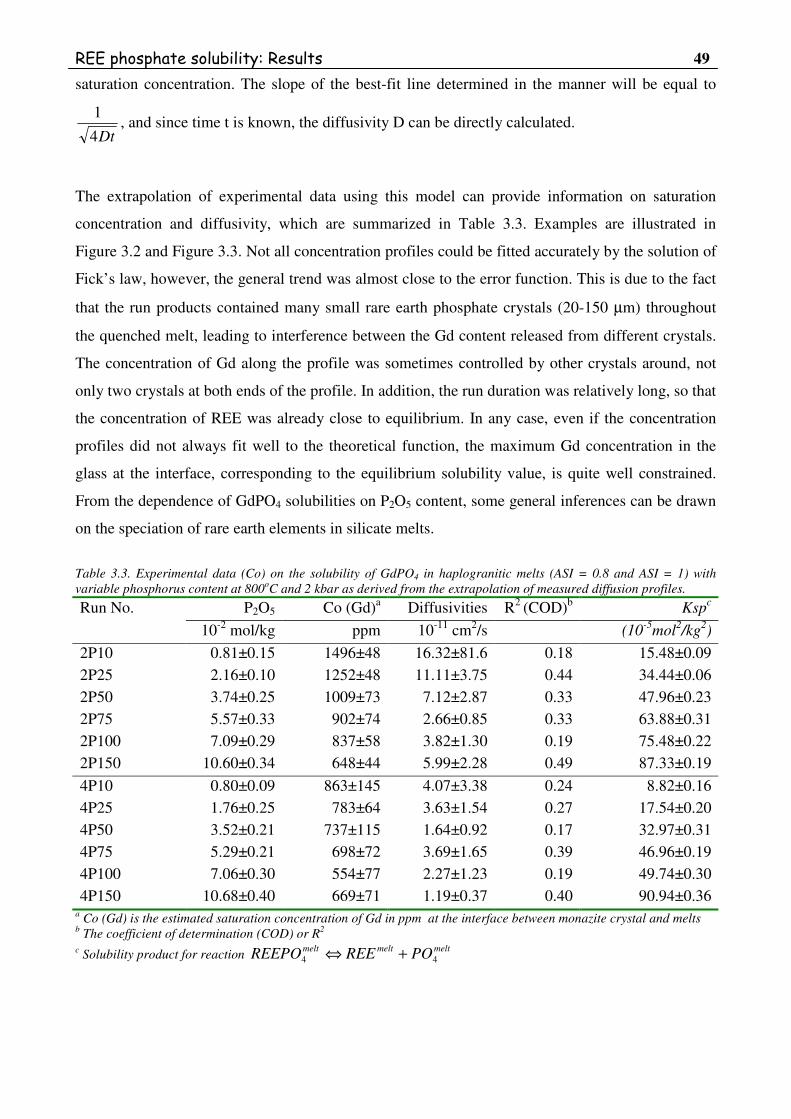
REE phosphate solubility: Results 49
saturation concentration. The slope of the best-fit line determined in the manner will be equal to
Dt4
1, and since time t is known, the diffusivity D can be directly calculated.
The extrapolation of experimental data using this model can provide information on saturation
concentration and diffusivity, which are summarized in Table 3.3. Examples are illustrated in
Figure 3.2 and Figure 3.3. Not all concentration profiles could be fitted accurately by the solution of
Fick’s law, however, the general trend was almost close to the error function. This is due to the fact
that the run products contained many small rare earth phosphate crystals (20-150 µm) throughout
the quenched melt, leading to interference between the Gd content released from different crystals.
The concentration of Gd along the profile was sometimes controlled by other crystals around, not
only two crystals at both ends of the profile. In addition, the run duration was relatively long, so that
the concentration of REE was already close to equilibrium. In any case, even if the concentration
profiles did not always fit well to the theoretical function, the maximum Gd concentration in the
glass at the interface, corresponding to the equilibrium solubility value, is quite well constrained.
From the dependence of GdPO4 solubilities on P2O5 content, some general inferences can be drawn
on the speciation of rare earth elements in silicate melts.
Table 3.3. Experimental data (Co) on the solubility of GdPO4 in haplogranitic melts (ASI = 0.8 and ASI = 1) with variable phosphorus content at 800oC and 2 kbar as derived from the extrapolation of measured diffusion profiles.
P2O5 Co (Gd)a Diffusivities R2 (COD)b Kspc Run No.
10-2 mol/kg ppm 10-11 cm2/s (10-5mol2/kg2)
2P10 0.81±0.15 1496±48 16.32±81.6 0.18 15.48±0.09 2P25 2.16±0.10 1252±48 11.11±3.75 0.44 34.44±0.06 2P50 3.74±0.25 1009±73 7.12±2.87 0.33 47.96±0.23 2P75 5.57±0.33 902±74 2.66±0.85 0.33 63.88±0.31 2P100 7.09±0.29 837±58 3.82±1.30 0.19 75.48±0.22 2P150 10.60±0.34 648±44 5.99±2.28 0.49 87.33±0.19
4P10 0.80±0.09 863±145 4.07±3.38 0.24 8.82±0.16 4P25 1.76±0.25 783±64 3.63±1.54 0.27 17.54±0.20 4P50 3.52±0.21 737±115 1.64±0.92 0.17 32.97±0.31 4P75 5.29±0.21 698±72 3.69±1.65 0.39 46.96±0.19 4P100 7.06±0.30 554±77 2.27±1.23 0.19 49.74±0.30 4P150 10.68±0.40 669±71 1.19±0.37 0.40 90.94±0.36
a Co (Gd) is the estimated saturation concentration of Gd in ppm at the interface between monazite crystal and melts b The coefficient of determination (COD) or R2
c Solubility product for reaction meltmeltmelt POREEREEPO 44 +⇔

REE phosphate solubility: Results 50
Figure 3.2. Gadolinium concentration profile in glass adjacent to a monazite crystal at 800oC and 2 kbar for 30-31 days. The solid curve represents the best-fit line of the diffusion model. The model provides an estimated saturation concentration of REE (Co) in alkaline haplogranite (ASI =0.8)

REE phosphate solubility: Results 51
Figure 3.3. Gadolinium concentration profile in glass adjacent to a monazite crystal at 800oC and 2 kbar for 30-31 days. The solide curve represents the best-fit line of the diffusion model. The model provides an estimated saturation concentration of REE (Co) in metaluminous haplogranite (ASI =1)
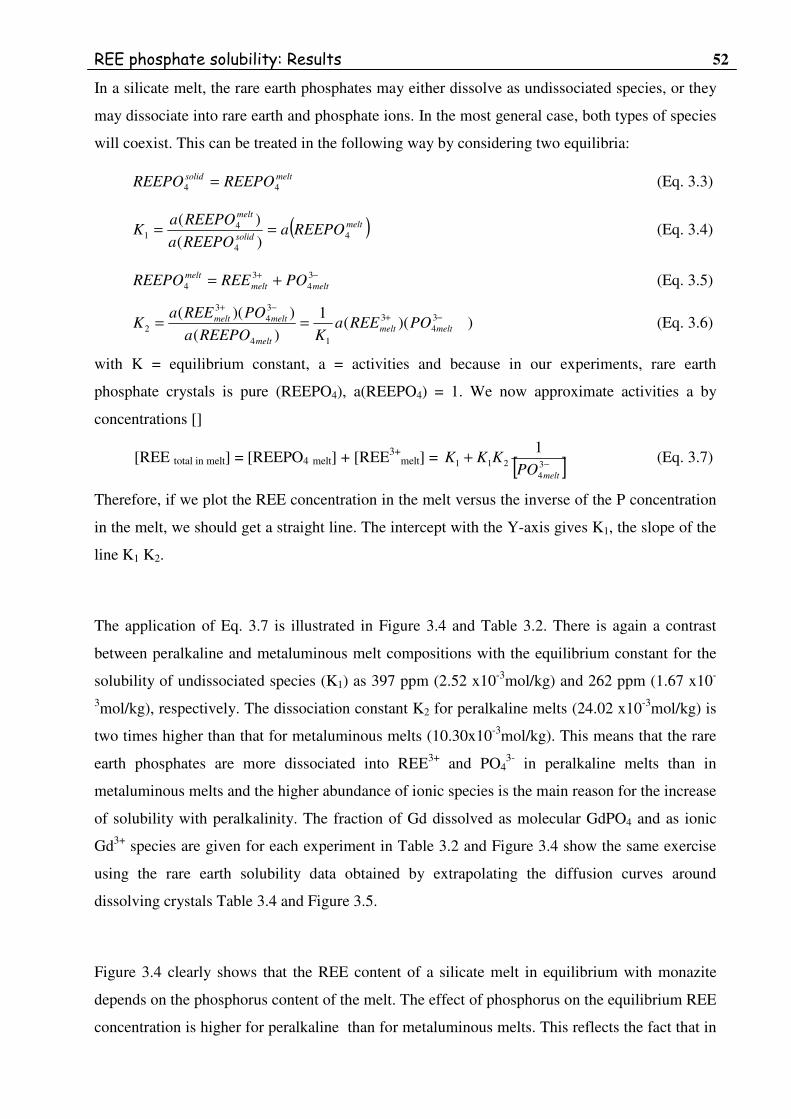
REE phosphate solubility: Results 52
In a silicate melt, the rare earth phosphates may either dissolve as undissociated species, or they
may dissociate into rare earth and phosphate ions. In the most general case, both types of species
will coexist. This can be treated in the following way by considering two equilibria:
meltsolid REEPOREEPO 44 = (Eq. 3.3)
( )meltsolid
melt
REEPOaREEPOa
REEPOaK 4
4
41 )(
)(== (Eq. 3.4)
−+ += 34
34 meltmeltmelt POREEREEPO (Eq. 3.5)
))((1
)())(( 3
43
14
34
3
2−+
−+
== meltmeltmelt
meltmelt POREEaKREEPOa
POREEaK (Eq. 3.6)
with K = equilibrium constant, a = activities and because in our experiments, rare earth
phosphate crystals is pure (REEPO4), a(REEPO4) = 1. We now approximate activities a by
concentrations []
[REE total in melt] = [REEPO4 melt] + [REE3+melt] = [ ]−
+ 34
211
1
meltPOKKK (Eq. 3.7)
Therefore, if we plot the REE concentration in the melt versus the inverse of the P concentration
in the melt, we should get a straight line. The intercept with the Y-axis gives K1, the slope of the
line K1 K2.
The application of Eq. 3.7 is illustrated in Figure 3.4 and Table 3.2. There is again a contrast
between peralkaline and metaluminous melt compositions with the equilibrium constant for the
solubility of undissociated species (K1) as 397 ppm (2.52 x10⁻³mol/kg) and 262 ppm (1.67 x10-
3mol/kg), respectively. The dissociation constant K2 for peralkaline melts (24.02 x10⁻³mol/kg) is
two times higher than that for metaluminous melts (10.30x10⁻³mol/kg). This means that the rare
earth phosphates are more dissociated into REE3+ and PO43- in peralkaline melts than in
metaluminous melts and the higher abundance of ionic species is the main reason for the increase
of solubility with peralkalinity. The fraction of Gd dissolved as molecular GdPO4 and as ionic
Gd3+ species are given for each experiment in Table 3.2 and Figure 3.4 show the same exercise
using the rare earth solubility data obtained by extrapolating the diffusion curves around
dissolving crystals Table 3.4 and Figure 3.5.
Figure 3.4 clearly shows that the REE content of a silicate melt in equilibrium with monazite
depends on the phosphorus content of the melt. The effect of phosphorus on the equilibrium REE
concentration is higher for peralkaline than for metaluminous melts. This reflects the fact that in

REE phosphate solubility: Results 53
metaluminous melts, the degree of dissociation of REEPO4 in the melt into REE3+ and PO43- is
smaller than for peralkaline melts. If the solubility of monazite is therefore given in ppm of REE
or a similar number, such “solubilities” can only be directly compared if the P2O5 contents of the
corresponding melts are identical.
Figure 3.4. Plot of the average phosphate vs. average REE concentration for solubility experiments of monazite in haplogranite. A) peralkaline (ASI = 0.8) and B) metaluminous (ASI = 1) melt composition. The straight line is a fit linear function of y = A + B/x, where x being phosphate concentration, y being a rare earth concentration, and A is the equilibrium constant K1, while B is the product of K1 and K2. Fit function used only data of this study.
Figure 3.5. Plot of the average phosphate vs. estimated saturation REE concentration for solubility experiments of monazite in haplogranites. A) peralkaline (ASI = 0.8) and B) metaluminous (ASI = 1) melt composition. The straight line is a fit linear function of y = A + B/x, where x being phosphate concentration, y being a rare earth concentration, and A is the equilibrium constant K1, while B is the product of K1 and K2
Figure 3.6 illustrates that the solubility product alone does not appropriately describe the
solubility of monazite either. The solubility product is not constant, but it appears to increase
with the P2O5 content of the melt. This is due to the fact that molecular GdPO4 contributes
significantly to the bulk solubilities.

REE phosphate solubility: Results 54
3.2. The effect of the alkali/aluminium ratio on monazite and xenotime solubility in
haplogranitic melts
This series of experiments was performed to study the effect of the alkali/aluminum ratio of the
melt on the solubility of monazite and xenotime. Experiments were carried out at 800oC and 2
kbar.
Table 3.4. Estimated saturation concentration Gd in melt and calculated values of mol fraction of rare earth phosphate solubility in silicate melts, coordination with phosphor at 800oC and 0.2GP.
Gd solubility (10-3 mol/kg) in Mol fraction between Run No. Ion (3+) Molecular Gd (3+) Gd (molecular)
2P10 4.67 4.83 0.49 0.51 2P25 2.07 4.83 0.30 0.70 2P50 0.90 4.83 0.16 0.84 2P75 0.90 4.83 0.16 0.84
2P100 0.49 4.83 0.09 0.91 2P150 4.83 4P10 1.48 4.01 0.27 0.73 4P25 0.98 4.01 0.20 0.80 4P50 0.68 4.01 0.15 0.85 4P75 0.44 4.01 0.10 0.90
4P100 4.01 4P150 0.25 4.01 0.06 0.94
Figure 3.6. The effect of P2O5 on the apparent solubility product of monazite in water saturated haplogranite melt at 2 kbar and 800oC. ASI refers to the molar Al/(Na+K) of the melt. The error bars (1σ) are smaller than the symbol size. starting with pure phosphates of one rare earth element and hydrous glasses with ASI ranging
from 0.7 to 1.2. Most experiments were carried out with a run duration of one month, but one
series of experiments was also carried out with two months run duration. As additional test for
equilibrium, a series of reversed experiments was carried out, where the samples were first run at
1100oC for one week and then re-run at 800oC for two months. In all experiments, the hydrous
glasses contained 0.1 wt. % P2O5 at the beginning of the run. Monazite was the starting materials
for all runs with LREE, while xenotime was used for other runs with HREE. The starting
REE phosphate solubility: Results 55
material for GdPO4 solubility experiments consisted of a mixture of GdPO4 with monazite and
xenotime structure.
The results of this series of experiments are summarized in Table 3.5. The homogeneity of the
glasses can be seen from the low standard deviations. There is no significant difference in major
element composition between starting hydrous glass and the glasses of the final run products.
The water content was not determined directly, but was assumed to be the same as the water
content of the hydrous haplogranite glasses used as starting material (about 6 wt.%). Run
products contained mainly hydrous glass and monazite for runs with LREE or xenotime for runs
with HREE, respectively. In some cases, others phases such as mica (Mi), alkali feldspar (Fk) or
quartz (Q) were present in small quantities. These phases appeared in sample MH104, a not fully
successful run; they may have formed when pressure decreased from 2 kbar to about 1.8 kbar
due to the expansion of the bomb.
Successful runs of the 1 month series lasted from 29 to 38 days and the successful runs of the 2
months series lasted 60-64 days. Five runs MH101, MH104, MH112, MH212 and MH213,
which were not fully successfully, were also used in this study. These runs were terminated
earlier than other runs due to the expansion of the bomb. The runs number MH101 and MH112
ended after 24 and 25 days, and the runs number MH212 and MH213 ended after 26 and 27
days, respectively. Run number MH104 ended after 28 days. They were all quenched at about
1.8 kbar instead of 2 or 2.5 as usual. The capsules were in good condition after the run and
showed no weight loss, except capsule MH104, which was visibly broken after the experiment. It
probably had ruptured at the time of the bomb expanded, since the capsule was inflated. The
samples that were quenched at 2 kbar or less contained larger bubbles, leading to more scatter in
the EMPA analyses using a defocused beam. Most of the capsules gained a small amount of
weight (< 0.4 wt.%) during the run, probably due to uptake of nickel.
Chemical analyses of the run products showed that the relative proportion of Na, K, Al and Si
were virtually identical to the hydrous starting materials. The ASI varies slightly as compared to
the starting material values. These variations were mainly observed in the not fully successful
runs or in the samples that were quenched at 2 kbar or less. For example, in the series of
experiment at ASI = 0.7, the runs MH104 and MH112 were quenched at 1.8 kbar and the ASI in
the quenched glasses was higher than normal, possibly due to errors during analysis caused by
bubbles in the samples or due to alkali loss to the fluid during the exsolution of water (Table 3.5
and Table 3.6).

REE phosphate solubility: Results
56
Table 3.5. Experimental data on the solubility of rare earth phosphates (monazite and xenotime) in haplogranitic melts with variable alkali saturation index (ASI) at 800oC and 2 kbar as derived from average microprobe analyses of quenched glasses.
No. Starting materiala Runs Quench pressure Na2O K2O Al2O3 SiO2 P2O5 REE2O3 Total n ASIb Phasesc Kspd Mix Formula Days Kbar (%) (%) (%) (%) (%) (%) (%) (10-5 mol2/kg2)
MH101 G1+M LaPO4 24 1.8 5.23±0.08 5.31±0.03 10.38±0.04 72.31±0.19 0.34±0.01 0.025±0.005 93.63±0.22 25 0.73±0.01 M, Mi, Q 7±2 MH102 G1+M CePO4 30 2 4.36±1.03 5.35±0.07 10.90±0.42 74.62±2.06 0.16±0.01 0.103±0.011 95.54±1.39 17 0.74±0.01 M, Q 14±2 MH103 G1+M PrPO4 31 2 5.16±0.05 5.32±0.06 10.39±0.09 71.00±0.80 0.15±0.02 0.138±0.018 92.19±0.86 26 0.74±0.01 M 18±2 MH104 G1+M NdPO4 28 1.8 4.51±0.21 4.86±0.04 10.43±0.18 71.60±1.00 0.11±0.02 0.391±0.038 91.85±1.23 23 0.83±0.03 M 36±7 MH106 G11+M SmPO4 30 2.5 4.92±0.13 5.30±0.04 10.43±0.04 72.51±0.16 0.20±0.02 0.248±0.014 93.68±0.17 26 0.76±0.01 M 41±5 MH107 G1+M EuPO4 29 2 5.22±0.07 5.34±0.02 10.41±0.03 70.93±0.49 0.26±0.02 0.336±0.012 92.54±0.52 10 0.73±0.01 M 69±5 MH108 G1+M/X GdPO4 33 2 5.55±0.19 5.69±0.19 11.20±0.20 71.35±0.66 0.23±0.02 0.632±0.028 94.71±0.56 26 0.74±0.01 M, X 115±11 MH109 G1+X TbPO4 31 2 4.55±0.25 5.10±0.13 10.60±0.21 72.96±0.91 0.27±0.02 0.283±0.012 93.80±1.37 26 0.82±0.03 X, Fk 58±5 MH110 G11+X DyPO4 30 2.5 5.27±0.09 5.32±0.03 10.42±0.07 72.27±0.29 0.34±0.03 0.547±0.007 94.21±0.36 26 0.73±0.01 X 139±10 MH111 G11+X HoPO4 30 2.5 5.37±0.09 5.35±0.06 10.62±0.04 72.48±0.16 0.36±0.02 0.666±0.034 94.90±0.22 26 0.73±0.01 X 176±13 MH112 G1+X ErPO4 23 1.8 4.25±0.90 5.16±0.07 10.48±0.14 71.77±0.65 0.29±0.06 0.464±0.100 92.61±0.86 26 0.81±0.03 X 100±33 MH113 G11+X TmPO4 30 2.5 5.16±0.18 5.37±0.05 10.60±0.07 72.85±0.28 0.38±0.03 0.759±0.062 95.15±0.37 26 0.75±0.02 X 209±24 MH114 G11+X YbPO4 35 2.5 5.20±0.16 5.40±0.08 10.44±0.10 72.25±1.21 0.37±0.02 0.927±0.044 94.61±1.29 24 0.73±0.02 X 244±19 MH115 G1+X LuPO4 31 2 5.08±0.14 5.35±0.10 10.63±0.18 74.60±2.21 0.44±0.03 0.849±0.029 94.58±1.26 26 0.75±0.01 X 263±26 MH201 G2+M LaPO4 30 2.5 4.78±0.23 4.30±0.09 10.96±0.10 73.33±0.28 0.37±0.04 0.019±0.009 93.77±0.57 25 0.88±0.03 M, Q 5.9±2.9 MH202 G12+M CePO4 31 2.5 4.83±0.08 4.36±0.03 10.94±0.06 73.50±0.36 0.12±0.01 0.043±0.008 93.81±0.42 26 0.87±0.01 M 4.4±0.8 MH203 G12+M PrPO4 31 2.5 4.92±0.07 4.21±0.05 11.50±0.30 72.40±0.81 0.13±0.02 0.030±0.008 92.72±0.91 26 0.87±0.01 M, Mi 3.3±1.0 MH204 G12+M NdPO4 31 2.5 4.74±0.09 4.29±0.05 11.03±0.08 73.31±0.55 0.12±0.02 0.058±0.022 93.57±0.66 26 0.89±0.01 M 6.0±2.6 MH206 G12+M SmPO4 31 2.5 4.18±1.47 3.72±1.30 10.58±3.72 73.66±0.35 0.15±0.01 0.065±0.022 94.35±0.40 16 0.98±0.01 M, Mi 7.3±2.4 MH207 G2+M EuPO4 30 2 5.17±0.08 4.42±0.04 11.54±0.30 72.95±0.88 0.15±0.02 0.137±0.027 93.75±1.08 26 0.85±0.01 M 16.5±4.2 MH208 G2+M/X GdPO4 32 2 4.61±0.28 4.43±0.04 11.64±0.27 74.62±0.06 0.16±0.02 0.158±0.010 95.61±0.07 25 0.95±0.05 M, X 19.8±2.5 MH209 G12+X TbPO4 31 2.5 4.76±0.17 4.42±0.07 10.78±0.05 73.61±0.29 0.19±0.02 0.139±0.015 93.93±0.44 26 0.86±0.02 X 20.8±2.9 MH210 G2+X DyPO4 30 2 6.12±0.29 4.69±0.09 11.71±0.04 76.45±0.20 0.18±0.02 0.212±0.031 99.39±0.41 26 0.78±0.03 M, Mi 28.6±7.0 MH211 G12+X HoPO4 31 2.5 5.14±0.04 4.55±0.08 11.64±0.14 74.95±0.20 0.18±0.02 0.231±0.022 95.73±0.37 26 0.88±0.01 X 31.2±3.8 MH212 G2+X ErPO4 26 1.8 4.12±0.62 5.10±0.11 10.67±0.26 72.08±0.87 0.20±0.05 0.257±0.100 92.61±1.19 26 0.88±0.06 X 38.1±22.4 MH213 G2+X TmPO4 27 1.8 4.81±0.09 4.35±0.03 11.06±0.07 73.27±0.40 0.19±0.01 0.236±0.011 93.93±0.50 21 0.88±0.01 X 32.8±2.51 MH214 G12+X YbPO4 30 2.5 4.67±0.19 4.36±0.06 10.90±0.06 73.40±0.89 0.19±0.02 0.356±0.057 93.89±0.94 26 0.89±0.02 X 49.1±11.1 MH215 G2+X LuPO4 29 2 5.02±0.08 4.33±0.06 11.37±0.24 71.83±0.40 0.22±0.02 0.339±0.028 93.13±0.62 24 0.88±0.02 X, Mi 52.1±8.01 MH301 G13+M LaPO4 31 2.5 4.50±0.10 4.10±0.07 11.64±0.09 73.22±0.19 0.38±0.09 0.016±0.008 93.86±0.29 18 0.99±0.02 M 5.43±3.28 MH302 G13+M CePO4 30 2.5 4.44±0.30 4.11±0.04 11.63±0.05 73.59±0.24 0.10±0.02 0.038±0.012 93.93±0.45 26 1.00±0.05 M 3.29±1.13 MH303 G13+M PrPO4 31 2.5 4.57±0.10 4.08±0.03 11.66±0.09 72.60±0.28 0.11±0.03 0.021±0.013 93.00±0.51 25 0.98±0.01 M 2.04±1.75 MH304 G13+M NdPO4 31 2.5 4.70±0.07 4.10±0.02 11.86±0.07 73.59±0.45 0.12±0.02 0.027±0.012 94.43±0.51 23 0.98±0.01 M 2.60±1.16 MH306 G13+M SmPO4 31 2.5 4.62±0.08 4.14±0.07 11.73±0.07 73.81±0.30 0.11±0.01 0.047±0.006 94.47±0.33 26 0.98±0.01 M, Fk 4.06±0.84 MH307 G3+M EuPO4 30 2 4.54±0.07 4.09±0.04 12.44±0.65 73.34±0.29 0.12±0.02 0.040±0.009 93.83±0.29 25 0.99±0.01 M 4.24±1.15 MH308 G3+M/X GdPO4 32 2 4.79±0.11 4.12±0.07 12.16±0.24 73.31±0.46 0.12±0.02 0.045±0.014 94.56±0.53 26 0.99±0.02 M, X 4.25±1.34 MH309 G13+X TbPO4 30 2.5 4.59±0.12 4.13±0.05 11.61±0.06 73.47±0.09 0.11±0.01 0.042±0.005 93.97±0.23 21 0.97±0.02 X 3.48±0.28 MH310 G13+X DyPO4 30 2.5 4.51±0.07 4.09±0.05 11.67±0.06 73.62±0.12 0.11±0.02 0.073±0.011 94.11±0.21 22 0.99±0.01 X 6.37±1.15 MH311 G13+X HoPO4 30 2.5 4.67±0.08 4.43±0.13 12.27±0.10 74.54±0.21 0.11±0.02 0.053±0.013 95.10±0.56 26 0.99±0.01 X 4.51±1.29 MH312 G13+X ErPO4 30 2.5 4.50±0.13 4.16±0.03 11.83±0.11 73.71±0.93 0.13±0.03 0.099±0.022 94.46±0.94 26 1.00±0.02 X 9.43±3.23 MH313 G13+X TmPO4 34 2.5 4.05±0.34 4.24±0.05 11.77±0.10 74.09±0.63 0.12±0.03 0.099±0.022 94.34±0.90 26 1.03±0.04 X 8.88±2.96 MH314 G13+X YbPO4 30 2.5 4.51±0.10 4.13±0.06 11.73±0.15 73.42±0.62 0.12±0.02 0.208±0.035 94.24±0.78 26 0.99±0.02 X 17.31±3.46 MH315 G3+M LuPO4 29 2 4.82±0.05 4.21±0.05 11.48±0.21 74.11±0.82 0.12±0.02 0.143±0.024 94.90±0.77 26 0.93±0.02 X 12.54±3.00

REE phosphate solubility: Results
57
Table 3.5 (Continued) Starting materiala
Runs Quench pressureb Na2O K2O Al2O3 SiO2 P2O5 REE2O3 Total n Kspe No. Mix Formula Days Kbar (%) (%) (%) (%) (%) (%) (%)
ASIc Phasesd (10-5 mol2/kg2)
MH401 G4+M LaPO4 31 2.5 4.11±0.15 3.74±0.25 12.18±0.12 74.49±0.57 0.22±0.07 0.024±0.011 94.55±0.84 21 1.14±0.04 M, Mi 4.73±2.52 MH402 G14+M CePO4 38 2.5 4.05±0.06 4.22±0.06 12.18±0.08 74.34±0.10 0.12±0.03 0.046±0.009 94.70±0.13 26 1.09±0.01 M 4.90±1.19 MH403 G4+M PrPO4 30 2.5 3.96±0.74 3.59±0.11 12.10±0.07 72.23±0.41 0.11±0.02 0.028±0.015 91.96±0.73 26 1.14±0.01 M 2.68±1.70 MH404 G14+M NdPO4 31 2.5 4.22±0.07 3.98±0.03 12.45±0.07 74.81±0.32 0.11±0.02 0.025±0.013 95.43±0.41 26 1.11±0.01 M 2.36±1.26 MH406 G14+M SmPO4 30 2.5 3.95±0.10 3.92±0.04 11.60±0.07 74.29±0.14 0.11±0.01 0.059±0.009 93.97±0.26 26 1.09±0.02 M 5.53±1.12 MH407 G14+M EuPO4 30 2.5 3.78±0.19 3.52±0.07 12.07±0.15 73.67±0.71 0.12±0.02 0.047±0.015 93.34±1.02 20 1.21±0.04 M 4.38±1.47 MH408 G4+M/X GdPO4 30 2.5 4.08±0.09 4.02±0.06 11.56±0.18 73.85±0.92 0.12±0.01 0.057±0.015 93.82±1.17 26 1.05±0.02 M, X 5.25±1.73 MH409 G4+X TbPO4 30 2.5 4.07±0.20 3.95±0.13 11.90±0.41 74.64±2.22 0.13±0.03 0.044±0.016 94.86±2.92 26 1.09±0.01 X 4.17±1.41 MH410 G4+X DyPO4 30 2.5 4.82±0.25 4.15±0.05 13.22±0.08 73.29±0.29 0.12±0.01 0.055±0.018 95.63±0.55 25 1.06±0.02 X 4.71±1.55 MH411 G4+X HoPO4 31 2.5 4.08±0.07 3.85±0.06 11.97±0.07 74.63±0.36 0.11±0.02 0.045±0.015 94.84±0.49 26 1.11±0.01 X 3.68±1.65 MH412 G14+X ErPO4 30 2.5 4.21±0.07 4.00±0.05 12.23±0.12 74.63±0.77 0.11±0.02 0.065±0.021 94.64±0.56 24 1.09±0.02 X 4.71±1.88 MH413 G14+X TmPO4 30 2.5 3.95±0.28 3.38±0.21 11.90±0.13 76.95±0.42 0.10±0.02 0.085±0.011 96.04±1.00 20 1.16±0.05 X 6.52±1.50 MH414 G14+X YbPO4 30 2.5 4.01±0.15 3.48±0.06 11.84±0.18 74.30±0.96 0.10±0.02 0.139±0.019 94.32±1.00 22 1.15±0.03 X 9.65±2.42 MH415 G14+X LuPO4 31 2.5 4.14±0.07 3.91±0.04 11.67±0.08 72.94±0.71 0.11±0.02 0.117±0.025 93.02±0.80 26 1.06±0.01 X 9.15±2.61 MH501 G5+M LaPO4 30 2.5 4.00±0.09 3.77±0.06 12.42±0.14 73.83±0.72 0.26±0.16 0.018±0.009 94.32±0.77 23 1.17±0.01 M, Q 4.14±2.85 MH502 G15+M CePO4 31 2.5 3.86±0.12 3.91±0.20 12.41±0.08 73.60±0.21 0.10±0.01 0.037±0.016 93.78±0.21 25 1.15±0.00 M 3.27±1.54 MH503 G15+M PrPO4 31 2 4.03±0.07 3.87±0.08 12.82±0.15 74.67±1.18 0.13±0.03 0.023±0.009 95.05±0.83 25 1.19±0.02 M 2.54±1.05 MH504 G15+M NdPO4 31 2.5 4.03±0.09 4.03±0.03 12.37±0.22 71.47±1.53 0.11±0.01 0.026±0.011 91.76±1.76 24 1.13±0.02 M 2.37±1.06 MH506 G15+M SmPO4 30 2.5 4.01±0.08 3.95±0.04 12.30±0.04 74.15±0.28 0.11±0.02 0.061±0.011 94.39±0.50 26 1.14±0.01 M 5.29±1.59 MH507 G5+M EuPO4 33 2.5 4.00±0.10 4.14±0.10 12.12±0.06 73.16±0.44 0.13±0.03 0.034±0.015 93.69±0.54 26 1.10±0.01 M 3.68±1.84 MH508 G5+M/X GdPO4 30 2 3.83±0.17 4.22±0.11 12.15±0.19 74.15±0.60 0.12±0.01 0.032±0.015 94.54±0.86 25 1.13±0.04 M, X 2.89±1.49 MH509 G5+X TbPO4 30 2.5 3.78±0.09 3.84±0.05 12.18±0.11 75.69±1.06 0.12±0.03 0.057±0.019 95.71±0.94 25 1.18±0.01 X 5.30±2.36 MH510 G5+X DyPO4 30 2.5 4.01±0.08 3.42±0.04 12.20±0.07 74.32±0.18 0.11±0.02 0.039±0.026 94.14±0.29 21 1.19±0.02 X 3.84±2.30 MH511 G5+X HoPO4 30 2.5 3.73±0.13 3.91±0.14 12.06±0.24 74.69±0.63 0.11±0.01 0.026±0.011 94.03±0.45 25 1.16±0.04 X 2.15±0.86 MH512 G15+X ErPO4 27 2.5 4.01±0.07 3.83±0.05 12.31±0.07 74.33±0.24 0.10±0.02 0.065±0.019 94.68±0.31 22 1.15±0.02 X 5.07±1.91 MH513 G5+X TmPO4 31 2.5 3.82±0.08 3.74±0.08 12.50±0.06 73.59±0.25 0.11±0.02 0.085±0.027 93.87±0.30 21 1.22±0.02 X 6.82±1.95 MH514 G15+X YbPO4 29 2.5 3.91±0.12 3.84±0.11 12.44±0.12 73.55±1.06 0.11±0.03 0.144±0.021 93.82±1.23 26 1.18±0.02 X 11.13±3.53 MH515 G5+X LuPO4 31 2 4.02±0.12 3.68±0.03 12.74±0.20 73.03±0.54 0.11±0.02 0.090±0.049 93.72±0.75 22 1.21±0.03 X 7.22±4.66 MH601 G16+M LaPO4 30 2.5 3.67±0.07 3.58±0.05 12.65±0.17 73.27±0.68 0.21±0.08 0.022±0.010 93.46±0.89 25 1.28±0.02 M 3.77±2.14 MH602 G16+M CePO4 31 2.5 3.68±0.16 3.76±0.20 12.81±0.07 73.81±0.21 0.11±0.02 0.047±0.009 94.14±0.25 26 1.24±0.01 M 4.32±0.97 MH603 G16+M PrPO4 30 2.5 3.70±0.28 3.39±0.19 12.60±0.32 71.37±1.51 0.13±0.02 0.031±0.016 93.69±2.10 25 1.30±0.07 M 3.34±1.55 MH604 G16+M NdPO4 30 2.5 3.72±0.09 3.54±0.04 13.07±0.06 74.14±0.21 0.11±0.01 0.034±0.013 94.64±0.33 26 1.32±0.02 M 3.19±1.17 MH606 G16+M SmPO4 30 2.5 3.67±0.12 3.58±0.04 12.86±0.05 73.31±0.25 0.12±0.02 0.068±0.011 93.52±0.52 26 1.30±0.03 M 6.61±1.33 MH607 G16+M EuPO4 33 2.5 3.81±0.15 3.63±0.03 13.05±0.05 73.96±0.78 0.12±0.02 0.049±0.018 94.69±0.72 25 1.29±0.03 M 4.57±2.17 MH608 G6+M GdPO4 30 2 3.68±0.08 3.60±0.08 12.62±0.11 73.22±0.49 0.12±0.01 0.069±0.014 93.38±0.65 25 1.28±0.02 M, X 6.69±1.55 MH609 G16+M TbPO4 30 2.5 3.63±0.15 3.52±0.06 12.88±0.09 73.15±0.43 0.14±0.03 0.059±0.016 93.40±0.52 26 1.33±0.03 X 7.53±3.21 MH610 G6+M DyPO4 30 2.5 4.04±0.34 3.84±0.17 13.32±0.27 73.66±0.40 0.12±0.01 0.043±0.023 95.10±0.69 26 1.25±0.08 X 3.42±2.50 MH611 G6+M HoPO4 30 2.5 3.76±0.07 3.99±0.03 12.99±0.06 73.88±0.35 0.11±0.02 0.052±0.020 94.46±0.41 20 1.24±0.01 X 4.23±2.00 MH612 G16+M ErPO4 31 2.5 3.70±0.07 3.64±0.04 12.74±0.16 74.19±0.25 0.11±0.01 0.081±0.014 94.52±0.39 25 1.28±0.02 X 6.29±1.06 MH613 G6+M TmPO4 38 2.5 3.49±0.15 3.61±0.09 13.09±0.18 76.91±0.86 0.11±0.02 0.099±0.024 97.40±1.02 26 1.36±0.04 X 7.70±2.17 MH614 G6+M YbPO4 31 2.5 3.64±0.23 3.75±0.05 12.39±0.05 73.82±0.12 0.11±0.03 0.122±0.022 93.85±0.25 26 1.24±0.05 X 9.96±3.50 MH615 G6+M LuPO4 31 2 3.59±0.15 3.59±0.10 12.45±0.13 74.77±1.68 0.12±0.01 0.088±0.030 94.67±1.81 25 1.28±0.06 X 7.20±2.21 a) Starting materials: 90% water-saturated haplogranite glass (ASI =0.7-1.2), i.e. containing about 6% H2O + 10% pure individual rare earth phosphate crystals (monazite (M) or xenotime (X)). b) The pressure during the run (2kbar) was increased to this pressure just immediately before the quench to avoid bubble nucleation c) Aluminum saturation index (ASI) = Al /(Na+K) in mol d) Phase present other than glass: M = monazite, X = xenotime, Mi = mica, Q = quartz and Fk = alkali feldspar
e) Solubility product ( Ksp) for reaction meltmeltmelt POREEREEPO 44 +⇔
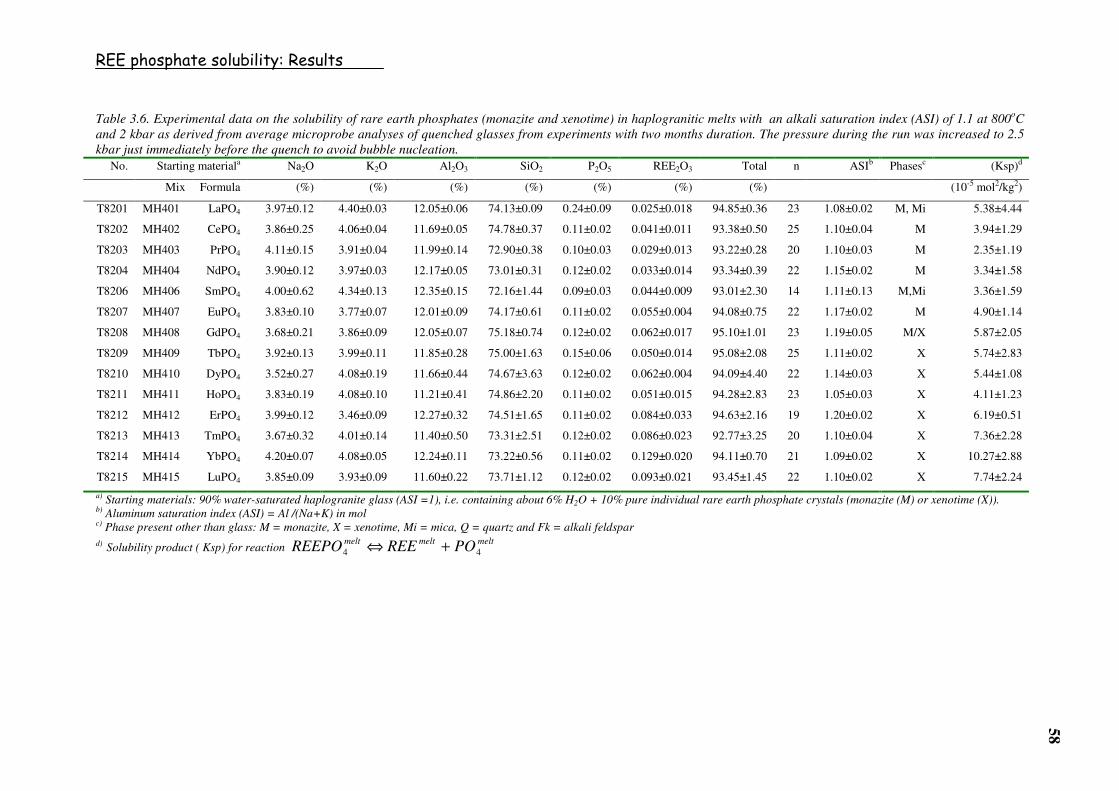
REE phosphate solubility: Results
58
Table 3.6. Experimental data on the solubility of rare earth phosphates (monazite and xenotime) in haplogranitic melts with an alkali saturation index (ASI) of 1.1 at 800oC and 2 kbar as derived from average microprobe analyses of quenched glasses from experiments with two months duration. The pressure during the run was increased to 2.5 kbar just immediately before the quench to avoid bubble nucleation.
No. Starting materiala Na2O K2O Al2O3 SiO2 P2O5 REE2O3 Total n ASIb Phasesc (Ksp)d
Mix Formula (%) (%) (%) (%) (%) (%) (%) (10-5 mol2/kg2)
T8201 MH401 LaPO4 3.97±0.12 4.40±0.03 12.05±0.06 74.13±0.09 0.24±0.09 0.025±0.018 94.85±0.36 23 1.08±0.02 M, Mi 5.38±4.44
T8202 MH402 CePO4 3.86±0.25 4.06±0.04 11.69±0.05 74.78±0.37 0.11±0.02 0.041±0.011 93.38±0.50 25 1.10±0.04 M 3.94±1.29
T8203 MH403 PrPO4 4.11±0.15 3.91±0.04 11.99±0.14 72.90±0.38 0.10±0.03 0.029±0.013 93.22±0.28 20 1.10±0.03 M 2.35±1.19
T8204 MH404 NdPO4 3.90±0.12 3.97±0.03 12.17±0.05 73.01±0.31 0.12±0.02 0.033±0.014 93.34±0.39 22 1.15±0.02 M 3.34±1.58
T8206 MH406 SmPO4 4.00±0.62 4.34±0.13 12.35±0.15 72.16±1.44 0.09±0.03 0.044±0.009 93.01±2.30 14 1.11±0.13 M,Mi 3.36±1.59
T8207 MH407 EuPO4 3.83±0.10 3.77±0.07 12.01±0.09 74.17±0.61 0.11±0.02 0.055±0.004 94.08±0.75 22 1.17±0.02 M 4.90±1.14
T8208 MH408 GdPO4 3.68±0.21 3.86±0.09 12.05±0.07 75.18±0.74 0.12±0.02 0.062±0.017 95.10±1.01 23 1.19±0.05 M/X 5.87±2.05
T8209 MH409 TbPO4 3.92±0.13 3.99±0.11 11.85±0.28 75.00±1.63 0.15±0.06 0.050±0.014 95.08±2.08 25 1.11±0.02 X 5.74±2.83
T8210 MH410 DyPO4 3.52±0.27 4.08±0.19 11.66±0.44 74.67±3.63 0.12±0.02 0.062±0.004 94.09±4.40 22 1.14±0.03 X 5.44±1.08
T8211 MH411 HoPO4 3.83±0.19 4.08±0.10 11.21±0.41 74.86±2.20 0.11±0.02 0.051±0.015 94.28±2.83 23 1.05±0.03 X 4.11±1.23
T8212 MH412 ErPO4 3.99±0.12 3.46±0.09 12.27±0.32 74.51±1.65 0.11±0.02 0.084±0.033 94.63±2.16 19 1.20±0.02 X 6.19±0.51
T8213 MH413 TmPO4 3.67±0.32 4.01±0.14 11.40±0.50 73.31±2.51 0.12±0.02 0.086±0.023 92.77±3.25 20 1.10±0.04 X 7.36±2.28
T8214 MH414 YbPO4 4.20±0.07 4.08±0.05 12.24±0.11 73.22±0.56 0.11±0.02 0.129±0.020 94.11±0.70 21 1.09±0.02 X 10.27±2.88
T8215 MH415 LuPO4 3.85±0.09 3.93±0.09 11.60±0.22 73.71±1.12 0.12±0.02 0.093±0.021 93.45±1.45 22 1.10±0.02 X 7.74±2.24
a) Starting materials: 90% water-saturated haplogranite glass (ASI =1), i.e. containing about 6% H2O + 10% pure individual rare earth phosphate crystals (monazite (M) or xenotime (X)). b) Aluminum saturation index (ASI) = Al /(Na+K) in mol c) Phase present other than glass: M = monazite, X = xenotime, Mi = mica, Q = quartz and Fk = alkali feldspar d) Solubility product ( Ksp) for reaction meltmeltmelt POREEREEPO 44 +⇔

REE phosphate solubility: Results
59
Table 3.7. Experimental data on the solubility of rare earth phosphates (monazite and xenotime) in haplogranitic melts with an alkali saturation index (ASI) of 1.2 at 1100oC and 2 kbar as derived from average microprobe analyses of quenched glasses. Run duration was 7 days. No. Starting materiala Na2O K2O Al2O3 SiO2 P2O5 REE2O3 Total n ASIb Phasesc (Ksp)d
Mix Formula (%) (%) (%) (%) (%) (%) (%) (10-5 mol2/kg2)
T1101 G24+M LaPO4 4.07±0.29 3.45±0.04 12.28±0.11 74.41±0.21 0.17±0.01 0.117±0.010 94.52±0.47 22 1.18±0.05 M 17.16±1.98
T1102 G24+M CePO4 4.07±0.43 3.43±0.03 12.37±0.07 74.64±0.16 0.18±0.02 0.168±0.014 94.89±0.44 9 1.21±0.11 M 24.94±3.34
T1103 G24+M PrPO4 4.11±0.11 3.45±0.04 12.12±0.12 74.27±0.34 0.14±0.03 0.203±0.031 94.34±0.51 19 1.16±0.02 M 25.86±2.61
T1104 G24+M NdPO4 4.23±0.09 3.41±0.04 12.38±0.08 74.25±0.22 0.18±0.02 0.158±0.011 94.62±0.28 26 1.17±0.02 M 23.43±3.12
T1106 G24+M SmPO4 4.10±0.10 3.36±0.09 12.36±0.10 73.78±0.37 0.19±0.02 0.212±0.012 94.03±0.54 26 1.20±0.02 M 31.84±4.25
T1107 G24+M EuPO4 4.24±0.09 3.41±0.02 12.45±0.07 73.95±0.35 0.22±0.02 0.254±0.020 94.54±0.36 26 1.18±0.02 M 43.95±5.75
T1108 G24+M/X GdPO4 4.13±0.12 3.37±0.09 12.12±0.12 74.21±0.35 0.21±0.02 0.253±0.018 94.33±0.60 23 1.17±0.03 M/X 40.62±4.62
T1109 G24+X TbPO4 4.05±0.11 3.38±0.05 12.22±0.10 74.07±0.25 0.25±0.03 0.239±0.022 94.25±0.35 22 1.19±0.02 X 46.17±6.09
T1110 G24+X DyPO4 4.13±0.09 3.39±0.03 12.30±0.05 74.11±0.21 0.21±0.02 0.315±0.024 94.48±0.29 16 1.18±0.02 X 49.14±5.07
T1111 G24+X HoPO4 4.16±0.12 3.45±0.03 12.37±0.06 74.49±0.22 0.19±0.02 0.269±0.040 94.96±0.35 18 1.18±0.02 X 38.22±7.49
T1112 G24+X ErPO4 4.12±0.08 3.45±0.03 12.23±0.09 73.62±0.62 0.19±0.02 0.272±0.028 93.91±0.75 18 1.17±0.01 X 39.06±6.01
T1113 G24+X TmPO4 4.08±0.09 3.44±0.02 12.41±0.04 74.43±0.28 0.20±0.03 0.284±0.050 94.86±0.32 17 1.20±0.02 X 41.37±11.2
T1114 G24+X YbPO4 4.00±0.06 3.40±0.05 12.30±0.02 74.56±0.08 0.21±0.01 0.369±0.022 94.86±0.14 19 1.21±0.02 X 55.99±5.87
T1115 G24+X LuPO4 4.07±0.09 3.38±0.04 12.28±0.08 74.22±0.71 0.20±0.02 0.328±0.035 94.56±0.71 14 1.19±0.02 X 45.41±6.51
a) Starting materials: 90% water- saturated haplogranite glass (ASI =1), i.e. containing about 6% H2O + 10% pure individual rare earth phosphate crystals b) Aluminum saturation index (ASI) = Al /(Na+K) in mol c) Phase present other than glass: M = monazite, X = xenotime d) Solubility product ( Ksp) for reaction meltmeltmelt POREEREEPO 44 +⇔

REE phosphate solubility: Results
60
Table 3.8. Experimental data on the solubility of rare earth phosphates (monazite and xenotime) in haplogranitic melts with an alkali saturation index (ASI) of 1.2 at 800oC and 2 kbar as derived from average microprobe analyses of quenched glasses from 2 months reversed experiments. The pressure during the run was increased to 2.5 kbar just immediately before the quench to avoid bubble nucleation
No. Starting materiala Na2O K2O Al2O3 SiO2 P2O5 REE2O3 Total n ASIb Phasesc (Ksp)c
Mix Formula (%) (%) (%) (%) (%) (%) (%) (10-5 mol2/kg2)
R8201 T1101 LaPO4 3.91±0.18 3.39±0.11 12.47±0.10 75.25±0.46 0.13±0.04 0.046±0.026 95.25±0.76 26 1.23±0.02 M 5.18±3.53
R8202 T1102 CePO4 4.15±0.31 3.39±0.06 12.37±0.05 74.86±0.20 0.15±0.03 0.062±0.012 93.86±0.34 15 1.19±0.06 M 7.08±2.06
R8203 T1103 PrPO4 3.96±0.21 3.41±0.12 12.31±0.15 74.16±0.52 0.12±0.03 0.073±0.018 93.81±0.87 25 1.21±0.06 M 7.21±3.01
R8204 T1104 NdPO4 4.11±0.06 3.43±0.06 12.37±0.07 74.09±0.23 0.14±0.02 0.055±0.013 94.23±0.30 26 1.19±0.01 M 6.31±1.41
R8206 T1106 SmPO4 3.89±0.15 3.37±0.17 11.99±0.47 72.78±1.99 0.14±0.02 0.079±0.014 91.81±2.27 26 1.19±0.05 M 9.01±2.03
R8207 T1107 EuPO4 4.06±0.09 3.42±0.08 12.28±0.11 73.89±0.24 0.16±0.03 0.080±0.033 93.93±0.34 25 1.19±0.02 M 8.46±3.15
R8208 T1108 GdPO4 3.86±0.20 3.37±0.10 12.45±0.25 75.12±0.85 0.17±0.09 0.103±0.028 95.15±0.99 25 1.25±0.03 M/X 10.66±5.80
R8209 T1109 TbPO4 3.81±0.15 3.47±0.02 12.33±0.04 74.63±0.11 0.24±0.04 0.104±0.041 94.67±0.21 23 1.24±0.03 X 18.11±9.16
R8210 T1110 DyPO4 3.77±0.15 3.49±0.09 12.43±0.19 75.15±0.84 0.18±0.09 0.091±0.023 95.27±1.02 25 1.26±0.04 X 9.83±3.97
R8211 T1111 HoPO4 4.12±0.10 3.43±0.02 12.36±0.08 74.37±0.26 0.15±0.03 0.119±0.025 94.59±0.36 25 1.18±0.01 X 13.37±4.09
R8212 T1112 ErPO4 4.05±0.11 3.43±0.04 12.29±0.10 74.18±0.40 0.17±0.02 0.124±0.037 94.28±0.50 25 1.19±0.02 X 15.77±5.87
R8213 T1113 TmPO4 3.73±0.15 3.77±0.07 12.50±0.06 73.50±0.20 0.11±0.02 0.103±0.017 93.74±0.32 20 1.23±0.03 X 8.15±1.59
R8214 T1114 YbPO4 3.69±1.12 3.42±0.06 12.43±0.09 74.56±0.61 0.19±0.02 0.243±0.049 94.56±0.69 10 1.37±0.50 X 33.00±9.03
R8215 T1115 LuPO4 3.60±0.51 3.40±0.01 11.92±0.05 72.65±0.25 0.20±0.03 0.218±0.056 92.13±0.36 26 1.27±0.16 X 30.27±9.49 a) Starting materials: 90% water-saturated haplogranite glass (ASI =1), i.e. containing about 6% H2O + 10% pure individual rare earth phosphate crystals. b) Aluminum saturation index (ASI) = Al /(Na+K) in mol c) Phase present other than glass: M = monazite, X = xenotime. d) Solubility product ( Ksp) for reaction meltmeltmelt POREEREEPO 44 +⇔
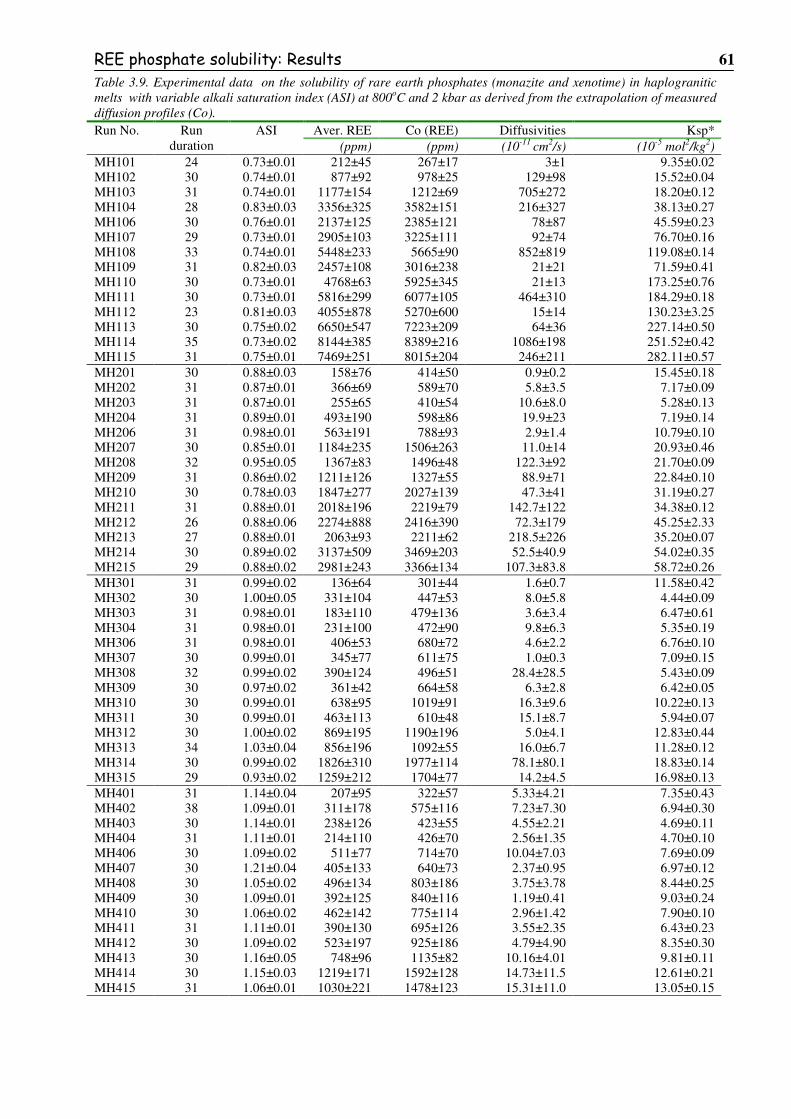
REE phosphate solubility: Results 61
Table 3.9. Experimental data on the solubility of rare earth phosphates (monazite and xenotime) in haplogranitic melts with variable alkali saturation index (ASI) at 800oC and 2 kbar as derived from the extrapolation of measured diffusion profiles (Co).
Aver. REE Co (REE) Diffusivities Ksp* Run No. Run duration
ASI (ppm) (ppm) (10-11 cm2/s) (10-5 mol2/kg2)
MH101 24 0.73±0.01 212±45 267±17 3±1 9.35±0.02 MH102 30 0.74±0.01 877±92 978±25 129±98 15.52±0.04 MH103 31 0.74±0.01 1177±154 1212±69 705±272 18.20±0.12 MH104 28 0.83±0.03 3356±325 3582±151 216±327 38.13±0.27 MH106 30 0.76±0.01 2137±125 2385±121 78±87 45.59±0.23 MH107 29 0.73±0.01 2905±103 3225±111 92±74 76.70±0.16 MH108 33 0.74±0.01 5448±233 5665±90 852±819 119.08±0.14 MH109 31 0.82±0.03 2457±108 3016±238 21±21 71.59±0.41 MH110 30 0.73±0.01 4768±63 5925±345 21±13 173.25±0.76 MH111 30 0.73±0.01 5816±299 6077±105 464±310 184.29±0.18 MH112 23 0.81±0.03 4055±878 5270±600 15±14 130.23±3.25 MH113 30 0.75±0.02 6650±547 7223±209 64±36 227.14±0.50 MH114 35 0.73±0.02 8144±385 8389±216 1086±198 251.52±0.42 MH115 31 0.75±0.01 7469±251 8015±204 246±211 282.11±0.57 MH201 30 0.88±0.03 158±76 414±50 0.9±0.2 15.45±0.18 MH202 31 0.87±0.01 366±69 589±70 5.8±3.5 7.17±0.09 MH203 31 0.87±0.01 255±65 410±54 10.6±8.0 5.28±0.13 MH204 31 0.89±0.01 493±190 598±86 19.9±23 7.19±0.14 MH206 31 0.98±0.01 563±191 788±93 2.9±1.4 10.79±0.10 MH207 30 0.85±0.01 1184±235 1506±263 11.0±14 20.93±0.46 MH208 32 0.95±0.05 1367±83 1496±48 122.3±92 21.70±0.09 MH209 31 0.86±0.02 1211±126 1327±55 88.9±71 22.84±0.10 MH210 30 0.78±0.03 1847±277 2027±139 47.3±41 31.19±0.27 MH211 31 0.88±0.01 2018±196 2219±79 142.7±122 34.38±0.12 MH212 26 0.88±0.06 2274±888 2416±390 72.3±179 45.25±2.33 MH213 27 0.88±0.01 2063±93 2211±62 218.5±226 35.20±0.07 MH214 30 0.89±0.02 3137±509 3469±203 52.5±40.9 54.02±0.35 MH215 29 0.88±0.02 2981±243 3366±134 107.3±83.8 58.72±0.26 MH301 31 0.99±0.02 136±64 301±44 1.6±0.7 11.58±0.42 MH302 30 1.00±0.05 331±104 447±53 8.0±5.8 4.44±0.09 MH303 31 0.98±0.01 183±110 479±136 3.6±3.4 6.47±0.61 MH304 31 0.98±0.01 231±100 472±90 9.8±6.3 5.35±0.19 MH306 31 0.98±0.01 406±53 680±72 4.6±2.2 6.76±0.10 MH307 30 0.99±0.01 345±77 611±75 1.0±0.3 7.09±0.15 MH308 32 0.99±0.02 390±124 496±51 28.4±28.5 5.43±0.09 MH309 30 0.97±0.02 361±42 664±58 6.3±2.8 6.42±0.05 MH310 30 0.99±0.01 638±95 1019±91 16.3±9.6 10.22±0.13 MH311 30 0.99±0.01 463±113 610±48 15.1±8.7 5.94±0.07 MH312 30 1.00±0.02 869±195 1190±196 5.0±4.1 12.83±0.44 MH313 34 1.03±0.04 856±196 1092±55 16.0±6.7 11.28±0.12 MH314 30 0.99±0.02 1826±310 1977±114 78.1±80.1 18.83±0.14 MH315 29 0.93±0.02 1259±212 1704±77 14.2±4.5 16.98±0.13 MH401 31 1.14±0.04 207±95 322±57 5.33±4.21 7.35±0.43 MH402 38 1.09±0.01 311±178 575±116 7.23±7.30 6.94±0.30 MH403 30 1.14±0.01 238±126 423±55 4.55±2.21 4.69±0.11 MH404 31 1.11±0.01 214±110 426±70 2.56±1.35 4.70±0.10 MH406 30 1.09±0.02 511±77 714±70 10.04±7.03 7.69±0.09 MH407 30 1.21±0.04 405±133 640±73 2.37±0.95 6.97±0.12 MH408 30 1.05±0.02 496±134 803±186 3.75±3.78 8.44±0.25 MH409 30 1.09±0.01 392±125 840±116 1.19±0.41 9.03±0.24 MH410 30 1.06±0.02 462±142 775±114 2.96±1.42 7.90±0.10 MH411 31 1.11±0.01 390±130 695±126 3.55±2.35 6.43±0.23 MH412 30 1.09±0.02 523±197 925±186 4.79±4.90 8.35±0.30 MH413 30 1.16±0.05 748±96 1135±82 10.16±4.01 9.81±0.11 MH414 30 1.15±0.03 1219±171 1592±128 14.73±11.5 12.61±0.21 MH415 31 1.06±0.01 1030±221 1478±123 15.31±11.0 13.05±0.15

REE phosphate solubility: Results 62
Table 3.9 (continued)
Aver. REE Co (REE) Diffusivities Kspb Run No. Run duration
ASIa (ppm) (ppm) (10-11 cm2/s) (10-5 mol2/kg2)
MH501 30 1.17±0.01 156±75 311±72 2.12±1.56 8.20±1.18 MH502 31 1.15±0.00 320±128 413±81 1.87±1.23 4.18±0.10 MH503 31 1.19±0.02 197±74 332±67 4.71±3.44 4.32±0.17 MH504 31 1.13±0.02 226±94 339±50 9.04±6.16 3.52±0.07 MH506 30 1.14±0.01 528±94 588±59 17.64±18.7 5.87±0.11 MH507 33 1.10±0.01 291±131 384±67 1.60±0.85 4.80±0.19 MH508 30 1.13±0.04 274±127 392±95 10.84±15.5 4.09±0.11 MH509 30 1.18±0.01 496±167 688±67 5.98±2.86 7.30±0.19 MH510 30 1.19±0.02 391±201 669±68 9.90±5.54 6.40±0.10 MH511 30 1.16±0.04 227±93 407±45 5.15±2.37 3.90±0.06 MH512 27 1.15±0.02 570±166 731±91 3.29±1.64 6.42±0.12 MH513 31 1.22±0.02 743±234 1142±129 7.52±3.82 10.59±0.16 MH514 29 1.18±0.02 1263±186 1602±129 32.50±29.4 14.05±0.30 MH515 31 1.21±0.03 790±431 1208±159 3.47±1.61 10.72±0.26
MH601 30 1.28±0.02 178±80 404±63 2.12±1.56 8.79±0.51 MH602 31 1.24±0.01 402±75 514±42 11.25±7.22 5.53±0.06 MH603 30 1.30±0.07 266±137 421±67 7.02±7.54 5.39±0.12 MH604 30 1.32±0.02 290±111 388±56 9.10±8.48 4.28±0.07 MH606 30 1.30±0.03 590±92 639±66 92.73±208 7.20±0.13 MH607 33 1.29±0.03 421±153 688±54 2.36±0.61 7.31±0.09 MH608 30 1.28±0.02 602±123 842±62 5.65±2.34 9.33±0.06 MH609 30 1.33±0.03 504±162 721±77 22.06±26 10.69±0.29 MH610 30 1.25±0.08 325±226 677±104 3.73±1.93 7.03±0.12 MH611 30 1.24±0.01 454±179 764±112 8.09±6.26 7.02±0.18 MH612 31 1.28±0.02 708±119 896±42 17.84±6.05 8.00±0.03 MH613 38 1.36±0.04 891±207 1111±97 43.52±35.3 9.57±0.12 MH614 31 1.24±0.05 1073±192 1482±57 7.18±1.51 13.65±0.15 MH615 31 1.28±0.06 774±263 1024±102 9.96±6.26 9.63±0.12
T8201 62 1.08±0.02 214±156 411±71 0.72±0.29 9.64±0.71 T8202 61 1.10±0.04 346±96 495±42 4.02±1.71 5.64±0.08 T8203 62 1.10±0.03 244±109 380±54 2.33±1.06 3.77±0.17 T8204 64 1.15±0.02 287±116 450±49 3.60±1.69 5.18±0.09 T8206 62 1.11±0.13 377±76 686±52 2.79±0.75 5.91±0.14 T8207 62 1.17±0.02 475±36 575±39 30.04±26.1 5.92±0.09 T8208 64 1.19±0.05 535±146 587±62 25.58±35.9 6.40±0.13 T8209 62 1.11±0.02 436±122 691±77 8.68±6.50 8.92±0.38 T8210 61 1.14±0.03 539±38 741±64 19.00±12.9 7.45±0.11 T8211 62 1.05±0.03 442±128 792±65 2.98±0.89 7.41±0.10 T8212 64 1.20±0.02 641±67 1045±123 5.02±2.88 9.53±0.15 T8213 62 1.10±0.04 750±204 1055±88 10.26±6.29 10.39±0.12 T8214 61 1.09±0.02 1135±173 1731±133 3.84±1.31 15.96±0.24 T8215 64 1.10±0.02 815±184 1216±199 7.09±6.24 11.46±0.27 a) Aluminum saturation index (ASI) = Al /(Na+K) in mol of run product glasses calculated from microprobe data b) Solubility product ( Ksp) for reaction meltmeltmelt POREEREEPO 44 +⇔

REE phosphate solubility: Results 63
Figure 3.7. Graph showing the solubility of REE phosphates in haplogranite melt with 6 wt.% H2O from EPMA analyses of the run products at 800oC and 2 kbar. Error bars indicate standard deviations of replicated measurement. Shown are both average microprobe data of the glasses analysed and rare earth concentrations obtained by extrapolating diffusion profiles measured around a crystal to the crystal/melt interface. In subfigures G and H, average data are shown only.

REE phosphate solubility: Results 64
Attainment of equilibrium was checked by runs with different starting materials and by
approaching equilibrium from both dissolution and crystallization experiments. The measured
solubility of LaPO4 and CePO4 in water-saturated haplogranite melt at 1100oC is similar to the
result given by Rapp and Watson (1986), demonstrating attainment of equilibrium at 1100oC
within 1 week. However, at 800°C and 2 kbar, attainment of equilibrium is extremely sluggish
for the metaluminous and peraluminous compositions and even run duration of 1 – 2 months fail
to give identical results if equilibrium is approached from different directions. For the
experiments with ASI = 1.1, it is evident that at 800oC and 2 kbar, the concentrations of REE are
almost constant after about 1–2 months, and slightly lower than the concentrations observed in
the reverse runs, demonstrating that the dissolution of REE is very slow and these runs did not
fully reach equilibrium. For that reason, the saturation concentration of the REE in the melts was
also estimated by extrapolating diffusion profiles. Extrapolated results for all run products from
dissolution experiments are summarized in Table 3.9.
Monazite and xenotime solubilities derived from average microprobe analyses and from the
extrapolation of diffusion profiles are plotted in Figure 3.7. In the peralkaline melts average and
extrapolated solubilities are nearly identical, implying attainment of equilibrium in these low-
viscosity melts. On the other hand, the experiments with metaluminous and peraluminous
composition probably did not fully reach equilibrium.
The solubility of REE in each melt composition is shown in Figure 3.7. These graphs
demonstrate that the solubility of REE is controlled by the ionic radius and type of REE mineral.
The solubility increases with decreasing ionic radius. The solubility of La (1.16 Å), the largest
REE, is around 200-400 ppm in all melt compositions (ASI = 0.7-1.2) at 800oC and 2 kbar, while
the solubility of the smallest one, Lu (0.977Å) at the same condition, is up to 7000 – 8000 ppm
in peralkaline melt. The solubility of monazite in these melts is less compared to that of
xenotime at the same condition. This observation is in agreement with the previous experiments
(Keppler, 1993; Wolf and London, 1995), who showed that the solubility of xenotime is always
greater than that of monazite at the same temperature, pressure and composition. Thus,
fractionation of monazite or xenotime leads to REE depletion in the melt.
Inspection of Figure 3.7 shows that monazite and xenotime solubility is not a continuous
function of ionic radius or atomic number. This is most obvious for the strongly peralkaline
melts where equilibrium was clearly reached. These samples showed virtually no concentration
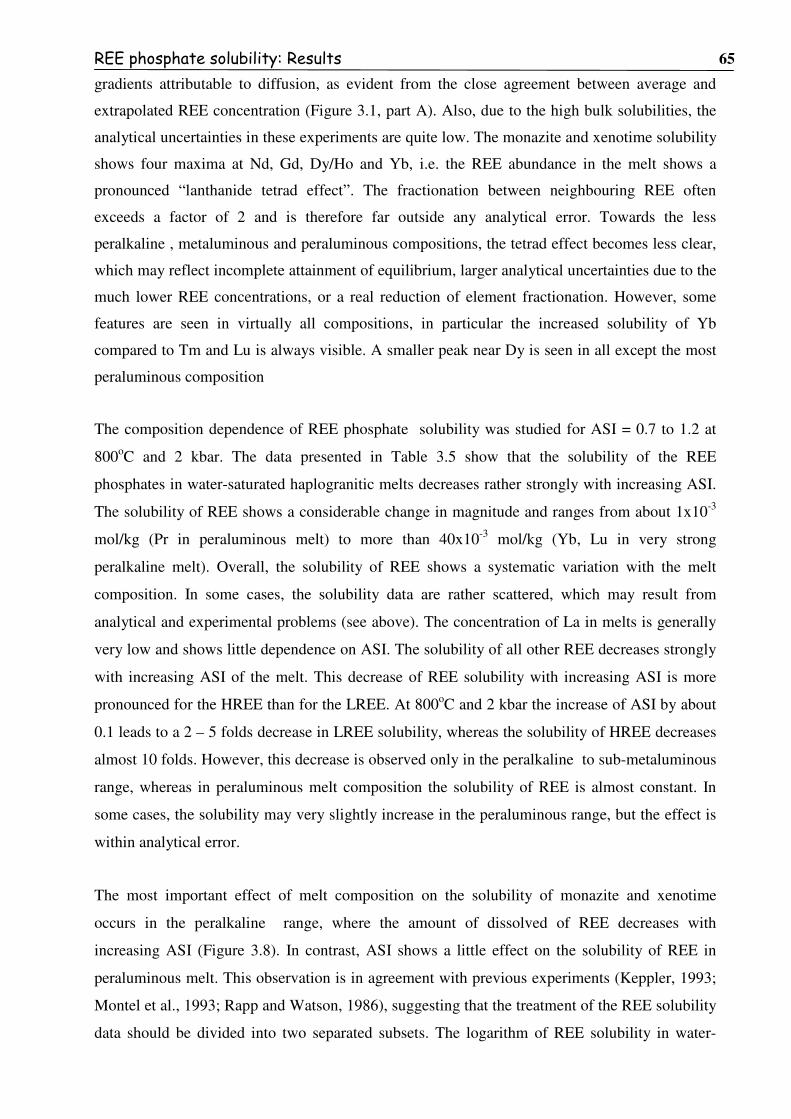
REE phosphate solubility: Results 65
gradients attributable to diffusion, as evident from the close agreement between average and
extrapolated REE concentration (Figure 3.1, part A). Also, due to the high bulk solubilities, the
analytical uncertainties in these experiments are quite low. The monazite and xenotime solubility
shows four maxima at Nd, Gd, Dy/Ho and Yb, i.e. the REE abundance in the melt shows a
pronounced “lanthanide tetrad effect”. The fractionation between neighbouring REE often
exceeds a factor of 2 and is therefore far outside any analytical error. Towards the less
peralkaline , metaluminous and peraluminous compositions, the tetrad effect becomes less clear,
which may reflect incomplete attainment of equilibrium, larger analytical uncertainties due to the
much lower REE concentrations, or a real reduction of element fractionation. However, some
features are seen in virtually all compositions, in particular the increased solubility of Yb
compared to Tm and Lu is always visible. A smaller peak near Dy is seen in all except the most
peraluminous composition
The composition dependence of REE phosphate solubility was studied for ASI = 0.7 to 1.2 at
800oC and 2 kbar. The data presented in Table 3.5 show that the solubility of the REE
phosphates in water-saturated haplogranitic melts decreases rather strongly with increasing ASI.
The solubility of REE shows a considerable change in magnitude and ranges from about 1x10⁻³
mol/kg (Pr in peraluminous melt) to more than 40x10-3 mol/kg (Yb, Lu in very strong
peralkaline melt). Overall, the solubility of REE shows a systematic variation with the melt
composition. In some cases, the solubility data are rather scattered, which may result from
analytical and experimental problems (see above). The concentration of La in melts is generally
very low and shows little dependence on ASI. The solubility of all other REE decreases strongly
with increasing ASI of the melt. This decrease of REE solubility with increasing ASI is more
pronounced for the HREE than for the LREE. At 800oC and 2 kbar the increase of ASI by about
0.1 leads to a 2 – 5 folds decrease in LREE solubility, whereas the solubility of HREE decreases
almost 10 folds. However, this decrease is observed only in the peralkaline to sub-metaluminous
range, whereas in peraluminous melt composition the solubility of REE is almost constant. In
some cases, the solubility may very slightly increase in the peraluminous range, but the effect is
within analytical error.
The most important effect of melt composition on the solubility of monazite and xenotime
occurs in the peralkaline range, where the amount of dissolved of REE decreases with
increasing ASI (Figure 3.8). In contrast, ASI shows a little effect on the solubility of REE in
peraluminous melt. This observation is in agreement with previous experiments (Keppler, 1993;
Montel et al., 1993; Rapp and Watson, 1986), suggesting that the treatment of the REE solubility
data should be divided into two separated subsets. The logarithm of REE solubility in water-

REE phosphate solubility: Results 66
saturated haplogranitic melts decreases linearly with ASI in peralkaline melt composition. The
data can be fitted to a linear equation:
Y = A + Bx (Eq. 3.8)
where Y is the log(REE solubility) in ppm and (x) is the ASI. The fitting results using
extrapolated data and also including data published by Montel (1986) and Keppler (1993) are
summarized in Table 3.10, and the error quoted is one standard deviation.
Table 3.10. Fit parameters for the linear curves describing the dependence of the logarithm of rare earth solubility on aluminium saturation index for peralkaline to metaluminous melts (ASI<1) according to Eq.3.8
Y A B Y A B
La 3.43(0.46) -0.93(0.48) Tb 5.65(0.06) -2.86(0.07)
Ce 4.94(0.26) -2.42(0.33) Dy 6.28(0.30) -3.33(0.34)
Pr 4.40(0.25) - 1.76(0.28) Ho 7.10(0.37) -4.33(0.42)
Nd 6.39(1.37) -3.87(1.55) Er 5.86(0.01) -2.81(0.01)
Sm 5.07(0.35) -2.38(0.42) Tm 6.55(0.38) -3.58(0.43)
Eu 5.91(0.21) -3.13(0.23) Yb 5.99(0.25) -2.74(0.28)
Gd 6.84(0.49) -4.11(0.53) Lu 6.12(0.11) -2.93(0.13)
In general, the agreement of the few available data for pure REE phosphates with the data of the
present study is quite good, in particular, if one considers that the initial phosphorus contents of
the melts in these studies were different.
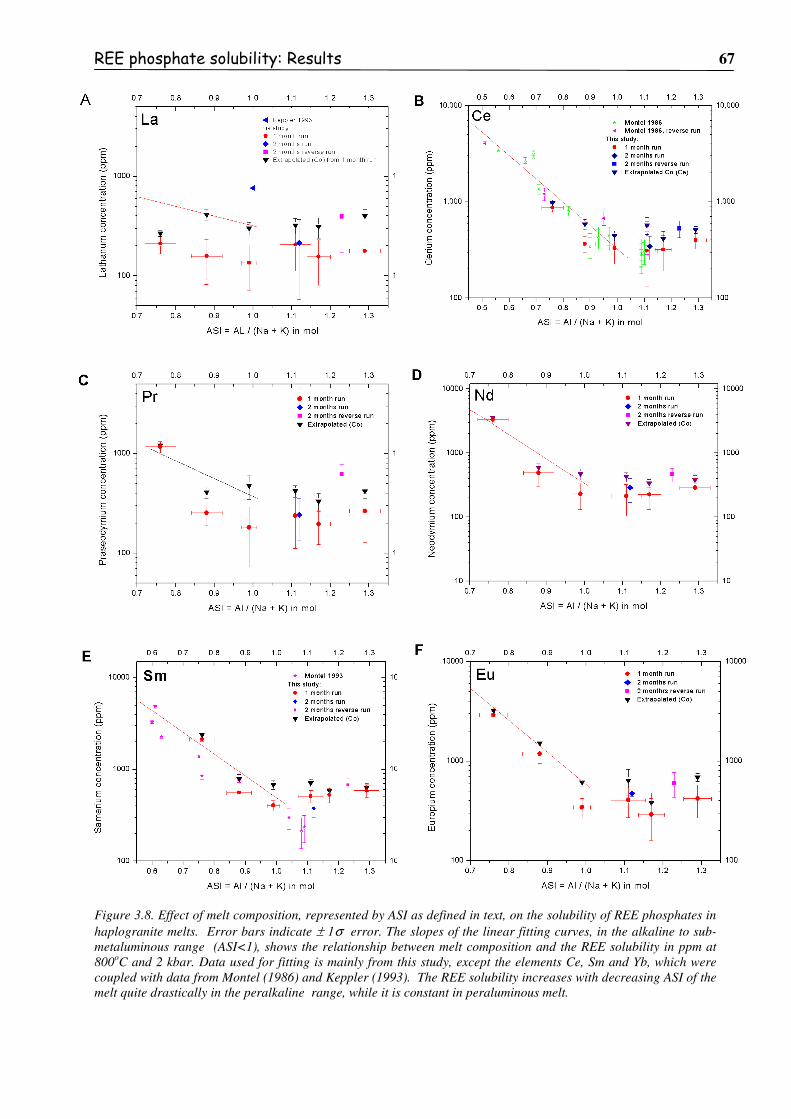
REE phosphate solubility: Results 67
Figure 3.8. Effect of melt composition, represented by ASI as defined in text, on the solubility of REE phosphates in haplogranite melts. Error bars indicate ± 1σ error. The slopes of the linear fitting curves, in the alkaline to sub-metaluminous range (ASI<1), shows the relationship between melt composition and the REE solubility in ppm at 800oC and 2 kbar. Data used for fitting is mainly from this study, except the elements Ce, Sm and Yb, which were coupled with data from Montel (1986) and Keppler (1993). The REE solubility increases with decreasing ASI of the melt quite drastically in the peralkaline range, while it is constant in peraluminous melt.

REE phosphate solubility: Results 68
Figure 3.8 (continued)

REE phosphate solubility: Results 69
3.3. The effect of fluorine on REE solubility in haplogranitic melts
Two series of solubility experiments doped with 2 and 4 wt.% of fluorine were conducted and
the results are given in Table 3.11. The extrapolated results from fitting diffusion profiles are
summarized in Table 3.12. Mica was observed in sample 2F8. The solubility of REE, however,
was not affected by this phase, because the composition of the melt was not significantly
changed.
At 800oC and 2 kbar, the solubility of REE in these melts, as expected, increases with decreasing
ionic radius (Figure 3.9). The trend of solubility is almost the same as for runs without F. The
uncertainty of the analytical results is relatively high (± 100 ppm), especially for the LREE, due
to their low solubility in range of 200-400 ppm. Figure 3.9 shows that the REE solubility in F-
bearing granitic melt as derived from the extrapolation of measured diffusion profiles is only
about 100-200 ppm higher than the average microprobe analyses, implying that these
experimental data are close to the equilibrium. Their solubility, however, is a little bit lower than
in the melt without F. This is possibly related to the enhancement of diffusion rates by fluorine.
The data show a very week fluorine dependence of the REE solubility in granitic melts. Keppler
(1993) already concluded that fluorine has virtually no effect on monazite and xenotime
solubility. The data from Keppler (1993), however, show more scatter and they are generally
higher than those of the present study.
Figure 3.9. Monazite and xenotime solubility in hydrous haplogranitic melt doped with 2 and 4 wt.% at 800oC and 2 kbar
Figure 3.10 directly compares the solubility of individual REE phosphates with and without
fluorine. In general, the results show a slight decrease of REE solubility with increasing F. The
relationship between monazite or xenotime solubility and fluorine content can be described by a
linear equation.
Y = A + Bx (Eq. 3.9)
where: Y is the log Ksp (mol2/kg2) and X is the F concentration in wt.%. The fitting results are
listed in Table 3.13 and illustrated in Figure 3.10
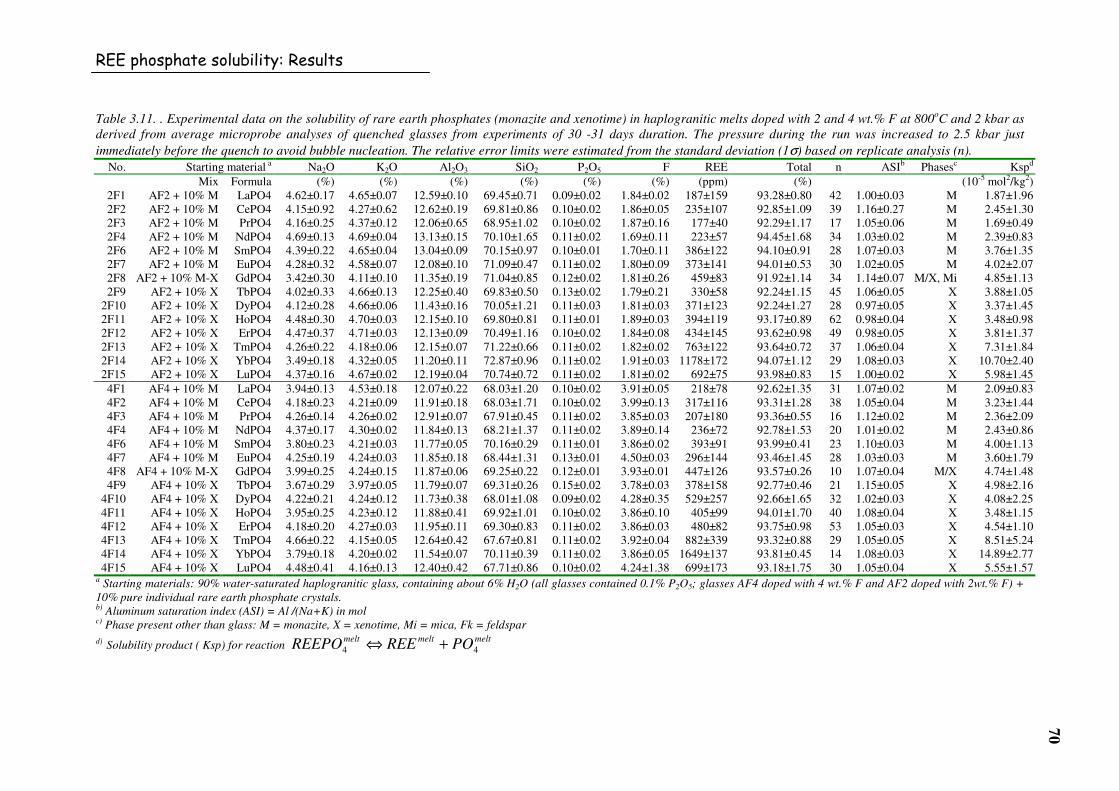
REE phosphate solubility: Results
70
Table 3.11. . Experimental data on the solubility of rare earth phosphates (monazite and xenotime) in haplogranitic melts doped with 2 and 4 wt.% F at 800oC and 2 kbar as derived from average microprobe analyses of quenched glasses from experiments of 30 -31 days duration. The pressure during the run was increased to 2.5 kbar just immediately before the quench to avoid bubble nucleation. The relative error limits were estimated from the standard deviation (1σ) based on replicate analysis (n).
No. Starting material a Na2O K2O Al2O3 SiO2 P2O5 F REE Total n ASIb Phasesc Kspd Mix Formula (%) (%) (%) (%) (%) (%) (ppm) (%) (10-5 mol2/kg2)
2F1 AF2 + 10% M LaPO4 4.62±0.17 4.65±0.07 12.59±0.10 69.45±0.71 0.09±0.02 1.84±0.02 187±159 93.28±0.80 42 1.00±0.03 M 1.87±1.96 2F2 AF2 + 10% M CePO4 4.15±0.92 4.27±0.62 12.62±0.19 69.81±0.86 0.10±0.02 1.86±0.05 235±107 92.85±1.09 39 1.16±0.27 M 2.45±1.30 2F3 AF2 + 10% M PrPO4 4.16±0.25 4.37±0.12 12.06±0.65 68.95±1.02 0.10±0.02 1.87±0.16 177±40 92.29±1.17 17 1.05±0.06 M 1.69±0.49 2F4 AF2 + 10% M NdPO4 4.69±0.13 4.69±0.04 13.13±0.15 70.10±1.65 0.11±0.02 1.69±0.11 223±57 94.45±1.68 34 1.03±0.02 M 2.39±0.83 2F6 AF2 + 10% M SmPO4 4.39±0.22 4.65±0.04 13.04±0.09 70.15±0.97 0.10±0.01 1.70±0.11 386±122 94.10±0.91 28 1.07±0.03 M 3.76±1.35 2F7 AF2 + 10% M EuPO4 4.28±0.32 4.58±0.07 12.08±0.10 71.09±0.47 0.11±0.02 1.80±0.09 373±141 94.01±0.53 30 1.02±0.05 M 4.02±2.07 2F8 AF2 + 10% M-X GdPO4 3.42±0.30 4.11±0.10 11.35±0.19 71.04±0.85 0.12±0.02 1.81±0.26 459±83 91.92±1.14 34 1.14±0.07 M/X, Mi 4.85±1.13 2F9 AF2 + 10% X TbPO4 4.02±0.33 4.66±0.13 12.25±0.40 69.83±0.50 0.13±0.02 1.79±0.21 330±58 92.24±1.15 45 1.06±0.05 X 3.88±1.05
2F10 AF2 + 10% X DyPO4 4.12±0.28 4.66±0.06 11.43±0.16 70.05±1.21 0.11±0.03 1.81±0.03 371±123 92.24±1.27 28 0.97±0.05 X 3.37±1.45 2F11 AF2 + 10% X HoPO4 4.48±0.30 4.70±0.03 12.15±0.10 69.80±0.81 0.11±0.01 1.89±0.03 394±119 93.17±0.89 62 0.98±0.04 X 3.48±0.98 2F12 AF2 + 10% X ErPO4 4.47±0.37 4.71±0.03 12.13±0.09 70.49±1.16 0.10±0.02 1.84±0.08 434±145 93.62±0.98 49 0.98±0.05 X 3.81±1.37 2F13 AF2 + 10% X TmPO4 4.26±0.22 4.18±0.06 12.15±0.07 71.22±0.66 0.11±0.02 1.82±0.02 763±122 93.64±0.72 37 1.06±0.04 X 7.31±1.84 2F14 AF2 + 10% X YbPO4 3.49±0.18 4.32±0.05 11.20±0.11 72.87±0.96 0.11±0.02 1.91±0.03 1178±172 94.07±1.12 29 1.08±0.03 X 10.70±2.40 2F15 AF2 + 10% X LuPO4 4.37±0.16 4.67±0.02 12.19±0.04 70.74±0.72 0.11±0.02 1.81±0.02 692±75 93.98±0.83 15 1.00±0.02 X 5.98±1.45 4F1 AF4 + 10% M LaPO4 3.94±0.13 4.53±0.18 12.07±0.22 68.03±1.20 0.10±0.02 3.91±0.05 218±78 92.62±1.35 31 1.07±0.02 M 2.09±0.83 4F2 AF4 + 10% M CePO4 4.18±0.23 4.21±0.09 11.91±0.18 68.03±1.71 0.10±0.02 3.99±0.13 317±116 93.31±1.28 38 1.05±0.04 M 3.23±1.44 4F3 AF4 + 10% M PrPO4 4.26±0.14 4.26±0.02 12.91±0.07 67.91±0.45 0.11±0.02 3.85±0.03 207±180 93.36±0.55 16 1.12±0.02 M 2.36±2.09 4F4 AF4 + 10% M NdPO4 4.37±0.17 4.30±0.02 11.84±0.13 68.21±1.37 0.11±0.02 3.89±0.14 236±72 92.78±1.53 20 1.01±0.02 M 2.43±0.86 4F6 AF4 + 10% M SmPO4 3.80±0.23 4.21±0.03 11.77±0.05 70.16±0.29 0.11±0.01 3.86±0.02 393±91 93.99±0.41 23 1.10±0.03 M 4.00±1.13 4F7 AF4 + 10% M EuPO4 4.25±0.19 4.24±0.03 11.85±0.18 68.44±1.31 0.13±0.01 4.50±0.03 296±144 93.46±1.45 28 1.03±0.03 M 3.60±1.79 4F8 AF4 + 10% M-X GdPO4 3.99±0.25 4.24±0.15 11.87±0.06 69.25±0.22 0.12±0.01 3.93±0.01 447±126 93.57±0.26 10 1.07±0.04 M/X 4.74±1.48 4F9 AF4 + 10% X TbPO4 3.67±0.29 3.97±0.05 11.79±0.07 69.31±0.26 0.15±0.02 3.78±0.03 378±158 92.77±0.46 21 1.15±0.05 X 4.98±2.16
4F10 AF4 + 10% X DyPO4 4.22±0.21 4.24±0.12 11.73±0.38 68.01±1.08 0.09±0.02 4.28±0.35 529±257 92.66±1.65 32 1.02±0.03 X 4.08±2.25 4F11 AF4 + 10% X HoPO4 3.95±0.25 4.23±0.12 11.88±0.41 69.92±1.01 0.10±0.02 3.86±0.10 405±99 94.01±1.70 40 1.08±0.04 X 3.48±1.15 4F12 AF4 + 10% X ErPO4 4.18±0.20 4.27±0.03 11.95±0.11 69.30±0.83 0.11±0.02 3.86±0.03 480±82 93.75±0.98 53 1.05±0.03 X 4.54±1.10 4F13 AF4 + 10% X TmPO4 4.66±0.22 4.15±0.05 12.64±0.42 67.67±0.81 0.11±0.02 3.92±0.04 882±339 93.32±0.88 29 1.05±0.05 X 8.51±5.24 4F14 AF4 + 10% X YbPO4 3.79±0.18 4.20±0.02 11.54±0.07 70.11±0.39 0.11±0.02 3.86±0.05 1649±137 93.81±0.45 14 1.08±0.03 X 14.89±2.77 4F15 AF4 + 10% X LuPO4 4.48±0.41 4.16±0.13 12.40±0.42 67.71±0.86 0.10±0.02 4.24±1.38 699±173 93.18±1.75 30 1.05±0.04 X 5.55±1.57
a Starting materials: 90% water-saturated haplogranitic glass, containing about 6% H2O (all glasses contained 0.1% P2O5; glasses AF4 doped with 4 wt.% F and AF2 doped with 2wt.% F) + 10% pure individual rare earth phosphate crystals. b) Aluminum saturation index (ASI) = Al /(Na+K) in mol c) Phase present other than glass: M = monazite, X = xenotime, Mi = mica, Fk = feldspar d) Solubility product ( Ksp) for reaction meltmeltmelt POREEREEPO 44 +⇔

REE phosphate solubility: Results 71
Table 3.12. Experimental data on the solubility of rare earth phosphates (monazite and xenotime) in haplogranitic melts doped with 2 and 4 wt.% F at 800oC and 2 kbar as derived from the extrapolation of measured diffusion profiles (Co).
Run No. Average (REE) Co (REE) Diffusivities Solubility product (Ksp)*
(ppm) (ppm) (10-11 cm2/s) (10-5 mol2/kg2)
2F1 187±159 388±85 0.82±0.41 3.72±0.14
2F2 235±107 436±58 3.02±1.43 4.50±0.11
2F3 177±40 437±62 1.21±0.42 4.12±0.09
2F4 223±57 329±41 2.58±1.22 3.51±0.08
2F6 386±122 502±50 5.66±3.06 4.86±0.06
2F7 373±141 588±79 3.76±2.17 6.16±0.16
2F8 459±83 607±41 19.55±14.7 6.41±0.06
2F9 330±58 519±36 5.85±2.22 6.07±0.07
2F10 371±123 482±66 2.85±1.45 4.34±0.15
2F11 394±119 417±36 9.44±4.12 3.21±0.03
2F12 434±145 571±56 8.20±5.27 5.04±0.08
2F13 763±122 992±59 8.07±3.82 9.48±0.10
2F14 1178±172 1238±102 5.04±3.24 11.22±0.14
2F15 692±75 1014±139 5.25±4.32 8.72±0.23
4F1 218±78 472±74 1.50±0.70 4.58±0.14
4F2 317±116 517±64 4.79±2.39 5.21±0.13
4F3 207±180 564±88 0.43±0.13 6.40±0.15
4F4 236±72 376±59 5.88±4.42 3.90±0.11
4F6 393±91 501±41 8.36±4.84 5.09±0.06
4F7 296±144 498±84 3.39±2.10 6.06±0.10
4F8 447±126 598±91 7.09±6.32 6.33±0.07
4F9 378±158 593±72 3.70±1.73 7.82±0.11
4F10 529±257 744±122 5.48±5.43 5.80±0.19
4F11 405±99 478±31 40.43±26.5 4.08±0.05
4F12 480±82 568±48 46.32±54.7 5.37±0.08
4F13 882±339 1308±225 5.19±4.82 11.59±0.31
4F14 1649±137 1796±167 8.27±7.21 16.21±0.24
4F15 699±173 1469±301 1.61±0.98 11.80±0.53
* Solubility product using reaction meltmeltmelt POREEREEPO 44 +⇔
Table 3.13. Fit parameters for the linear equation (Eq.3.9) relating REE phosphate solubility to fluorine content.
LREE: Y = -3.42(0.13)-0.33(0.01)X HREE: Y = -3.17(0.15)-0.34(0.03)X
A Error B Error A Error B Error La -3.54 0.17 -0.32 0.06 Tb -3.26 0.24 -0.33 0.12 Ce -3.34 0.07 -0.35 0.04 Dy -3.28 0.08 -0.39 0.05 Pr -3.58 0.22 -0.36 0.11 Ho -3.33 0.08 -0.36 0.04 Nd -3.55 0.20 -0.33 0.10 Er -3.22 0.03 -0.33 0.03 Sm -3.36 0.20 -0.32 0.10 Tm -3.18 0.06 -0.33 0.04 Eu -3.34 0.17 -0.34 0.09 Yb -2.93 0.23 -0.29 0.11 Gd -3.25 0.18 -0.33 0.09 Lu -2.99 0.23 -0.38 0.12
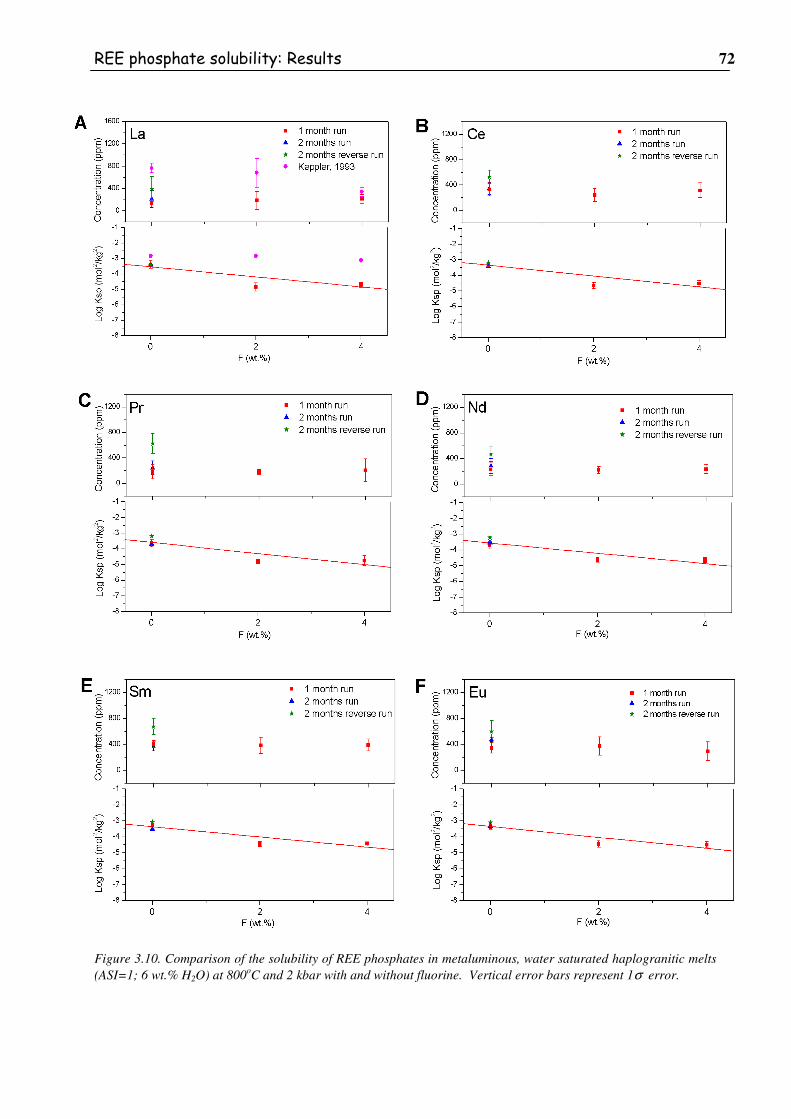
REE phosphate solubility: Results 72
Figure 3.10. Comparison of the solubility of REE phosphates in metaluminous, water saturated haplogranitic melts (ASI=1; 6 wt.% H2O) at 800oC and 2 kbar with and without fluorine. Vertical error bars represent 1σ error.

REE phosphate solubility: Results 73
Figure 3.10 (continued)

REE phosphate solubility: Results 74
3.4. The effect of temperature on solubility
For the composition with ASI = 1.1 – 1.2, two sets of experiments were carried out at 1100 ˚C and
800 ˚C. The results are compared in Figure 3.11. The data at 1100˚C are very likely close to
equilibrium. They show an increase of solubility from La to Lu with a superimposed tetrad effect.
Figure 3.11. Monazite and xenotime solubility in hydrous haplogranitic melts at 800 and 1100 ˚C as derived from average electron microprobe analyses of run products. Error bars indicate standard deviations of replicated measurement.
Previous experimental solubility data of monazite and xenotime in silicate melt in a wide range of
temperature from 1000-1400oC (Hahn et al., 2005; Rapp and Watson, 1986), through 800-1000oC
(Keppler, 1993; Montel, 1986; Montel et al., 1993; Rapp and Watson, 1986), to 750oC (Wolf and
London, 1995) are roughly in agreement with this study and show that temperature is the most
important parameter affecting the solubility of monazite/xenotime in the melt. A small variation of
temperature can cause a significant change in monazite solubility in melt (Figure 3.11 and Figure
3.12).

REE phosphate solubility: Results 75
The REE solubility increases with increasing temperature by about two orders of magnitude from
800oC to 1400oC. The temperature dependence can be described by the equation:
Y = A + Bx (Eq. 3.10)
where: Y is the log REE (ppm) and X is the 104/T in Kelvin. The fitting results are listed in Table
3.14 and illustrated in Figure 3.12.
Table 3.14. Fit parameters for the linear equation (Eq.3.10) describing the temperature dependence of monazite solubility in hydrous, metaluminous granitic melts.
A Error B Error R2 A Error B Error R2
La 5.95 0.21 -0.40 0.03 0.96 Sm 5.75 0.31 -0.33 0.04 0.91 Ce 5.94 0.19 -0.37 0.03 0.95 Gd 5.54 0.51 -0.31 0.06 0.88
Figure 3.12. The effect of temperature on REE solubility in hydrous granitic melts. ASI refers to the molar Al/(Na+K) ratio of the melt. The nominal composition of starting materials has ASI = 1.

REE phosphate solubility: Discussion and geological applications 76
4. Discussion and geological applications
4.1. The dissolution mechanism of monazite and xenotime in haplogranitic melts
One important result of this study is that monazite solubility depends on the phosphorus content of
the melt. As pointed out in chapter 3.1., the dependence can be fully described by a model, which
assumes that the REE dissolves partially as undissociated REEPO4 species and only a part of them
dissociates into REE3+ and PO43-. Also, the constants, which describe both dissolution mechanisms,
depend on composition.
Monazite and xenotime solubility increase strongly with the per-alkalinity of the melt. As noted in
chapter 3.1, this increase is primarily due in the concentration of ionic species, i.e. the REE3+
cations. Such cations can only be dissolved in a silicate melt, if suitable anions are available for
charge balance. A water-free haplogranitic melt with a Al/(Na+K) = 1 is fully polymerized, and no
non-bridging oxygen atoms are available to charge-compensate dissolved REE3+ ions. If excess
Na2O or K2O are introduced into the melt, non-bridging oxygen atoms are produced by
depolymerization:
– Si – O – Si – + Na2O = – Si – O – Na + Na – O – Si – (Eq. 4.1)
The non-bridging oxygen atoms which are originally coordinated with Na can then easily exchange
Na+ against REE3+ and thereby stabilize rare earth cations in the silicate melt:
3 (– Si – O – Na) + REE3+ = (– Si – O – )3REE + 3 Na+ (Eq. 4.2)
The enhanced solubility of monazite and xenotime in peralkaline melts is therefore not surprising
and similar mechanisms have been invoked to explain the increase of the solubility of minerals such
a zircon or rutile in peralkaline melts.
More difficult to explain is the fact that monazite and xenotime solubility does not increase
significantly in peraluminous melts, i.e. with an excess of Al2O3 over Na2O and K2O, since this
excess should also lead to a depolymerization of the melt and the formation on non-bridging oxygen
atoms according to
3 (– Si – O – Si – ) + Al2O3 = 2 (– Si – O – )3Al (Eq. 4.3)
However, the non-bridging oxygen atoms formed by this reaction are not coordinated by Na+ or K+,
but by Al3+. Because of the smaller size and higher charge of Al3+ as compared to Na+ and K+, the
chemical bond between Al3+ and the non-bridging oxygen atoms is likely to be much stronger and
these Al3+ ions are therefore not easily exchanged by REE3+ as the equation:

REE phosphate solubility: Discussion and geological applications 77
(– Si – O – )3Al + REE3+ = (– Si – O – )3REE + Al3+ (Eq. 4.4)
In other words, the reaction (Eq.4.4) probably does not easily proceed to the right hand side and
therefore, REE3+ ions are not easily dissolved in peraluminous melts.
The data in Figure 3.12 and 3.13 shows that fluorine has only a very minor effect on monazite and
xenotime solubility. While Keppler (1993) suggested that the solubility does not change with
fluorine at all, the new data actually suggest that fluorine actually slightly reduces monazite and
xenotime solubility, a rather surprising result. This observation clearly rules out any complexing of
REE by fluorine in the melt, as complexing would always increase solubility. The decrease in
solubility must be due to some indirect effects, possibly related to coordination changes of Al in the
melt, which have been demonstrated in nuclear magnetic resonance (NMR) studies of quenched
haplogranitic glasses (e.g. Schaller et al., 1992).
4.2. Rare earth element fractionation by monazite and xenotime
The partition coefficients of individual REE between monazite or xenotime and melt can be
calculated from the solubility data obtained in this study, if one assumes that the various REE in
monazite or xenotime mix nearly ideally. In the light of the identical charge and very similar ionic
radius of the light REE entering monazite and of the heavy REE entering xenotime, this is probably
a very reasonable assumption. The solubility data (in ppm REE) shown in Figure 3.7 and several
subsequent figures are therefore approximately proportional to the inverse of the monazite/melt and
xenotime/melt partition coefficients, i.e. they show directly the relative enrichment pattern that is to
be expected for a melt coexisting with monazite and xenotime. Those REE with a higher solubility
of the pure individual REEPO4 in the melt will partition more strongly into the melt when it is in
equilibrium with a monazite or xenotime solid solution. On the other hand, those REE with lower
solubility of the corresponding pure phosphate will partition less into the melt.
Rare earth elements are normally incompatible, with the exception of some heavy REE that are
compatible in garnet and only mildly incompatible in clinopyroxene and amphibole (see chapter 1
and references therein). Fractionation of normal ferromagnesian minerals will therefore lead to an
enrichment of the light REE in the residual melt. The effect of monazite and xenotime on REE
fractionation, as shown by the experimental data in chapter 3, is opposite to this trend. The rare
earth phosphates of the heavy REE are more soluble than the light REE. This means that in
equilibrium with a monazite or xenotime solid solution, the heavy REE will partition more strongly
into the melt phase.

REE phosphate solubility: Discussion and geological applications 78
This means that it should be easy to distinguish whether some feslsic magma has already
fractionated monazite or not. Monazite fractionation as well as the simultaneous fractionation of
monazite and xenotime should ultimately lead to an REE pattern with distinct enrichment of the
heavy REE over the light REE. However, when interpreting the actual REE pattern of a granitic
magma, it should be kept in mind that most primary magmas have probably inherited a light REE
enrichment from their source. Partial melting of a primitive mantle source leads to a light REE
enrichment in the magma an subsequent fractionation of ferromagnesian minerals will further
enhance this LREE enrichment. Therefore, most protoliths for the generation of granitic magmas
will be LREE enriched, even if the granite is not of the A type which can sometimes be traced back
to the direct differentiation of a mantle-derived magma.
The most likely effect of monazite or combined monazite or xenotime fractionation is therefore that
it will gradually change a REE pattern with light REE enrichment into a more or less flat pattern
until finally a heavy REE enriched pattern is obtained. This change in slope of the REE pattern is
indeed seen in some highly evolved granites when they are compared to their primitive types (e.g.
Irber, 1999). Interestingly, the granites with flat or heavy REE enriched patterns often show a clear
lanthanide tetrad effect.
4.3. The origin of the lanthanide tetrad effect in granitic rocks
Some highly evolved granites show rare earth abundance patterns that are not smooth; sometimes
these patterns appear to be separated into four segments, the “tetrades”(e. g. Masuda & Akagi 1989,
Lee et al. 1994, Kawabe 1995, Bau 1996, Jahn et al. 2001, Liu & Zhang 2005). This “lanthanide
tetrad effect” has been reported since a long lime, but it was sometimes dismissed as analytical
artifact. With recent advances in trace element analyses, however, it is unquestionable that the
effect is real. Since it usually occurs in volatile-rich, highly fractionated granites, the lanthanide
tetrad effect has often been attributed to fluid interaction (e.g. Bau 1996). Sometimes the
appearance of such a tetrad effect was even believed to be diagnostic for granitic magmas that have
interacted with a fluid. In an experimental study, Veksler et at. (2005) observed some weak
lanthanide tetrad effect in the partitioning of REE between silicate melts and fluoride melts and
suggested that immiscible fluoride melts are responsible for the origin of the tetrad effect in natural
granites. However, field evidence for such immiscible fluoride melts has never been observed.
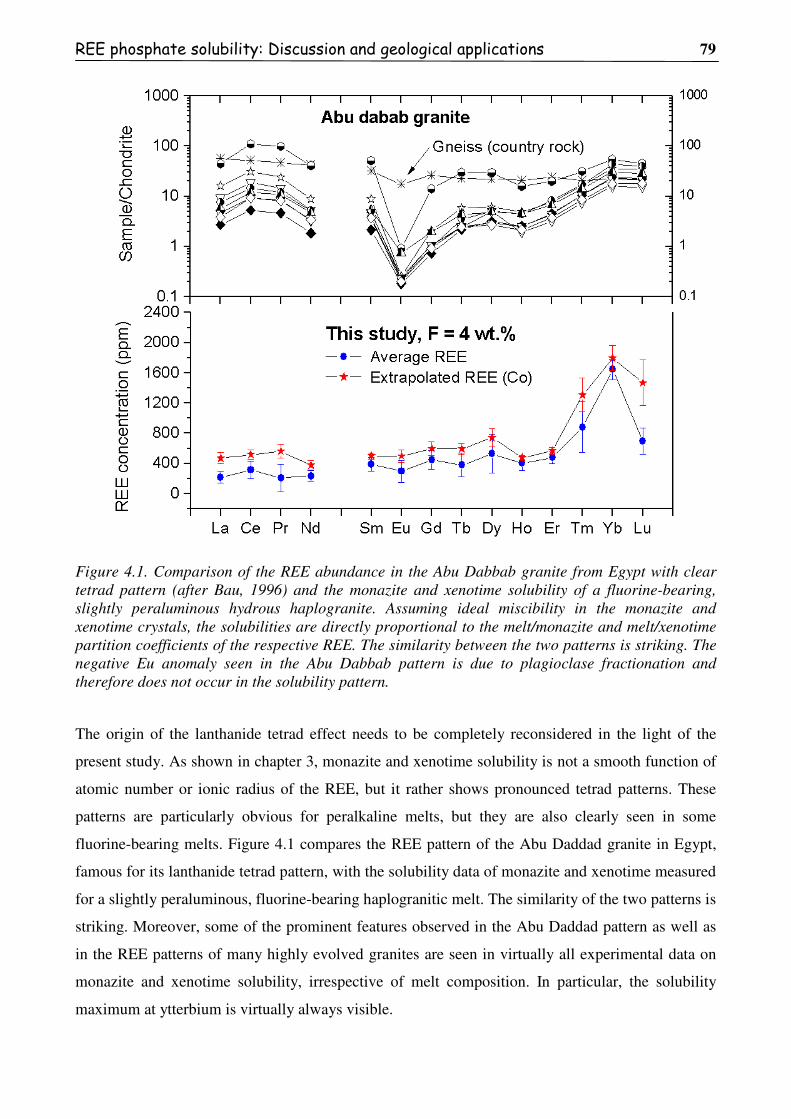
REE phosphate solubility: Discussion and geological applications 79
Figure 4.1. Comparison of the REE abundance in the Abu Dabbab granite from Egypt with clear tetrad pattern (after Bau, 1996) and the monazite and xenotime solubility of a fluorine-bearing, slightly peraluminous hydrous haplogranite. Assuming ideal miscibility in the monazite and xenotime crystals, the solubilities are directly proportional to the melt/monazite and melt/xenotime partition coefficients of the respective REE. The similarity between the two patterns is striking. The negative Eu anomaly seen in the Abu Dabbab pattern is due to plagioclase fractionation and therefore does not occur in the solubility pattern.
The origin of the lanthanide tetrad effect needs to be completely reconsidered in the light of the
present study. As shown in chapter 3, monazite and xenotime solubility is not a smooth function of
atomic number or ionic radius of the REE, but it rather shows pronounced tetrad patterns. These
patterns are particularly obvious for peralkaline melts, but they are also clearly seen in some
fluorine-bearing melts. Figure 4.1 compares the REE pattern of the Abu Daddad granite in Egypt,
famous for its lanthanide tetrad pattern, with the solubility data of monazite and xenotime measured
for a slightly peraluminous, fluorine-bearing haplogranitic melt. The similarity of the two patterns is
striking. Moreover, some of the prominent features observed in the Abu Daddad pattern as well as
in the REE patterns of many highly evolved granites are seen in virtually all experimental data on
monazite and xenotime solubility, irrespective of melt composition. In particular, the solubility
maximum at ytterbium is virtually always visible.
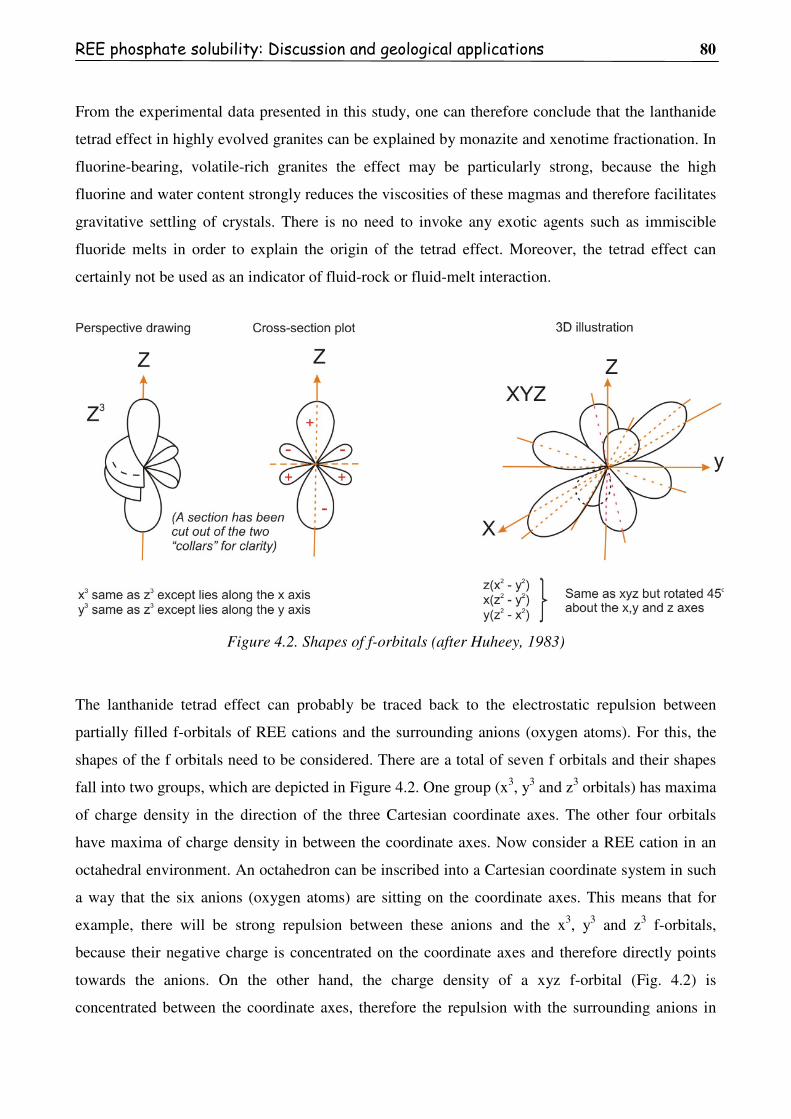
REE phosphate solubility: Discussion and geological applications 80
From the experimental data presented in this study, one can therefore conclude that the lanthanide
tetrad effect in highly evolved granites can be explained by monazite and xenotime fractionation. In
fluorine-bearing, volatile-rich granites the effect may be particularly strong, because the high
fluorine and water content strongly reduces the viscosities of these magmas and therefore facilitates
gravitative settling of crystals. There is no need to invoke any exotic agents such as immiscible
fluoride melts in order to explain the origin of the tetrad effect. Moreover, the tetrad effect can
certainly not be used as an indicator of fluid-rock or fluid-melt interaction.
Figure 4.2. Shapes of f-orbitals (after Huheey, 1983)
The lanthanide tetrad effect can probably be traced back to the electrostatic repulsion between
partially filled f-orbitals of REE cations and the surrounding anions (oxygen atoms). For this, the
shapes of the f orbitals need to be considered. There are a total of seven f orbitals and their shapes
fall into two groups, which are depicted in Figure 4.2. One group (x3, y3 and z3 orbitals) has maxima
of charge density in the direction of the three Cartesian coordinate axes. The other four orbitals
have maxima of charge density in between the coordinate axes. Now consider a REE cation in an
octahedral environment. An octahedron can be inscribed into a Cartesian coordinate system in such
a way that the six anions (oxygen atoms) are sitting on the coordinate axes. This means that for
example, there will be strong repulsion between these anions and the x3, y3 and z3 f-orbitals,
because their negative charge is concentrated on the coordinate axes and therefore directly points
towards the anions. On the other hand, the charge density of a xyz f-orbital (Fig. 4.2) is
concentrated between the coordinate axes, therefore the repulsion with the surrounding anions in

REE phosphate solubility: Discussion and geological applications 81
octahedral coordination will be small. In an octahedral coordination environment, a REE cation
with filled x3, y3 or z3 f-orbitals will therefore be less stable than a REE ion with filled xyz orbital.
However, for a cubic, eight-fold coordination, the situation is reversed: the eight lobes of the xyz f-
orbital (Fig. 4.2) point exactly into the corner of a cube, where the coordinating anions are located.
Due to electronic repulsion, a REE with a filled yxz orbital is therefore destabilized in an eightfold
coordinated environment, while a REE with filled x3, y3 or z3 orbital experiences much less
electronic repulsion in cubic coordination geometry.
From the consideration outlined above it is obvious that the preference of a given REE cation for
octahedral or cubic coordination will depend on the type of f-orbital filled and the partition
coefficients between two phases with different coordination environment will therefore depend on
the precise electronic configuration, not just on ionic radius. This is probably the essential physics
behind the lanthanide tetrad effect. An essential requirement for this effect to occur is therefore that
the coordination geometry of the REE between the phases of interest is different. This explains why
monazite or xenotime fractionation produces a tetrad effect. The coordination number of middle and
heavy REE in most silicate glasses is around 6 (Ponader and Brown, 1989). In xenotime, however,
the REE occupy a very unusual, asymmetric eightfold-coordinated environment and in monazite,
they are in a very unusual nine-fold coordination. The appearance of a tetrad effect during the
fractionation between these phases and silicate melts is therefore not surprising. On the other hand,
in most ferromagnesian minerals, such as clinopyroxene or garnet, the REE occupy octahedral sites
similar to their environment in silicate melts and not surprisingly, the partitioning between these
phases and the melt is exclusively controlled by ionic radius.
4.4. The use of monazite solubilities as geothermometer
Temperature clearly has a strong effect on monazite solubility in granitic melts (see chapter 3.4).
Accordingly, the REE content of a quenched granitic melt that once was in equilibrium with
monazite could in principle be used to estimate temperature. Montel (1993) proposed an equation
(Eq.1.2) (see chapter 1.7.3), which calculates monazite solubility based on temperature, water
content and bulk composition of the melt only.
According to the results of the present study, this equation has a number of problems:
(1) It does not take into account that monazite solubility depends on phosphorus content. As pointed
out in chapter 3.1., monazite dissolves in granitic melt as both ionic and molecular species (REE3+
and REEPO4). In order to fully describe this reaction, two separate equilibrium constants need to be
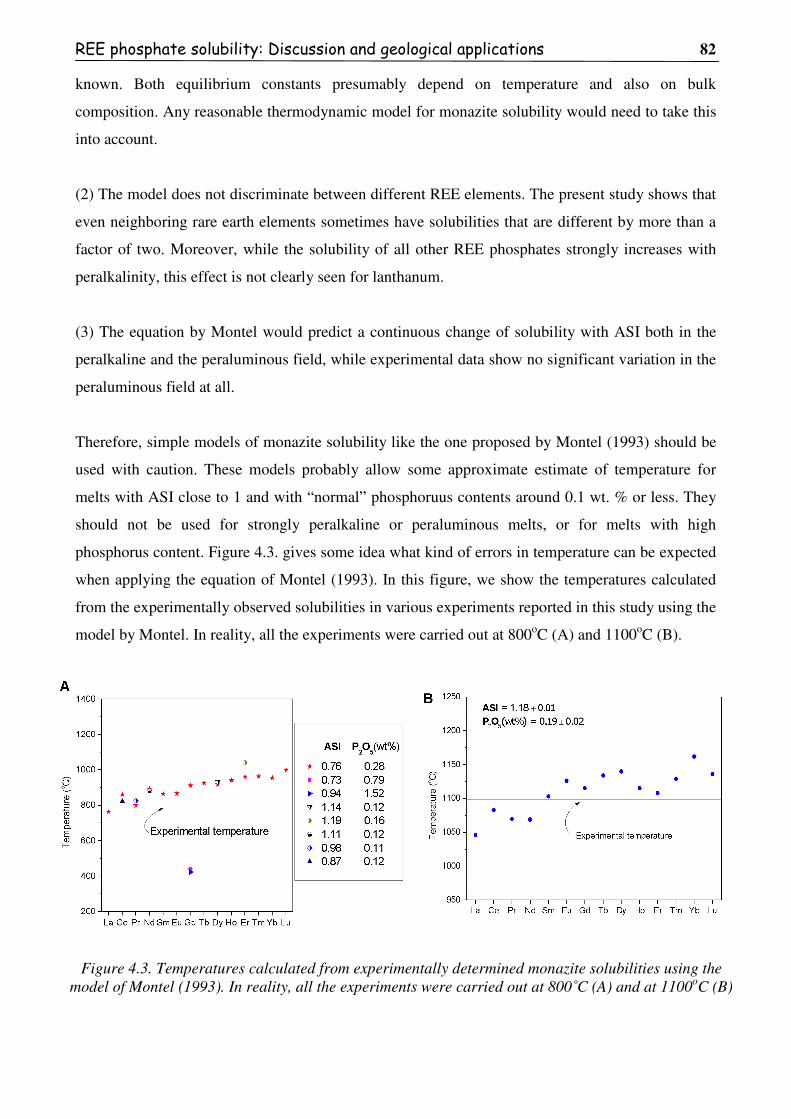
REE phosphate solubility: Discussion and geological applications 82
known. Both equilibrium constants presumably depend on temperature and also on bulk
composition. Any reasonable thermodynamic model for monazite solubility would need to take this
into account.
(2) The model does not discriminate between different REE elements. The present study shows that
even neighboring rare earth elements sometimes have solubilities that are different by more than a
factor of two. Moreover, while the solubility of all other REE phosphates strongly increases with
peralkalinity, this effect is not clearly seen for lanthanum.
(3) The equation by Montel would predict a continuous change of solubility with ASI both in the
peralkaline and the peraluminous field, while experimental data show no significant variation in the
peraluminous field at all.
Therefore, simple models of monazite solubility like the one proposed by Montel (1993) should be
used with caution. These models probably allow some approximate estimate of temperature for
melts with ASI close to 1 and with “normal” phosphoruus contents around 0.1 wt. % or less. They
should not be used for strongly peralkaline or peraluminous melts, or for melts with high
phosphorus content. Figure 4.3. gives some idea what kind of errors in temperature can be expected
when applying the equation of Montel (1993). In this figure, we show the temperatures calculated
from the experimentally observed solubilities in various experiments reported in this study using the
model by Montel. In reality, all the experiments were carried out at 800oC (A) and 1100oC (B).
Figure 4.3. Temperatures calculated from experimentally determined monazite solubilities using the model of Montel (1993). In reality, all the experiments were carried out at 800˚C (A) and at 1100oC (B)
83
References
1. Adam J. et al. (1994) The effects of pressure and temperature on the partitioning of Ti, Sr and REE between amphibole, clinopyroxene and basanitic melts. In Trace-element partitioning with application to magmatic processes. Elsevier, Amsterdam, Netherlands, pp. 219-233.
2. Adam J., Green T. H., and Ulmer-Peter c. (2003) The influence of pressure, mineral composition and water on trace element partitioning between clinopyroxene, amphibole and basanitic melts. In Ninth international symposium on Experimental mineralogy, petrology and geochemistry. Schweizerbart'sche Verlagsbuchhandlung (Naegele u, Obermiller). Stuttgart, Federal Republic of Germany, pp. 831-841.
3. Akagi T., Shabani M., and Masuda A. (1993) Lanthanide tetrad effect in kimuraite [CaY2(CO3)4.6H2O]; implication for a new geochemical index. Geochimica et Cosmochimica Acta 57, 2899-2905.
4. Aller L. H. (1987) Chemical abundances. In Spectroscopy of Astrophysical Plasmas (eds. A. Dalgarno and D. Layzer). Cambridge University Press, pp. 89-124.
5. Anderson A. (1961) Thorium mineralization in the Lemhi Pass area, Lemhi County, Idaho. Economic Geology and the Bulletin of the Society of Economic Geologists 56, 177-197.
6. Anderson D. L., Zhang Y. S., and Tanimoto T. (1992) Plume heads, continental lithosphere, flood basalts and tomography. In Magmatism and the Causes of Continental Break-up, vol 68 (eds. B.C.Storey, T.Alabaster, and R.J.Pankhurst). Geol. Soc. Lond., London, pp. 99-124.
7. Andreoli M., Smith C., Watkeys M., Moore J., Ashwal L., and Hart R. (1994) The geology of the Steenkampskraal monazite deposit, South Africa; implications for REE-Th-Cu mineralization in charnockite-granulite terranes. Economic Geology and the Bulletin of the Society of Economic Geologists 89, 994-1016.
8. Barth M. G., Foley S. F., and Horn I. (1997) Experimental trace-element partitioning in tonalitic systems. In Seventh annual V. M. Goldschmidt conference Lunar and Planetary Institute, Houston, TX, United States, p. 18.
9. Bau M. (1996) Controls on the fractionation of isovalent trace elements in magmatic and aqueous systems: Evidence from Y/Ho, Zr/Hf, and lanthanide tetrad effect. Contributions to Mineralogy and Petrology 123, 323-333.
10. Bau M. (1997) The lanthanide tetrad effect in highly evolved felsic igneous rocks - a reply to the comment by Y. Pan. Contributions to Mineralogy and Petrology 128, 409-412.
11. Bea F. (1996) Residence of REE, Y, Th and U in granites and crustal protoliths; implications for the chemistry of crustal melts. Journal of Petrology 37, 521-552.
12. Bea F. et al. (1994) Mineral/ leucosome trace-element partitioning in a peraluminous migmatite (a laser ablation-ICP-MS study). In Trace-element partitioning with application to magmatic processes Elsevier, Amsterdam, Netherlands, pp. 291-312.
13. Beattie P. (1994) Systematics and energetics of trace element partitioning between olivine and silicate melts: Implications for the nature of mineral/melt partitioning. Chemical Geology 117, 57-71.
84
14. Behrens H. (1995) Determination of water solubilities in high-viscosity melts; an experimental study on NaAlSi3O8 and KAlSi3O8 melts. European Journal of Mineralogy 7, 905-920.
15. Berndt J., Liebske C., Holtz F., Freise M., Nowak M., Ziegenbein D., Hurkuck W., Koepke J., ronson-James p., and Bish D. L. (2002) A combined rapid-quench and H2 -membrane setup for internally heated pressure vessels; description and application for water solubility in basaltic melts. American Mineralogist 87, 1717-1726.
16. Boatner L. A. et al. (1981) Lanthanide orthophosphates for the primary immobilization of actinide wastes. Management of Alpha-Contaminated Wastes. In Proceedings of the International Symposium. International Atomic Energy Agency, Vienna, pp. 411 -422.
17. Boatner L. A. et al. (2002) Synthesis, structure, and properties of monazite, pretulite, and xenotime. In Phosphates; geochemical, geobiological, and materials importance Mineralogical Society of America and Geochemical Society, Washington, DC, United States, pp. 87-121.
18. Boynton W. V. (1984) Cosmochemistry of the rare earth elements; meteorite studies. In Rare earth element geochemistry (ed. P. Henderson). Elsevier Sci, Publ. Co.. Amsterdam, Netherlands, pp. 63-114.
19. Breiter K. et al. (1997) Mineralogical evidence for two magmatic stages in the evolution of an extremely fractionated P-rich rare-metal granite; the Podlesi Stock, Krusne Hory, Czech Republic. In High level silicic magmatism and related hydrothermal systems; IAVCEI '97 selected papers Clarendon Press, Oxford, United Kingdom, pp. 1723-1739.
20. Byrne R. and Li B. (1995) Comparative complexation behavior of the rare earths. Geochimica et Cosmochimica Acta 59, 4575-4589.
21. Cetiner Z. S., Wood S. A., and Gammons C. H. (2005) The aqueous geochemistry of rare earth elements. Part XIV. The solubility of rare earth element phosphate from 23 to 150 oC. Chemical Geology 217, 147-169.
22. Chao E. C. T. et al. (1992) Host-rock controlled epigenetic, hydrothermal metasomatic origin of the Bayan Obo REE-Fe-Nb ore deposit, Inner Mongolia, P.R.C. In Minerals for future materials Pergamon, Oxford-New York-Beijing, International, pp. 443-458.
23. Colson R., McKay G., and Taylor L. (1988) Temperature and composition dependencies of trace element partitioning; olivine/ melt and low-Ca pyroxene/melt. Geochimica et Cosmochimica Acta 52, 539-553.
24. Coppin F., Berger G., Bauer A., Castet S., and Loubet M. (2002) Sorption of lanthanides on smectite and kaolinite. Chemical Geology 182, 57-68.
25. Cuney M. and Friedrich M. (1987) Physicochemical and crystal-chemical controls on accessory mineral paragenesis in granitoids; implications for uranium metallogenesis. In Les mecanismes de concentration de l'uranium dans les environnements geologiques; colloque international Translated Title: Mechanisms of uranium concentration in the geologic environment; international colloquium pp. 235-247.
26. De Baar H. J. W., Bacon M. p., Brewer P. G., and Bruland K. W. (1985) Rare earth elements in the Pacific and Atlantic oceans. Geochimica et Cosmochimica Acta 49, 1943-1959.
85
27. Drake M. J. and Weill D. F. (1975) Partition of Sr, Ba, Ca, Y, Eu2+ , Eu3+ , and other REE between plagioclase feldspar and magmatic liquid; an experimental study. Geochimica et Cosmochimica Acta. 39, 689-712.
28. Drake M. J. and Weill D. F. (1972) New rare earth elements standards for electron microprobe analysis. Chem. Geol. 10, 179-181.
29. Dunn T. (1987) Partitioning of Hf, Lu, Ti, and Mn between olivine, clinopyroxene and basaltic liquid. Contributions to Mineralogy and Petrology 96, 476-484.
30. Edgar A. D. (1973) Experimental petrology: Basic principles and techniques. Clarendon, Oxford.
31. Elderfield H. and Greaves M. (1982) The rare earth elements in seawater. Nature (London) 296, 214-219.
32. Evans J. and Zalasiewicz J. (1996) U-Pb, Pb-Pb and Sm-Nd dating of authigenic monazite; implications for the diagenetic evolution of the Welsh Basin. Earth and Planetary Science Letters 144, 421-433.
33. Evans O. C. and Hanson G. N. (1993) Accessory-mineral fractionation of rare-earth element (REE) abundances in granitoid rocks. Chemical Geology 110, 69-93.
34. Ewing R. C., Wang L. M., Kohn M. J., Rakovan J.; Hughes J. M. (2002) Phosphates as nuclear waste forms. In Phosphates; geochemical, geobiological, and materials importance Mineralogical Society of America and Geochemical Society, Washington, DC, United States, pp. 673-699.
35. Fidelis I. and Siekierski S. (1971) Regularities or tetrad effect in complex formation by f-electron elements: Double-double effect. J. Inorg. Nucl. Chem. 33, 3191-3194.
36. Foerster H. (1998) The chemical composition of REE-Y-Th-U-rich accessory minerals in peraluminous granites of the Erzgebirge-Fichtelgebirge region, Germany; Part II, Xenotime. American Mineralogist 83, 1302-1315.
37. Franz G., Andrehs G., and Rhede D. (1996) Crystal chemistry of monazite and xenotime from Saxothuringian-Moldanubian metapelites, NE Bavaria, Germany. European Journal of Mineralogy 8, 1097-1118.
38. Frey F. A., Walker N., Stakes D., Walker S.R., and Nielsen R. (1993) Geochemical characteristics of basaltic glasses from the AMAR and FAMOUS axial valleys, Mid-Atlantic Ridge (36o-37oN). Earth. Plan. Sci. Lett. 115, 117-136.
39. Fryer B. J. and Taylor R. P. (1987) Rare-earth element distributions in uraninites; implications for ore genesis. Chemical Geology 63, 101-108.
40. Fujimaki H., Tatsumoto M., and Aoke A. (1984) Partition coefficient of Hf, Zr and REE between phenocrysts and groundmasses. J. Geophy. Res. 89, 662-672.
41. Ganapathy R. and Anders E. (1974) Bulk compositions of the Moon and Earth, estimated from meteorites. In Chemical and isotope analyses; organic chemistry (ed. W. A. Gose). Pergamon Press, New York, N.Y., United States, pp. 1181-1206.
42. Goldschmidt V. M. (1954) Geochemistry. Clareton Press, Oxford, 730 p.

86
43. Gratz R. and Heinrich W. (1997) Monazite-xenotime thermobarometry: Experimental calibration of the miscibility gap in the binary system CePO4-YPO4. American Mineralogist 82, 772-780.
44. Green T. and Pearson N. (1985) Rare earth element partitioning between clinopyroxene and silicate liquid at moderate to high pressure. Contributions to Mineralogy and Petrology 91, 24-36.
45. Green T. H, Blundy J. D., Adam J., Yaxley, G. M., Austrheim H. and Griffin,W.L. (2000) SIMS determination of trace element partition coefficients between garnet, clinopyroxene and hydrous basaltic liquids at 2-7.5 GPa and 1080-1200 oC. In Element partitioning in geochemistry and petrology; special volume in honour of Brenda B. Jensen Elsevier, Amsterdam, International, pp. 165-187.
46. Green T. H. (1994) Experimental studies of trace-element partitioning applicable to igneous petrogenesis - Sedona 16 years later. Chemical Geology 117, 1-36.
47. Hack P. J., Nielsen R. L., Johnston A. D., Foley S. F. and Van-der-Laan S. R. (1994) Experimentally determined rare-earth element and Y partitioning behavior between clinopyroxene and basaltic liquids at pressures up to 20 kbar. In Trace-element partitioning with application to magmatic processes Elsevier, Amsterdam, Netherlands, pp. 89-105.
48. Hahn M., Behrens H., Tegge S. A., Koepke J., Horn I., Rickers K., Falkenberg G., Wiedenbeck M., Woodland A. B., and Foley S. F. (2005) Trace element diffusion in rhyolitic melts; comparison between synchrotron radiation X-ray fluorescence microanalysis (mu -SRXRF) and secondary ion mass spectrometry (SIMS). European Journal of Mineralogy 17, 233-242.
49. Harrison T. M., Catlos E. J., Montel J. M., Kohn M. J., Rakovan J., and Hughes J. M. (2002) U-Th-Pb dating of phosphate minerals. In Phosphates; geochemical, geobiological, and materials importance Mineralogical Society of America and Geochemical Society, Washington, DC, United States, pp. 523-558.
50. Heinrich W., Andrehs G., and Franz G. (1997) Monazite-xenotime miscibility gap thermometry; 1, An empirical calibration. Journal of Metamorphic Geology 15, 3-16.
51. Henderson P. (1984) General geochemical properties and abundances of the rare earth elements. In Rare earth element geochemistry (ed. P. Henderson). Elsevier Sci, Publ. Co.. Amsterdam, Netherlands, pp. 1-32.
52. Hess P. C. (1989) Origin of Igneous rocks. Harvard University Press.
53. Higuchi H. and Nagasawa H. (1969) Partition of trace elements between rock forming minerals and the host volcanic rocks. Earth Planet. Sci. Lett. 7, 281.-287.
54. Hollings P. and Wyman D. (2004) The geochemistry of trace elements in igneous system: Principles and examples from basaltic system. In Rare element geochemistry and mineral deposits. Geological Association of Canada. Short course notes. Volume 17. (eds. R. L. Linnen and I. M. Samson). pp. 1-16.
55. Holloway J. R. (1971) Internally heated pressure vessels. In Research techniques for high pressure and high temperatures. (ed. G.C.Ulmer). Springer- Verlag, New York, pp. 217-258.

87
56. Huebner J. (1971) Buffering techniques for hydrostatic systems at elevated pressures. In Research techniques for high pressure and high temperature (ed. G. C. Ulmer). Springer-Verlag, New York, pp. 123-177.
57. Huheey J. E. (1983) Inorganic chemistry. Harper, Cambridge.
58. Irber W. et al. (1997) Experimental, geochemical, mineralogical and O-isotope constraints on the late-magmatic history of the Fichtelgebirge granites (Germany). In The German Deep Drilling Project, KTB Springer International, Berlin, Federal Republic of Germany, p. S110-S124.
59. Irber W. (1999) The lanthanide tetrad effect and its correlation with K/Rb, Eu/Eu*, Sr/Eu, Y/Ho, and Zr/Hf of evolving peraluminous granite suites. Geochimica et Cosmochimica Acta 63, 489-508.
60. Jahn B. M., Wu F., Capdevila R., Martineau F., Zhao Z., and Wang Y. (2001) Highly evolved juvenile granites with tetrad REE patterns: The Woduhe and Baerzhe granites from the Great Xing'an Mountains in NE China. Lithos 59, 171-198.
61. Johannes W. and Holtz F. (1996) Petrognenesis and experimental petrology of granitic rocks. Springer.
62. Jolliff B., Papike J., Shearer C., and Shimizu N. (1989) Inter- and intra-crystal REE variations in apatite from the Bob Ingersoll Pegmatite, Black Hills, South Dakota. Geochimica et Cosmochimica Acta 53, 429-441.
63. Kawabe I., Kitahara Y., and Naito K. (1991) Non-chondritic yttrium/holmium ratio and lanthanide tetrad effect observed in pre-Cenozoic limestones. Geochemical Journal 25, 31-44.
64. Kawabe I. (1995) Tetrad effects and fine structures of REE abundance patterns of granitic and rhyolitic rocks; ICP-AES determination of REE and Y in eight GSJ reference rocks. Geochemical Journal 29, 213-230.
65. Kennedy A., Lofgren G., and Wasserburg G. (1993) An experimental study of trace element partitioning between olivine, orthopyroxene and melt in chondrules; equilibrium values and kinetic effects. Earth and Planetary Science Letters 115, 177-195.
66. Keppler H. (1993) Influence of fluorine on the enrichment of high field strength trace elements in granitic rocks. Contributions to Mineralogy and Petrology 114, 479-488.
67. Kerrick D. M. (1987) Cold-seal systems. In Hydrothermal experimental techniques (eds. G. C. Ulmer and H. L. Barnes). John Wiley & Sons, New York, NY, United States, pp. 293-323.
68. Klinkhammer G., Elderfield H., Edmond J., and Mitra A. (1994) Geochemical implications of rare earth element patterns in hydrothermal fluids from mid-ocean ridges. Geochimica et Cosmochimica Acta 58, 5105-5113.
69. Kolitsch U. and Holtstam D. (2004) Crystal chemistry of REEXO4 compounds (X = P, As, V); II, Review of REEXO4 compounds and their stability fields. European Journal of Mineralogy 16, 117-126.

88
70. Lee D. and Bastron H. (1967) Fractionation of rare-earth elements in allanite and monazite as related to geology of the Mount Wheeler Mine area, Nevada. Geochimica et Cosmochimica Acta 31, 339-356.
71. Linnen R. L. and Cuney M. (2004) Granite-related rare element deposits and experimental constrants on Ta-Nb-W-Sn-Zr-Hf mineralization. In Rare element geochemistry and mineral deposits (eds. R. L. Linnen and I. M. Samson). Geological Association of Canada, pp. 45-68.
72. Liu C. and Zhang H. (2005) The lanthanide tetrad effect in apatite from the Altay No. 3 pegmatite, Xingjiang, China; an intrinsic feature of the pegmatite magma. Chemical Geology 214, 61-77.
73. Lofgren G. (1987) Internally heated systems. In Hydrothermal experimental techniques (eds. G. C. Ulmer and H. L. Barnes). John Wiley & Sons, New York, NY, United States, pp. 324-332.
74. London D., Wolf M., Morgan G., and Garrido M. (1999) Experimental silicate-phosphate equilibria in peraluminous granitic magmas, with a case study of Alburquerque Batholith at Tres Arroyos, Badajoz, Spain. Journal of Petrology 40, 215-240.
75. Lottermoser B. G. (1992) Rare earth elements and hydrothermal ore processes. Ore Geology Reviews 7, 25-41.
76. MacKenzie J. M. and Canil D. (1999) Composition and thermal evolution of cratonic mantle beneath the central Archean Slave Province, NWT, Canada. Contrib. Mineral. Petrol. 134, 313-324.
77. Manning D. A. C. and Pichavant M. (1988) Volatiles and their bearing on the behaviour of metals in granitic systems. In CIM Metallurgy (eds. R. P. Taylor and D. F. Srong). pp. 13-24.
78. Masau M., Cerny P., and Chapman R. (2000) Dysprosian xenotime-(Y) from the Annie Claim granitic pegmatite, southeastern Manitoba, Canada; evidence of the tetrad effect? The Canadian Mineralogist 38, 899-905.
79. Masuda A. (1962) Regularities in variation of relative abundances of lanthanide elements and an attempt to analyse separation index patterns of some minerals. J. Earth Sci. Nagoya Uni. 10, 173-187.
80. Masuda A. and Akagi T. (1989) Lanthanide tetrad effect observed in leucogranites from China. Geochem. J. 23, 245-253.
81. Masuda A. and Ikeuchi Y. (1979) Lanthanide tetrad effect observed in marine environment. Geochem. J. 13, 19-22.
82. Masuda A., Kawakami O., Dohmoto Y., and Takenaka T. (1987) Lanthanide tetrad effects in nature: Two mutually opposite types, W and M. Geochem. J. 21, 119-124.
83. McDonough W. F. and Frey F. A. (1989) Rare earth elements in upper mantle rocks. In Geochemistry and mineralogy of rare earth elements (eds. B. R. Lipin and G. A. McKay). Mineralogical Society of America, Washington, DC, United States, pp. 100-145.

89
84. McKay G., Wagstaff J., and Yang S. R. (1986) Clinopyroxene REE distribution coefficients for shergottites; the REE content of the Shergotty melt. In Shergotty Consortium and SNC meteorites Pergamon, Oxford, International, pp. 927-937.
85. McKay G. A. (1989) Partitioning of rare earth elements between major silicate minerals and basaltic melts. In Reviews in Mineralogy: Geochemistry and mineralogy of rare earth elements (eds. B. R. Lipin and G. A. McKay). The mineralogical society of America, Washington, D.C., pp. 44-78.
86. McKay G. (1986) Crystal/liquid partitioning of REE in basaltic systems; extreme fractionation of REE in olivine. Geochimica et Cosmochimica Acta 50, 69-79.
87. McLennan S. M. (1999) Lanthanide series: rare earths. In Encyclopedia of Geochemistry (eds. C. P. Marshall and R. W. Fairbridge). Kluwer Academic, Dordrecht, pp. 211-213.
88. McLennan S. M. (1994) Rare earth element geochemistry and the “tetrad” effect. Geochimica et Cosmochimica Acta 58, 2025-2033.
89. McLennan S. M., Lipin B. R., and McKay G. A. (1989) Rare earth elements in sedimentary rocks; influence of provenance and sedimentary processes. In Geochemistry and mineralogy of rare earth elements. (eds. Lipin-Bruce-R and McKay-G-A). Mineralogical Society of America, Washington, DC, United States, pp. 169-200.
90. Michard A., Michard G., Stueben D., Stoffers P., Cheminee J., and Binard N. (1993) Submarine thermal springs associated with young volcanoes; the Teahitia vents, Society Islands, Pacific Ocean. Geochimica et Cosmochimica Acta 57, 4977-4986.
91. Miller C. F. and Mittlefehld D. (1982) Depletion of ligth rare earth elements in felsic magmas. Geology 10, 129-133.
92. Mittlefehld D. and Miller C.F. (1983) Geochemistry of the Sweetwater Wash Pluton, California; implications for "anomalous" trace element behavior during differentiation of felsic magmas. Geochimica et Cosmochimica Acta 47, 109-124.
93. Moeller P., Dulski P., Savascin Y., and Conrad M. (2004) Rare earth elements, yttrium and Pb isotope ratios in thermal spring and well waters of west Anatolia, Turkey; a hydrochemical study of their origin. Chemical Geology 206, 97-118.
94. Moeller P. (2000) Rare earth elements and yttrium in aqueous crustal fluids. In Geological Society of America, 2000 annual meeting Geological Society of America (GSA), Boulder, CO, United States, p. 187.
95. Monecke T., Kempe U., Monecke J., Sala M., and Wolf D. (2002) Tetrad effect in rare earth element distribution patterns; a method of quantification with application to rock and mineral samples from granite-related rare metal deposits. Geochimica et Cosmochimica Acta 66, 1185-1196.
96. Montel J. M. (1987) Comportement des terres rares dans les magmas leucogranitiques: modelisation et approche experimantale du role la manazite. Ph.D. Thesis, INPL, Nancy.
97. Montel J. (1986) Experimental determination of the solubility of Ce-monazite in SiO2-Al2O3-K2O-Na2O melts at 800 oC, 2 kbar, under H2O-saturated conditions. Geology (Boulder) 14, 659-662.

90
98. Montel J. M., Watson E. B., Harrison T. M., Miller C. F., and Ryerson F. J. (1993) A model for monazite/ melt equilibrium and application to the generation of granitic magmas. Chemical Geology 110, 127-146.
99. Morris R. V. and Haskin L. (1974) EPR measurement of the effect of glass composition on the oxidation states of europium. Geochimica et Cosmochimica Acta 38, 1435-1445.
100. Nabelek P. I. and Glascock M. D. (1995) REE-depleted leucogranites, Black Hills, South Dakota; a consequence of disequilibrium melting of monazite-bearing schists. Journal of Petrology 36, 1055-1071.
101. Neary C. R. and Highley D. E. (1984) The economic importance of the rare earth elements. In Rare earth element geochemistry (ed. P. Henderson). Elsevier Sci, Publ. Co.. Amsterdam, Netherlands, pp. 1-32.
102. Ni Y., Hughes J. M., and Marino A. N. (1995) Crystal chemistry of the monazite and xenotime structures. American Mineralogist 80, 21-26.
103. Nielsen R., Gallahan W., and Newberger F. (1992) Experimentally determined mineral-melt partition coefficients for Sc, Y and REE for olivine, orthopyroxene, pigeonite, magnetite and ilmenite. Contributions to Mineralogy and Petrology 110, 488-499.
104. Nowak M. and Behrens H. (1995) The speciation of water in haplogranitic glasses and melts determined by in situ near-infrared spectroscopy. Geochimica et Cosmochimica Acta 59, 3445-3450.
105. Oreskes N. and Einaudi M. (1990) Origin of rare earth element-enriched hematite breccias at the Olympic Dam Cu-U-Au-Ag deposit, Roxby Downs, South Australia. Economic Geology 85, 1-28.
106. Pan Y. and Bau M. (1997) Controls on the fractionation of isovalent trace elements in magmatic and aqueous systems; evidence from Y/ Ho, Zr/ Hf, and lanthanide tetrad effect; discussion and reply. Contributions to Mineralogy and Petrology 128, 405-408.
107. Pan Y. and Breaks F. (1997) Rare-earth elements in fluorapatite, Separation Lake area, Ontario; evidence for S-type granite-rare-element pegmatite linkage. The Canadian Mineralogist 35, Part 3, 659-671.
108. Parrish R. (1990) U-Pb dating of monazite and its application to geological problems. Canadian Journal of Earth Sciences 27, 1431-1450.
109. Peppard D. F., Mason G. W., and Lewey S. (1969) A tetrad effect in the liquid-liquid extraction ordering of lanthanide (III). J. Inorg. Nucl. Chem 31, 339-343.
110. Philpotts J. and Schnetzler C. (1970) Phenocryst-matrix partition coefficients for K, Rb, Sr and Ba, with applications to anorthosite and basalt genesis. Geochimica et Cosmochimica Acta 34, 307-322.
111. Pichavant M., Montel J., and Richard L. (1992) Apatite solubility in peraluminous liquids; experimental data and an extension of the Harrison-Watson model. Geochimica et Cosmochimica Acta 56, 3588-3861.
91
112. Piepgras D. and Jacobsen S. (1992) The behavior of rare earth elements in seawater; precise determination of variations in the North Pacific water column. Geochimica et Cosmochimica Acta 56, 1851-1862.
113. Plimer I. R., Lu J., and Kleeman J. D. (1991) Trace and rare earth elements in cassiterite; sources and components for the tin deposits of the Mole Granite, Australia. Mineralium Deposita 26, 267-274.
114. Ponader C. W. and Brown G. E. (1989) Rare earth elements in silicate glass/melt systems: I. Effects of composition on the coordination environments of La, Gd, and Yb. Geochimica et Cosmochimica Acta 53, 2893-2903.
115. Rapp R. and Watson E. B. (1986) Monazite solubility and dissolution kinetics; implications for the thorium and light rare earth chemistry of felsic magmas. Contributions to Mineralogy and Petrology 94, 304-316.
116. Rapp R. P. et al. (1987) Experimental evidence bearing on the stability of monazite during crustal anatexis. In Heat production in the continental lithosphere American Geophysical Union, Washington, DC, United States, pp. 307-310.
117. Rapp R. P. and Watson E. B. (1985) Solubility and dissolution behavior of monazite and LREE diffusion in a hydrous granitic melt. In AGU 1985 spring meeting American Geophysical Union, Washington, DC, United States, p. 416.
118. Rietveld H. M. (1969) A Profile Refinement Method for Nuclear and Magnetic Structures. Journal of Applied Crystallography 2, 65-71.
119. Ross J. and Aller L. (1976) The chemical composition of the Sun. Science 191, 1223-1229.
120. Salters V. and Stracke A. (2004) Composition of the depleted mantle. Geochemistry, Geophysics, Geosystems 5.
121. Salters V. and Longhi J. (1999) Trace element partitioning during the initial stages of melting beneath mid-ocean ridges. Earth and Planetary Science Letters 166, 15-30.
122. Schaller T., Dingwell D., Keppler H., Knoeller W., Merwin L., and Sebald A. (1992) Fluorine in silicate glasses; a multinuclear nuclear magnetic resonance study. Geochimica et Cosmochimica Acta 56, 701-707.
123. Seung-Gu L., Masuda A., and Hyung-Shik K. (1994) An early Proterozoic leuco-granitic gneiss with the REE tetrad phenomenon. Chemical Geology 114, 59-67.
124. Seydoux G., Wirth R., Heinrich W., and Montel J. (2002) Experimental determination of thorium partitioning between monazite and xenotime using analytical electron microscopy and X-ray diffraction Rietveld analysis. European Journal of Mineralogy 14, 869-878.
125. Shannon R. D. (1976) Revised effective ionic radii and systematic studies of interatomic distances in halides and chacogenides. Acta Crystallogr. Sect. A. 32, 751-767.
126. Shen Y. and Forsyth D. W. (1995) Geochemical constraints on the initial and final depth of melting beneath mid-ocean ridges. Journal of Geophysic Resources. 100, 2211-2237.
127. Shimizu N., Layne G. D., and Walter M. (1997) Trace-element partitioning in pigeonite-garnet-melt assemblages in natural peridotite composition at high pressures. In Seventh
92
annual V. M. Goldschmidt conference Lunar and Planetary Institute, Houston, TX, United States, pp. 191-192.
128. Siekierski S. (1971) The shape of lanthanide contraction as reflected in the changes of the unit cell volumes, lanthanide radius and the free energy of complex formation. J. Inorg. Nucl. Chem. 33, 377-386.
129. Sowerby J. S. and Keppler H. (1999) Water speciation in rhyolitic melt determined by in-situ infrared spectroscopy. American Mineralogist 84, 1843-1849.
130. Stolper E. (1982) Water in silicate glasses; an infrared spectroscopic study. Contributions to Mineralogy and Petrology 81, 1-17.
131. Sun S. S. and McDonough W. F. (1989) Chemical and isotopic systematics of oceanic basalts; implications for mantle composition and processes. In Magmatism in the ocean basins (eds. A. D. Saunders and M. J. Norry). Geological Society of London, London, United Kingdom, pp. 313-345.
132. Takahashi Y., Amano K., Hama K., Mizuno T., Yoshida H., and Shimizu H. (2003) W- and M-type tetrad effects in REE patterns for water-rock systems in the Tono uranium deposit, central Japan; reply. Chemical Geology 202, 185-189.
133. Takahashi Y., Yoshida H., Sato N., Hama K., Yusa Y., and Shimizu H. (2002) W- and M-type tetrad effects in REE patterns for water-rock systems in the Tono uranium deposit, central Japan. Chemical Geology 184, 311-335.
134. Taura e. al., Taura e. al., and Taura e. al. (1998) Pressure dependence on partition coefficients for trace elements between olivine and the coexisting melts. Phys. Chem. Minerals 25, 469-484.
135. Taylor M. and Ewing R. C. (1978) The crystal structures of ThSiO4 polymorphs: huttonite and thorite. Acta Crystallogr. B, 1074-1079.
136. Taylor S. R. and McLennan S. M. (1985) The continental crust: Its composition and evolution. Oxford: Blackwell scientific publications. 312 p.
137. Taylor S. R. et al. (1988) The significance of the rare earths in geochemistry and cosmochemistry. In Handbook on the Physics and Chemistry of Rare Earths (eds. Gschneidner-Karl-A Jr. and Eyring-LeRoy). Amsterdam, Netherlands, pp. 485-570.
138. Tuttle O. F. and Bowen N. L. (1958) Origin of granites in the light of experimental studies in the system NaAlSi3O8 - KAlSi3O8 - SiO2 - H2O. Geological Society of America Memoir 74, 1-153.
139. Tuttle O. (1949) Two pressure vessels for silicate-water studies. Geological Society of America Bulletin 60, 1727-1729.
140. Van Westrenen W., Allan N. L., Blundy J. D., Purton J. A., and Wood B. J. (2000) Atomistic simulation of trace element incorporation into garnets-comparison with experimental garnet-melt partitioning data. Geochemica et Cosmochemica Acta 64, 1629-1639.
141. Veksler I. V., Dorfman A., Kamenetsky M., Dulski P., and Dingwell D. (2005) Partitioning of lanthanides and Y between immiscible silicate and fluoride melts, fluorite and cryolite

93
and the origin of the lanthanide tetrad effect in igneous rocks. Geochimica et Cosmochimica Acta 69, 2847-2860.
142. Wang J. et al. (1994) A precise 232Th- 208Pb chronology of fine-grained monazite; age of the Bayan Obo REE-Fe-Nb ore deposit, China. In The Clair C. Patterson special issue (ed. T. M. Church). Pergamon, Oxford, International, pp. 3155-3169.
143. Wilson M. (1989) Igneous petrogenesis. Unwin Hyman, London.
144. Wolf M. and London D. (1995) Incongruent dissolution of REE- and Sr-rich apatite in peraluminous granitic liquids; differential apatite, monazite, and xenotime solubilities during anatexis. American Mineralogist 80, 765-775.
145. Wood B. and Blundy J. (1997) A predictive model for rare earth element partitioning between clinopyroxene and anhydrous silicate melt. Contributions to Mineralogy and Petrology 129, 166-181.
146. Wood B. J. and Blundy J. D. (2004) Trace element partitioning under crustal and uppermost mantle conditions: The influences of ionic radius, cation charge, pressure, and temperature. In Treatise on geochemistry, Volume 2: The mantle and core (ed. Richard W.Carlson). Elsevier Pergamon, pp. 395-424.
147. Wood B. and Blundy J. (2002) The effect of H2O on crystal-melt partitioning of trace elements. Geochimica et Cosmochimica Acta 66, 3647-3656.
148. Wu F. Y., Sun D. Y., Jahn B. M., and Wilde S. (2004) A Jurassic garnet-bearing granitic pluton from NE China showing tetrad REE patterns. Journal of Asian Earth Sciences 23, 731-744.
149. Yurimoto H., Duke E., Papike J., and Shearer C. (1990) Are discontinuous chondrite-normalized REE patterns in pegmatitic granite systems the results of monazite fractionation? Geochimica et Cosmochimica Acta 54, 2141-2145.
150. Zhao J. and Cooper J. (1992) The Atnarpa igneous complex, Southeast Arunta Inlier, central Australia; implications for subduction at an early-mid Proterozoic continental margin. Precambrian Research 56, 227-253.
151. Zhao Z. H., Xiong X. L., and Han X. D. (1999) The formation mechanism of REE tetrad in granites. Sci. China, Ser. D: Earth Sci 29, 331-338.
152. Zhao Z., Masuda A., and Shabani M. (1992) Tetrad effects of rare-earth elements in rare-metal granites. Diqiu Huaxue 1992, 221-233.
153. Zhao Z., Masuda A., and Shabani M. (1993) REE tetrad effects in rare-metal granites. Chinese Journal of Geochemistry 12, 206-219.
154. Zhu X., Nions R., Belshaw N., and Gibb A. (1997) Significance of in situ SIMS chronometry of zoned monazite from the Lewisian granulites, Northwest Scotland. Chemical Geology 135, 35-53.
155. Zhu X. K. and O'Nions R. K. (1999) Monazite chemical composition: Some implications for monazite geochronology. Contributions to Mineralogy and Petrology 137, 351-363.
95
Part II: Solubility of tin in (Cl, F)-bearing aqueous fluids at 700 °C, 140 MPa:
a LA-ICP-MS study on synthetic fluid inclusions

Tin solubility: Introduction 97
II- 1. Introduction
More than 95% of the world's Sn-production comes from ore deposits that are directly or
indirectly related to granitic rocks, with cassiterite (SnO2) being the main ore mineral
(Lehmann, 1990). Primary tin mineralization occurs in veins, breccias, replacement bodies
and quartz-muscovite-topaz greisens in the roof regions of highly evolved biotite and/or
muscovite granites and leucogranites. These granites are characterized by a shallow level of
emplacement (≤ 3-4 km), are markedly peraluminous (ASI ≥ 1.1), reduced ("ilmenite-series"),
and enriched in fluorine and other incompatible trace elements such as Li, B, Cs, Rb and Sn
(e.g., Tischendorf, 1977; Lehmann, 1990; Baumann et al., 2000). Numerous studies have
shown that tin ore formation results from a sequence of processes that involves: (i) melt
generation at depth, (ii) magma ascent, fractional crystallization, assimilation and magma
mixing (iii) emplacement of evolved, residual magma in a shallow magma chamber (iv)
magma solidification, further melt fractionation, and exsolution of aqueous fluids, (v)
transport and focusing of magmatic fluids into local structures, and (vi) precipitation of
dissolved Sn in response to fluid – rock interaction, cooling, fluid depressurization and/or
fluid mixing. Although this general sequence is well established, some mechanisms are still
poorly understood. For example, it is not clear whether the close association of F and Sn is
accidental, or whether fluorine actually played an active role in the process of Sn-enrichment.
Experimental studies on the solubility of Sn in hydrothermal fluids are focused mostly on
chlorine-bearing systems at temperatures ≤ 500 °C (e.g., Klintsova and Barsukov, 1973;
Klintsova et al., 1975; Nekrasov and Ladze, 1973; Kovalenko et al., 1986, 1986), with spare
data being available for higher temperatures (e.g., Wilson and Eugster, 1990; Taylor and
Wall, 1993). The scarcity of high-temperature data is partly explained by the tendency of Sn
to alloy with noble metals (e.g., Nekrasov et al., 1980; Keppler and Wyllie, 1991), which may
lead to disequilibria in the experimental charge. Furthermore, because Sn-solubilities
traditionally were determined in quench solutions at ambient conditions, it is possible that
true solubilities were underestimated due to precipitation of originally dissolved Sn during the
quench.
Here we followed a different approach by trapping small portions of fluid at high pressure and
temperature in the form of synthetic fluid inclusions in quartz, and subsequently analyzing
individual inclusions by Laser-Ablation Inductively-Coupled-Plasma Mass-Spectrometry
(e.g., Loucks and Mavrogenes, 1999). Two different methods for fluid inclusion synthesis
Tin solubility: Introduction 98
were used: (i) a new technique that we call "etched plate technique", and (ii) the in-situ
cracking technique (e.g., Sterner, 1992). The former technique has the advantage that it
produces relatively large inclusions, and – if used in combination with fine-grained starting
material – allows entrapment of fluid that for a considerable amount of time was not in
contact with the capsule walls, avoiding potential disequilibria caused by alloying. The in-situ
cracking method produces much smaller inclusions and does not circumvent problems caused
by alloying. However, it has the advantage that fluid inclusion formation can be initiated after
some time of pre-equilibration, which is crucial in cases where fluid inclusion formation is
fast relative to the time required to reach equilibrium in the fluid. Because fluid inclusions
produced by both techniques subsequently are analyzed as a whole, any material that
precipitates within the inclusions during cooling is included in the analysis.

Tin solubility: Methods 99
II- 2. Methods
II- 2.1. Inclusion synthesis by the etched plate technique
Oriented quartz laths measuring ca. 1 x 2 x 10 mm were cut from an inclusion-free quartz
crystal in such a way that their longest dimension was parallel to the c-axis of the crystal. By
using a rough rock saw for cutting, numerous small cracks were generated along the sample
surface. The quartz pieces where then etched in 30-40% HF for 1-2 hours to produce a
network of small channels on the surface. Subsequently, fine cassiterite powder of 20-60 µm
grain size (prepared from a natural cassiterite crystal from Viloco, Bolivia) was sprinkled over
the quartz surface, such that individual cassiterite fragments fell into the etch channels. Three
or four so-prepared quartz laths were sealed together with silica glass (0.2-0.3 g), some larger
cassiterite grains (0.014-0.015 g; to assure cassiterite saturation during the run) and 65-90 µl
aqueous solution into gold capsules of 35 mm length, 5.0 mm outer diameter (O.D.) and 4.6
mm inner diameter (I.D.). Starting solutions were prepared from doubly distilled water and
reagent-grade NaCl (5-35 wt.%), NaF (5-35 wt.%), HCl (0.5-4.4 m) or HF (0.5-3.2 m). The
HCl and HF-bearing solutions were spiked with 304-487 ppm each of Rb, Cs and Ba (added
as RbCl, CsCl and BaCl2·2H2O, respectively) for internal standardization of the LA-ICP-MS
analyses. After loading, the capsules were sealed by arc welding, re-weighed, and left at 150
°C overnight. Only capsules that had lost less than 2 % weight during this procedure were
used for the experiments.
Experiments were conducted in cold-seal pressure vessels of 39 mm outer diameter, 7 mm
inner diameter, and 235 mm length, using water as pressure medium. The samples were first
pressurized to 100 MPa, then isobarically heated to 400 °C, and subsequently isochorically
heated up to the experimental conditions of 140 MPa and 700 °C. Temperatures were
measured with NiCr-Ni thermocouples that were placed either inside the bomb or in a well at
the end of the bomb, giving an overall uncertainty of ± 15 °C. Pressures were measured on a
Heise gauge calibrated to an uncertainty of 10 MPa. Oxygen fugacity was intrinsically
buffered near the nickel – nickel oxide buffer (NNO) by the reaction of the pressure medium
(water) with the Ni-rich alloy of the pressure vessel and a nickel filler rod. Experiments lasted
for 4-5 days, after which the cold-seal vessels were quenched isochorically by air cooling.
Recovered capsules were cleaned, dried overnight at 150 °C, and re-weighed to check for
leaks during the run. Most capsules gained a small amount of weight (≤ 0.3wt.%) during the
run, probably due to uptake of nickel. Two capsules (NaCl5 and NaCl10) were visibly broken
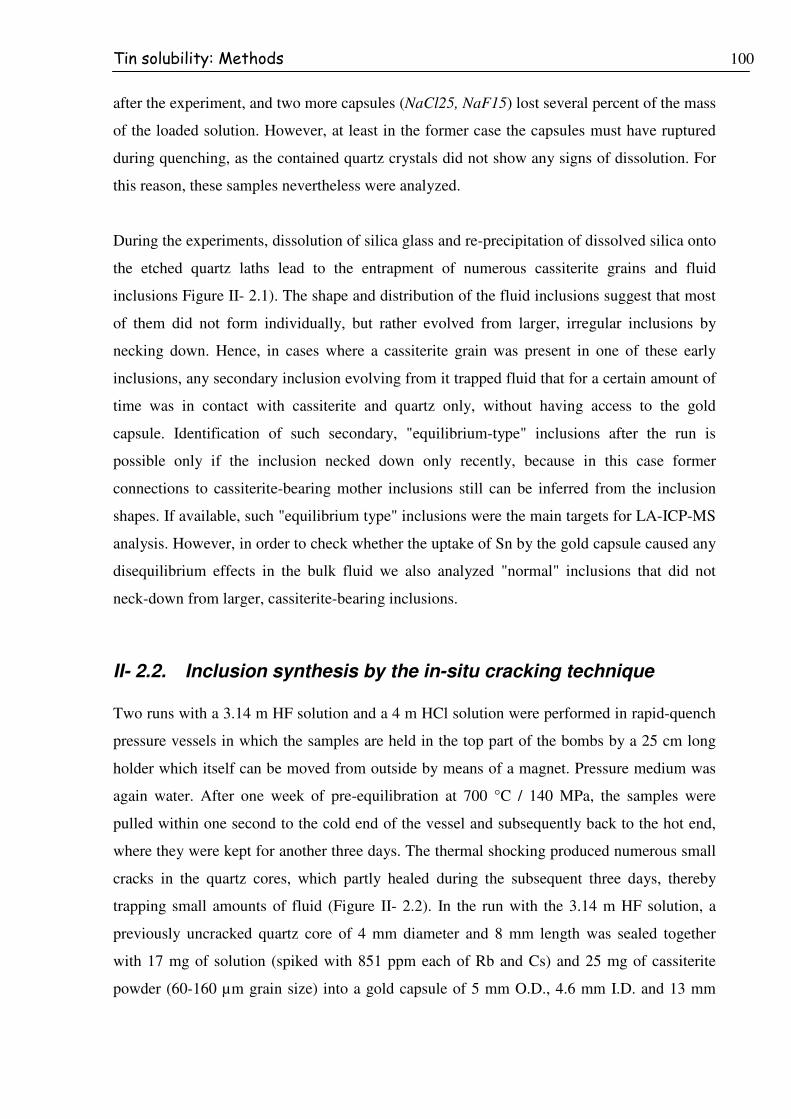
Tin solubility: Methods 100
after the experiment, and two more capsules (NaCl25, NaF15) lost several percent of the mass
of the loaded solution. However, at least in the former case the capsules must have ruptured
during quenching, as the contained quartz crystals did not show any signs of dissolution. For
this reason, these samples nevertheless were analyzed.
During the experiments, dissolution of silica glass and re-precipitation of dissolved silica onto
the etched quartz laths lead to the entrapment of numerous cassiterite grains and fluid
inclusions Figure II- 2.1). The shape and distribution of the fluid inclusions suggest that most
of them did not form individually, but rather evolved from larger, irregular inclusions by
necking down. Hence, in cases where a cassiterite grain was present in one of these early
inclusions, any secondary inclusion evolving from it trapped fluid that for a certain amount of
time was in contact with cassiterite and quartz only, without having access to the gold
capsule. Identification of such secondary, "equilibrium-type" inclusions after the run is
possible only if the inclusion necked down only recently, because in this case former
connections to cassiterite-bearing mother inclusions still can be inferred from the inclusion
shapes. If available, such "equilibrium type" inclusions were the main targets for LA-ICP-MS
analysis. However, in order to check whether the uptake of Sn by the gold capsule caused any
disequilibrium effects in the bulk fluid we also analyzed "normal" inclusions that did not
neck-down from larger, cassiterite-bearing inclusions.
II- 2.2. Inclusion synthesis by the in-situ cracking technique
Two runs with a 3.14 m HF solution and a 4 m HCl solution were performed in rapid-quench
pressure vessels in which the samples are held in the top part of the bombs by a 25 cm long
holder which itself can be moved from outside by means of a magnet. Pressure medium was
again water. After one week of pre-equilibration at 700 °C / 140 MPa, the samples were
pulled within one second to the cold end of the vessel and subsequently back to the hot end,
where they were kept for another three days. The thermal shocking produced numerous small
cracks in the quartz cores, which partly healed during the subsequent three days, thereby
trapping small amounts of fluid (Figure II- 2.2). In the run with the 3.14 m HF solution, a
previously uncracked quartz core of 4 mm diameter and 8 mm length was sealed together
with 17 mg of solution (spiked with 851 ppm each of Rb and Cs) and 25 mg of cassiterite
powder (60-160 µm grain size) into a gold capsule of 5 mm O.D., 4.6 mm I.D. and 13 mm
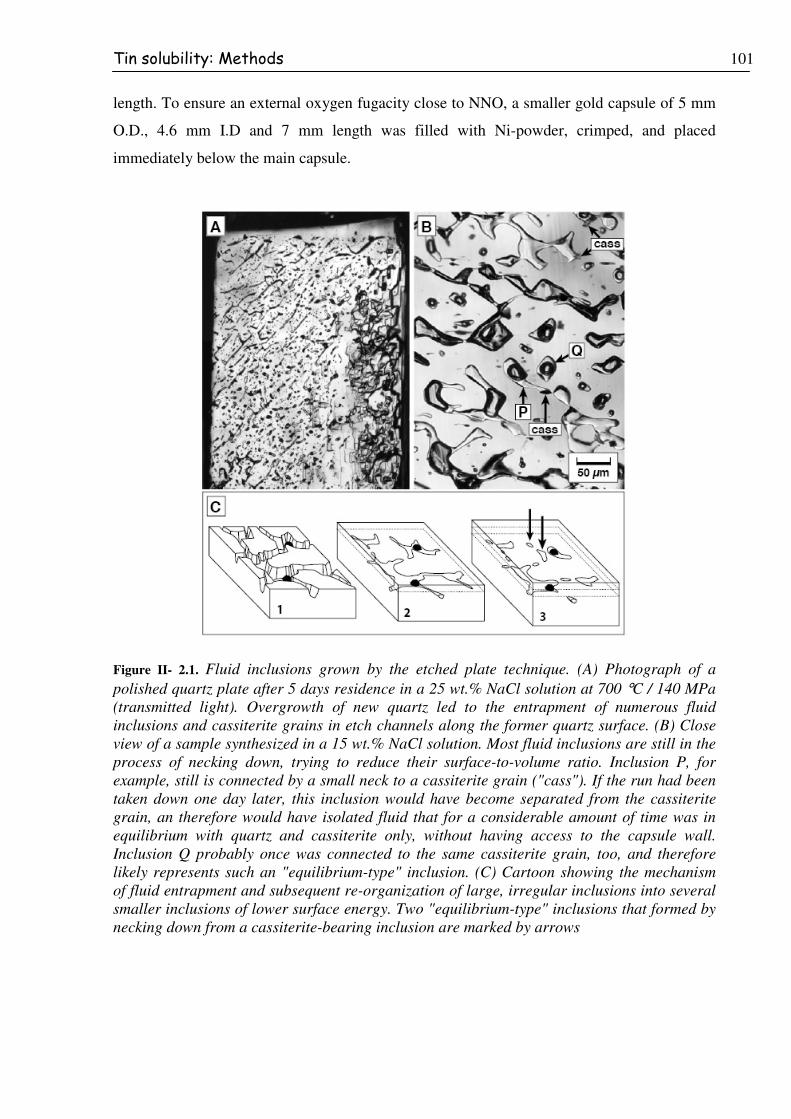
Tin solubility: Methods 101
length. To ensure an external oxygen fugacity close to NNO, a smaller gold capsule of 5 mm
O.D., 4.6 mm I.D and 7 mm length was filled with Ni-powder, crimped, and placed
immediately below the main capsule.
Figure II- 2.1. Fluid inclusions grown by the etched plate technique. (A) Photograph of a polished quartz plate after 5 days residence in a 25 wt.% NaCl solution at 700 °C / 140 MPa (transmitted light). Overgrowth of new quartz led to the entrapment of numerous fluid inclusions and cassiterite grains in etch channels along the former quartz surface. (B) Close view of a sample synthesized in a 15 wt.% NaCl solution. Most fluid inclusions are still in the process of necking down, trying to reduce their surface-to-volume ratio. Inclusion P, for example, still is connected by a small neck to a cassiterite grain ("cass"). If the run had been taken down one day later, this inclusion would have become separated from the cassiterite grain, an therefore would have isolated fluid that for a considerable amount of time was in equilibrium with quartz and cassiterite only, without having access to the capsule wall. Inclusion Q probably once was connected to the same cassiterite grain, too, and therefore likely represents such an "equilibrium-type" inclusion. (C) Cartoon showing the mechanism of fluid entrapment and subsequent re-organization of large, irregular inclusions into several smaller inclusions of lower surface energy. Two "equilibrium-type" inclusions that formed by necking down from a cassiterite-bearing inclusion are marked by arrows

Tin solubility: Methods 102
In the run with the 4 m HCl solution, a double capsule technique was employed to speed up
hydrogen transfer and concomitant cassiterite dissolution (see below). For this purpose, 15
mg each of Ni and NiO powder were sealed together with 12 mg of H2O into a platinum
capsule of 3.0 mm O.D., 2.7 mm I.D. and 14 mm length. This capsule was sealed together
with an uncracked quartz core, 30 mg of solution (spiked with 603 ppm each of Rb and Cs)
and cassiterite powder (60-160 µm grain size) into a gold capsule of 5.0 mm O.D., 4.6 mm
I.D., and 20 mm length. No external, Ni-filled Au-capsule was used in this case.
Figure II- 2.2. Fluid inclusions grown by the in-situ cracking technique. (A) After one week of pre-equilibration, isobaric quenching from 700 °C to 20 °C and immediate re-heating to 700 °C lead to the development of numerous small cracks in the quartz core. The cracks partly healed out in the days following the in-situ cracking (transmitted light). (B) Close view of a portion of the sample shown in A. Note the small size of the fluid inclusions compared to those produced by the etched plate technique (transmitted light).
II- 2.3. Analytical methods
Five to ten inclusions of each run were analyzed by LA-ICP-MS in the Laboratory of
Analytical Chemistry at ETH Zürich and at the Bayerisches Geoinstitut for the isotopes 23Na, 29Si, 85Rb, 118Sn, 120Sn, 133Cs, and 137Ba. The utilized LA-ICP-MS systems consisted of an
Elan 6100 or Elan DRC-e quadrupole mass spectrometer (Perkin Elmer Instruments) attached
to a Geolas M 193nm ArF Excimer Laser system (Coherent / Lambda Physik). Technical
details concerning these systems and their operation can be found in Günther et al. (1997,
1998). Individual inclusions were ablated through the host quartz in several steps, using laser
beam sizes ranging from 4 to 60 µm in diameter. The laser was operated at a frequency of 10
Hz and a power of 25 kV. The sample chamber was flushed with helium gas at a rate of 1
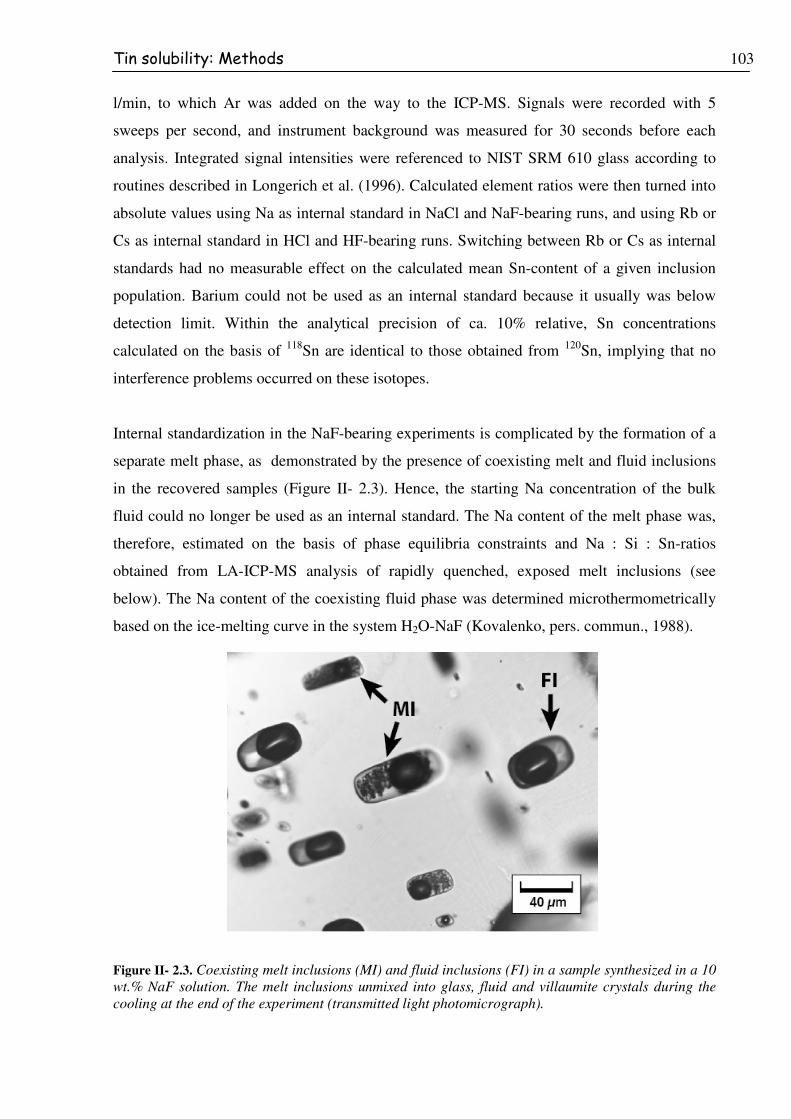
Tin solubility: Methods 103
l/min, to which Ar was added on the way to the ICP-MS. Signals were recorded with 5
sweeps per second, and instrument background was measured for 30 seconds before each
analysis. Integrated signal intensities were referenced to NIST SRM 610 glass according to
routines described in Longerich et al. (1996). Calculated element ratios were then turned into
absolute values using Na as internal standard in NaCl and NaF-bearing runs, and using Rb or
Cs as internal standard in HCl and HF-bearing runs. Switching between Rb or Cs as internal
standards had no measurable effect on the calculated mean Sn-content of a given inclusion
population. Barium could not be used as an internal standard because it usually was below
detection limit. Within the analytical precision of ca. 10% relative, Sn concentrations
calculated on the basis of 118Sn are identical to those obtained from 120Sn, implying that no
interference problems occurred on these isotopes.
Internal standardization in the NaF-bearing experiments is complicated by the formation of a
separate melt phase, as demonstrated by the presence of coexisting melt and fluid inclusions
in the recovered samples (Figure II- 2.3). Hence, the starting Na concentration of the bulk
fluid could no longer be used as an internal standard. The Na content of the melt phase was,
therefore, estimated on the basis of phase equilibria constraints and Na : Si : Sn-ratios
obtained from LA-ICP-MS analysis of rapidly quenched, exposed melt inclusions (see
below). The Na content of the coexisting fluid phase was determined microthermometrically
based on the ice-melting curve in the system H2O-NaF (Kovalenko, pers. commun., 1988).
Figure II- 2.3. Coexisting melt inclusions (MI) and fluid inclusions (FI) in a sample synthesized in a 10 wt.% NaF solution. The melt inclusions unmixed into glass, fluid and villaumite crystals during the cooling at the end of the experiment (transmitted light photomicrograph).

Tin solubility: Results 104
II- 3. Results
Compositions of individual fluid inclusions are listed in Table II- 3.1 and Table II- 3.2, and are
summarized in Figure II- 3.1. Tin concentrations generally increase with increasing Cl and F
concentration in the fluid, regardless of whether Cl and F were added in the form of salts or
acids. However, Sn solubilites are about two orders of magnitude higher in HCl-bearing fluids
than in NaCl-bearing fluids of the same chlorine content (0.8 - 11 wt.% vs. 100-800 ppm).
Since the fluid in the NaF-bearing runs was buffered by the coexisting melt phase at a
constant concentration of 0.5 wt.% NaF, only one point can be shown for this series.
Considering the fact that none of the fluid inclusions produced in this study contain any
daughter crystals, Sn contents of up to 11 wt.% in the HCl-bearing fluid inclusions may
appear surprisingly high. To demonstrate that these high Sn contents are real we subjected
fluid inclusion from sample HCl4 in a subsequent experiment to high oxygen fugacities, with
the idea that the cassiterite dissolution reaction (which involves reduction of tetravalent Sn to
divalent tin; see below) will be reversed, and that dissolved divalent Sn will re-precipitate in
the form of cassiterite within the inclusions. Mavrogenes and Bodnar (1994) showed that
hydrogen diffusion through quartz at temperatures of ≥600 °C is fast enough to allow small
fluid inclusions near the quartz surface to equilibrate to the surrounding fH2 within a matter of
hours to a few days. Two pieces of sample HCl4 were therefore sealed together with a small
amount of water, silicate glass and hematite into a small gold capsule, which itself was sealed
together with water, silicate glass and hematite into a larger gold capsule. The double-capsule
was then held for five days at 670 °C / 129 MPa in a cold-seal pressure vessel pressurized
with Ar (log fO2 ~ NNO + 2). After this experiment, small fluid inclusions near the quartz
surface indeed contained relatively large cassiterite daughter crystals (Figure II- 3.2),
substantiating the Sn concentrations of 2.5-3.9 wt.% measured in identical inclusions by LA-
ICP-MS.

Tin solubility: Results 105
Figure II- 3.1.Summary of Sn-solubilities measured by LA-ICP-MS analysis of synthetic fluid inclusions grown at 700 °C / 140 MPa. (A) HCl vs. NaCl-bearing fluids; (B) HF vs. NaF-bearing fluids. Results from previous studies conducted at similar P/T -conditions are shown for comparison. In all studies, fO2 was buffered near NNO.
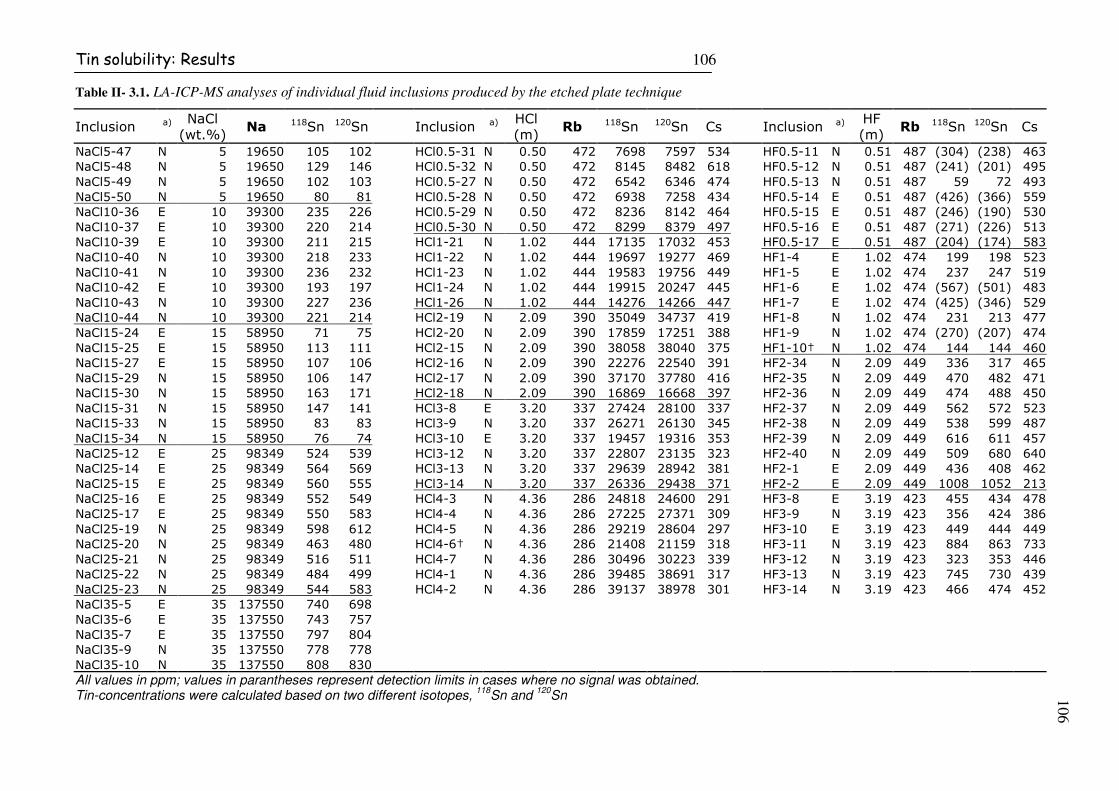
Tin solubility: Results 106
Table II- 3.1. LA-ICP-MS analyses of individual fluid inclusions produced by the etched plate technique
Inclusion a) NaCl
(wt.%) Na
118Sn 120Sn Inclusion a) HCl (m)
Rb 118Sn 120Sn Cs Inclusion a)
HF (m)
Rb 118Sn 120Sn Cs
NaCl5-47 N 5 19650 105 102 HCl0.5-31 N 0.50 472 7698 7597 534 HF0.5-11 N 0.51 487 (304) (238) 463
NaCl5-48 N 5 19650 129 146 HCl0.5-32 N 0.50 472 8145 8482 618 HF0.5-12 N 0.51 487 (241) (201) 495
NaCl5-49 N 5 19650 102 103 HCl0.5-27 N 0.50 472 6542 6346 474 HF0.5-13 N 0.51 487 59 72 493
NaCl5-50 N 5 19650 80 81 HCl0.5-28 N 0.50 472 6938 7258 434 HF0.5-14 E 0.51 487 (426) (366) 559
NaCl10-36 E 10 39300 235 226 HCl0.5-29 N 0.50 472 8236 8142 464 HF0.5-15 E 0.51 487 (246) (190) 530
NaCl10-37 E 10 39300 220 214 HCl0.5-30 N 0.50 472 8299 8379 497 HF0.5-16 E 0.51 487 (271) (226) 513
NaCl10-39 E 10 39300 211 215 HCl1-21 N 1.02 444 17135 17032 453 HF0.5-17 E 0.51 487 (204) (174) 583
NaCl10-40 N 10 39300 218 233 HCl1-22 N 1.02 444 19697 19277 469 HF1-4 E 1.02 474 199 198 523
NaCl10-41 N 10 39300 236 232 HCl1-23 N 1.02 444 19583 19756 449 HF1-5 E 1.02 474 237 247 519
NaCl10-42 E 10 39300 193 197 HCl1-24 N 1.02 444 19915 20247 445 HF1-6 E 1.02 474 (567) (501) 483
NaCl10-43 N 10 39300 227 236 HCl1-26 N 1.02 444 14276 14266 447 HF1-7 E 1.02 474 (425) (346) 529
NaCl10-44 N 10 39300 221 214 HCl2-19 N 2.09 390 35049 34737 419 HF1-8 N 1.02 474 231 213 477
NaCl15-24 E 15 58950 71 75 HCl2-20 N 2.09 390 17859 17251 388 HF1-9 N 1.02 474 (270) (207) 474
NaCl15-25 E 15 58950 113 111 HCl2-15 N 2.09 390 38058 38040 375 HF1-10† N 1.02 474 144 144 460
NaCl15-27 E 15 58950 107 106 HCl2-16 N 2.09 390 22276 22540 391 HF2-34 N 2.09 449 336 317 465
NaCl15-29 N 15 58950 106 147 HCl2-17 N 2.09 390 37170 37780 416 HF2-35 N 2.09 449 470 482 471
NaCl15-30 N 15 58950 163 171 HCl2-18 N 2.09 390 16869 16668 397 HF2-36 N 2.09 449 474 488 450
NaCl15-31 N 15 58950 147 141 HCl3-8 E 3.20 337 27424 28100 337 HF2-37 N 2.09 449 562 572 523
NaCl15-33 N 15 58950 83 83 HCl3-9 N 3.20 337 26271 26130 345 HF2-38 N 2.09 449 538 599 487
NaCl15-34 N 15 58950 76 74 HCl3-10 E 3.20 337 19457 19316 353 HF2-39 N 2.09 449 616 611 457
NaCl25-12 E 25 98349 524 539 HCl3-12 N 3.20 337 22807 23135 323 HF2-40 N 2.09 449 509 680 640
NaCl25-14 E 25 98349 564 569 HCl3-13 N 3.20 337 29639 28942 381 HF2-1 E 2.09 449 436 408 462
NaCl25-15 E 25 98349 560 555 HCl3-14 N 3.20 337 26336 29438 371 HF2-2 E 2.09 449 1008 1052 213
NaCl25-16 E 25 98349 552 549 HCl4-3 N 4.36 286 24818 24600 291 HF3-8 E 3.19 423 455 434 478
NaCl25-17 E 25 98349 550 583 HCl4-4 N 4.36 286 27225 27371 309 HF3-9 N 3.19 423 356 424 386
NaCl25-19 N 25 98349 598 612 HCl4-5 N 4.36 286 29219 28604 297 HF3-10 E 3.19 423 449 444 449
NaCl25-20 N 25 98349 463 480 HCl4-6† N 4.36 286 21408 21159 318 HF3-11 N 3.19 423 884 863 733
NaCl25-21 N 25 98349 516 511 HCl4-7 N 4.36 286 30496 30223 339 HF3-12 N 3.19 423 323 353 446
NaCl25-22 N 25 98349 484 499 HCl4-1 N 4.36 286 39485 38691 317 HF3-13 N 3.19 423 745 730 439
NaCl25-23 N 25 98349 544 583 HCl4-2 N 4.36 286 39137 38978 301 HF3-14 N 3.19 423 466 474 452
NaCl35-5 E 35 137550 740 698
NaCl35-6 E 35 137550 743 757
NaCl35-7 E 35 137550 797 804
NaCl35-9 N 35 137550 778 778
NaCl35-10 N 35 137550 808 830
All values in ppm; values in parantheses represent detection limits in cases where no signal was obtained.
Tin-concentrations were calculated based on two different isotopes, 118
Sn and 120
Sn 106

Tin solubility: Results 107
Table II- 3.2. LA-ICP-MS analyses of individual fluid inclusions produced by the in-situ cracking technique
Inclusion HCl
(m) Cs
118Sn Rb Inclusion HF
(m) Cs
118Sn Rb
HCl4-I-1 4 603 101112 578 HF3-I-1 3.14 851 2066 1020
HCl4-I-3 4 603 99204 460 HF3-I-2 3.14 851 1771 919
HCl4-I-4 4 603 120873 553 HF3-I-3 3.14 851 2209 836
HCl4-I-5 4 603 103671 789 HF3-I-4 3.14 851 1802 1000
HCl4-I-6 4 603 117376 484 HF3-I-5 3.14 851 1726 840
HCl4-I-7 4 603 118042 656 HF3-I-6 3.14 851 1738 918
HCl4-I-8 4 603 127563 483 HF3-I-7 3.14 851 1933 1019
HCl4-I-10 4 603 117175 540 HF3-I-8 3.14 851 2049 770
HCl4-I-11 4 603 113780 572 HF3-I-9 3.14 851 2094 940
HCl4-I-12 4 603 101791 704 HF3-I-11 3.14 851 1823 904
HF3-I-12 3.14 851 2296 934
HF3-I-13 3.14 851 2100 971
All values in ppm; Tin-concentrations were calculated based on 118
Sn
Figure II- 3.2. Fluid inclusions synthesized in a 4m HCl-solution. Typical views (A) before, and (B) after diffusive re-equilibration at 670 °C / 130 MPa and a high (but unknown) oxygen fugacity. After equilibration, each inclusion contains a relatively large daughter crystal of cassiterite (identified by Raman spectroscopy), in agreement with Sn contents of 2.5-3.9 wt.% determined by LA-ICP-MS (transmitted light photomicrographs).
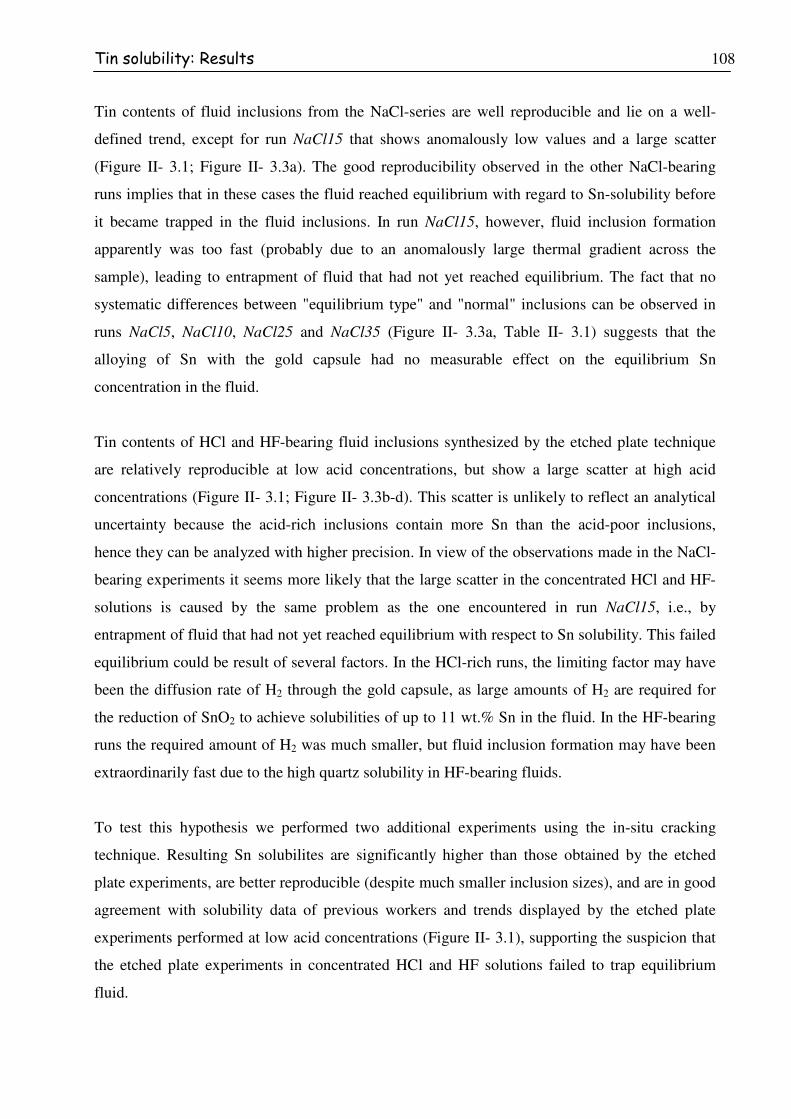
Tin solubility: Results 108
Tin contents of fluid inclusions from the NaCl-series are well reproducible and lie on a well-
defined trend, except for run NaCl15 that shows anomalously low values and a large scatter
(Figure II- 3.1; Figure II- 3.3a). The good reproducibility observed in the other NaCl-bearing
runs implies that in these cases the fluid reached equilibrium with regard to Sn-solubility before
it became trapped in the fluid inclusions. In run NaCl15, however, fluid inclusion formation
apparently was too fast (probably due to an anomalously large thermal gradient across the
sample), leading to entrapment of fluid that had not yet reached equilibrium. The fact that no
systematic differences between "equilibrium type" and "normal" inclusions can be observed in
runs NaCl5, NaCl10, NaCl25 and NaCl35 (Figure II- 3.3a, Table II- 3.1) suggests that the
alloying of Sn with the gold capsule had no measurable effect on the equilibrium Sn
concentration in the fluid.
Tin contents of HCl and HF-bearing fluid inclusions synthesized by the etched plate technique
are relatively reproducible at low acid concentrations, but show a large scatter at high acid
concentrations (Figure II- 3.1; Figure II- 3.3b-d). This scatter is unlikely to reflect an analytical
uncertainty because the acid-rich inclusions contain more Sn than the acid-poor inclusions,
hence they can be analyzed with higher precision. In view of the observations made in the NaCl-
bearing experiments it seems more likely that the large scatter in the concentrated HCl and HF-
solutions is caused by the same problem as the one encountered in run NaCl15, i.e., by
entrapment of fluid that had not yet reached equilibrium with respect to Sn solubility. This failed
equilibrium could be result of several factors. In the HCl-rich runs, the limiting factor may have
been the diffusion rate of H2 through the gold capsule, as large amounts of H2 are required for
the reduction of SnO2 to achieve solubilities of up to 11 wt.% Sn in the fluid. In the HF-bearing
runs the required amount of H2 was much smaller, but fluid inclusion formation may have been
extraordinarily fast due to the high quartz solubility in HF-bearing fluids.
To test this hypothesis we performed two additional experiments using the in-situ cracking
technique. Resulting Sn solubilites are significantly higher than those obtained by the etched
plate experiments, are better reproducible (despite much smaller inclusion sizes), and are in good
agreement with solubility data of previous workers and trends displayed by the etched plate
experiments performed at low acid concentrations (Figure II- 3.1), supporting the suspicion that
the etched plate experiments in concentrated HCl and HF solutions failed to trap equilibrium
fluid.
Tin solubility: Results 109
Figure II- 3.3. Tin content of individual fluid inclusions plotted against ligand concentration (all concentrations expressed as mole fractions). The graphs allow testing for the cassiterite dissolution reactions 1, 2, 5 and 6 as explained in the text. Each data point represents a single fluid inclusion analysis, with full symbols denoting "normal inclusions", and empty symbols denoting "equilibrium-type" inclusions.
Information on potential Sn-complexes in the fluid was obtained by procedures similar to the
ones discussed in Wilson and Eugster (1990). The atomic ratio of metal ion to complexing anion
can be estimated graphically from a set of solubility data in which the ligand concentration is the
only variable. If the log of the measured Sn concentrations is plotted against the log of the
corresponding ligand concentrations, the slope of interpolating lines yields the ligand/Sn-ratio of
the dominant species in the fluid. Potential dissolution reactions were written on the assumption
that at the oxygen fugacities near the Ni-NiO buffer all Sn is dissolved in the divalent state (e.g.,
Kovalenko et al., 1986; Wilson and Eugster, 1990) and those only neutral charges species occur
in the fluid (e.g., Eugster and Baumgartner, 1987). In a first attempt, only ligand numbers of 1 or
2 are considered.
Tin solubility: Results 110
Two potential reactions in the HCl-bearing runs are:
SnO2 + HCl + H2 ⇔ Sn(OH)Cl + H2O (Eq. II-3.1)
SnO2 + 2HCl + H2 ⇔ SnCl2 + 2H2O (Eq.II- 3.2)
The equilibrium equation of reaction 2 (Eq.II-5.2), for example, is:
K =SnCl2[ ] H2O[ ]
2
SnO2[ ] HCl[ ]2
f H2
(Eq.II- 3.3)
Since the activity of SnO2 (a pure phase) by definition is unity, this can be transformed into:
log SnCl2[ ] H2O[ ]2( )= 2 ⋅ log HCl[ ]+ log f H2
⋅ K( ) (Eq.II- 3.4)
If cassiterite was dissolving in all our HCl-bearing experiments according to reaction 2 (Eq.II-
5.2), measured solubilites should plot in a graph of log SnCl2[ ] H2O[ ]2( ) vs. log HCl[ ] on a
straight line with a slope of +2. However, if it was dissolving according to reaction 1 (Eq.II-5.1),
measured Sn solubilites should plot, in a graph of log log Sn(OH)Cl[ ] H2O[ ]( ) vs. log HCl[ ], on a
line with a slope of +1. In applying this principle, it does not matter which concentration unit is
used, as the absolute value of K has no influence on the slope of the line. For the HF- and NaCl-
bearing experiments the following reactions were investigated:
SnO2 + 2HF + H2 ⇔ SnF2 + 2H2O (Eq.II- 3.5)
SnO2 + NaCl + H2 ⇔ Sn(OH)Cl + NaOH (Eq.II- 3.6)
Following the work of Ellis (1963), Aranovich and Newton (1996), Tagirov et al. (1997),
Pokrovskii (1999), and Newton and Manning (2000) it was assumed that HCl, NaCl and HF
were fully associated in our experiments. Equilibrium concentrations of HCl, NaCl and HF were
corrected for the amounts of Cl and F incorporated in the Sn-complexes. This correction had a
significant effect only for the HCl-bearing runs and is responsible to the nonlinear data arrays in
Figure II- 3.3-b, -c. For reaction 6 (Eq.II-5.6), it was further assumed that the concentration of
NaOH was independent of Sn-solubility, as it is governed by the reaction
NaCl + H2O ⇔ NaOH + HCl .
Tin solubility: Discussion 111
II- 4. Discussion
A rigorous comparison of our solubility data with earlier work is possible only for the HCl-
bearing experiments because most previous studies were either performed at lower temperatures
(e.g., Klintsova and Barsukov, 1973; Kovalenko et al., 1986, 1988) or with more complex fluids
(Taylor and Wall, 1993). Results from our 0.5 and 1.0 m HCl etched plate experiments and the 4
m HCl in-situ cracking experiments fit well onto a trend defined by three measurements at 700
°C / 100 MPa by Kovalenko et al. (1986) and two measurements at 700 °C / 150 MPa by Wilson
and Eugster (1990). As discussed above, the deviation of the 2.1 m, 3.2 m and 4.4 m HCl etched
plate experiments from this trend can be explained by the entrapment of disequilibrium fluids.
The plots in Figure II- 3.3-a, -b demonstrate that neither reaction 1 (Eq.II-5.1), nor reaction 2
(Eq.II-5.2), can fully explain the data set, but that a combination of them could do so. We
therefore suggest that Sn dissolves in HCl-bearing fluids both as Sn(OH)Cl and as SnCl2, with
the latter species becoming dominant at high fluid acidities. This interpretation is in accord with
the results of Kovalenko et al. (1986), Wilson and Eugster (1990), and Taylor and Wall (1993),
who all found average ligand numbers between one and two that increase with increasing
acidity. The lack of daughter crystals in synthetic fluid inclusions containing up to 11 wt.% Sn is
in agreement with SnCl2 being the dominant species in very HCl-rich fluids, as SnCl2 remains
soluble during cooling to room temperature (SnCl2 solubility in pure water at ambient conditions
is 89g/100 ml).
Results from the HF-bearing experiments can be compared with data of Kovalenko et al. (1988).
Although the latter study was conducted at significantly lower temperatures and pressures (500
°C / 100 MPa), the trend displayed by their data matches well the trend defined by the maximum
values of the etched plate runs with 0.5, 1 and 2 m HF solutions and the in-situ cracking
experiment with the 3 m HF solution (Figure II- 3.1b). Graphical evaluation of our data indicates
a ligand number of 2 (Figure II- 3.3d), consistent with the findings of Kovalenko et al. (1988)
who concluded that SnF2 is the dominant tin-bearing complex in their experiments at 500 °C /
100 MPa.
The data obtained from the NaCl-bearing experiments lie on a well-defined trend with a slope of
+1 (Figure II- 3.3a), suggesting that cassiterite may have dissolved according to reaction 6
(Eq.II-5.6). Tin transport in the form of Sn(OH)Cl was proposed also by Kovalenko et al. (1988)
based on two solubility measurements in 0.5 m and 4 m NaCl-solutions at 500 °C / 100 MPa.
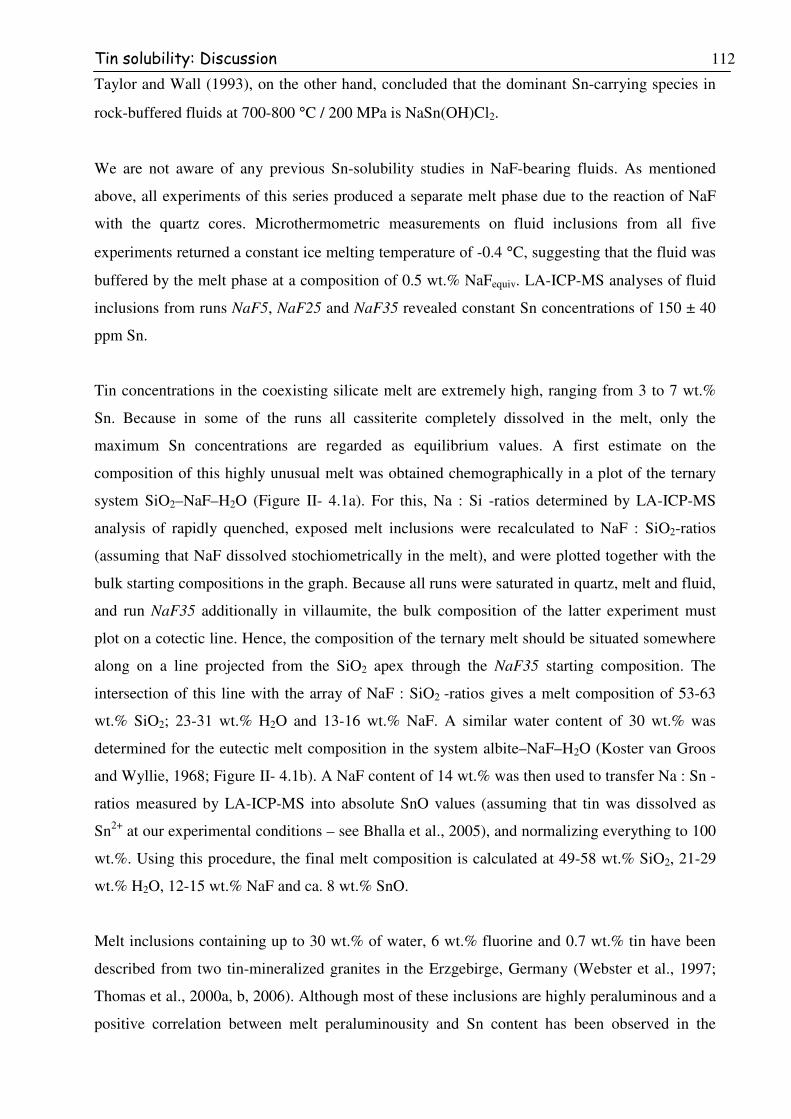
Tin solubility: Discussion 112
Taylor and Wall (1993), on the other hand, concluded that the dominant Sn-carrying species in
rock-buffered fluids at 700-800 °C / 200 MPa is NaSn(OH)Cl2.
We are not aware of any previous Sn-solubility studies in NaF-bearing fluids. As mentioned
above, all experiments of this series produced a separate melt phase due to the reaction of NaF
with the quartz cores. Microthermometric measurements on fluid inclusions from all five
experiments returned a constant ice melting temperature of -0.4 °C, suggesting that the fluid was
buffered by the melt phase at a composition of 0.5 wt.% NaFequiv. LA-ICP-MS analyses of fluid
inclusions from runs NaF5, NaF25 and NaF35 revealed constant Sn concentrations of 150 ± 40
ppm Sn.
Tin concentrations in the coexisting silicate melt are extremely high, ranging from 3 to 7 wt.%
Sn. Because in some of the runs all cassiterite completely dissolved in the melt, only the
maximum Sn concentrations are regarded as equilibrium values. A first estimate on the
composition of this highly unusual melt was obtained chemographically in a plot of the ternary
system SiO2–NaF–H2O (Figure II- 4.1a). For this, Na : Si -ratios determined by LA-ICP-MS
analysis of rapidly quenched, exposed melt inclusions were recalculated to NaF : SiO2-ratios
(assuming that NaF dissolved stochiometrically in the melt), and were plotted together with the
bulk starting compositions in the graph. Because all runs were saturated in quartz, melt and fluid,
and run NaF35 additionally in villaumite, the bulk composition of the latter experiment must
plot on a cotectic line. Hence, the composition of the ternary melt should be situated somewhere
along on a line projected from the SiO2 apex through the NaF35 starting composition. The
intersection of this line with the array of NaF : SiO2 -ratios gives a melt composition of 53-63
wt.% SiO2; 23-31 wt.% H2O and 13-16 wt.% NaF. A similar water content of 30 wt.% was
determined for the eutectic melt composition in the system albite–NaF–H2O (Koster van Groos
and Wyllie, 1968; Figure II- 4.1b). A NaF content of 14 wt.% was then used to transfer Na : Sn -
ratios measured by LA-ICP-MS into absolute SnO values (assuming that tin was dissolved as
Sn2+ at our experimental conditions – see Bhalla et al., 2005), and normalizing everything to 100
wt.%. Using this procedure, the final melt composition is calculated at 49-58 wt.% SiO2, 21-29
wt.% H2O, 12-15 wt.% NaF and ca. 8 wt.% SnO.
Melt inclusions containing up to 30 wt.% of water, 6 wt.% fluorine and 0.7 wt.% tin have been
described from two tin-mineralized granites in the Erzgebirge, Germany (Webster et al., 1997;
Thomas et al., 2000a, b, 2006). Although most of these inclusions are highly peraluminous and a
positive correlation between melt peraluminousity and Sn content has been observed in the

Tin solubility: Discussion 113
samples from Ehrensfriedersdorf (Webster et al., 1997; Thomas et al., 2000b). Recent results
from Zinnwald (Thomas et al., 2005) suggest that a second, even more hydrous melt of
peralkaline character exsolved from the peraluminous melt at high degrees of melt fractionation.
Synchrotron-XRF analyses on such peralkaline melt inclusions revealed Sn contents that were
comparable to – if not even higher than – that of coexisting peraluminous melt inclusions,
demonstrating that significant amounts of Sn were transported by a highly peralkaline phase at
the very final stage of magma crystallization (Thomas et al., 2005). This interpretation is
supported by the fact that at Zinnwald the Sn concentration of the peraluminous melt decreases
with increasing degree of melt fractionation.
Figure II- 4.1. (A) Chemographic reconstruction of the melt composition in the fluid-saturated system SiO2–NaF–H2O at 700 °C / 140 MPa, based on Na : Si -ratios determined by LA-ICP-MS analysis of exposed melt inclusions, and the phase assemblages produced in the different starting compositions. Runs NaF5, NaF10, NaF15 and NaF25 contained quartz, fluid and melt, whereas Run NaF35 additionally was saturated in villaumite, implying that this starting composition is situated on a cotectic line. Intersection of this line with the array of recalculated NaF : SiO2 -ratios defines the melt composition somewhere in the dark grey area. (B) An isobaric, isothermal cut through the eutectic point E in the system NaAlSi3O8 – NaF – H2O at 688 °C / 100 MPa is shown for comparison (Koster van Groos and Wyllie; 1968). All compositions are plotted in terms of weight ratios.

Tin solubility: Implications for fluid–melt partitioning 114
II- 5. Implications for fluid–melt partitioning
The results of this study can be used in conjunction with available data on cassiterite solubility in
silicate melts (Taylor and Wall, 1992; Linnen et al., 1995, 1996; Bhalla et al., 2005) to estimate
fluid–melt partition coefficients of Sn. The solubility of SnO2 in a haplogranitic melt (ASI = 1)
at 850 °C / 200 MPa and an oxygen fugacity near NNO is 0.7-0.9 wt.% (Linnen et al., 1996).
Bhalla et al. (2005) found that the SnO2-solubility in a natural, peraluminous granitic melt with
2.8 wt.% normative corundum at 200 MPa and log fO2 ~ NNO decreases from 1.2 to 0.32 wt.%
if the temperature is lowered from 850 °C to 700 °C. Assuming that a similar temperature effect
applies for the haplogranite melt and that the effect of pressure is comparatively small, Sn-
solubility in a haplogranite melt at 700 °C / 0.14 GPa can be estimated at 1500-1900 ppm Sn.
Let us now assume that this melt is saturated in an aqueous fluid with 5 wt.% total salinity,
which is a typical value for granites crystallizing at pressures of 100-200 MPa (Burnham, 1979;
Audétat and Pettke, 2003). In order to estimate the Sn-solubility in this fluid one needs to know
the relative abundance of HCl vs. (NaCl, KCl), because – as shown above – the Sn-solubility in
HCl-bearing fluids is far higher than in NaCl-bearing fluids of the same chloride content.
Experimental data summarized in Burnham (1979), Candela and Piccoli (1995) and Frank et al.,
(2003) suggest that in a fluid of 5 wt.% salinity in equilibrium with haplogranite melt (ASI=1) at
800 °C / 100 MPa, ca. 5-10% of the total chlorine is present as HCl (corresponding to 0.05-0.1 m
HCl). According to the data presented in Figure II- 3.1a, this HCl concentration corresponds to a
solubility of 250-700 ppm Sn, whereas the remaining 4-4.5 wt.% NaCl+KCl (~ 0.8 m) leads to
dissolution of another 100 ppm Sn (assuming that the cassiterite solubility in KCl-bearing fluids
is comparable to that in NaCl-bearing fluids). Hence, the Sn-solubility in the magmatic fluid is
governed by its HCl content despite of a much higher abundance of NaCl and KCl.
From the data presented above, a value of DSn, fluid/melt = 0.2-0.5 can be inferred for a
haplogranitic melt in equilibrium with a low-salinity fluid at 700 °C / 100-200 MPa and log fO2
~ NNO. This result is in agreement with experimental studies of Taylor (1988) and Keppler and
Wyllie (1991), who found that DSn, fluid/melt is <1 in runs with fluids of similar salinity. Also, our
calculated DSn, fluid/melt compares favorably with the DSn, fluid/melt = 0.1-0.2 derived from LA-ICP-
MS analyses of coexisting melt and fluid inclusions in the Canada Pinabete Pluton in northen
New Mexico, USA (Audétat and Pettke, 2003). Attainment of fluid saturation in a crystallizing
magma will therefore not result in a depletion of Sn in the residual melt. Rather, the Sn content
Tin solubility: Implications for fluid–melt partitioning 115
of the residual melt will continue to increase rapidly, because at a typical solubility of 5 wt.%
H2O in the melt a DSn, fluid/melt greater than 20 would be needed to result in a net depletion of Sn
in the residual melt (assuming 100% incompatibility of Sn with respect to the crystallizing solid
phases). The occurrence of Sn-rich melt inclusions in fluid-saturated, pegmatitic environments
(see above) supports this conclusion. The presence of fluorine is unlikely to change this general
picture because Sn-solubilities in < 1m HF-solutions were shown to be small (<200 ppm Sn),
and because the Sn-solubility in F-bearing melts is similar to that in F-free melts (Bhalla et al.,
2005). In fact, DSn, fluid/melt in F-bearing systems is probably smaller than in the F-free system
because DCl, fluid/melt decreases rapidly with increasing F concentration the melt (Webster and
Holloway, 1990). It should be noted that most Sn-related magmas are peraluminous, which leads
to a higher fluid acidity than in the case of subaluminous magmas (e.g., Urabe, 1985).
Fluid/melt-partition coefficients in tin-mineralizing magmas could therefore be significantly
higher than the value of 0.2-0.5 estimated based on a subaluminous melt composition. However,
the common presence of Sn-rich melt inclusions trapped at fluid-saturated conditions indicates
that in these systems DSn, fluid/melt usually is far from the critical value of ~20, above which no Sn-
enrichment in the residual melt would occur.
Tin solubility: Conclusions 116
II- 6. Conclusions
The combination of synthetic fluid inclusions with Laser-ablation ICP-MS analysis represent a
powerful tool to measure mineral solubilities at high pressures and temperatures. This technique
is particularly advantageous if solutes re-precipitate during quenching, as is the case for most
studies at magmatic-hydrothermal conditions (e.g., Loucks and Mavrogenes, 1999; Hack and
Mavrogenes, 2006). The present study seems to be an exception because the Sn solubilities
achieved during the experiments appear to be quenchable to room temperature without
precipitation of any solid phases. The newly developed etched plate technique produces large,
primary fluid inclusions along a single plane, facilitating sample preparation and inclusions
analysis. If used in combination with fine-grained solute, this technique can be used to
investigate potential disequilibrium effects caused by alloying with the capsule walls. Results
from the NaCl-bearing runs suggest that there was no such effect in our experiments. However,
Sn solubilities obtained by the etched plate technique in the most concentrated HCl and HF
solutions show a large scatter and plot significantly below those obtained by the in-situ cracking
technique after one week of pre-equilibration, demonstrating that caution is required if mineral
solubilities depend on time-dependent factors such as diffusion rates of H2 through the capsule
walls. In these cases, the in-situ cracking technique is the preferred method, despite the fact that
resulting fluid inclusions are smaller and, therefore, more difficult to analyze.
Our data confirm earlier findings that cassiterite-solubility in HCl-bearing fluids is about two
orders of magnitude higher than in NaCl and HF-bearing fluids of the same molality. Tin is
transported most likely as Sn(OH)Cl in the NaCl-bearing fluids, as Sn(OH)Cl and SnCl2 in the
HCl-bearing fluids, and as SnF2 in the HF-bearing fluids. A comparison of our data with
published cassiterite solubilities in silicate melts suggests that the fluid/melt partition coefficient
of Sn is smaller than 1 (an the order of 0.2-0.5 in a haplogranitic system at 700 °C / 140 MPa and
log fO2 near NNO) and is governed by the abundance of HCl in the fluid. The alumina saturation
index of the melt is expected to exert a strong control on DSn, fluid/melt due to its influence on fluid
acidity. However, reports of tin concentrations of up to 7000 ppm Sn in natural, peraluminous
melt inclusions suggest that even relatively acidic fluids cannot efficiently remove Sn from these
melt. A potential mechanism for Sn extraction at the final stages of magma crystallization is
through alkaline, F-bearing melts similar to those observed in our NaF-bearing experiments.
Evidence for the existence of such melts is reported from a tin-mineralized granite at Zinnwald
(Thomas et al., 2005).

117
References
Aranovich L. Y. and Newton R. C. (1996) H2O activity in concentrated NaCl solutions at high
pressures and temperatures measured by the brucite-periclase equilibrium. Contrib. Min.
Petrol. 125, 200-212.
Audétat A. and Pettke T. (2003) The magmatic-hydrothermal evolution of two barren granites: a melt
and fluid inclusion study of the Rito del Medio and Cañada Pinabete Plutons in northern New
Mexico (USA). Geochim. Cosmochim. Acta 67, 97-121.
Baumann L., Kuschka E., and Seifert T. (2000) Lagerstätten des Erzgebirges. Enke, Stuttgart.
Bhalla P., Holtz F., Linnen R. L., and Behrens H. (2005) Solubility of cassiterite in evolved granitic
melts: effect of T, fO2, and additional volatiles. Lithos 80, 387-400.
Burnham C. W. (1979) Magmas and hydrothermal fluids. In Geochemistry of hydrothermal ore
deposits (ed. H. L. Barnes), Wiley, New York, pp. 71-136.
Candela P. A. and Piccoli P. M. (1995) Model ore-metal partitioning from melts into vapor and
vapor/brine mixtures. In Magmas, Fluids and Ore Deposits, (ed. J. F. H. Thompson), pp. 101-
128. Mineralogical Association of Canada, Short Course Series, Vol. 23.
Ellis A. J. (1963) The effect of temperature on the ionization of hydrofluoric acid. Chem. Soc.
[London] Jour. 166, 4300-4304.
Eugster H. P. and Baumgartner L. (1987) Mineral solubilities and speciation in supercritical
metamorphic fluids. In Thermodynamic modeling of geological materials; minerals, fluids
and melts, Reviews in Mineralogy, Vol. 17 (ed. I. S. E. Carmichael and H. P. Eugster),
Mineralogical Society of America, Washington DC, pp. 367-403.
Frank M. R., Candela P. A., and Piccoli P. M. (2003) Alkali exchange equilibria between a silicate
melt and coexisting magmatic volatile phase: An experimental study at 800 °C and 100 MPa.
Geochim. Cosmochim. Acta 67, 1415-1427.
Hack A. C. and Mavrogenes J. A. (2006) A synthetic fluid inclusion study of copper solubility in
hydrothermal brines from 525 to 725 °C and 0.33 to 1.7 GPa. Geochim. Cosmochim. Acta 70,
3970-3985.
Günther D., Frischknecht R., Heinrich C. A., and Kahlert H. J. (1997) Capabilities of an Argon
Fluoride 193nm Excimer Laser for Laser Ablation Inductively Coupled Plasma Mass
Spectrometry Microanalysis of Geological Materials. J. Anal. Atom. Spectrom. 12, 939-944.
Günther D., Audétat A., Frischknecht R., and Heinrich C. A. (1998) Quantitative analysis of major,
minor and trace elements in fluid inclusions using Laser Ablation-Inductively Coupled
Plasma-Mass Spectrometry (LA-ICP-MS). J. Anal. Atom. Spectrom. 13, 263-270.
Keppler H. and Willie P. J. (1991) Partitioning of Cu, Sn, Mo, W, U and Th between melt and
aqueous fluid in the systems haplogranite-H2O-HCl and haplogranite-H2O-HF. Contrib.
Mineral. Petrol. 109, 139-150.
118
Klintsova A. P. and Barsukov V. L. (1973) Solubility of cassiterite in water and in aqueous NaOH
solutions at elevated temperatures. Geochem. Int. 10, 540-547.
Klintsova A. P., Barsukov V. L., Shemarykina T. P., and Khodakovskiy L. I. (1975) Measurement of
the stability constants for Sn(IV) hydrofluoride complexes. Geochem. Int. 12, 207-215.
Kovalenko N. I., Ryzhenko B. N., Barsukov V. L., Klintsova A. P., Velyukhanova T. K., Vlynets M.
P., and Kitayeva L. P. (1986) The solubility of cassiterite in HCl and HCl + NaCl (KCl)
solutions at 500 ºC and 1000 atm under fixed redox conditions. Geochem. Int. 23, 1-16.
Kovalenko N. I., Ryzhenko B. N., Velyukhanova T. K., and Barsukov V. L. (1988) Cassiterite
solubility in HF solutions and forms of tin transport by supercritical fluids. Transactions
(Doklady) of the U.S.S.R. Academy of Sciences: Earth Science Sections 290, 212-215.
Koster van Groos A. F. and Wyllie P. J. (1968) Melting relationships in the system NaAlSi3O8–NaF–
H2O to 4 kilobars pressure. J. Geology 76, 50-70.
Lehmann B. (1990) Metallogeny of Tin. Springer, Berlin.
Linnen R. L., Pichavant M., Holtz F., and Burgess S. (1995) The effect of fO2 on the solubility,
diffusion, and speciation of tin in haplogranitic melt at 850 ° and 2 kbar. Geochim.
Cosmochim. Acta 59, 1579-1588.
Linnen R. L., Pichavant M., and Holtz F. (1996) The combined effects of fO2 and melt composition on
SnO2 solubility and tin diffusivity in haplogranitic melts. Geochim. Cosmochim. Acta 60,
4965-4976.
Longerich H. P., Jackson S. E., and Günther D. (1996) Laser ablation inductively coupled plasma
mass spectrometric transient signal data acquisition and analyte concentration calculation. J.
Anal. Atom. Spectrom. 11, 899-904.
Loucks R. R. and Mavrogenes J. A. (1999) Gold solubility in supercritical hydrothermal brines
measured in synthetic fluid inclusions. Science 284, 2159-2163.
Mavrogenes J. A. and Bodnar R. J. (1994) Hydrogen movement into and out of fluid inclusions in
quartz: experimental evidence and geologic implications. Geochim. Cosmochim. Acta 58, 141-
148.
Nekrasov I. Y. and Ladze T. P. (1973) Solubility of cassiterite in silicic chloride solutions at 300 and
400 ºC. Doklady Akad. Nauk SSSR 213, 145-147.
Nekrasov I. Y., Epel'baum M. B., and Sobolev V. P. (1980) Partitioning of tin between melt and
chloride fluid in the granite-SnO-SnO2 fluid system. Doklady, Acad. Sci. USSR, Earth Sci.
Section 252, 165-168.
Newton R. C. and Manning C. E. (2000) Quartz solubility in H2O-NaCl and H2O-CO2 solutions at
deep crust-upper mantle pressures and temperatures: 2-15 kbar and 500-900 ºC. Geochim.
Cosmochim. Acta 64, 2993-3005.
Pokrovskii V. A. (1999) Calculation of the standard partial molal thermodynamic properties and
dissociation constants of aqueous HClº and HBrº at temperatures to 1000 ºC and pressures to 5
119
kbar. Geochim. Cosmochim. Acta 63, 1107-1115.
Sterner S. M. (1992) Synthetic fluid inclusions XI. Notes on the application of synthetic fluid
inclusions to high P-T experimental aqueous geochemistry. Am. Mineral. 77, 156-167.
Tagirov B. R., Zotov A. V., and Akinfiev N. N. (1997) Experimental study of dissociation of HCl
from 350 to 500 ºC and from 500 to 2500 bars: thermodynamic properties of HClº(aq).
Geochim. Cosmochim. Acta 61, 4267-4280.
Taylor J. R. (1988) Experimental studies on tin in magmatic-hydrothermal systems. Ph. D. thesis,
Monash University, Australia.
Taylor J. R. and Wall V. J. (1992) The behavior of tin in granitoid magmas. Econ. Geol. 87, 403-420.
Taylor J. R. and Wall V. J. (1993) Cassiterite solubility, tin speciation, and transport in a magmatic
aqueous phase. Econ. Geol. 88, 437-460.
Thomas R., Webster J. D., and Heinrich W. (2000a) Melt inclusions in pegmatitic quartz: complete
miscibility between silicate melts and hydrous fluids at low pressure. Contrib. Mineral.
Petrol. 139, 394-401.
Thomas R. and Webster J. D. (2000b) Strong tin enrichment in a pegmatite-forming melt. Mineralium
Deposita 35, 570-582.
Thomas R., Förster H. J., Rickers K., and Webster J. D. (2005) Formation of extremely hydrous melt
fractions and hydrothermal fluids during differentiation of highly evolved tin-granite magmas:
a melt/fluid inclusion study. Contrib. Min. Petrol. 148, 582-601.
Urabe T. (1985) Aluminous granite as a source of hydrothermal ore deposits: an experimental study.
Econ. Geol. 80, 148-157.
Webster J. D. and Holloway J. R. (1990) Partitioning of F and Cl between magmatic hydrothermal
fluids and highly evolved granitic magmas. In Ore-bearing granite systems; Petrogenesis and
mineralizing processes (ed. H. J. Stein and J. L. Hannah), Geological Society of America,
Special Paper, Vol. 246, pp. 21-34.
Webster J. D., Thomas R., Rhede D., Förster H. J., and Seltmann R. (1997) Melt inclusions in quartz
from an evolved peraluminous pegmatite: Geochemical evidence for strong tin enrichment in
fluorine-rich and phosphorous-rich residual liquids. Geochim. Cosmochim. Acta 61, 2589-
2604.
Tischendorf G. (1977) Geochemical and petrographic characteristics of silicate magmatic rocks
associated with rare-element mineralization. In Metallization associated with acidic
magmatism (eds. M. Stemprok, L. Burnol and G. Tischendorf), Ustred. ustav. geol., Vol. 2,
Prague, pp. 41-96.
Wilson G. A. and Eugster H. P. (1990) Cassiterite solubility and tin speciation in supercritical chloride
solutions. In Fluid-mineral interactions: a tribute to H.P. Eugster (ed. R. J. Spencer and I. M.
Chou), The Geochemical Society, Special Publication , Vol. 2, pp. 179-195.