Embed Size (px)
Citation preview
SERl/TR-252-2897 UC Category: 59a DEB8001 11 9
Experimental Studies of Heat and Mass Exchange in Parallel-Passage Rotary Desiccant Dehumidifiers for Solar Cooling Applications
D. Bharathan J. M. Parsons 1. I. Maclaine-cross
November 1987
Prepared under Task No. 3023.210 FTP NO. 01-540A
Solar Energy Research Institute A Division of Midwest Research tnstitute
161 7 Cole Boulevard Golden, Colorado 80401-3393
Prepared for the
U.S. Department of Energy Contract No. DE-AC02-83CH10093
NOTICE
This report was prepared as an account of work sponsored by the United States Government. Neither the United States nor the United States Department of Energy, nor any of their employees, nor any of their contractors, subcontractors, or their employees, makes any warranty, expressed or implied, or assumes any legal liability or responsibility for the accuracy, completeness or usefulness of any information, apparatus. product or process disclosed, or represents that its use would not infringe privately owned rights.
Printed in the United States of America Available from:
National Technical Information Service U.S. Department of Commerce
5285 Port Royal Road Springfield, VA 22161
Price: Microfiche A01 Printed Copy A06
Codes are used for pricing all publications. The code is determined by the number of pages in the publication. Information pertaining to the pricing codes can be found in the current issue of the following publications. which are generally available in most libraries: Energy Research Abstracts. (ERA): Government Reports Announcements and Index (GRA and I): Scientific and Technical Abstract Reports (STAR): and publication, NTIS-PR-360 available from NTlS at the above address.
PREFACE
In keeping with the national energy policy goal of fostering an adequate supply of energy a t a reasonable cost, the United States Department of Energy (DOE) supports a variety of programs t o promote a balanced and mixed energy resource system. The mission of the DOE Solar Buildings Research and Development Program is t o support this goal by providing for the development of solar technology alternatives for the buildings sector. I t is the goal of the Program t o establish a proven technology base t o allow industry t o develop solar products and designs for buildings that a r e economically competit ive and can contribute significantly t o building energy supplies nationally. Toward this end, the program sponsors research activit ies related t o increasing the efficiency, reducing the cost, and improving the long-term durability of passive and act ive solar systems for water and space heating, cooling, and daylighting applications. These activit ies a r e conducted in four major areas: Advanced Passive Solar Materials Research, Collector Technology Research, Cooling Systems Research, and Systems Analysis and Applications Research.
Advanced Passive Solar Materials Research - This activity a rea includes work on new aperture materials for controlling solar heat gains and for enhancing the use of daylight for building interior lighting purposes. I t also encompasses work on low-cost thermal storage materials that have high thermal s torage capacity and can be integrated with conventional building elements, and work on materials and methods t o transport thermal energy efficiently between any building exterior surface and the building interior by non- mechanical means.
Collector Technology Research - This activity area encompasses work on advanced, low- to-medium-temperature (up t o 1 8 0 ' ~ useful operating temperature) flat-plate collectors for water and space heating applications, and medium-to-high-temperature (up to 4 0 0 ~ ~ useful operating temperature) evacuated tube/concentrating collectors for space heating and cooling applications. The focus is on design innovations using new materials and fabrication techniques.
Cooling Systems Research - This activity a r e a involves research on high-performance dehumidifiers and chillers tha t can operate efficiently with the variable thermal outputs and delivery temperatures associated with solar collectors. I t also includes work on advanced passive cooling techniques.
Systems Analysis and Applications Research - This activity a r ea encompasses experi- mental testing, analysis, and evaluation of solar heating, cooling, and daylighting systems for residential and nonresidential buildings. This involves system integration studies, the development of design and analysis tools, and the establishment of &era11 cost, pe;for- mance, and durability targets for various technologies and system options.
A national goal of DOE'S cooling systems research is t o reduce the amount of nonrenewable energy required t o maintain comfort in buildings. Thus, t he Solar Energy Research Institute (SERI), for DOE'S Solar Buildings Research and Development Program, has been conducting fundamental heat and mass transfer research in desiccant dehumidifiers for solar cooling applications.
This report contains an account of research at SERI in cooling systems, particularly con- cerning the performance of advanced, parallel-passage, rotary dehumidifiers. Detailed descriptions of the experimental method and da t a analyses a re provided. Work in SERI1s Cyclic Test Facility has culminated in a be t te r understanding of the research issues related t o rotary dehumidifiers having practical geometries.
The authors would like t o express thei r appreciation t o L. Flowers for his leadership a s the technical program integrator, and t o T. Penney, K. Schultz, F. Zangrando, H. Pohl, J. Dolan, and K. Dukehart for carrying ou t various aspec t s of t h e task so t h a t this repor t could be completed.
-ID=& D. Bharathan, Senior Engineer
Approved for
Solar Energy,Research Institute
Solar ~ h e r f l a i ~ e s e G c h Branch
Cflroff, J5yktor Z a r Hea t Research Division
SUMMARY
Obiective
The objective of this work was t o experimentally charac te r ize t h e performance of rotary desiccant dehumidifiers and t o develop and validate analytical methods for evaluating their performance in air-conditioning systems.
Discussion
SERI has developed a facility and a test-and-analysis procedure t o evaluate the per- formance of rotary dehumidifiers. Experiments were a imed a t developing a basic under- standing of t h e simultaneous heat- and mass-transfer processes in rotary dehumidifiers. Two dehumidifier test ar t ic les were tes ted under cycl ic operation t o fully character ize their performance. Detailed accounts of SERI1s Cyclic Test Facility, i t s hardware and instrumentation, t he two t e s t art icles, da ta generated on the test art icles, and da t a reduction and analyses methods a r e provided in this report. The da t a provide a n engi- neering da ta base for evaluating rotary dehumidifiers for cooling applications.
Conclusions
For a simple low-pressure-drop geometry, such a s t he parallel plate, ensuring and main- taining a uniform a i r passage gap is cri t ical t o obtaining high performance. The tes ts reported here indicate tha t nonuniform passage spacing, in which 48% of t he passages possess gaps ranging from 0.08 t o 1.92 t imes the design gap, resulted in about a 50% reduction in t he overall number of transfer units for dehurnidif ication from the nominal design value of 10.
Low- and high-speed t e s t results corre la ted well with t he analogy theory, while medium- speed results deviated significantly from this theory. A nonlinear analogy method incor- porating a linear variation of t he matrix capacity was adopted t o analyze t he medium- speed results, with satisfactory agreement.
The effect ive gel mass in t h e matrix was found t o be 63% of t he to ta l gel mass. Inde- pendent s ta t i c t es t s confirmed this finding. The dehumidifier's performance a s measured by t he effectiveness agreed with theory t o within t10%. This work represents the f i rs t a t t emp t t o compare a detailed component model for a rotary desiccant dehumidifier with a complete se t of experimental da t a relevant t o solar cooling applications.
The Cyclic Test Facility at SERI can be used t o further improve t he theoret ical model for other desiccants and geometries. The model will help designers determine the trade- offs t ha t must be made among such design characterist ics as pressure loss, mass-transfer performance, cost , reliability, and aging.
san
TABLE OF CONTENTS
Page
1.0 Introduction ......................................................... 1
.......................................... 1.1 Solid Desiccant Cooling 1 1.2 Purpose o f t h e Research ......................................... 2 1.3 Theory of Rotary Dehumidifier Tests .............................. 3 ..................................... 1.4 Dehumidifier Test Techniques 9 ......................................... 1.5 Results of Previous Tes t s 10
............................................. 2.0 The Experimental Facility 11
...................................................... 2.1 Overview 11 ......................................... 2.2 The Cyclic Test Facil i ty 11 ........................................... 2.2.1 Process Control 11 ........................................... 2.2.2 Instrumentation 14
.................................................... 3.0 The Test Articles 19
............................................ 3.1 Rotary Dehumidifiers 19 ............................................... 3.2 Housing and Seals 20 ........................................ 3.3 Rotor Drive Arrangement 23
4.0 The Experimental Procedure ........................................... 27
................................ 5.0 Experimental Results and D a t a Analyses 28
5.1 Pressure-LossTests ............................................. 28 ............................................ 5.1.1 Da ta Analyses 28 ................................. 5.1.2 Pressure-Loss Tes t Results 31 .................................... 5.2 Heat- and Mass-Transfer Tes t s 33 .......................................... 5.2.1 High-speed Tests 33 .......................................... 5.2.2 Low-Speed Tests 38 ....................................... 5.2.3 Medium-Speed Tes t s 43
.............................. 6.0 Concluding Remarks and Recommendations 47
7.0 References .......................................................... 50
..................................... Appendix A Measurement Uncertainties 53
............................................ Appendix B Experimental Da ta 55
.................................. Appendix C Fabrication of t h e Tes t Art ic le 61
.......................................... Appendix D Desiccant Properties 66
Appendix E Seal Leakage Character izat ion .................................. 73
TABLE OF CONTENTS (Concluded)
Page
Appendix F Effect of Nonuniform Air Passages .............................. 76
Appendix G Raw Data Processing Procedure ................................. 78
Appendix H Detailed Operating Procedure .............. .... ................ 81
Appendix I Determination of Dehumidifier Sta t ic Capacity ................... 83
Selected Distribution List .................................................. 84
vii
LIST OF FIGURES
Page
Progress in Desiccant Open-Cycle Thermal Coefficient of Performance at ARI Conditions ........................................ 2
Combined Heat- and Mass-Transfer Processes in a Dehumidifier ............ 3
Lines of Constant Combined Potentials F i for a Simplified Silica Gel-Water-Air System ................................................ 6
Specific Capaci ty Rat ios y i for a Simplified Silica ................................................ Gel-Water-Air System 6
Comparison of Infinite and Finite Transfer Coefficient Solutions for Counterf low Regenerator. Plot ted as Transfer Effectiveness q vs.Rotat ionalSpeed C 1 ............................................. 7
Schematic Layout of t h e Cyclic Test Facil i ty ............................ 12
Locations of Instrumentation near and around t h e Test Art ic le ............. 14
Rotary Desiccant Dehumidifier Test Art ic le 2: Frontal View Showing Face F langeandHous ing .............................................. 19
Rotary Desiccant Dehumidifier Test Art ic le 1 ............................ 21
Close-up View of Air Passage in Test Art ic le 2 ........................... 22
Details of Circumferential and Radial Seals .............................. 25
Test Art ic le 1 Installed in t h e Cyclic Test Facil i ty ........................ 26
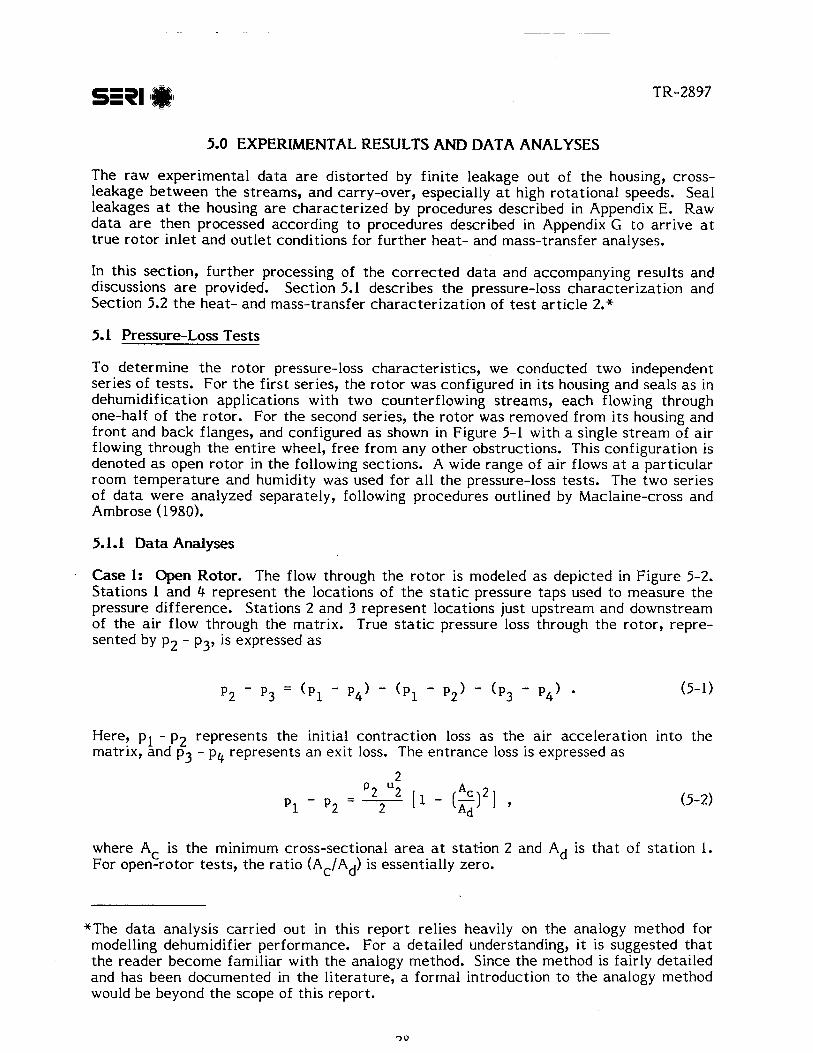
............................ Open-Wheel Pressure-Loss Test Configuration 29
Assumed One-Dimensional Flow through t h e Dehumidifier Matrix ........................... for Calculating Inlet and Out le t Pressure Drop 29
................... Masked Shadow Area Behind Front and Back Seal Pla tes 31
Dimensionless Pressure-Loss Variation with Reynolds Number for ........................... Test Art ic le 2 and t h e Least-Squares Curve F i t 32
Measured Variation of Nusselt Number with Grae tz Number ................ 36
Measured Variation of Solid-Side Conductance Geometry Fac to r with Mean Matrix Temperature at Absolute Humidi'ties Ranging f rom ......................................................... 8 t o 16 g/kg 37
Measured Variation of Solid-Side Conductance Geometry Fac to r with Mean Air Humidity a t Temperatures Ranging from 40° t o 50°C ............. 37
LIST OF FIGURES (Concluded)
Page
5-8 Measured F2 Transfer Effectiveness n2 vs . Theoretical Effectiveness qzth wi th Effective ~ a s s Y F a c t i o n xeff = 1.0 ................. 40
5-9 Measured F1 Transfer Effectiveness ri vs . Theoretical Effectiveness v l t h with Effective ~ a s s ~ ~ a c t i o n xeff = 1.0 ................. 41
5- 10 Measured F2 Transfer Effectiveness q 2 vs . Theoretical Effectiveness Ozth with Effective ~ a s s y p a c t i o n xeff = 0.70 ................ 42
5-1 1 Measured F l Transfer Effectiveness q vs . Theoretical Effectiveness q th with Effect ive ~ a s s T F a c t i o n xeff = 0.70 ................ 42
5-1 2 Measured F2 Transfer Effectiveness qzex vs . Theoretical Effectiveness qzth Using Linear variatlorPof uz with .......................................................... xeff = 0.625 44
5- 13 Measured F Transfer Effectiveness n lex vs . Theoretical Effectiveness th Using Linear variattoryof with .......................................................... ~ ~ ~ f z 0 . 6 2 5 44
5-14 Measured Variations of n and q 2 with C2 over a Medium-Speed Range and a Theoretical b ariation of r , ~ and q2 with C2 .................... 45
C-1 Photograph of t h e Rotor Winding Apparatus ............................... 62
C-2 Photograph Illustrating t he Rotor Tape Winding Mechanism ................. 63
C-3 Photograph of Spacers and Epoxy Resins .................................. 64
C-4a Adhesive Being Applied t o t h e Spacer Tips ................................ 6 5
C-4b Spacer Being Inserted in the Radial Spokes ................................ 6 3
D. l. A Plot of the Silica Gel Isotherm Data Shown in Table D-2 .................. 67
................ E-1 Diagram Illustrating Leakage Paths around the Dehumidifier 73
E-2 Circumferential Leakage Flow and Regeneration Pressure vs . . Process Pressure and the Fi t ted Variation of Leakage Using Eq E-1 .......... 74
F-l Assumed Probability Distribution of the Air Passage Gap ................... 77
LIST OF TABLES
Page
.................. 2-1 Summary of Instrumentation for t h e Cycl ic Test Facil i ty 15
3-1 Dimensions and Masses of Dehumidifier Tes t Article 1 .................... 23
.................... 3-2 Dimensions and Masses of Dehumidifier Test Article 2 24
...................... A-1 Summary of Uncertainties in Primary Measurements 53
.......................... A-2 Summary of Uncertainties in Derived Quanti t ies 54
8-1 Experimental Da ta ................................................... 56
.................................... D-1 Physical Properties of Dry Silica Gel 66
.................... D-2 Isotherm Data for Grade 40 Silica Gel Taken at 21.1°C 67
1-1 Summary of Measurements for Determination of Wheel S t a t i c Capaci ty .......................................................... 83
COP
Cp tape
NOMENCLATURE
minimum matrix flow area (m2)
2 unobstructed upstream flow area (m )
2 reference midsection matrix flow area (m )
2 nozzle exit flow area (rn )
unobstructed downstream flow area (m2)
dimensionless inverse propagation velocity
nominal coated tape thickness (m)
air passage gap (m)
mean air passage gap (m)
discharge coefficient
dimensionless rotational speed for the ith wave in the process period
dimensionless rotational speed for the i th wave in t he jth period
maximum air s t ream heat capacity r a t e (W/K)
minimum air stream heat capacity r a t e (W/K)
matrix heat capacity rotational ra te ( W / K )
thermal coefficient of performance
specific heat capacity of air (J/kg K)
specific heat of desiccant (J/kg K)
specific heat of substrate tape (J/kg K)
radial leakage product of discharge coefficient times a rea (rn2)
circumferential leakage product of discharge coefficient t imes area (m2)
mean air velocity (m/s)
nondimensional rotational speed for F I transfer for process and regeneration streams
nondimensional rotational speed for F2 transfer for process and regeneration streams
heat capacity of matrix per unit active desiccant mass (J/kg K)
NOMENCLATURE (Continued)
normalized variation in capacity ratios between process and regeneration s t reams
effect ive hydraulic diameter (m)
surface moisture diffusivity in desiccant (m2/s)
moisture diffusivity in desiccant (m2/s)
moisture diffusivity in a i r (m2/s)
desiccant particle diameter (m)
thermocouple electromotive force
number of transfer units for sensible heat transfer
unbalance in a i r mass flow rat io between process and regeneration s t reams
nondimensional rotational speed for sensible heat transfer
unbalance ra t io in heat transfer coefficient t imes transfer a r ea product
solid-side conductance geometry factor
combined i th potential for t he jth period
combined first potential
combined second potential
Fanning friction factor
fugacity of wate r vapor in a i r
fugacity of water vapor in a i r at saturation
Crae t z number
2 gravitational acceleration (m 1s)
specific enthalpy of a i r (Jlkg) or heat of adsorption (J/kg)
unbalance ra t io in heat-transfer coefficient t imes transfer a r ea product
specific enthalpy of process inlet a i r stream (J/kg)
specific enthalpy of process outlet a i r s t ream (J/kg)
specific enthalpy of regeneration inlet a i r s t ream (J/kg)
NTUo
NTUt
NTU,
Nu
NOMENCLATURE (Continued)
specific enthalpy of regeneration outlet air stream (J/kg)
change in regeneration stream specific enthalpy (J/kg)
change in process s t ream specific enthalpy (J/kg)
slope of nondimensional pressure-drop variation with Reynolds number
mean thermal conductivity of a i r (W/m K)
rotational correct ion coefficient
matrix depth (m)
Lewis number
circumferential leakage rates at stations 1 and 2 (kg/s)
circumferential leakage rates at stations 3 and 4 (kg/$
radial cross leakage ra tes (kg/$
molecular weight of air (kglmole)
molecular weight of water (kg/mole)
dry air mass flow r a t e of process and regeneration streams, respectively, corrected for leaks (kg/s)
dry air mass flow r a t e of process and regeneration s t reams at stations 1 and 2, respectively (kg/$
total mass of dry desiccant (kg)
wheel speed (revlh)
overall number of transfer units
overall number of transfer units based on temperature
overall number of transfer units based on moisture transfer
Nusselt number
Nusselt number for uniform parallel passages
saturation pressure (Pa)
ambient pressure (Pa)
fraction of passages outside of design gap or packing factor
NOMENCLATURE (Continued)
to ta l pressure (Pa)
inlet s t a t i c pressures at s ta t ions I and 2 (Pa)
out le t s t a t i c pressures at s ta t ions 3 and 4 (Pa)
process s t ream pressure drop across matrix (Pa)
regeneration s t ream pressure drop across matr ix (Pa)
probability density distribution of nonuniform passages
dynamic pressure (Pa)
universal gas constant (J /mole K)
Reynolds number at metering nozzle exi t
ra t io of maximum passage width t o nominal passage width
Reynolds number
Reynolds number evaluated at mean properties
relat ive humidity or wheel radius (m)
derivative of logarithm of saturation pressure with t empera tu re
Schmidt number
silica gel fraction
Sherwood number
absolute t empera tu re (K)
dew-point t empera tu re (OC)
upstream stagnation t empera tu re (K)
temperature (OC)
process inlet and out le t temperatures t o t h e matr ix (OC)
regeneration inlet and ou t le t temperatures t o t h e matr ix (OC)
mean matr ix temperature (OC)
process intersection-point temperature (OC)
regeneration intersection-point temperature (OC)
NOMENCLATURE (Continued)
P t 2 inlet temperatures at stations 1 and 2 (OC)
t39t4 outlet temperatures at stations 3 and 4 (OC)
u air velocity (m/s)
"m mean air velocity (m/s)
"2 air velocity at matrix entry (mls)
" 3 air velocity at matrix exit (m/s)
v P
desiccant void volume (cc/g)
W matrix moisture content (kglkg)
w absolute humidity of a i r (kglkg of dry air)
wm mean air absolute humidity (kglkg of dry air)
Wpi'Wpo process inlet and outlet absolute humidities (kg/kg of dry air)
Wri?wro regeneration inlet and outlet absolute humidities (kg/kg of dry air)
Wpint process intersection-point absolute humidity (kg/kg of dry air)
Wrint regenerat ion intersection-point absolute humidity (kg/kg of dry air)
Wl'W2 absolute humidities a t inlet stations 1 and 2 (kg/kg of dry air)
W3'W4 absolute humidities a t outlet stations 3 and 4 (kglkg of dry air)
W P
change in absolute humidity of process s t ream through the matrix (kg/kg of dry air)
wr change in absolute humidity of regeneration s t ream through the matrix (kg/kg of dry air)
x downstream distance (m)
'ef f fraction of act ive desiccant mass t o total
Greek Symbols
a - 1
slope (-atlaw) along the combined potential Fi
ah slope of lines of constant enthalpy in t vs. w plot
aw slope of lines of constant matrix moisture contant in t vs. w plot
NOMENCLATURE (Concluded)
meter ing nozzle contract ion ra t io o r sorbability of matr ix
specific capaci ty ra t io of F i potential
specific capaci ty ra t ios for t h e process s t ream for t h e 1 and 2 potentials
specific capaci ty rat ios for t h e regeneration s t ream f o r t h e 1 and 2 potentials
changes
effect iveness for t h e F1 and F 2 t ransfer
t empera tu re effectiveness
"w moisture t ransfer effectiveness
8 t i m e (s)
A p p 'r process and regeneration NTUs for t h e combined potentials
1 ra t io of t h e hea t of sorption t o t h e enthalpy of moisture in fluid mixture
FI r a t io of desiccant mass t o a i r mass in t h e matr ix
Vm mean a i r dynamic viscosity (kg/m s)
v sorption parameter
Od' OS desiccant density (kg/m3)
f' m mean a i r density (kg/m3)
u ra t io of specific hea t of matr ix t o t h a t of fluid mixture
T tortuosity of desiccant pores or residence t ime per period (s)
n 1-PIP t
Subscripts
P process
r regeneration
1 .O INTRODUCTION
I. i Solid Desiccant Cooling
A major national goal is t o reduce t h e amount of nonrenewable energy required t o main- ta in comfor table t empera tu res and humidity in buildings. In summer, infiltration, venti- lation, solar gains, building envelope conduction, and internal h e a t and moisture genera- t ion by occupants and equipment (including ar t i f ic ia l lighting) ra ise t h e t empera tu re and humidity of t h e conditioned space. Be t t e r equipment, building design, insulation, sealing, and venti lat ion systems c a n reduce but not e l iminate these loads. The h e a t and moisture genera ted by occupants depend on t h e building's function and cannot be significantly a l t e red (Mitchell 1983). An economically competi t ive, rel iable cooling sys tem using renewable energy t h a t reduces energy consumption is an a t t r a c t i v e a l t e rna t ive to a con- ventional e l e c t r i c vapor-compression sys tem for t h e consumer, utility, builder or devel- oper, and equipment manufacturer.
Af te r 60 years of research and development, t h e limits of conventional vapor compres- sion sys tems a r e well understood. New cooling sys tems using renewable energy directly a r e being developed a s t h e economics become favorable. Two renewable energy sources for cooling a r e d i rec t solar energy and t h e energy of t h e unsatura ted atmosphere. These energy sources impose const ra in ts on t h e choice of systems. Closed cooling sys tems (in which t h e ref r igerant does not con tac t t h e atmosphere) cannot use t h e energy of t h e unsaturated atmosphere. Open sys tems evaporating wa te r in to t h e a tmosphere a s a refr igerant use th is energy source a s well a s less d i rec t solar energy; e.g., t h e simple evaporative cooler requires nonrenewable energy only t o move t h e a i r and water. Closed sys tems may b e combined with open sys tems t o form a hybrid and t a k e maximum advan- t a g e of renewable resources.
Open sys tems perform less well in humid a r e a s unless dehumidification is used. A solar collector will deliver more h e a t at Low temperatures because hea t losses a r e lower (Lunde 1980; Duff ie and Beckman 1980). Thus, open cycles employing dehumidification a r e promising options for renewable energy cooling systems.
A nationally marketed sys tem should be compac t and have low capi ta l and operating cos t s and few maintenance requirements, a s well as high performance and reliability. High performance may be achieved if t h e sys tem approaches t h e l imits s e t by t h e second law of thermodynamics (Lavan et al. 1982; Van Den Bulck et al. 1983; Kang 1985; Maclaine-cross 1985). One of t h e Depar tment of Energy (DOE) goals for a renewable energy cooling system for t h e year 2000 is a projected initial sys tem cost of $1500/ton of cooling capacity. Theoretical analyses indicate t h a t th i s goal is achievable using advanced cycles tha t more closely approach these second-law l imits (Maclaine-cross and Parsons 1986), provided t h a t t h e hea t t ransfer occurs across small t empera tu re differ- ences and mass transfer across small concentrat ion differences. Rotary adiabat ic regen- e ra t ive dehumidifier designs o f fe r a pract ica l a l ternat ive in achieving t h e long-term DOE goal.
The design of regenerative dehumidifiers is, however, complicated by t h e mass t ransfer resistance and somewhat difficult manufacturing -properties of available desiccants. Combining new materials , geometries, and innovative manufacturing techniques can reduce size, cos t , and maintenance requirements and increase t h e performance and reli- ability of regenerat ive dehumidifiers.
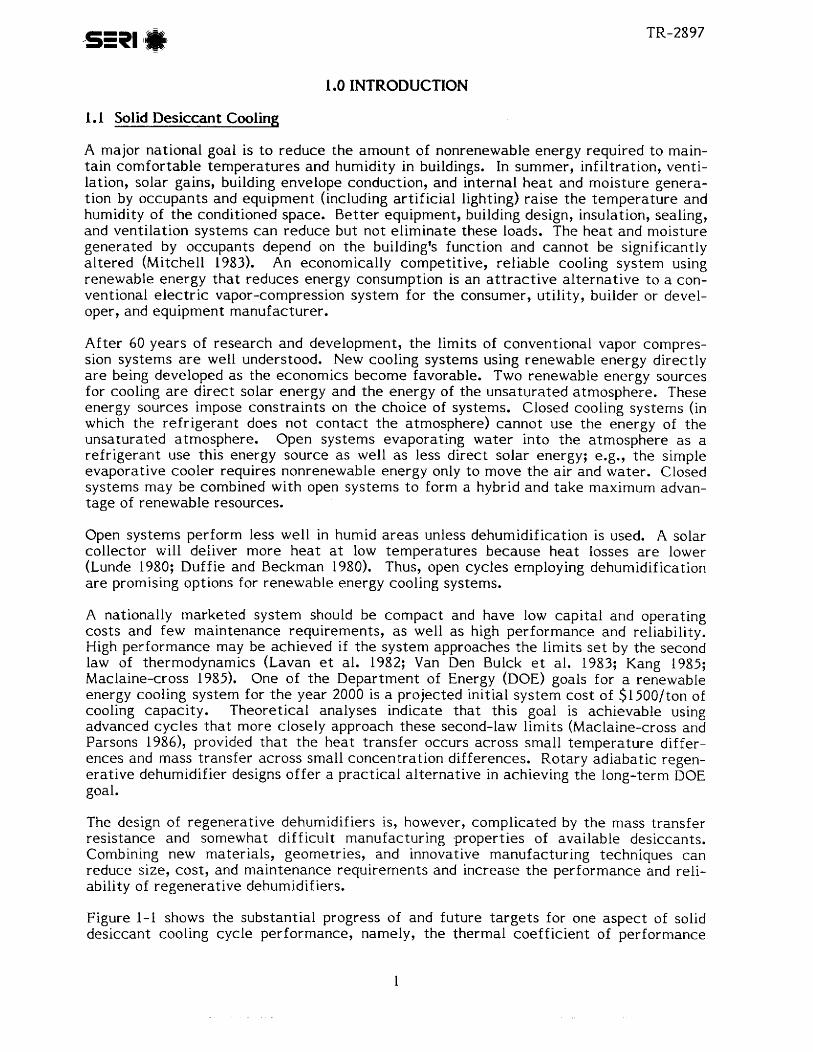
Figure 1-1 shows t h e substantial progress of and future t a r g e t s for one aspect of solid desiccant cooling cycle performance, namely, t h e thermal coeff ic ient of performance
sin + (COP) (Penney and Maclaine-cross 1985). The state of t h e a r t is a thermal COP of 1.0 a t ARI standard test conditions. A major par t of t h e last 20 years of progress has been due t o improvements in dehumidifiers. Achievement of the year 2000 goal of a thermal COP of 2.0 or more depends on dehumidifier improvements as well as progress in other areas.
The Solar Energy Research Institute (SERI), fo r DOE'S Solar Buildings Research and Development Program, has been making fundamental heat- and mass-transfer measure- ments on solid desiccant materials, matrices, and model dehumidifiers. In four separate test facilities a t SERI, a variety of research issues related t o desiccants for solar cooling applications a r e addressed (Penney and Maclaine-cross 1985).
1.2 P u r ~ o s e of t h e Research
The purpose of t he research activit ies under t h e present task is t o character ize experi- mentally t h e performance of advanced dehumidifiers operating at conditions relevant t o solar cooling applications. The scope of the work encompasses test-art icle selection in regard t o desiccant material, substrate, and matrix; limited practical aspects of engi- neering design and fabrication; testing; da t a collection; da t a analyses; analytical model validation; and research issues recommended t o further improve the dehumidifiers' per- formance and t h e predictive methodology. The FY 1985 work consisted of characterizing two dehumidifier geometries. Data analyses have been confined t o adapting analogy theories, assuming a linear matrix capacity variation with a i r s t a t e properties.
t 0 o Dehumidifier
0
System
~chievements-+-~argets
Year
Figure 1-1. Progress in Desiccant Open-Cycle Thermal Coefficient of Performance at ARI Conditions
This repor t describes recent improvements t o the Cyclic Test Facility at SERI, t h e two dehumidifier test art icles, measurements of these units using t h e Cyclic Test Facility, and t he calculation of t he combined hea t and mass transfer characterist ics of t he dehu- midifiers f rom t h e measurements. The facil i ty is described in Section 2.0, t he t es t ar t i - c les in Section 3.0, t he experimental procedures in Section 4.0, and t h e results in Section 5.0. Appendices A through H complement these descriptions with respect t o deta i ls concerning measurement uncertainties, t he experimental data , dehumidifier fabrication, desiccant properties, seal leakage, e f f ec t s of nonuniform passages, t he da t a processing procedure, and the experimental procedure, respectively. Appendix I presents t h e method used t o determine t he dehumidifier's wheel s ta t i c capacity.
1.3 Theory of Rotary Dehumidifier Tests
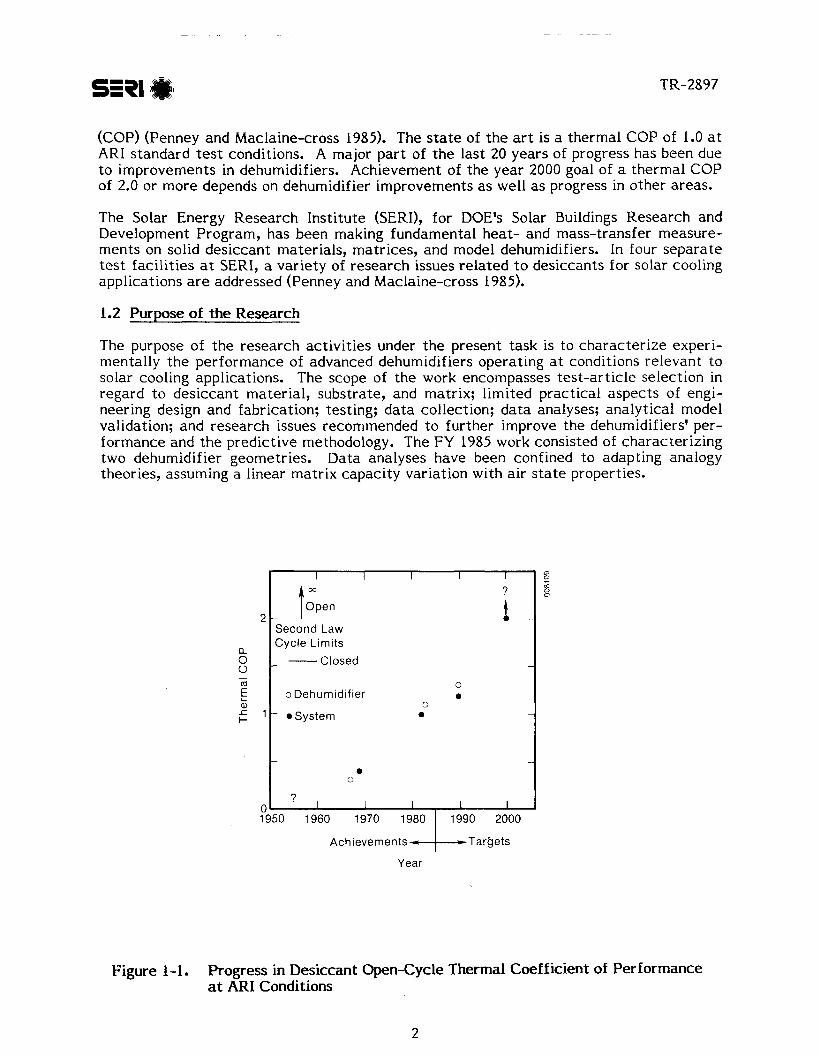
In rotary dehumidifiers t he process a i rs t ream transfers moisture t o and absorbs sensible hea t from a rota t ing desiccant matrix, which subsequently transfers t h e moisture t o and absorbs sensible hea t from a counterflow regeneration airstream. The matrix may be homogeneous or a composite of a carr ier with the mechanical properties necessary to support t h e desiccant, an adhesive film t o bind t he desiccant t o t he carrier, and t he des- iccant film or powder itself. Combined hea t and mass transfer occurs in t h e air , t h e des- iccant, and contaminants, if present. Hea t transfer occurs in t h e carr ier and t h e adhesive. Figure 1-2 shows these components, transfers, and important parameters schematically.
Component Cool and moist Warm and dry Parameters
Carrier
Adhesive
Desiccant
Contamination
Air
4-• Regeneration
--D Dehumidification
- m
Heat capacity a
Heat capacity Sorption Diffusion resistance
Diffusion resistance
I Pressure loss Heat and mass transfer rate
Figure 1-2. Combined Heat- and Mass-Transfer Processes in a Dehumidifier
sin The combined heat-and mass-transfer processes in t h e a i r a r e well understood and a r e similar t o those for t h e wet bulb psychrometer. Wylie (1969, 1981) found for t h e we t bulb psychrometer t h a t of t h e 10 known combined heat- and mass-transfer ef fects , six a lmost cancelled one another within a fraction of a percentage point. The important four remaining a r e diffusion, conduction, convection, and t h e accommodation coeff ic ient at t h e surface. These e f f e c t s have been measured within a few percentage points (Hilsenrath et al. 1958; Mason and Monchick 1965). Combined h e a t and mass t ransfer in a i r can be represented by hea t t ransfer and mass t ransfer coeff ic ients f ree of coupled e f fec t s , and f o r simple geometr ies they can be predicted accurately.
In t h e desiccant dehumidifier, combined heat and mass t ransfer c a n be more difficult t o predict , especially if t h e dimensions of t h e desiccant in t h e t ransfer direction a r e compa- rable with those of t h e a i r passage. For high performance and low cost , the desiccant dimensions a r e usually made as small a s pract ica l compared with t h e a i r passage dimensions. This makes t h e desiccant a lmost isothermal, and only t h e mass t ransfer resistance need be considered. The diffusivity of liquid or crystall ine desiccants is reproducible, but for amorphous polymers, such as silica gel, i t c a n be highly dependent on manufacturing conditions. Contaminants commonly found in buildings can be adsorbed by t h e desiccant. Their likely chemical composition and e f f e c t on desiccant cooling sys- t e m s is not known at present. For t h e t e s t s described in this report , however, precau- tions have been taken in both construction and installation t o avoid undue contamination.
For high-performance dehumidifier designs, t h e t empera tu re and concentration differ- ences between t h e desiccant and matr ix a r e usually small. There is no reason t o believe t h a t transfer r a t e s between t h e desiccant and a i r cannot be modeled adequately by sensi- ble hea t and mass t ransfer coefficients. Their values depend on t h e geometry and t h e physical properties of a i r and matrix. The geometry may be difficult t o describe and analyze mathematically, and matr ix properties in sufficient deta i l may be unknown. Measurement of t h e transfer coeff ic ients is a n important objective of dehumidifier tests . The dimensionless ra t io of mass-transfer t o heat-transfer resistance or a n effec- t ive Lewis number is a useful index of matrix performance, because reducing t h e mass- t ransfer resistance improves t h e dehumidifier's performance.
The equilibrium properties of humid a i r and t h e matr ix a r e also important in defining t h e dehumidifier's performance. The matr ix vapor pressure isotherm, hea t of adsorption, and specific hea t a l l a f f e c t t h e dehumidifier's performance (Jurinak and Mitchell 1984). For amorphous desiccants, these properties, and especially t h e isotherm, a r e highly depen- den t on manufacturing conditions. The adhesive o r contaminants may penetra te or iso- l a t e the desiccant, desiccant may be lost f rom t h e dehumidifier during operation, or matr ix manufacturing nonuniformities may part ial ly isolate t h e desiccant, al l reducing t h e effect ive slope of t h e isotherm. These pract ica l considerations make i t essential t o measure t h e "effective" equilibrium properties of t h e dehumidifier matr ix rather than t o make extrapolations based on idealized models of segments of the matrix.
Capi ta l cos t and parasit ic power must both be low for a n advanced dehumidifier. This requires t h a t t h e matr ix possess a low pressure drop at high mass flow r a t e s and suffer no loss in e i ther t ransfer r a t e s or equilibrium capacities. A favorable passage geometry and high matrix porosity a r e imperative. The parallel-plate geometry, which can provide both low pressure drop and high porosity, is relat ively easy t o const ruct and analyze (Dunkle et al. 1980). Pressure drop and mass flow r a t e a r e important measures of t h e dehumidifier's performance.
The six dehumidifier measurements we have discussed may be corre la ted conveniently using t h e Nusselt number, the ra t io of measured t o predicted desiccant mass-transfer resistance, t he ra t io of e f fec t ive to ac tua l desiccant dry mass, the apparent specific heat of t he carr ier , the product of t he Fanning friction factor t imes the Reynolds number, and t he Reynolds number t imes t he ra t io of minimum f r ee flow t o wet ted surface area. For turbulent flow or unquantif iable geometries, slight modifications t o this choice of parameters a r e necessary, but such tests have not ye t been made. Adiabatic s tep tran- sient t e s t s a r e capable of measuring a l l these quantities (Pesaran et al. 1986). The con- struction of a single rotary dehumidifier t e s t ar t ic le is difficult, and cyclic test facilities a r e complicated and expensive t o design and assemble. The expense, however, is justi- fied because t h e theory of combined hea t and mass t ransfer in dehumidifiers allows the first four measurements t o be calculated from cyclic regenerator t e s t s with greater accuracy than they could be from more economical t e s t methods. The cyclic t es t s also provide a n important basis for predicting dehumidifier performance under other than the t e s t conditions. The predictive methodology is briefly discussed here.
Simultaneous partial differential equations can be wri t ten for transfer ra tes , conserva- tion, and equilibrium t o describe combined heat and mass transfer in dehumidifiers. The transfer coefficients and matrix mass may be corrected for a variety of effects , such as conduction in the flow direction, so additional t e rms do not have t o be added t o the equa- tions and t he boundary conditions do not have t o be modified (Maclaine-cross 1973, 1980). The same se t of partial differential equations (Maclaine-cross 1973) can be used t o describe all dehumidifiers of interest. However, coupling in t h e r a t e equations and coupling and nonlinearity in t he equilibrium relations complicate t he solution of the equations. Many empirical, approximate, and semianalytical methods have been used in predicting dehumidifier performance, but for calculating test results the re a r e two useful methods: analogy t o hea t transfer alone and t he finite-difference solution.
DIAlembert's classical mathematical method for solving simultaneous differential equa- tions consists of finding multipliers for t h e equations t ha t convert them t o a number of independent se t s of equations in canonical variables. These appear in only one equation, which then can be solved independently of t he others. This approach was first applied t o a combined heat and mass transfer system by Henry (1939). Banks (1972) improved t he usefulness of this method by introducing t h e concept of combined potentials F i and com- bined specific capacity ratios yi.
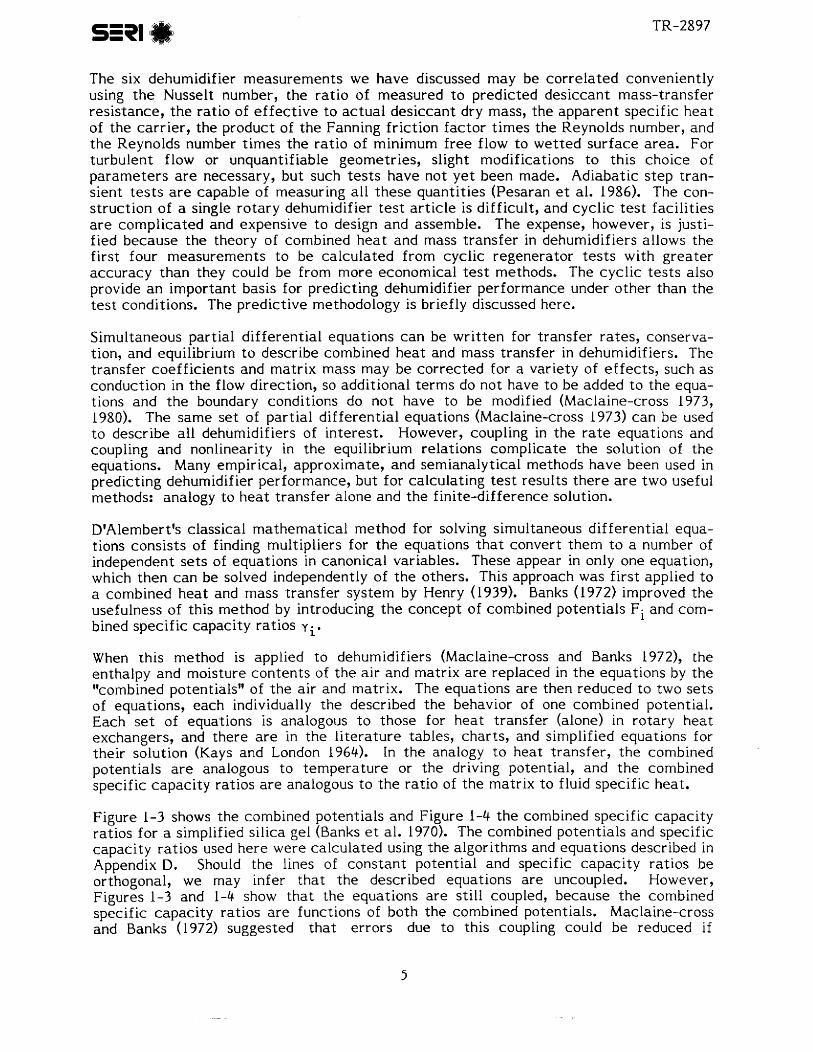
When this method is applied t o dehumidifiers (Maclaine-cross and Banks 1972), the enthalpy and moisture contents of the a i r and matrix a r e replaced in the equations by the "combined potentials" of t he a i r and matrix. The equations a r e then reduced t o two se t s of equations, each individually t he described the behavior of one combined potential. Each s e t of equations is analogous t o those for heat transfer (alone) in rotary heat exchangers, and there a r e in t h e l i tera ture tables, char ts , and simplified equations for their solution (Kays and London 1964). In t he analogy t o heat transfer, t he combined potentials a r e analogous t o temperature or the driving potential, and t h e combined specific capacity ratios a r e analogous t o t h e ra t io of the matrix t o fluid specific heat.
Figure 1-3 shows the combined potentials and Figure 1-4 t h e combined specific capacity ratios for a simplified silica gel (Banks et al. 1970). The combined potentials and specific capacity ra t ios used here were calculated using the algorithms and equations described in Appendix D. Should t he lines of constant potential and specific capaci ty ratios be orthogonal, we may infer tha t the described equations a r e uncoupled. However, Figures 1-3 and 1-4 show tha t the equations a r e still coupled, because t he combined specific capaci ty ratios a r e functions of both the combined potentials. Maclaine-cross and Banks (1972) suggested tha t errors due t o this coupling could be reduced if
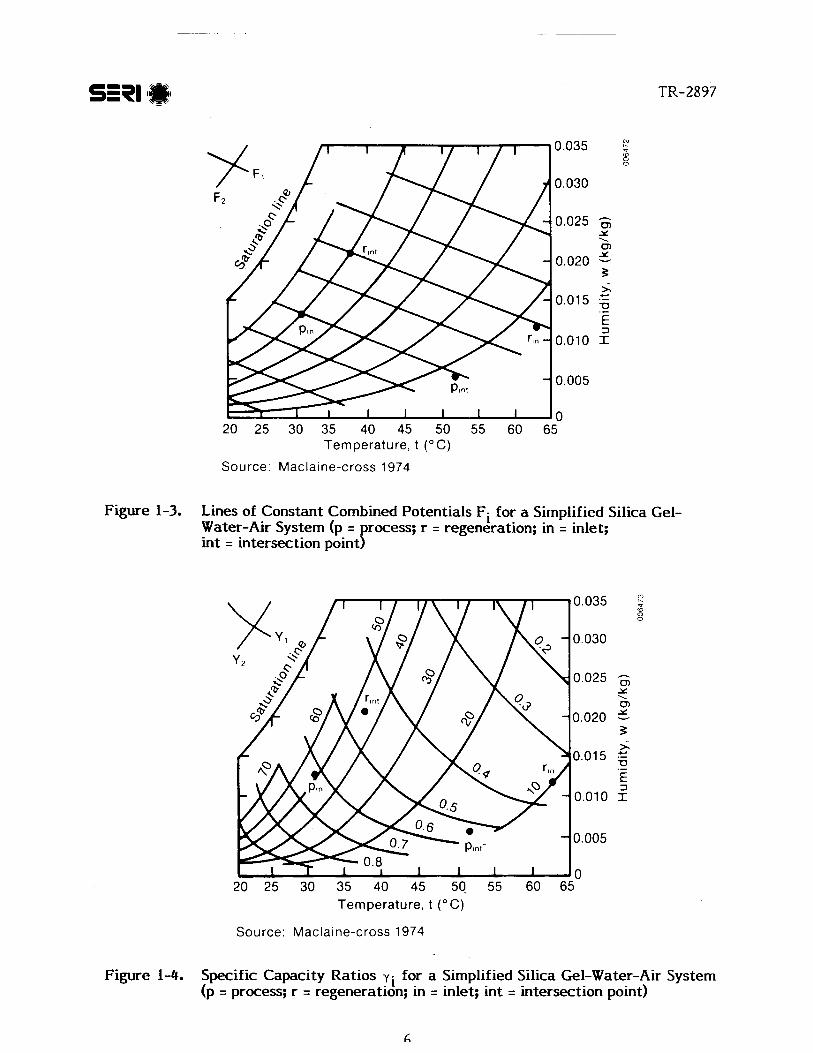
appropriate average values of t he combined specific capacity ratios were used in the dimensionless parameters of t he analogous heat-transfer-alone solutions. The accuracy of this suggestion and other details of t he analogy method have been examined in subsequent studies and refinements (Maclaine-cross 1973, 1974; Jurinak and Banks 1982; Banks 1985).
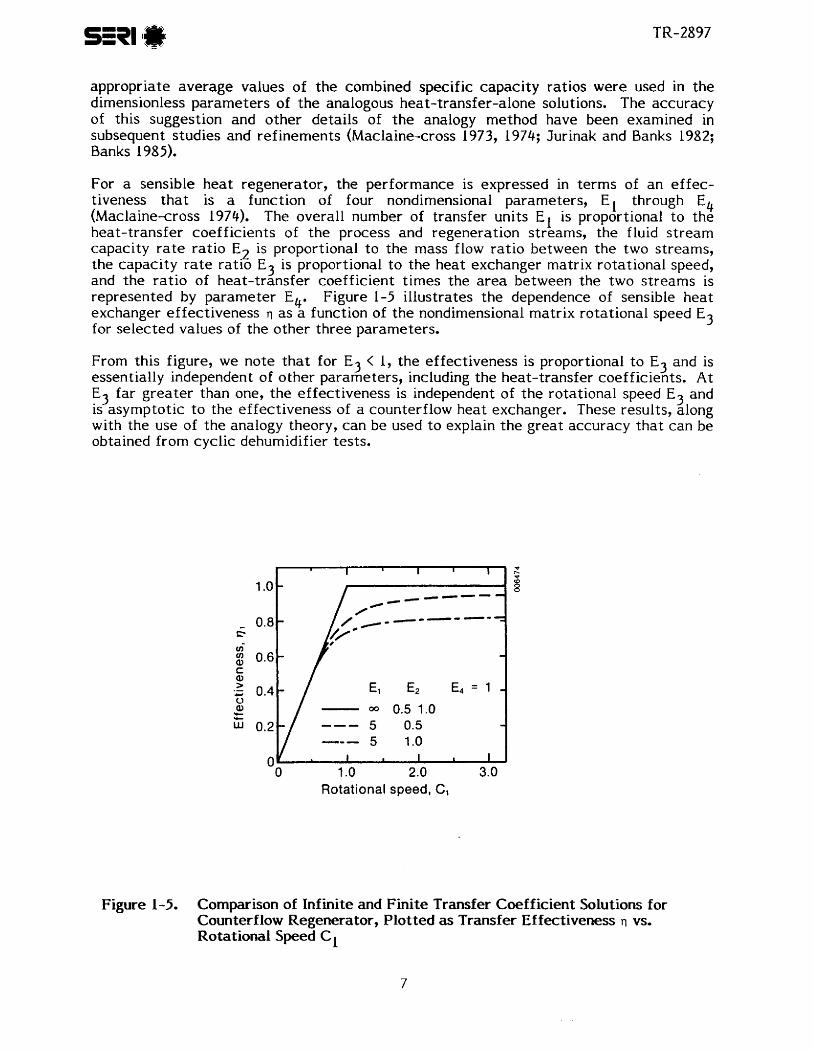
For a sensible heat regenerator, the performance is expressed in terms of an effec- tiveness tha t is a function of four nondimensional parameters, E l through E4 (Maclaine-cross 1974). The overall number of transfer units E l is proportional t o the heat-transfer coefficients of t he process and regeneration streams, the fluid stream capacity r a t e ratio E2 is proportional t o the mass flow rat io between the two streams, the capacity r a t e ratio E3 is proportional t o t he heat exchanger matrix rotational speed, and the rat io of heat-transfer coefficient t imes the area between the two s t reams is represented by parameter Ebb Figure 1-5 illustrates t he dependence of sensible heat exchanger effectiveness as a function of t he nondimensional matrix rotational speed E3 for selected values of t he other three parameters.
From this figure, we note t ha t for E j < 1, t he effectiveness is proportional t o E3 and is essentially independent of other parameters, including the heat-transfer coefficients. At E3 far greater than one, the effectiveness is independent of t he rotational speed E3 and is asymptotic t o the effectiveness of a counterflow heat exchanger. These results, along with the use of the analogy theory, can be used t o explain t he great accuracy tha t can be obtained from cyclic dehumidifier tests.
Figure 1-5. Comparison of Infinite and Finite Transfer Coefficient Solutions for Counterflow Regenerator, Plotted as Transfer Effectiveness 0 vs, Rotational Speed C1
I I I I I 1
----- - - - - - =
- El E2 Eq = 1 -
- 00 0.5 1 .O --- 5 0.5 - -- - 5 1.0 1 I
P P- * a 0 0
0 1 .O 2.0 3.0 Rotational speed, C,
To look at t h e dehumidifier analogous t o t h e sensible hea t exchanger, t h e dehumidifier is viewed as t w o independent rotors, e a c h one act ing t o t ransfer one of t h e combined potentials F i (i = 1,2). The process and regeneration s t reams a r e denoted by periods j, with j = 1 o r 2. The nondimensional matr ix rotational speed for a potential i and a period j is denoted by C . -
11'
When C - . >> 1 (for al l its and j's), t h e dehumidifier is operating at a high rotational speed. h e analogy theory and Figure 1-5 predict t h a t rotational speed e f f e c t s a r e small and t h e t empera tu re and moisture effectiveness depend mainly on t h e heat- and mass- t ransfer coefficients. The dehumidifier out le t s t a t e is relat ively uniform, allowing for accuracy in measuring t h e bulk mean a i r ou t l e t s t a t e s and hence efficiencies. Correc- tions for t h e small rotational speed e f f e c t s can be made using t h e analogy method, which is very a c c u r a t e at high rotational speeds (Maclaine-cross 1974). High rotational speed cyclic t e s t s provide t h e most a c c u r a t e method known t o us of measuring dehumidifier t ransfer coefficients.
A dehumidifier with C i - << I for both combined potentials i and periods j is operating at a low rotational speed. t h e analogy theory and Figure 1-5 predict t h a t t h e efficiencies a r e a lmost proportional t o rotational speed and almost independent of t h e t ransfer coefficients. The temperature and moisture gradients a r e strong, reducing t h e accuracy of efficiency measurements slightly. Combined potential two efficiency is a lmost pro- portional t o t h e act ive mass of desiccant on t h e matrix, which is a n important dehumidi- f ier performance parameter. Combined potential one efficiency is a lmost proportional t o combined specific capaci ty ra t io one, which is strongly dependent on t h e e f fec t ive h e a t capaci ty of t h e matrix. Low-rotational-speed cyclic t e s t s allow us t o infer t h e two most important equilibrium dehumidifier properties accurately.
When C. . lies in t h e neighborhood of unity, t h e dehumidifier is operating at a medium rotationdl speed. The best rotational speed for dehumidifier operation is at t h e low end of this speed range (Jurinak 1982; Van Den Bulck et al. 1985). The dehumidifier proper- t i e s measured at high and low rotational speeds can be used t o predict performance accurate ly in t h e medium-speed range. The errors in the analogy method a r e g rea tes t in this speed range, making a c c u r a t e finite-difference solutions (Maclaine-cross 1973) essential for highly accura te comparisons. If t h e analogy theory is used t o reduce results with C - . > 0.5, t h e analogous heat-transfer-alone solutions should include t h e e f f e c t of
11 variable specific heat (Maclaine-cross 1978; Banks 1985). Despite these limitations, t h e analogy method has advantages over o ther solution methods in providing a be t t e r under- standing of t h e exchanger's operation, in enabling performance predictions t o be made via parameters analogous t o those for hea t exchangers, and in i t s computational speed. For t h e checks of experimental consistency required here, t h e analogy method is satisfactory.
For t h e analogy method, t h e transformation of r a t e and conservation equations for t h e dehumidifier into t h e same form as for a sensible heat exchanger requires defining t h e new dependent variables combined potentials F l a n d F2 and analogous capaci ty ra t ios y
and ~ 2 . In addition, various assumptions a r e satisfied exact ly if t h e regenerator overal 1 NTU approaches infinity, t h e effect ive overall Lewis number (Leo = NTUt/NTUw) is unity, the combined potentials a r e truly orthogonal, and t h e capaci ty ra t ios y l and y2 do not vary through t h e process. For a practical dehumidifier, none of these assumptions hold well. The influence of deviations from t h e assumptions has been examined by Banks (1985) and Jurinak (1982). Banks established t h a t with t h e removal of moisture f rom ai r
using silica gel, t h e combined potentials F and F2 may b e t r e a t e d a s orthogonal. Jurinak inferred t h a t for specific process anh regeneration conditions (35OC, 14.2 g/kg for process and 85"C, 14.2 g/kg for regeneration)--overall NTU > 1.25 and e f f e c t i v e Lewis number < 2.0--the er rors in t h e analogy method using t h e intersection point were l imited to less than 1°C and 0.5 g/kg in t h e a i r ou t l e t s t a t e s when compared t o a finite- d i f ference solution. Jurinak, however, used average values for t h e capac i ty r a t e ra t ios y l and y 2 in his calculations.
For this study of a silica-gel dehumidifier, t h e experimentally inferred overall NTU was found t o be g rea te r than 6 at a l l t e s t e d a i r flow ra tes , and t h e e f f e c t i v e Lewis number was less than 1.2 (see Section 5.2). The use of ave rage values for y l and yZ was found t o be unsatisfactory a t medium wheel rotat ional speeds. To remedy th is problem, t h e calculat ion method of Lambertson (1958) was modified t o incorporate t h e varying spe- c i f i c capaci ty of t h e sensible hea t regenerator. Thus, t h e analogy method used in this r epor t for analyses of t h e experimental d a t a is ent i re ly consistent with t h e exper imenta l measurement uncertainties and findings reported in l a t e r sections.
1 -4 Dehumidifier Test Techniques
The measurement of dehumidifier performance is among t h e most diff icult in mechanical engineering. The six parameters of in teres t require t h e simultaneous measurement of a i r flow, pressure, temperature , humidity, and rotat ional speed. No s tandards exist for t e s t - ing dehumidifiers; t h e national standards for measuring a i r flow, temperature , and humidity yield accuracies considerably less than those required for predicting t h e per- formance of solid desiccant cooling sys tems t o within 10%. The bulk mean a i r state must b e in tegra ted with g r e a t accuracy at a minimum of four locations. These diff icult ies a r e formidable and were perhaps t h e exper imenta l l imitat ions when des iccant cooling was invented over 30 years a g o (Pennington 1955). Improvements in measurement techniques, however, and g rea te r experience in dehumidifier tes t ing have resulted in g rea te r accura- c i e s in these measurements.
The design of t h e SERI Cyclic Test Facil i ty is described by Schlepp et al. (1984). This design was based on a survey of domest ic dehumidifier t e s t facilities. Schultz (1986) has described measurements on a preliminary t e s t a r t i c l e using this facility. Recen t facil i ty modifications t o improve t h e accuracy of t h e measurements a r e described l a t e r in this report . Fur ther improvements may b e necessary t o d e t e c t smaller d i f ferences between dehumidifiers or deviations from ideal performance.
Dehumidifier t e s t s have been performed in Austral ia (Dunkle et al. 1980; van Leersum and Close 1982), Canada, and Europe (Spahn and Gnielinski 1971). Most of these t e s t s have employed larger d iameter dehumidifiers than t h e SERI facil i ty was designed for , typically 1.25 m. This choice was usually made on t h e grounds tha t g r e a t e r measurement accuracy could b e obtained with t h e larger size because the re would be less disturbance of flow by instruments, a higher Reynolds number in flow measuring devices and ducts, and a lower duct per imeter and hence less hea t loss per unit mass flow.
The Monash University (Ambrose et al. 1983) and University of Manitoba (Chant et al. 1973) t e s t rigs a r e for a 1.25-m rotor d iameter using a single-loop design. One advantage t h a t this design o f fe r s is t h e ability t o measure t h e dehumidifier's performance with a heat- ana mass-balance on the loop, which is less dependent on sensor accuracy and inte- gration errors (Ambrose et al. 1983).
Wet-bulb psychrometer accuracy has improved substantially ( ~ y l i e 198 1 ; Lee 1984) as a result of g r e a t e r theoret ica l understanding. Humidity c a n now be measured with a n un- cer ta inty of less than 1% in t h e psychrometer constant. International and foreign standards (Ower and Pankhurst 1975) permit t h e measurement of a i r flow and pressure drop with a n e r ro r about half t h a t of domestic standards. The cone inlet nozzle is part ic- ularly convenient because i t does not require a n upstream length of s t ra ight duct; i t has been used successfully in Australia (Ambrose et al. 1983; van Leersum and Close 1982; Maclaine-cross and Ambrose 1980).
1.5 Results of Previous Tes t s
Switched beds of silica gel beads have been t es ted by Johnston (1967), t h e results corre- lated stat ist ically, and t h e performance of a desiccant cooling system predicted. The predicted thermal COPS were less than 0.5, indicating very poor dehumidifier performance.
Van Leersum and Close (1982) reported tests on rotating beds of silica gel beads. They were not ab le t o cor re la te t h e results with e i the r t h e analogy theory or f inite-difference solutions, but t h e e f fec t ive Lewis numbers a l l appeared t o be significantly g r e a t e r than 2.0.
Dunkle et al. (1980) reported t h a t high rotational speed t es t s on parallel-plate, wool, and salt-impregnated matr ices indicated high mass t ransfer resistance.
Schultz (1986) presented t h e f i rs t but limited set of cyclic t e s t results over t h e full rota- tional speed range on a parallel-plate dehumidifier spirally wound from polyester adhe- sive t ape c o a t e d with silica gel particles. The passages were highly nonuniform, because of practical mechanical problems in winding (see also Appendix C). From a limited num- ber of low-speed tests , approximately 90% of t h e gel present on t h e matr ix appeared t o be active. The overall Lewis number ranged f rom 1.1 t o 2.0.
2.0 THE EXPERIMENTAL FACILITY
2.1 Overview
Over t he past two years, SERl has designed and implemented a versati le experimental facility, the Cyclic Test Facility, t o permit t he experimental evaluation of rotary mass and heat exchangers operating between co- or counterflowing a i r s t reams (Schlepp et ai. 1984; Schultz 1986). Our focus has been on solar cooling applications, t o obtain experimental performance da t a on advanced rotary desiccant dehumidifiers. The facility is thus equipped t o provide two independent a i r streams, one for process and the other for regeneration of the desiccant wheel.
For the process s t ream, t he maximum air flow r a t e is 0.45 kg/s, which can be supplied at a maximum temperature of 3 5 ' ~ and a relative humidity of up t o 95%. The maximum capabilities of t he regeneration s t ream a r e a 0.45-kg/s a i r flow rate , a 1 0 0 ~ ~ temperature, and 10% relative humidity a t the maximum air flow.
The facility is equipped with a full se t of automated controls t o maintain steady inlet conditions, instrumentation to character ize air s t ream inlet and out le t conditions (flow, temperature, and humidity) for both process and regeneration, and a variable-speed drive for wheel-speed control, regulation, and monitoring. There a r e also provisions for moni- toring ambient a i r conditions. Detailed descriptions of the Cyclic Test Facility, includ- ing i ts hardware, control systems, and instrumentation, a r e provided in this section. (We list specific manufacturers and model numbers for information purposes only).
2.2 The Cyclic Test Facility
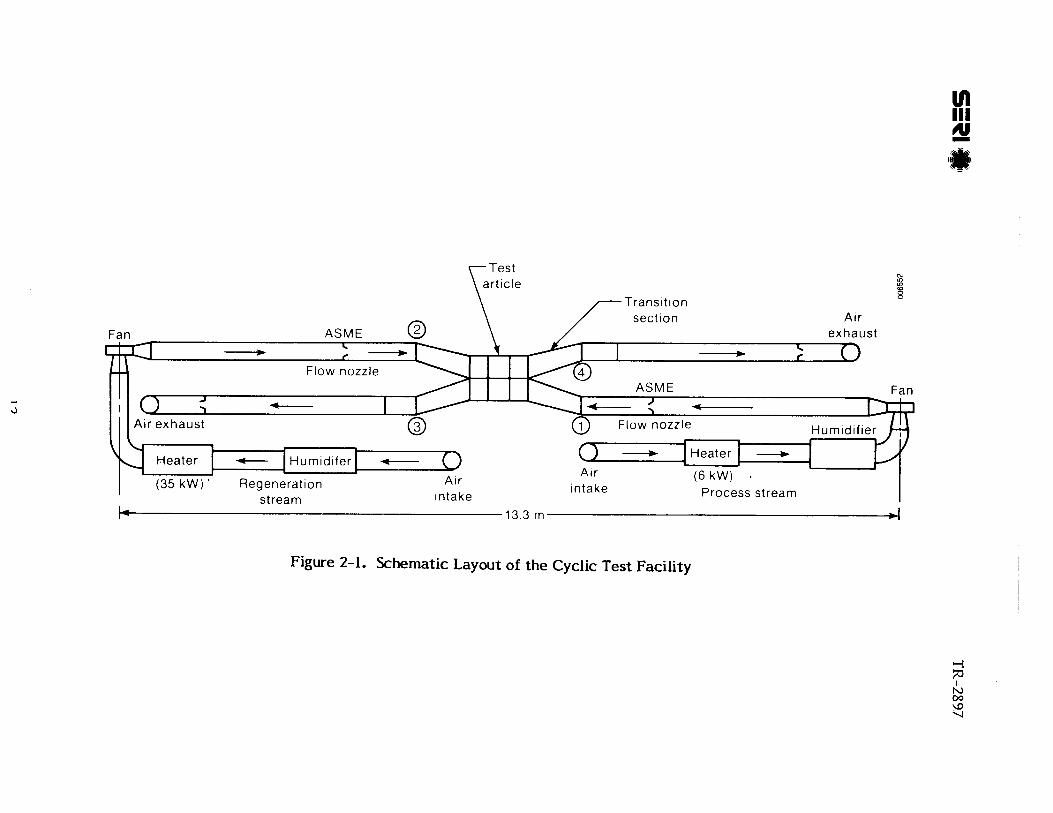
Figure 2-1 is a schematic of t h e Cyclic Test Facility located in t he west high bay of SERlqs Field Test Laboratory Building. The facility is designed t o provide two indepen- dent s t reams of air , process and regeneration, t o t he t es t unit.
For the process s t ream, induced room air is f irst heated and then humidified t o achieve t he air temperature and humidity required. It then flows through a variable-speed fan and through a long, straight-duct section for flow metering. Jus t upstream of entry into the test art icle, inlet a i r s t a t e s a r e monitored at station I. Out le t s t a t e s a r e monitored at station 3. The outlet flow r a t e can again be metered through a second ASME flow nozzle before t he air is exhausted back into t h e room.
The regeneration s t ream is configured similarly t o the process s t ream, with inlet and out le t s t a tes monitored a t stat ions 2 and 4, respectively.
2.2.1 Process Control
All process variables a r e monitored and feedback signals a r e initiated via a da t a acquisition/control unit (Hewlett Packard, model 3497A) controlled by a personal com- puter (International Business Machines, model PC). The control unit is equipped with an extender (Hewlett Packard, model 3498A) t o provide a tota l of 15 slots for da t a acquisi- tion and control card placement.
The computer is provided with 5 12 kB of memory and two 360-kB floppy diskette drives. It communicates with the control unit via a serial interface (RS-232) a t a baud r a t e of 2400 bps. The da ta gathered by t he control unit and commands initiated by the computer
a r e coordinated by means of an inquire/acknowledge sof tware handshake. Da ta gathered by t h e computer a r e displayed on a monitor and also stored in floppy diskettes for further processing.
2.2.1.1 Air Flow
Air flow for each s t ream is i duced by a centrifugal blower (New York Blower, model 3 compact G1124, ra ted at 0.5 m 1s at 1000 Pa s t a t i c pressure) driven by a 2-hp, variable- speed ac motor. The motor is powered by a variable-frequency speed controller (Fincor, model 5100), which converts a 230-V, single-phase, 60-Hz power source t o a n ac voltage of a frequency proportional t o an input dc current signal of 4 t o 20 mA. This input signal is provided by a current source ca rd located in the HP3497A control unit.
Air flow control is accomplished by inferring the air flow r a t e from the measured ~p across t he ASME metering nozzle, computing an error proportional t o the deviation from the se t point, and feeding back a proportional current signal t o the fan speed controller. Typically, t h e t ime required t o achieve a set-point flow r a t e within a few percentage points was found t o be about 40 s.
2.2.1.2 Air Temperature
Heat is added t o each s t ream by a 480-V, three-phase e lect r ic resistance duct heater. The process s t ream heater has a capacity of 6 kW, and the regeneration heater, 35 kW. Power input t o the heater is regulated by a silicon-controlled rectif ier (SCR) controller (Holmar Electronics, series LZF2) which accepts a 0-5 mA current signal a s input. Again, using a differential proportional control based on measured and set-point air temperature, a feedback signal is sent t o the SCR power supply t o t h e respective heater. Under steady state, for typical experimental conditions, air temperature fluc- tuations can be held t o within 2 0 . 2 ~ ~ over test periods of 4 hours or more.
2.2.1.3 Air Humidity
W e maintained the humidity conditions by injecting s team into the a i r streams. The s team is generated by an Electro-Steam (50-kW electr ic boiler with on/off control) through a pressure regulator with 4-kPa (112-psi) differential (Watts Regulator Co., model 5M3). The s team is injected into t he a i r s t ream through a Walton ST-100 s team humidifier. The s team flow t o each s t ream is regulated by a Fisher Control electro- pneumatic valve.
Hysteresis in t he control valves and t he long response t ime (15-20 s) of t h e humidity sensing loop made computer control of the s team flow difficult. Fluctuations in t he lab- oratory a i r humidity ratio further complicated the task. Currently, we control t h e s team flow manually from the 1BM PC. An integer value (between 3,000 and 10,000) from the IBM P C is converted t o a current signal (between 4 and 20 rnA) by the HP3497A. The current signal determines the position of t h e pneumatic valve. The search for t h e cor- rec t valve position requires t he operator's continual at tention. The inlet humidity ra t io can be held t o within k0.5 g/kg for each s t ream during the course of an experiment.
2.2.1.4 Wheel Speed
The dehumidifier is circumf erentially f r ic t ion-driven by a dc servomotor (Electro-Craf t Corp., model E26-2) turning a rubber-rimmed drive wheel through a reduction gear assembly. An optical encoder (BE1 encoder model E25AB) mounted on t he drive motor outputs 1000 pulses per motor revolution, which is monitored by a counter ca rd
(HP 44426A) in t h e HP3497A. The HP3497A averages t h e elapsed t i m e per revolution over a thousand counts, and this information, together with t h e gear-reduction ratio, allows us t o ca lcu la te t h e wheel speed. The drive motor is driven by a manually con- trolled, 40-V, 8-A power supply (KEPCO, model JQE 36-8M). Manual control is accept- able in th is case, a s w e can reach set-point wheel speeds within 20-30 seconds and hold t h e m t o within +1.0%.
2.2.2 Instrumentation
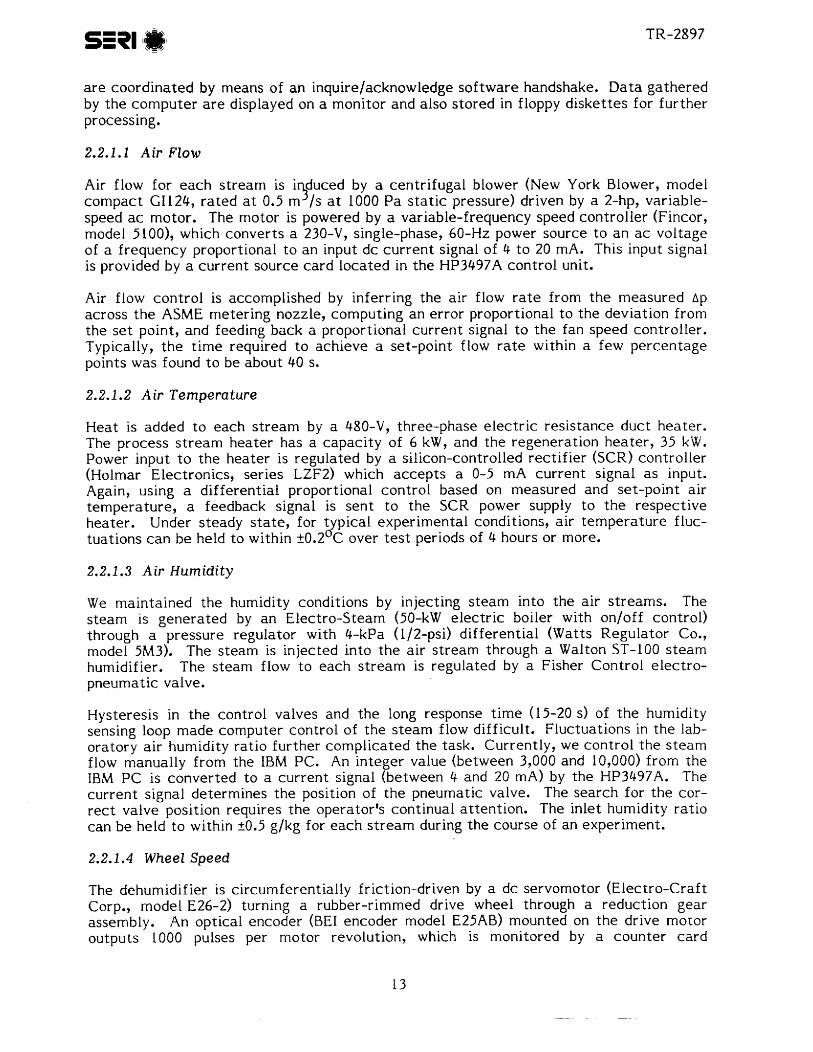
Figure 2-2 shows t h e arrangement of instrumentation adjacent t o t h e test art icle. These include four s e t s of temperature and humidity measuring devices, two differential pres- sure transducers, and a wheel-speed measuring device. In addition, f a r the r away f rom t h e t e s t ar t ic le , a s e t of four ASME flow nozzles together with their ap transducers helps t o monitor t h e flow rates.
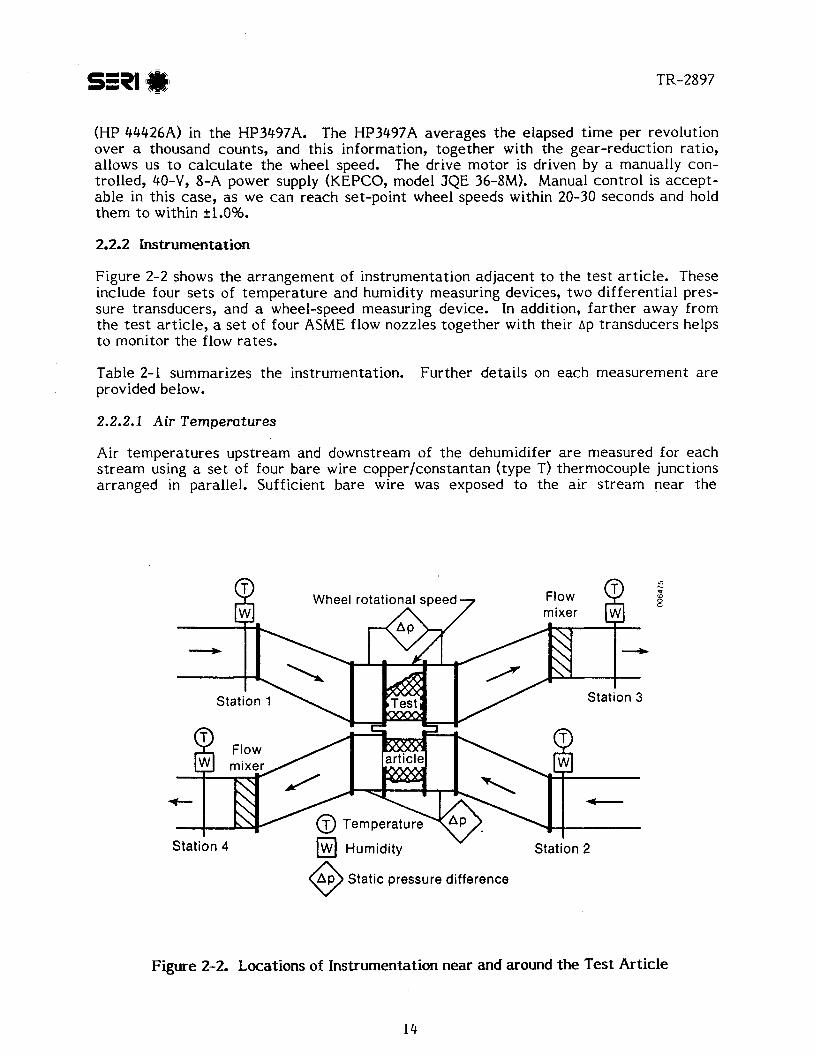
Table 2-1 summarizes t h e instrumentation. Fur ther details on each measurement a r e provided below.
2.2.2.1 Air Temperatures
Air temperatures upstream and downstream of t h e dehumidifer a r e measured for each s t r e a m using a s e t of four bare wire copper/constantan (type T) thermocouple junctions arranged in parallel. Sufficient bare wire was exposed t o t h e a i r s t r eam near t h e
Figure 2-2. Locations of Instrumentation near and around t h e Tes t Art ic le
Table 2-1. Summary of Instrumentation for t h e Cyclic Test Facility
Variable Device Comments
Wp inlet flow nozzle Capacitance pressure sensors Eight s t a t i c pressure t aps at each flow nozzle a r e (MKS Instruments, Baratron type 2 2 1 ~ ) configured t o sense an average s t a t i c pressure
difference.
Wp out le t flow nozzle Capaci tance pressure sensors Two s t a t i c pressure t aps a t each flow nozzle are (MKS Instruments, Baratron type 221A) used to sense a s t a t i c pressure difference.
wpp, Wpr Capacitance pressure sensors (MKS Instruments, Baratron type 221A)
+ u
TI , T2, T3, T4 Type T thermocouple
W1, W 2 1 W 3 9 W 4 Dew point hygrometers (General Eastern, model 11 00 DP/ 11 11 D)
P7 Or Pamb Capacitance pressure sensor (MKS Instruments, Baratron type 220A)
Optical encoder (BE1 Model E25AB)
Five s t a t i c pressure sensors for each flow s t r e a m a r e used t o measure t h e s ta t i c pressure di f ference across each side of t h e dehumidifier.
An a r ray of four thermocouples connected in paral- lel is used t o obtain an area-weighted average a t each sampling location.
The bulk average humidity ra t ios a t each location a r e obtained by mixing air sampled at four points across the duc t cross section.
The encoder is mounted on t he drive motor and outputs 1000 pulses per motor revolution t o a n HP counter card.
measuring junction t o reduce t h e conduction e r ro rs t o less than 0 . 0 1 ~ ~ . The flow duc t was insulated t o reduce radiation e r ro rs t o less than 0.5'~.
Temperatures were inferred by measuring t h e thermocouple e lect romotive fo rce (emf) through a digital vol tmeter referenced t o a n e lect ronic O'C (emf) put ou t by t h e voltage ca rd (HP model 44422A) in t h e HP3497A.
A polynomial recommended by t h e National Bureau of Standards (NBS) was used t o con- v e r t t h e measured emf t o t empera tu re (Benedict 1977):
where T = temperature , in OC
E = emf , in mV.
This equation yields temperatures t o within k0.2'~. The combined overall uncertainty in t h e a i r t empera tu re measurement is es t imated t o b e 20.6'~.
2.2.2.2 Air Humidity
Air humidity levels were monitored using dew-point hygrometers (General Eastern, models 1 1 0 0 D P / l l l l ~ ) . These instruments opera te by monitoring t h e t empera tu re of a chilled mirror surrounded by t h e sampled air. The mirror is chilled in a controlled fash- ion t o induce vapor condensation on t h e mirror's surface. The onset of condensation is sensed optically by reduced reflectivity. The mirror's t empera tu re is monitored by a platinum resistance thermometer. Four sensors were used t o monitor t h e dew points of t h e two inlet and out le t streams. The sensors were calibrated by t h e manufacturers, with a resulting dew-point-temperature uncertainty of t0 .4 '~ .
The measured dew point temperature , T is then converted t o a n absolute humidity level in t h e sampled a i r s t ream by d ~ '
where
fws = fugacity of water vapor in a i r at sa tura t ion Tdp = dew-point t empera tu re (OC)
w = humidity ra t io (kg/kg) psat(Tdp) = satura t ion pressure of water vapor at t h e dew-point t empera tu re (Pa)
pt = to ta l absolute pressure (Pa).
The saturation pressure a s a function of T is corre la ted as (Maclaine-cross 1974) dp
= exp (23.28199 - 3780.82 - 'sat 225805 - 2 I
for 0 < T < LOOOC, and dp
P = exp (28.87 - sat 6 1 3 3 * 8 ) T
dp
Uncertainty in the derived absolute level of humidity results from incomplete mixing of t he outlet air streams, errors in t he temperature measurement, calibration errors, errors in the measurement of total absolute pressure, and errors in the saturation pressure cor- relation. For t he present tests, errors in the absolute humidity level a r e estimated t o be approximately &3%.
2.2.2.3 Static Pressure
Pressure measurements a r e required for (1) pressure drop characteristics of the wheel, (2) pressure differences across t he dehumidifier seals that cause leakage, ( 3 ) pressure dif- ferences across flow nozzles t o calculate flow rates, and (4) ambient absolute pressure for air density and humidity ratio calculations,
Capacitance pressure sensors a r e used (MKS Instruments, Baratron type 221A) for dif- ferential pressure measurements and have a range of 0-250 Pa (0-10 in.) of water. These sensors put out a voltage signal linearly proportional to a pressure difference. The tes t loop uses six sensors: four t o monitor t he pressure differences across t he flow nozzles in the inlet and outlet air streams, and two t o monitor the pressure difference across each side of the dehumidifier.
W e checked the calibration of these instruments by comparing them with a Hooke gauge manometer (Dwyer Instruments, Microtector) with a resolution of k0.0002 in. of water. The results showed a typical differential pressure error of less than &0.5%.
Again, we use a capacitance sensor t o monitor the ambient absolute pressure (MKS Instruments, Baratron type 220A). This sensor was checked against a calibrated aneroid barometer with a resolution of 0.2 torr in the SERI Instrumentation/Metrology Center. Considering temperature e f fec t s on the pressure measurement, the uncertainty in the measurement is less than &I%.
2.2.2.4 Air Flow Rate
Air flow ra te in each stream was inferred through measurement of the pressure differ- ence across standard ASME long-radius flow nozzles. The nozzles were installed in the flow stream with straight pipe lengths upstream and downstream of ten and five diameters, respectively, to conform t o the ASME standards.
The air flow r a t e through the nozzle is given by Benedict (1977):
L where
i = air mass flow r a t e (kg/s) Cd = nozzle discharge coefficient
2 A2 = nozzle exit a rea (m )
R = gas constant for air , = 0.287 kJ/kg K B = nozzle diameter rat io, = nozzle ex i t diameter/nozzle inlet d iameter
Tt = upstream stagnation t empera tu re (K) y = ra t io of specific hea t s for a i r ( taken t o be 1.4)
p1 = s t a t i c pressure measured at one duc t d iameter upstream of nozzle (Pa) p2 = s t a t i c pressure measured at one-half duc t d iameter downstream of nozzle
(Pa) r = s t a t i c pressure rat io, = p1/p2.
Based on a number of comparisons, Benedict (1966) recommends t h e use of t h e following expression for t h e long radius flow nozzle discharge coefficient:
where
Rd = Reynolds number for t h e a i r flow at t h e nozzle throat .
The nozzle a p was measured with a differential pressure transducer. Four s t a t i c pressure t aps at e a c h upstream and downstream location were configured circumferential ly equally spaced, t o sense Ap. Uncertainty in t h e a i r flow measurement was es t imated by procedures outlined by Benedict (1977, p. 479). The overall uncertainty in t h e airflow measurement is 53.6%.
3.0 THE TEST ARTICLES
3.1 Rotary Dehumidifiers
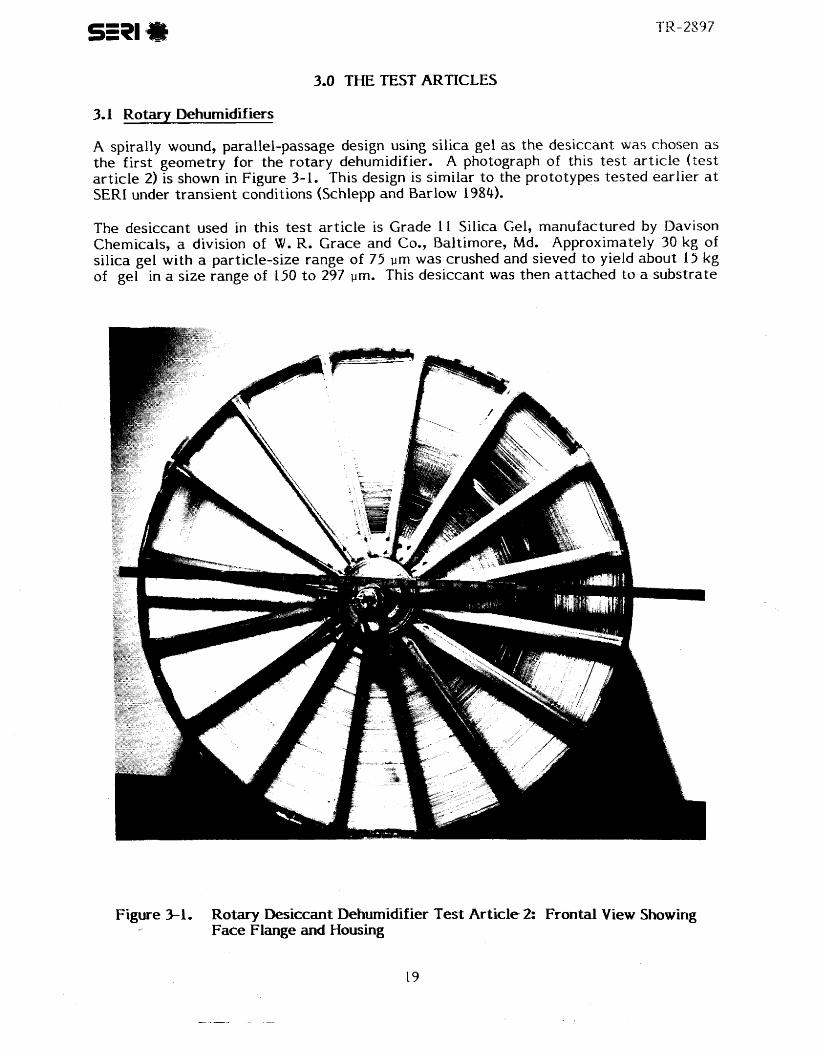
A spirally wound, parallel-passage design using silica gel as the desiccant was chosen as the f i rs t geometry for t h e rotary dehumidifier. A photograph of this test a r t i c le (zest ar t ic le 2) is shown in Figure 3-1. This design is similar t o the prototypes tes ted earlier at SERI under transient conditions (Schlepp and Barlow 1984).
The desiccant used in this test a r t i c le is Grade 11 Silica Gel, manufactured by Davison Chemicals, a division of W. Re Grace and Co., Baltimore, Md. Approximately 30 kg of silica gel with a particle-size range of 75 urn was crushed and sieved t o yield about 15 kg of gel in a s ize range of 150 t o 297 urn. This desiccant was then a t tached to a substra te
Figure 3-1. Rotary Desiccant Dehumidifier Test Article 2: Frontal View Showing , Face Flange and Housing
polyester t ape (Adhesives Research, Inc., Model ARclad 5190) nominally 25 urn thick, covered with adhesive 25 um thick on both sides. About 400 m of t h e coa ted t ape with a nominal width of 200 mm was forwarded t o Rotary Hea t Exchangers* Pty. Ltd. of Bayswater, Victoria, Australia, for incorporation into t h e dehumidifier t e s t articles.
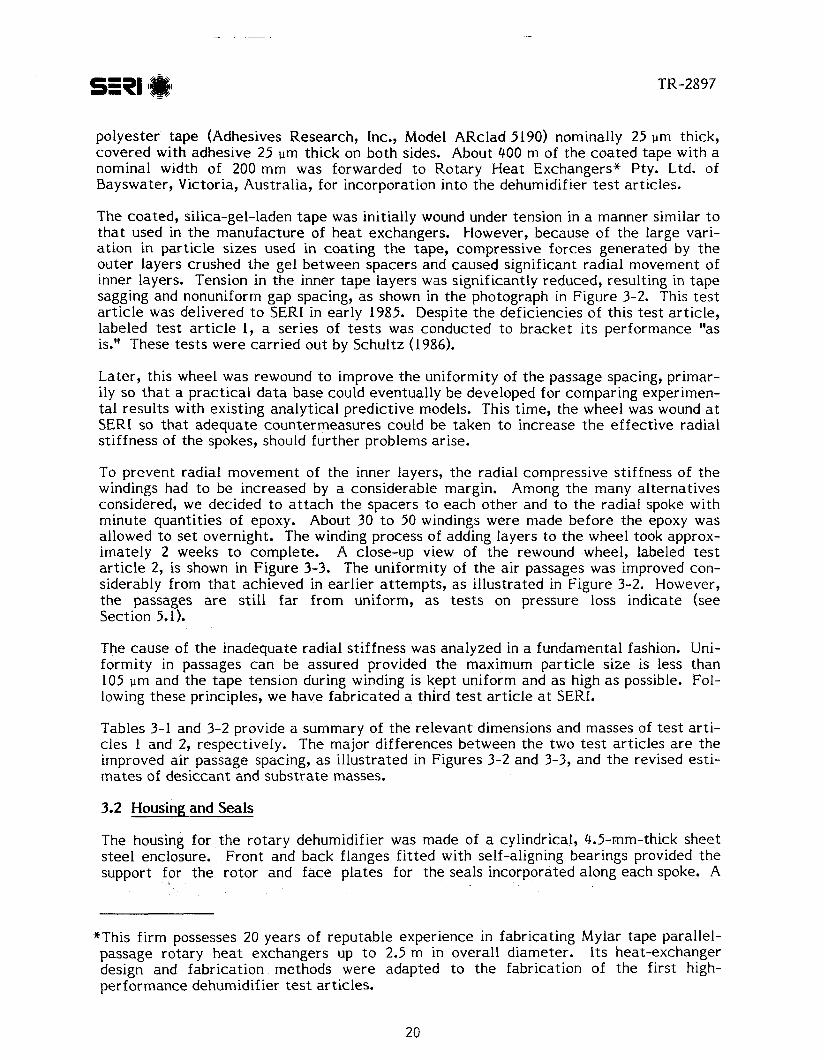
The coated, silica-gel-laden t a p e was initially wound under tension in a manner similar t o t h a t used in t h e manufacture of h e a t exchangers. However, because of t h e large vari- a t ion in part icle s izes used in coat ing t h e tape, compressive forces generated by t h e outer layers crushed t h e gel between spacers and caused significant radial movement of inner layers. Tension in t h e inner t a p e layers was significantly reduced, resulting in t a p e sagging and nonuniform gap spacing, a s shown in t h e photograph in Figure 3-2. This test a r t i c le was delivered t o SERI in early 1985. Despite t h e deficiencies of this t e s t ar t ic le , labeled t e s t a r t i c le I, a series of tests was conducted t o bracket i t s performance "as is." These t es t s were carr ied ou t by Schultz (1986).
Later, this wheel was rewound t o improve t h e uniformity of t h e passage spacing, primar- ily s o t h a t a pract ica l d a t a base could eventually b e developed for comparing experimen- t a l results with exist ing analytical predictive models. This t ime, t h e wheel was wound at SERI so t h a t adequate countermeasures could be taken t o increase t h e effect ive radial st iffness of t h e spokes, should fur ther problems arise.
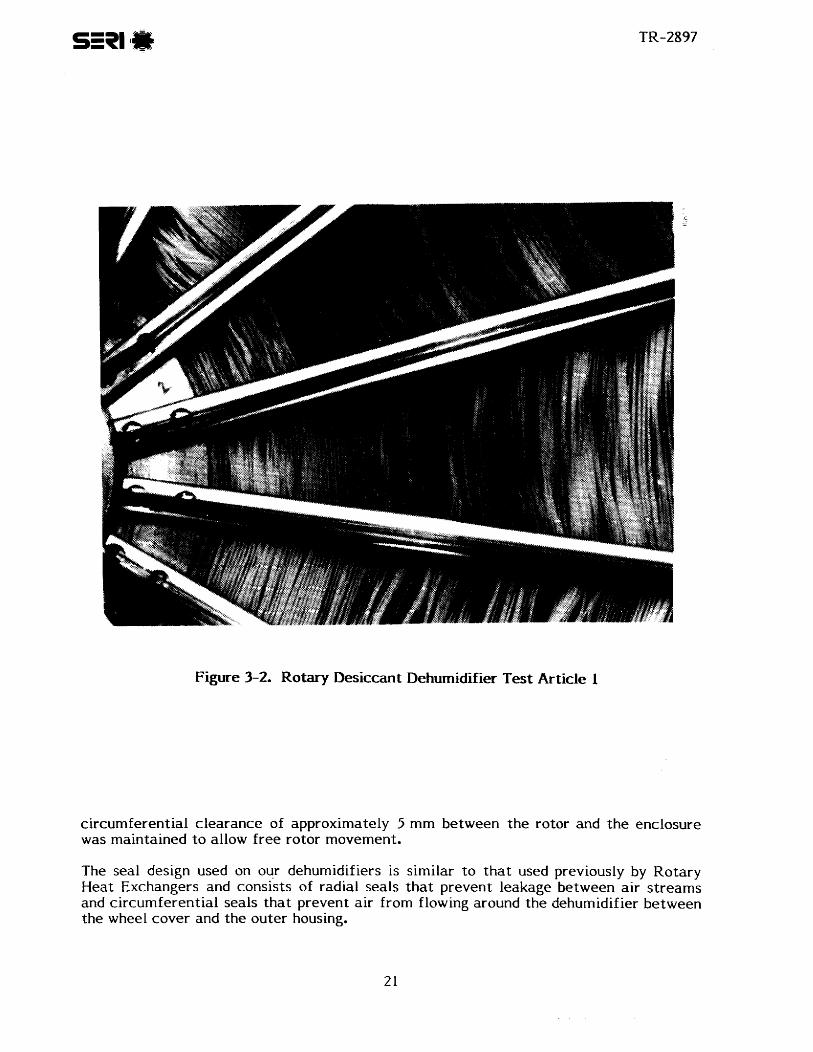
To prevent radial movement of the inner layers, t h e radial compressive stiffness of t h e windings had t o be increased by a considerable margin. Among t h e many alternatives considered, we decided t o a t t a c h t h e spacers t o each other and t o t h e radial spoke with minute quanti t ies of epoxy. About 30 t o 50 windings were made before t h e epoxy was allowed t o set overnight. The winding process of adding layers t o t h e wheel took approx- imately 2 weeks t o complete. A close-up view of t h e rewound wheel, labeled test a r t i c le 2, is shown in Figure 3-3. The uniformity of t h e a i r passages was improved con- siderably from t h a t achieved in ear l ier a t tempts , as illustrated in Figure 3-2. However, t h e passages a r e s t i l l f a r f rom uniform, as t e s t s on pressure loss indicate (see Section 5.1).
The cause of t h e inadequate radial st iffness was analyzed in a fundamental fashion. Uni- formity in passages c a n be assured provided t h e maximum particle s ize is less than 105 um and t h e t a p e tension during winding is kept uniform and a s high a s possible. Fol- lowing these principles, w e have fabr icated a third t e s t a r t i c le at SERI.
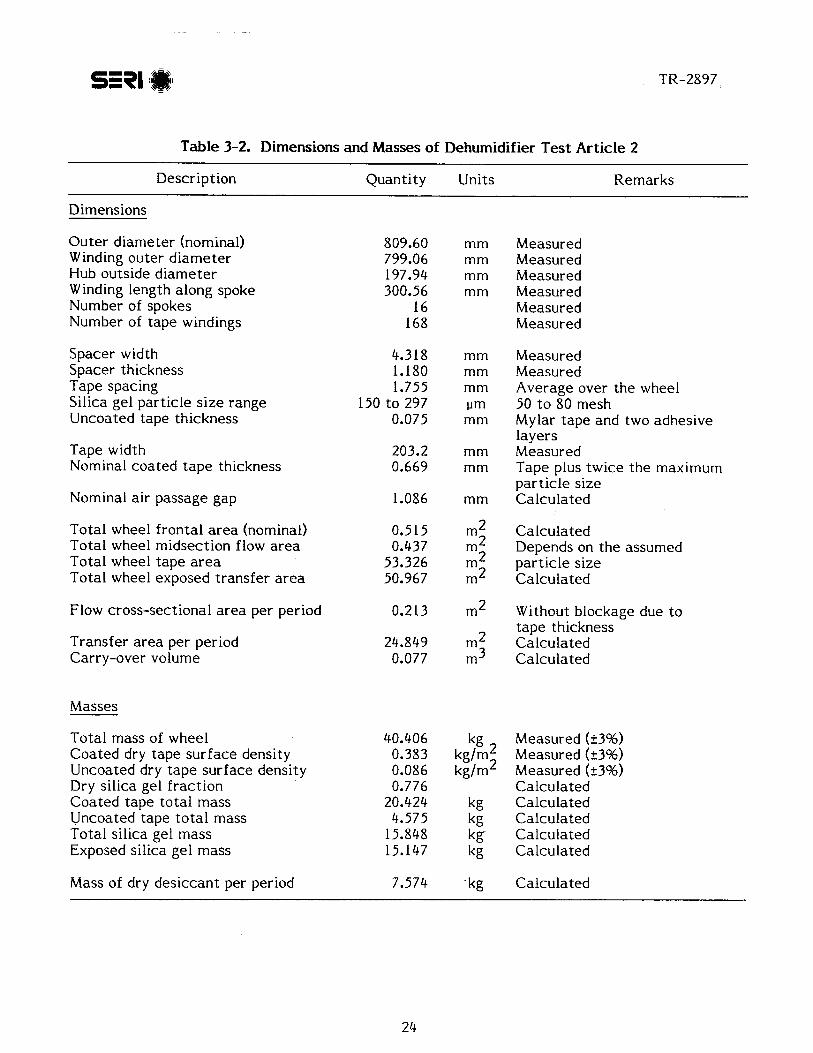
Tables 3-1 and 3-2 provide a summary of t h e relevant dimensions and masses of t e s t ar t i - c les 1 and 2, respectively. The major differences between t h e two t e s t art icles a r e t h e improved a i r passage spacing, a s illustrated in Figures 3-2 and 3-3, and t h e revised esti- m a t e s of desiccant and subst ra te masses.
3.2 Housing and Seals
The housing for t h e rotary dehumidifier was made of a cylindrical, 4.5-mm-thick shee t s t ee l enclosure. Front and back flanges f i t t ed with self-aligning bearings provided t h e support for t h e rotor and f a c e pla tes for the seals incorporated along each spoke. A
*This f irm possesses 20 years of reputable experience in fabricating Mylar t ape parallel- passage rotary h e a t exchangers up t o 2.5 m in overall diameter. I ts heat-exchanger design and fabrication methods were adapted t o t h e fabrication of t h e f irst high- performance dehumidifier test articles.
sin lej
Figure 3-2. Rotary Desiccant Dehumidifier Test Article 1
circumferential clearance of approximately 5 mm between the rotor and the enclosure was maintained t o allow f ree rotor movement.
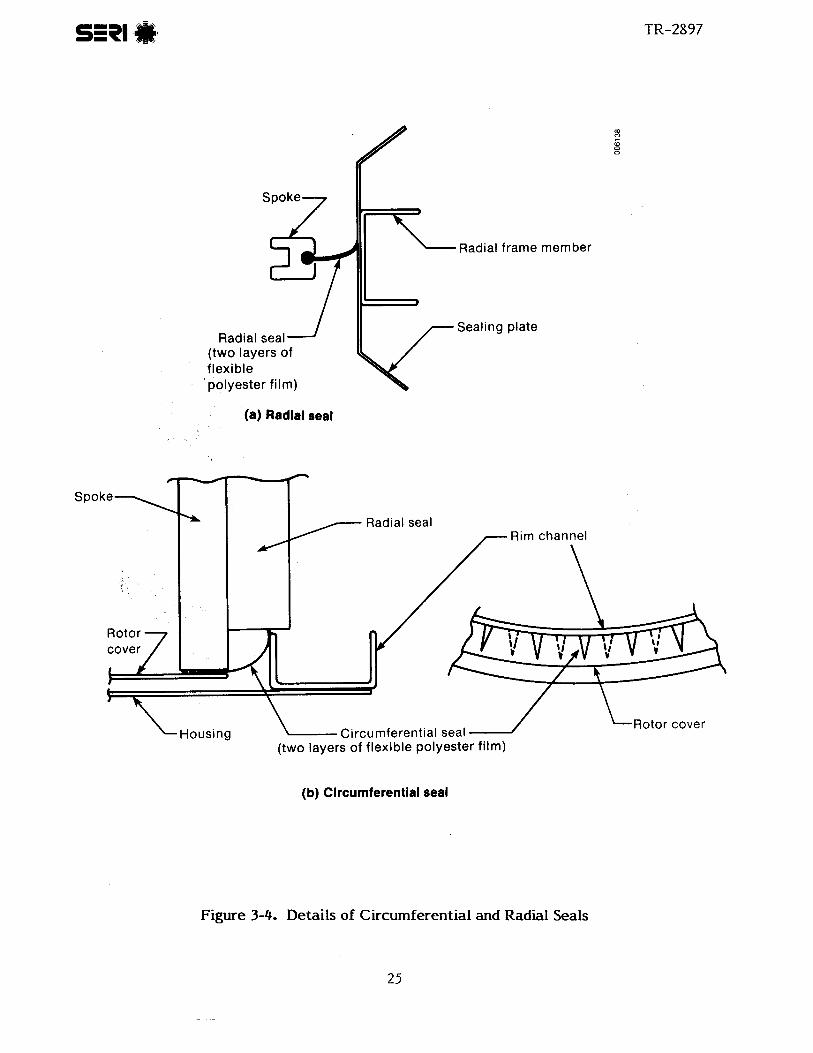
The seal design used on our dehumidifiers is similar t o t h a t used previously by Rotary Heat Exchangers and consists of radial seals tha t prevent leakage between air s t reams and circumferential seals tha t prevent a i r from flowing around the dehumidifier between the wheel cover and the outer housing.
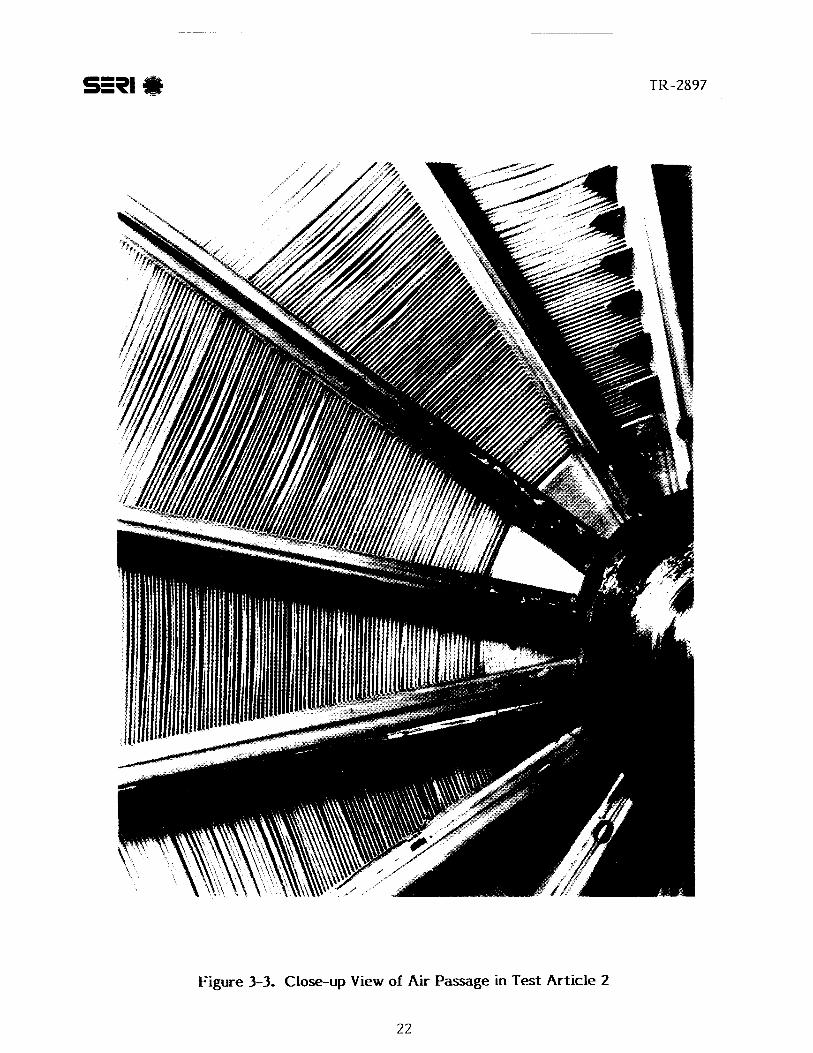
Figure 3-3. Close-up View of Air Passage in Test Article 2
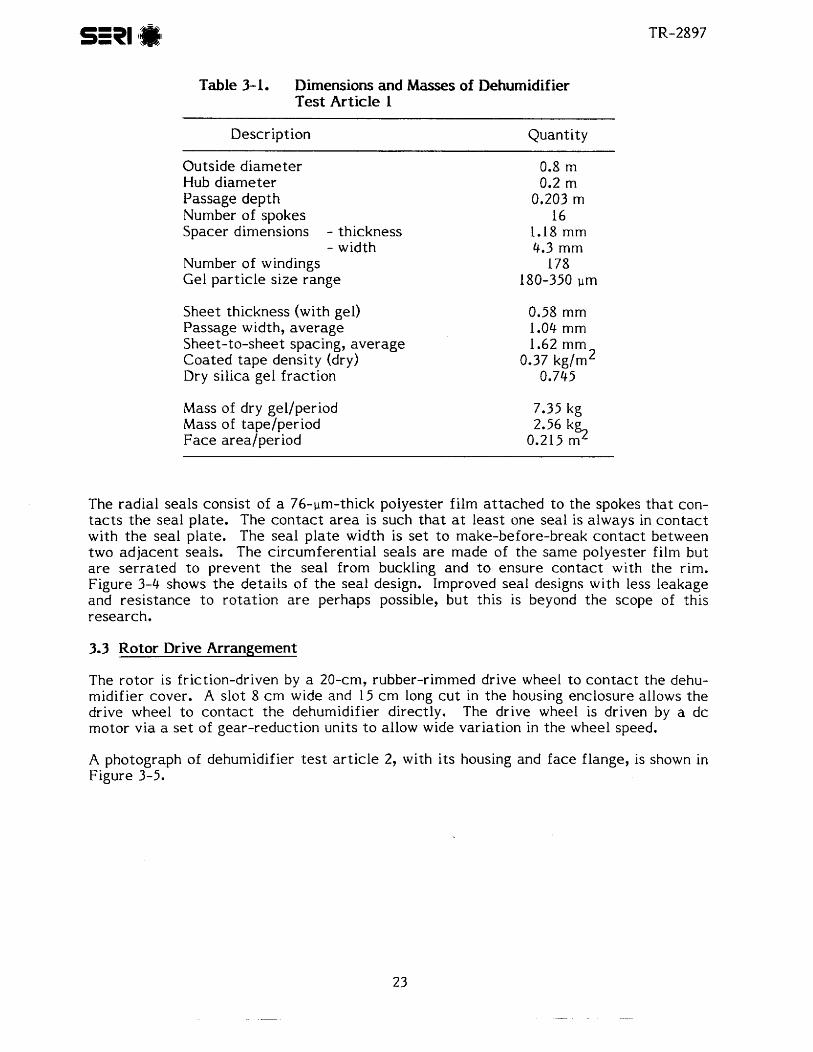
Table 3- 1. Dimensions and Masses of Dehumidifier Test Article 1
-
Description Quantity
Outside diameter Hub diameter Passage depth Number of spokes Spacer dimensions - thickness
- width Number of windings Gel particle size range
Sheet thickness (with gel) Passage width, average Shee t-to-sheet spacing, average Coated tape density (dry) Dry silica gel fraction
Mass of dry gellperiod Mass of tapelperiod Face arealperiod
0.8 m 0.2 m
0.203 m 16
1.18 mm 4.3 mrn
178 180-350 um
2.56 kg;! 0.213 m
The radial seals consist of a 76-pm-thick polyester film a t t ached t o the spokes tha t con- t a c t s t h e seal plate. The con tac t a rea is such tha t a t least one seal is always in contact with t h e seal plate. The seal p la te width is se t t o make-before-break con tac t between two adjacent seals. The circumferential seals a r e made of the same potyester film but a r e se r ra ted t o prevent the seal from buckling and to ensure contact with the rim. Figure 3-4 shows t he details of the seal design. Improved seal designs with less leakage and resistance t o rotation are perhaps possible, but this is beyond t h e scope of this research.
3.3 Rotor Drive Arrangement
The rotor is friction-driven by a 20-cm, rubber-rimmed drive wheel t o con tac t the dehu- midifier cover. A slot 8 c m wide and 15 c m long c u t in t he housing enclosure allows t he drive wheel t o con tac t the dehumidifier directly. The drive wheel is driven by a dc motor via a s e t of gear-reduction units t o allow wide variation in the wheel speed.
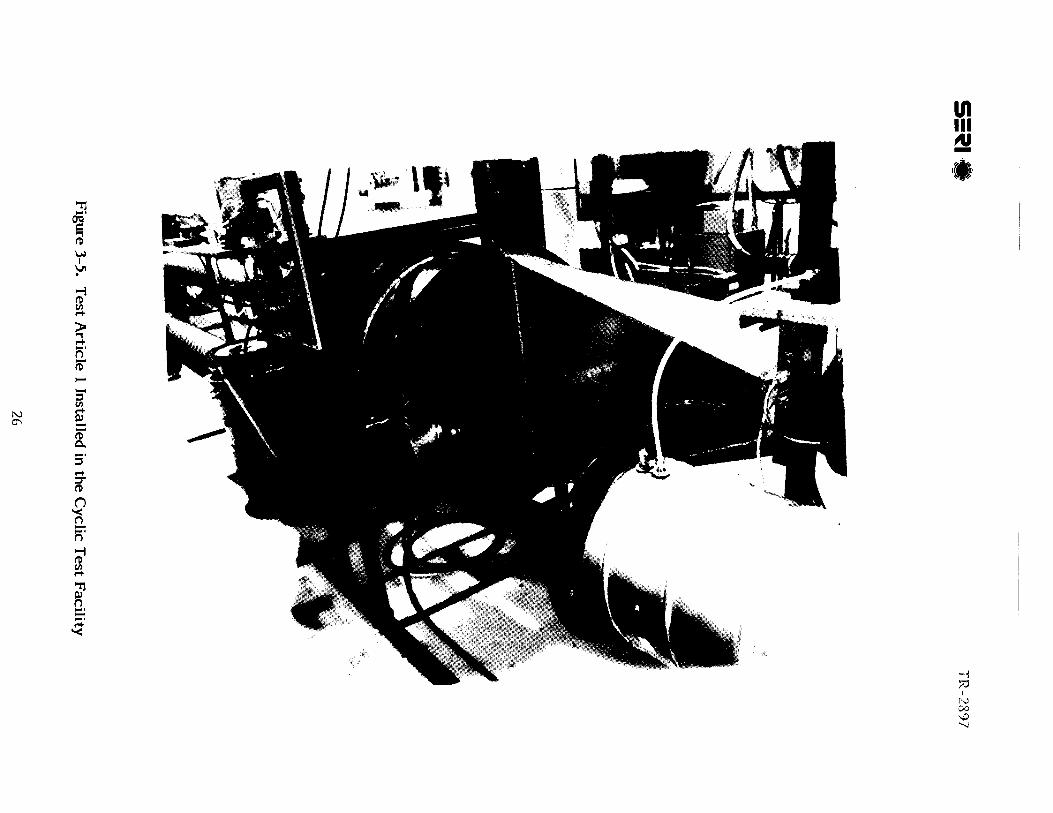
A photograph of dehumidifier t e s t a r t i c le 2, with i t s housing and face flange, is shown in Figure 3-5.
sgn
Table 3-2. Dimensions and Masses of Dehumidifier T e s t Art ic le 2
Description Quanti ty Units Remarks
Dimensions
Oute r d iameter (nominal) Winding outer d iamete r Hub outside diameter Winding length along spoke Number of spokes Number of t ape windings
Spacer width Spacer thickness Tape spacing Silica gel part icle s ize range Uncoated tape thickness
Tape width Nominal coated t a p e thickness
Nominal a i r passage gap
Total wheel frontal a r e a (nominal) Total wheel midsection flow a r e a Total wheel t ape a r e a Total wheel exposed t ransfer a r e a
Measured Measured Measured Measured Measured Measured
Measured Measured Average over t h e wheel 50 t o 8 0 mesh Mylar t ape and two adhesive layers Measured Tape plus twice t h e maximum par t ic le size Calculated
Calculated Depends on t h e assumed par t ic le size Calculated
Flow cross-sectional a r e a per period 0.2 13 mL Without blockage due t o t a p e thickness
Transfer a r e a per period 24.849 m Calculated Carry-over volume 0.077 m Calculated
Masses
Total mass of wheel Coa ted dry t ape surface density Uncoated dry t a p e surface density Dry silica gel f ract ion Coated t ape to ta l mass Uncoated t ape t o t a l mass Total silica gel mass Exposed silica gel mass
Mass of dry desiccant per period
Measured ( ~ 3 % ) Measured (+3%)
- Measured (+3%) Calculated
kg Calculated kg Calculated k g Calculated kg Calculated
.kg Calculated
4.0 THE EXPERIMENTAL PROCEDURE
To operate the Cyclic Test Facility (CTF), a carefully chosen procedure was adopted and followed t o ensure the safety of the personnel and t o generate consistent, accurate sets of data. When the tes t conditions for a particular run a r e specified in terms of the pro- cess and regeneration stream flow rates, inlet temperatures, humidities, and the wheel rotational speed, wheel rotation is initiated. The inlet conditions a r e entered into the central computer and the acquisition/control program is started. Automatic controls of the loop bring up the air s t ream flow ra tes and temperatures. The humidity of the incoming air s t reams must be controlled manually. The s ta tus of the loop variables is continually updated on the computer monitor at 10-second intervals to visually indicate the tes t status.
In addition, continuous t races of temperatures and humidities a r e recorded on a strip chart. Approximately 30 t o 40 minutes a r e allowed t o a t ta in steady-state inlet conditions. Depending on the wheel rotational speed, the outlet conditions reach steady s t a t e over a maximum period of 2 hours, which can be inferred from steady strip-chart traces.
At this point, a steady-state data-gathering routine is initiated. All t es t variables a r e read and recorded on a floppy diskette a t 60-second intervals. Continuous updates of enthalpy and mass balance errors a r e provided on the monitor. The operator monitors these errors t o ensure that overall errors a r e within &2%. The steady-state data- gathering routine is allowed t o persist over a minimum period of 15 minutes. Special precautions a r e taken for the low- and high-speed tests. For low-speed tests, the entry of each spoke from process t o regeneration results in periodic variations in outlet states. The operator begins and ends the da ta gathering over a minimum of four full cycles of these variations t o ensure that t rue average outlet conditions a r e recorded. For high-speed tests, the approach of the matrix t o a steady s t a t e is extremely slow. The associated t ime constant may be in hours. I t is thus essential that the tes t be con- tinued over four hours, and tha t the fluctuations in inlet conditions be kept minimal. Additional operational details for the CTF a r e provided in Appendix H.
sin 5.0 EXPERIMENTAL RESULTS AND DATA ANALYSES
The raw experimental data a r e distorted by finite leakage out of the housing, cross- leakage between the streams, and carry-over, especially at high rotational speeds. Seal leakages at t h e housing a r e characterized by procedures described in Appendix E. Raw da ta a r e then processed according t o procedures described in Appendix G to arrive a t t rue rotor inlet and outlet conditions for further heat- and mass-transfer analyses.
In this section, further processing of the corrected data and accompanying results and discussions a r e provided. Section 5.1 describes the pressure-loss characterization and Section 5.2 t he heat- and mass-transfer characterization of test ar t ic le 2."
5.1 Pressure-Loss Tests
To determine the rotor pressure-loss characteristics, we conducted two independent series of tests. For the first series, the rotor was configured in i ts housing and seals as in dehumidification applications with two counterflowing streams, each flowing through one-half of t h e rotor. For the second series, t he rotor was removed from its housing and front and back flanges, and configured a s shown in Figure 5-1 with a single s t ream of air flowing through the ent i re wheel, f ree from any other obstructions. This configuration is denoted a s open rotor in the following sections. A wide range of air flows at a particular room temperature and humidity was used for all the pressure-loss tests. The two series of data were analyzed separately, following procedures outlined by Maclaine-cross and Ambrose ( 1980).
5.1.1 Data Analyses
Case 1: Open Rotor. The flow through the rotor is modeled as depicted in Figure 5-2. Stations 1 and 4 represent the locations of t he s ta t ic pressure taps used t o measure the pressure difference. Stations 2 and 3 represent locations just upstream and downstream of the air flow through the matrix. True s ta t ic pressure loss through the rotor, repre- sented by p2 - p3, is expressed as
Here, pl - p2 represents the initial contraction loss a s the air acceleration into the matrix, and p3 - p4 represents an exit loss. The entrance loss is expressed a s
1
where Ac is t he minimum cross-sectional a r ea at station 2 and Ad is that of station I. For open-rotor tests, the ratio (Ac/Ad) is essentially zero.
*The da ta analysis carried out in this report relies heavily on the analogy method for modelling dehumidifier performance. For a detailed understanding, i t is suggested that the reader become familiar with the analogy method. Since the method is fairly detailed and has been documented in the literature, a formal introduction t o the analogy method would be beyond the scope of this report.
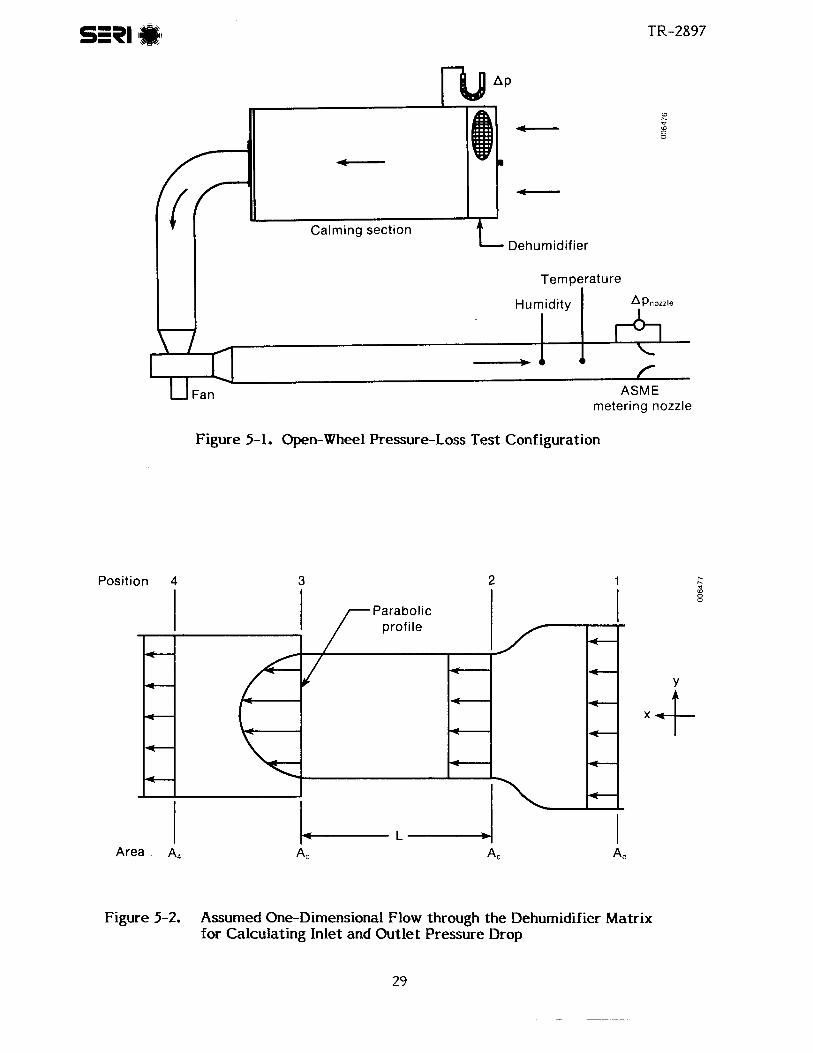
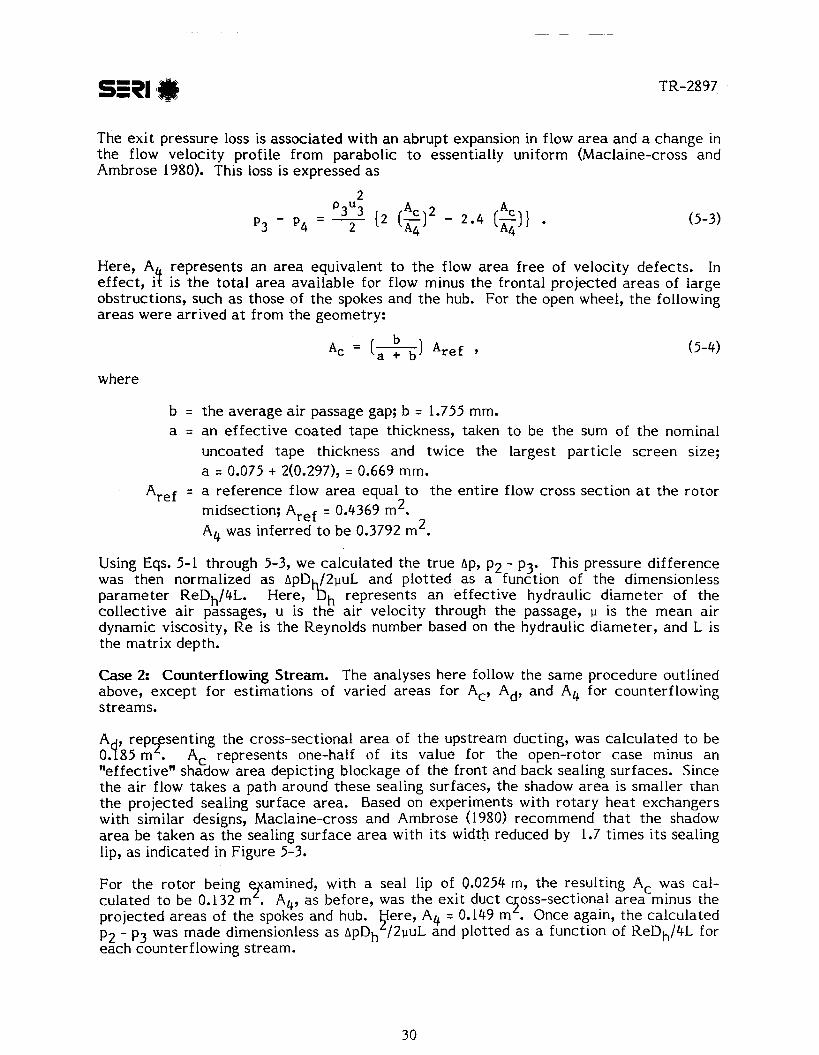
The ex i t pressure loss is associated with a n abrupt expansion in flow a r e a and a change in t h e flow velocity profile f rom parabolic t o essentially uniform (Maclaine-cross and Ambrose 1980). This loss is expressed as
Here, A represents a n a r e a equivalent t o t h e flow a r e a f r e e of velocity defects. In effect , i t is t h e to ta l a r e a available for flow minus t h e f ronta l projected a r e a s of large obstructions, such as those of t h e spokes and t h e hub. For t h e open wheel, t h e following a reas were arr ived at from t h e geometry:
where
b = t h e average a i r passage gap; b = 1.755 mm. a = a n effect ive coa ted t a p e thickness, taken t o be t h e sum of t h e nominal
uncoated t a p e thickness and twice t h e largest part icle screen size; a = 0.075 + 2(0.297), = 0.669 mm.
Aref = a reference flow a r e a equal t o t h e ent i re flow cross section at t h e rotor 2 midsection; Aref = 0.4369 m .
A4 was inferred t o b e 0.3792 m2.
Using Eqs. 5-1 through 5-3, w e calculated t h e t r u e Ap, p2 - p3. This pressure di f ference was then normalized as ApD /2puL and plotted as a function of t h e dimensionless parameter ReDh/$L. Here, bh represents a n effect ive hydraulic d iamete r of t h e collective a i r passages, u is t h e a i r velocity through t h e passage, p is t h e mean a i r dynamic viscosity, R e is t h e Reynolds number based on t h e hydraulic d iameter , and L is t h e matrix depth.
Case 2: Counterflowing Stream. The analyses here follow t h e same procedure outlined above, excep t fo r est imations of varied a r e a s for Ac, Ad, and A4 for counterflowing streams.
A , r e p senting t h e cross-sectional a r e a of t h e upstream ducting, was calcula ted t o be 0 j 8 5 m? Ac represents one-half of i t s value for t h e open-rotor case minus a n "effective" shadow a r e a depicting blockage of t h e f ront and back sealing surfaces. Since t h e a i r flow takes a path around these sealing surfaces, t h e shadow a r e a is smaller than t h e projected sealing surface area. Based on experiments with rotary h e a t exchangers with similar designs, Maclaine-cross and Ambrose (1980) recommend t h a t t h e shadow a r e a be taken as t h e sealing surface a r e a with i t s width reduced by 1.7 t imes i t s sealing lip, as indicated in Figure 5-3.
For t h e rotor being r a m i n e d , with a seal lip of 0.0254 m, t h e resulting Ac was cal- cula ted t o be 0.132 m . A4, a s before, was t h e exi t duct c oss sectional a r e a mlnus t h e projected a r e a s of t h e spokes and hub. y e r e , A4 = 0.149 mS. o n c e again, t h e calcula ted p2 - p3 was made dimensionless a s ApDh /2puL and plotted as a function of ReDh/4L for each counterf lowing stream.
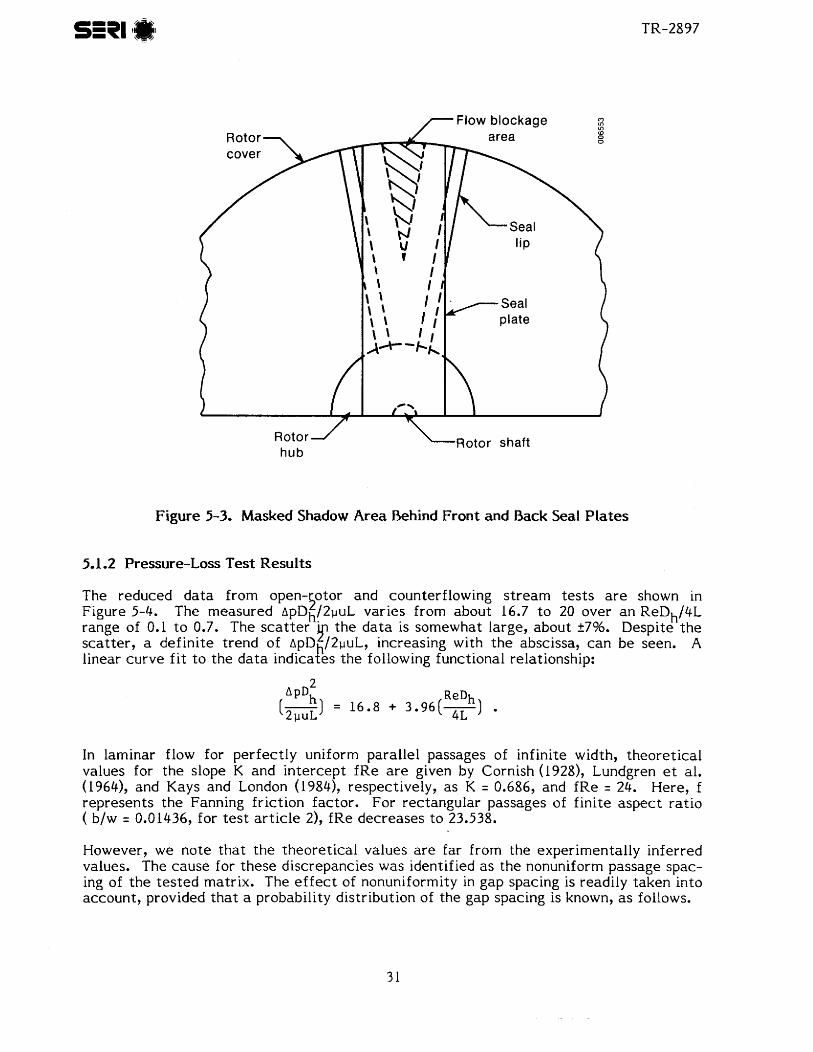
Flow blockage
Rotor hub
Figure 5-3. Masked Shadow Area Behind Front and Back Seal Plates
5.1.2 Pressure-Loss Test Results
The reduced d a t a f rom open- o tor and counterflowing s t r e a m t e s t s a r e shown in 5 Figure 5-4. The measured ApDh/2~uL var ies from about 16.7 t o 20 over a n ReDh/4L range of 0.1 to 0.7. The s c a t t e r t h e d a t a is somewhat large, about +7%. Despite t h e sca t t e r , a def in i te t r end of ApDh/ZVuL, increasing with t h e abscissa, c a n b e seen. A linear c u r v e f i t t o t h e d a t a indicates t h e following functional relationship:
In laminar flow fo r perfec t ly uniform paral lel passages of infini te width, theore t ica l values for t h e slope K and in tercept f R e a r e given by Cornish (1928), Lundgren et al. (1964), and Kays and London (1984), respectively, a s K = 0.686, and f R e = 24. Here , f represents t h e Fanning f r ic t ion factor. For rectangular passages of f in i te a spec t r a t io ( b/w = 0.01436, for t e s t a r t i c l e 2), f R e decreases t o 23.538.
However, w e n o t e t h a t t h e theore t ica l values a r e f a r f rom t h e experimental ly inferred values. The cause for t h e s e discrepancies was identified a s t h e nonuniform passage spac- ing of t h e t e s t e d matrix. The e f f e c t of nonuniformity in gap spacing is readily t aken in to account, provided t h a t a probability distribution of t h e gap spacing is known, as follows.
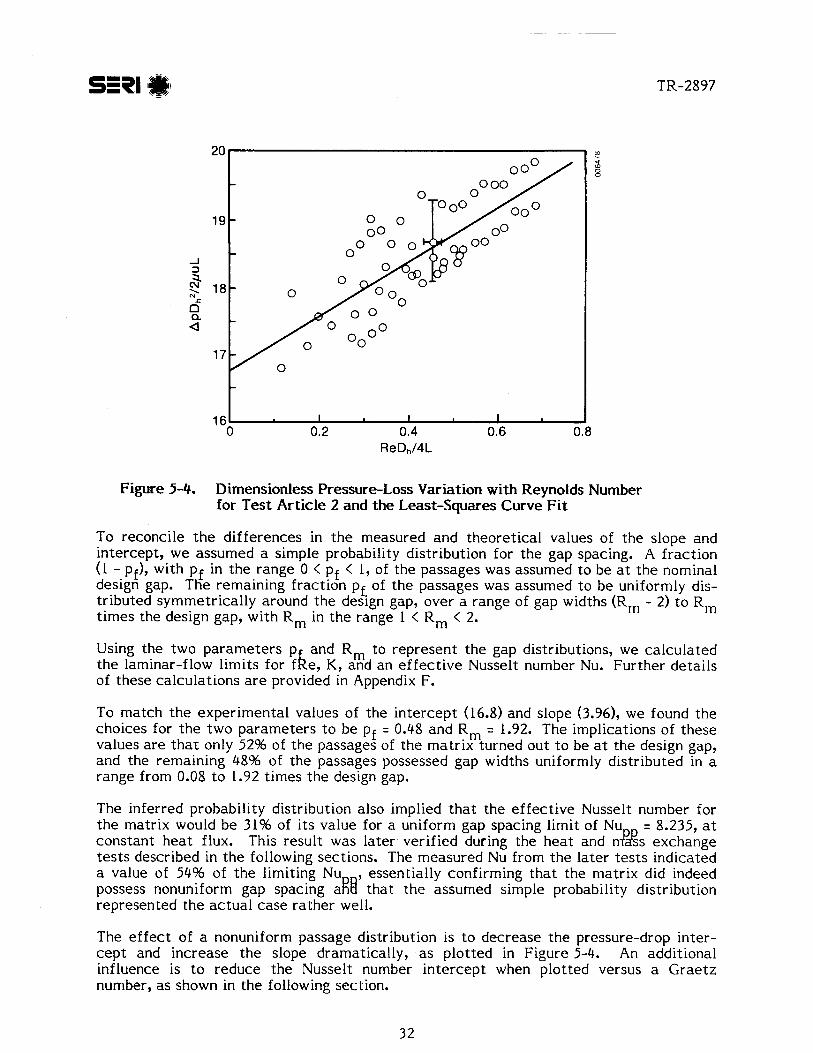
sin
Figure 5-4. Dimensionless Pressure-Loss Variation with Reynolds Number for Test Article 2 and the Least-Squares Curve Fit
T o reconcile t h e differences in t h e measured and theoretical values of t h e slope and intercept, w e assumed a simple probability distribution for t h e gap spacing. A f ract ion (1 - pf), with pf in t h e range 0 < pf < 1, of t h e passages was assumed t o be at t h e nominal design gap. The remaining fraction pf of t h e passages was assumed t o be uniformly dis- tr ibuted symmetrically around t h e design gap, over a range of gap widths (Rm - 2) t o Rm t imes the design gap, with Rm in t h e range 1 < R m < 2.
Using the two paramete rs p and Rm t o represent t h e gap distributions, we calcula ted t h e laminar-flow limits fo r f k e, K, and an e f f e c t i v e Nusselt number Nu. Fur ther details of these calculations a r e provided in Appendix F.
To match t h e experimental values of t h e in tercept (16.8) and slope (3.96), we found t h e choices for t h e two parameters t o be pf = 0.48 and Rm = 1.92. The implications of these values a r e t h a t only 52% of t h e passages of t h e matr ix turned out t o be at t h e design gap, and the remaining 48% of t h e passages possessed gap widths uniformly distributed in a range from 0.08 t o 1.92 t imes t h e design gap.
The inferred probability distribution also implied t h a t t h e e f fec t ive Nusselt number for t h e matrix would be 31% of i t s value for a uniform gap spacing limit of Nu = 8.235, at constant h e a t flux. This result was la ter verified during t h e hea t and $&s exchange t e s t s described in t h e following sections. The measured Nu from t h e la ter t e s t s indicated a value of 54% of t h e limiting Nu , essentially confirming t h a t the matrix did indeed possess nonuniform gap spacing aR8 tha t t h e assumed simple probability distribution represented t h e ac tua l c a s e ra the r well.
The e f f e c t of a nonuniform passage distribution is t o decrease t h e pressure-drop inter- c e p t and increase t h e slope dramatically, a s plotted in Figure 5-4. An additional influence is t o reduce the Nusselt number in tercept when plotted versus a Grae tz number, a s shown in t h e following section.
5.2 Heat- and Mass-Transfer Tests
A series of tests t o study heat and mass transfer was conducted over a wide range of process and regeneration inlet conditions and matrix rotational speeds. The da t a were gathered over 2 months of continuous testing. The heat- and mass-transfer da t a were analyzed using linear and nonlinear analogy theories (Maclaine-cross 1974; Banks 1985). For t he analysis, the tests were categorized into high-speed, low-speed, and medium- speed tests. The following sections describe each of these. In each section, the data processing and analysis method is described first. Experimental results, comparisons with theory, and discussions follow. A complete s e t of experimental d a t a is provided in Appendix B, and a description of t he measurement uncertainties in Appendix A. Relevant desiccant and matr ix properties for reducing t he t e s t da ta a r e summarized in Appendix D.
5.2.1 High-Speed Tests (C CZp >> I) IP'
As the wheel rotational speed becomes very high (i.e., C - m), the transfer effectiveness of the matrix rl approaches a n asymptotic limit tha t is governed by the heat- and mass- transfer r a t e s within t he matrix. The ac tua l capacit ies of the matrix for heat and mass transfer do not affect t h e effectiveness significantly. Thus, by processing the high- speed-test da t a alone, we a r e able t o arrive at the effect ive Nusselt and Lewis numbers for heat and mass exchange, respectively.
5.2.1.1 Data Analysis
To process t he high-speed-test data, we adopted t he following procedure.
a The effect ive fraction of silica gel in t he matrix was assumed t o be unity.
a The experimental da ta were sorted t o select experimental conditions when C > 4. is always g rea te r than C I , t h e selection ensured that the dirnens!$nless
:$z:i;~~s~eeds for both FI and F2 teansfer were almost independent of the capacity r a t e ratios.
a At high speed, since all t h e s ta tes within t he matrix lie along a straight line connecting the process and regeneration inlet s ta tes , a mean matrix s t a t e is defined with a temperature
and a humidity ra t io
The slope ai is defined as
and t he specific capacity ra t io yi is defined a s
they a r e calculated for i = I and 2 for t he matrix, assumed t o be in equilibrium with the mean a i r s t a t e defined by t, and wm.
Assuming t h a t both al and a a r e constants, t h e intersection point for t h e process con- dition is ca lcula ted by e x t e n $ ing lines of constant F i with thei r corresponding slope ai.
The process out le t condition as found f rom t h e experiment is cor rec ted for experi- mental e r ro rs by averaging t h e process ou t le t conditions ( t empera tu re and humidity) with those arrived at from regeneration ou t le t conditions, and imposing mass and energy balances for t h e wheel.
With t h e corrected process ou t le t condition, t h e effectiveness for t empera tu re and moisture t ransfer a r e calcula ted as
t p o - tPi 'It =
tpi - t r i
and
respectively.
The corresponding capaci ty r a t e ra t ios or dimensionless wave speeds C i for t h e process s t ream a r e calculated as
where
mdd = t h e initially es t imated amount of dry desiccant per period (kg) yi = t h e specific capaci ty ra t io
xeff = t h e f ract ion of dry desiccant experimentally determined as effect ive hp = t h e process dry a i r flow r a t e (kgls)
3600 , where N is t h e wheel ro ta t ion speed, in .r = t h e con tac t t i m e (s), = - revlhr. (2N)
Since C i values a r e finite, t h e measured F i efficiencies a r e incremented for infinite rotational speed a s
- k3 A'IF; - - 2 ' (5- 12)
C. 1
where k has been determined t o be approximately 0.09 [see, for example, Maclaine- cross ( 1 &4)].
a The corrections for f inite wheel speed for F i efficiencies a r e now converted t o the t empera tu re and moisture effectivenesses as
and
The cor rec ted t empera tu re and moisture effectivenesses a r e then converted t o their corresponding number of t ransfer units (NTU) (Kays and London 1964) as
( N T U ) ~ = 1/[L - 'It
( I + 2 E 2 ) l
SE?l
and
where E2 represents t h e mass unbalance ra t io between t he process and the regeneration s t ream, defined as
An effect ive Lewis number, representing the ra t io of overall resistance t o mass trans- fer to that for hea t transfer, is calculated a s
A mean overall Nusselt number is derived a s
Nu = (NTU)~ Re, Pr, Dh {=I 9
where Rem is the mean air Reynolds number,
Re, = Om Cm Dh
Prn 9
and Dh is t he hydraulic diameter of the passages (m).
Here, p, is t h e air density, C, is a i r velocity through t he passage, pm is air dynamic viscosity, and km is t h e air thermal conductivity.
The effect ive Lewis number can be expressed in t e rms of an efficiency of the desic- c an t particle-cum-substrate matrix es (Maclaine-cross 1974) as
where (3 represents the Schmidt-over-Prandtl-number ra t io for air.
Sh = t h e Sherwood number
d~ = t h e mean desiccant particle size (m)
2 ~d = t h e dry desiccant density (kg/m ) p~ t h e desiccant particle packing fac tor on the substrate DW t h e diffusivity of moisture in the desiccant (m2/s)
dW ( 1 = t h e isothermal r a t e of change of moisture in t he desiccant with re- spect t o the moisture content of t he air , evaluated at tm.
The efficiency es can be viewed a s t he ra t io of surface a r ea available for exchange t o t ha t if the particles were distributed a s uniform spheres of diameter d closely packed
P '
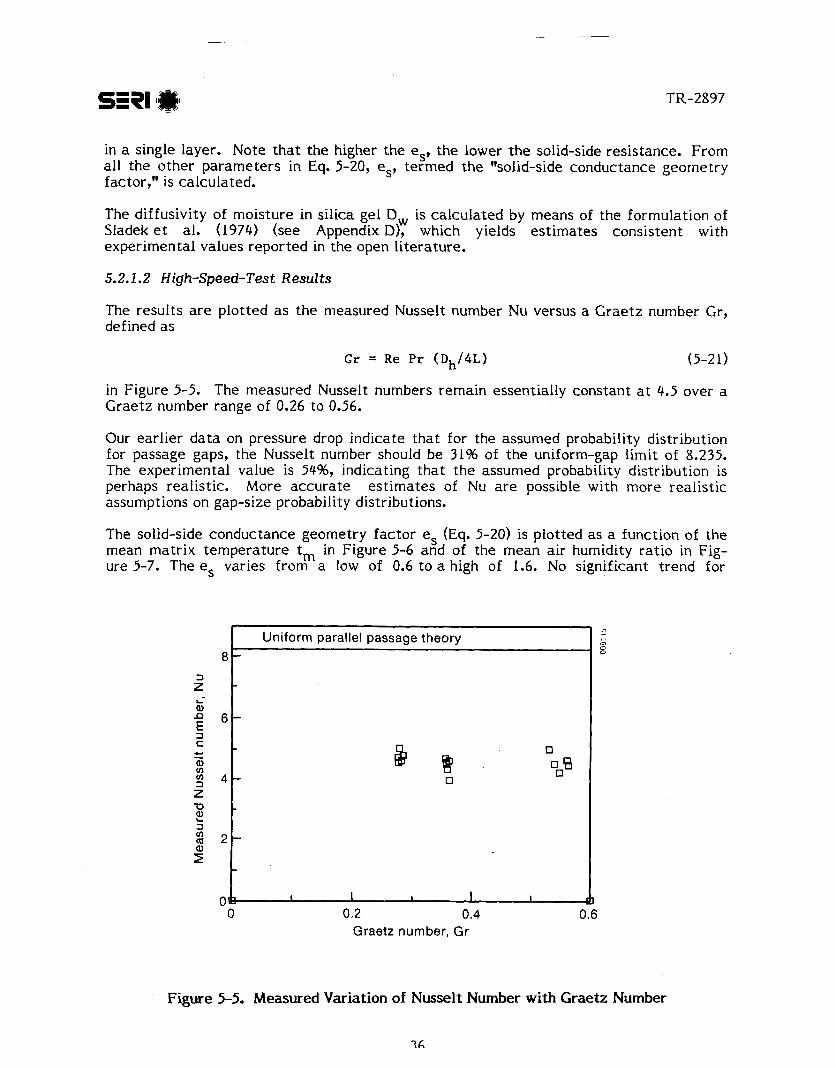
in a single layer. Note t h a t t h e higher t h e es, t h e lower t h e solid-side resistance. From al l t h e o ther pa ramete rs in Eq. 5-20, es, te rmed t h e "solid-side conductance geometry factor," is calculated.
The diffusivity of moisture in silica gel Dw is ca lcula ted by means of t h e formulation of Sladek et al. (1974) (see Appendix Dl, which yields es t imates consistent with experimental values repor ted in t h e open l i terature.
5.2.1.2 High-Speed-Test Results
The results a r e plotted as t h e measured Nusselt number Nu versus a G r a e t z number Gr, defined as
in Figure 5-5. The measured Nusselt numbers remain essentially constant at 4.5 over a Grae tz number range of 0.26 t o 0.56.
Our earl ier d a t a on pressure drop indicate t h a t for the assumed probability distribution for passage gaps, t h e Nusselt number should be 31% of t h e uniform-gap limit of 8.235. The experimental value is 5496, indicating t h a t t h e assumed probability distribution is perhaps realistic. More accura te es t imates of Nu a r e possible with more realist ic assumptions on gap-size probability distributions.
The solid-side conductance geometry f a c t o r es (Eq. 5-20) is plotted a s a function of t h e mean matr ix t empera tu re tm in Figure 5-6 and of t h e mean a i r humidity ra t io in Fig- ure 5-7. The es varies from a low of 0.6 t o a high of 1.6. No significant t rend for
0.2 0.4 0.6 Graetz number, Gr
8
Figure 5-5. Measured Variation of Nusselt Number with Graetz Number
? C,
Uniform parallel passage theory -
m 7 F m
8
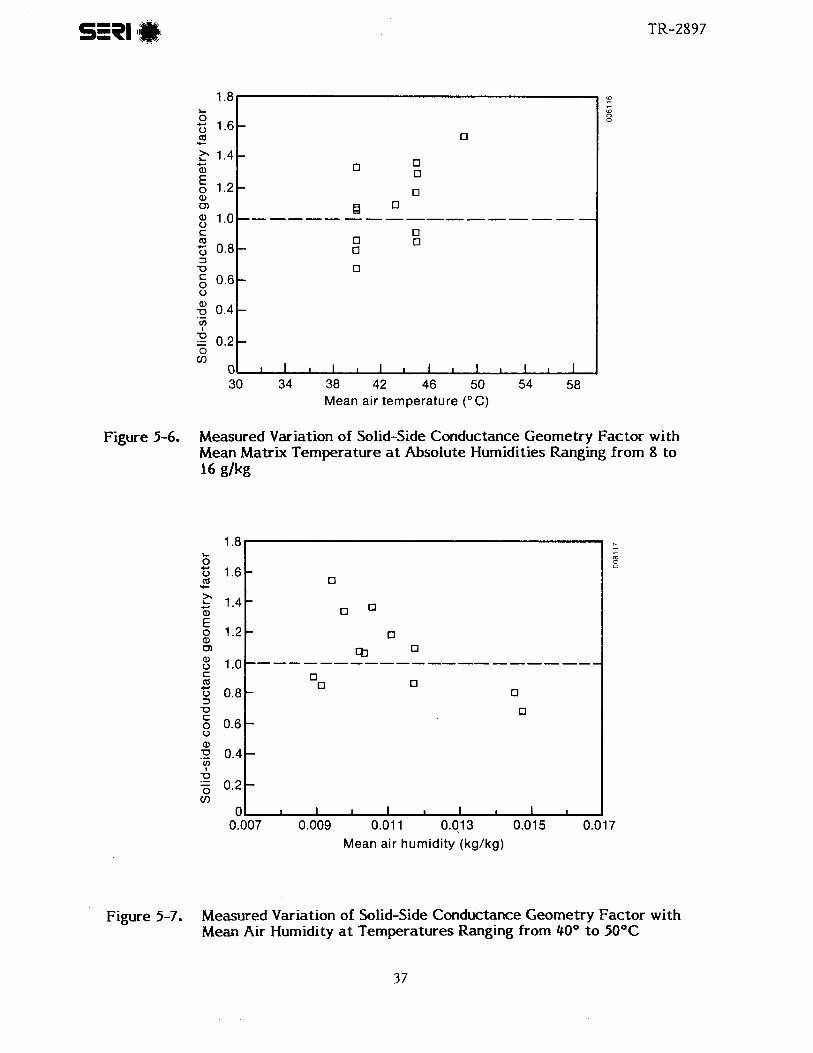
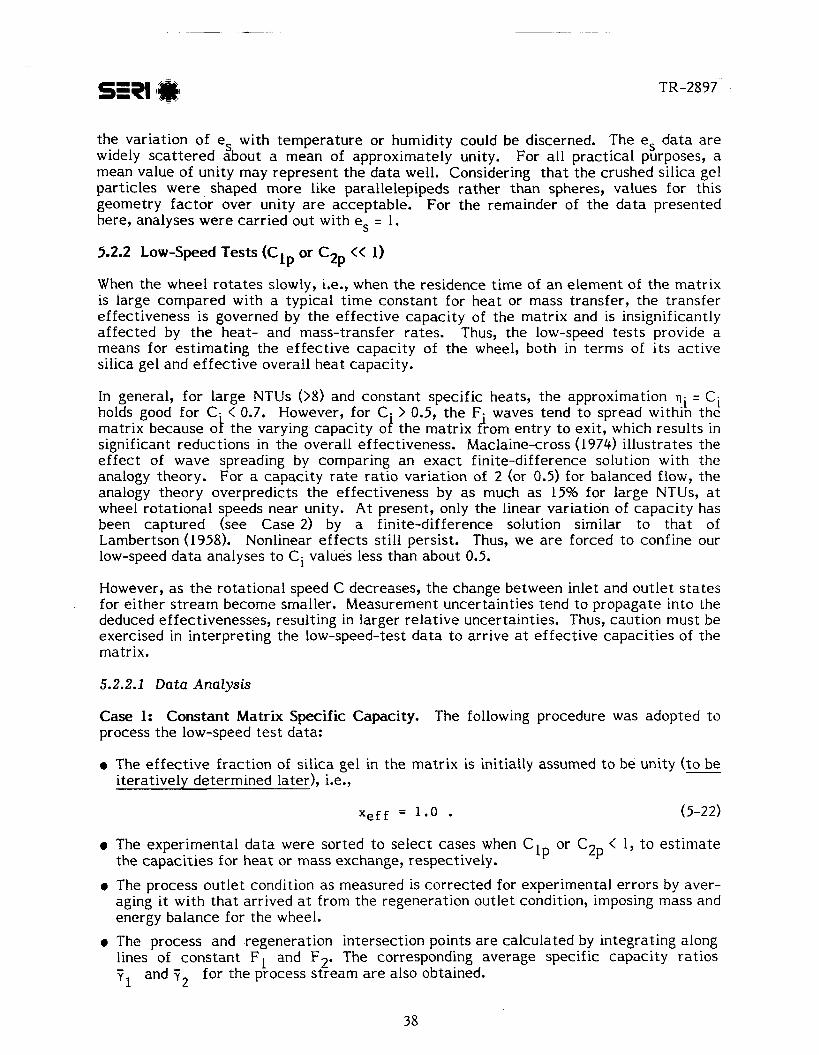
the variation of es with temperature or humidity could be discerned. The es da ta a r e widely scat tered about a mean of approximately unity. For all practical purposes, a mean value of unity may represent the da ta well. Considering tha t the crushed silica gel particles were shaped more like parallelepipeds rather than spheres, values for this geometry fac tor over unity a r e acceptable. For the remainder of the da ta presented here, analyses were carried out with es = 1.
5.2.2 Low-Speed Tests (Clp or CZp << I)
When the wheel rotates slowly, i.e., when the residence t ime of an element of t he matrix is large compared with a typical t ime constant for heat or mass transfer, the transfer effectiveness is governed by the effect ive capacity of the matrix and is insignificantly affected by the heat- and mass-transfer rates. Thus, the low-speed tes ts provide a means for estimating the effective capacity of the wheel, both in terms of i ts act ive silica gel and effect ive overall heat capacity.
In general, for large NTUs (>8) and constant specific heats, t he approximation n i = Ci holds good for C- < 0.7. However, for C - > 0.5, t he F. waves tend t o spread within the matrix because ok the varying capacity 01 the matrix flrom entry t o exit, which results in significant reductions in the overall effectiveness. Maclaine-cross (1974) illustrates the effect of wave spreading by comparing an exac t finite-difference solution with the analogy theory. For a capacity ra te ratio variation of 2 (or 0.5) for balanced flow, the analogy theory overpredicts the effectiveness by a s much a s 15% for large NTUs, at wheel rotational speeds near unity. At present, only the linear variation of capacity has been captured (see Case 2) by a finite-difference solution similar t o tha t of Lambertson (1958). Nonlinear effects still persist. Thus, we a r e forced t o confine our low-speed da t a analyses t o C i values less than about 0.5.
However, as t h e rotational speed C decreases, the change between inlet and out le t s ta tes for either s t ream become smaller. Measurement uncertainties tend t o propagate into the deduced effectivenesses, resulting in larger relative uncertainties. Thus, caution must be exercised in interpreting the low-speed-test da ta t o arrive at effect ive capacities of the matrix.
5.2.2.1 Data Analysis
Case I: Constant Matrix Specific Capacity. The following procedure was adopted t o process the low-speed tes t data:
The effect ive fraction of silica gel in the matrix is initially assumed t o be unity ( to be iteratively determined later), i.e.,
The experimental data were sorted to select cases when C l p or CZp < 1, t o es t imate the capacities for heat or mass exchange, respectively.
The process outlet condition a s measured is corrected for experimental errors by aver- aging it with tha t arrived at from the regeneration outlet condition, imposing mass and energy balance for the wheel.
The process and regeneration intersection points a r e calculated by integrating along lines of constant F l and F2. The corresponding average specific capacity ratios - and 7 for the process s t ream a r e also obtained. Y1 2
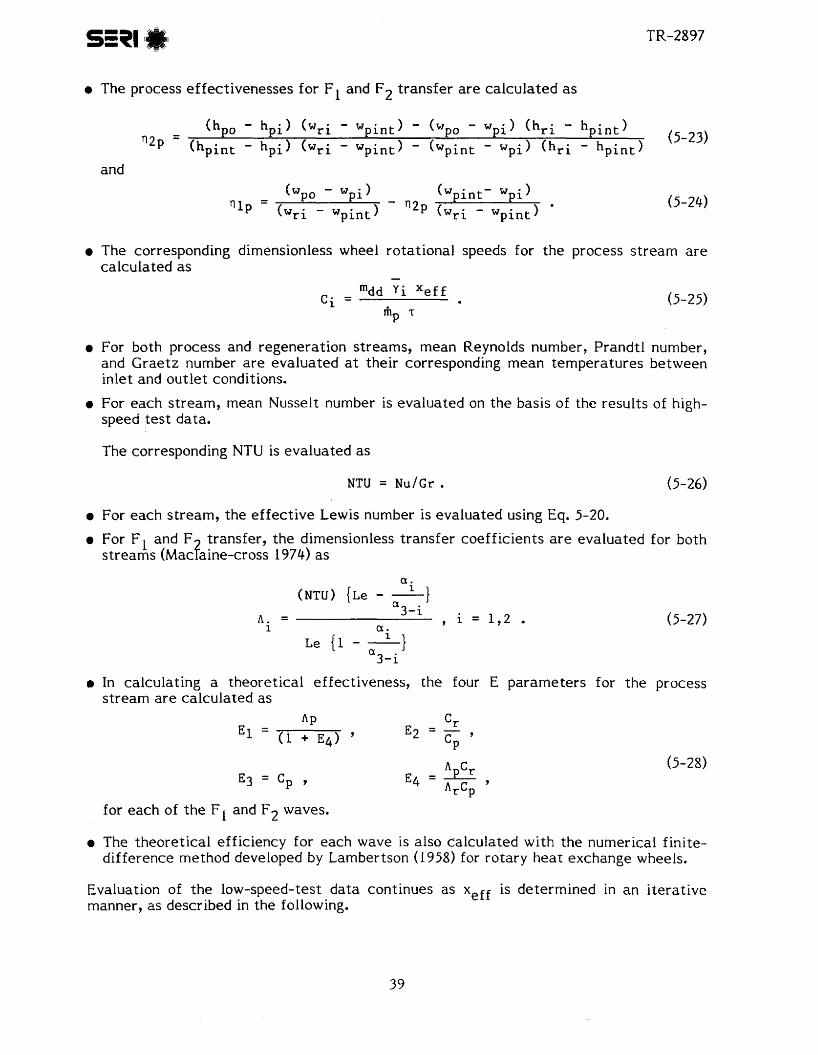
The process effectivenesses for FI and F2 t ransfer a r e calcula ted as
and
The corresponding dimensionless wheel rotational speeds for t h e process s t ream a r e calculated as -
c ; = mdd Yi Xeff . (5-25)
fip T
a For both process and regeneration streams, mean Reynolds number, Prandtl number, and Grae tz number a r e evaluated at their corresponding mean temperatures between inlet and out le t conditions.
For each s t ream, mean Nusselt number is evaluated on the basis of the results of high- speed test data.
The corresponding NTU is evaluated as
NTU = N U / G ~ . (5-26)
For each s t ream, the effect ive Lewis number is evaluated using Eq. 5-20.
For Fl and F transfer, t he dimensionless transfer coefficients a r e evaluated for both s t reams (~ac f a ine - c ro s s 1974) a s
In calculating a theoretical effectiveness, t he four E parameters for the process s t ream a r e calculated a s
ApCr E 3 = Cp 9 E q = - , Arcp
for each of t he FI and F2 waves.
The theoretical efficiency for each wave is also calculated with the numerical finite- d i f ference method developed by Lambertson (1958) for rotary heat exchange wheels.
Evaluation of t h e low-speed-test da ta continues a s xeff is determined in an i tera t ive manner, as described in the following.
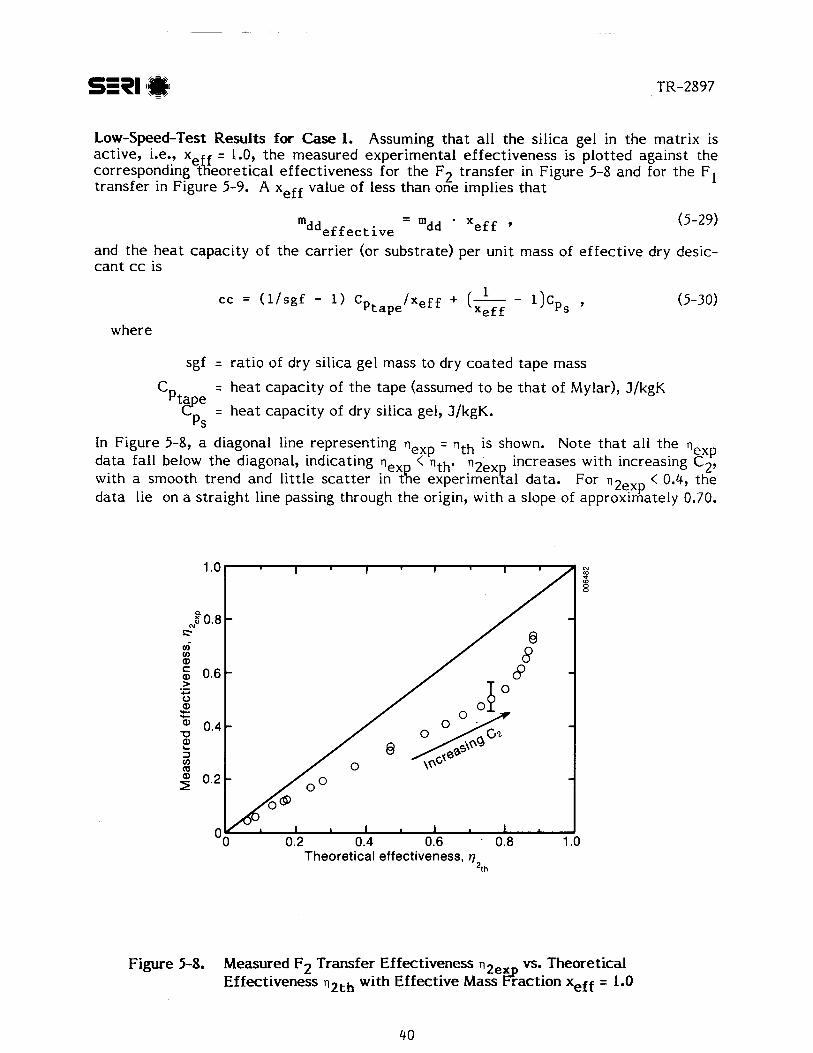
Low-Speed-Test Results fo r Case I. Assuming t h a t a l l t h e silica gel in t h e matr ix is ac t ive , i.e., xe = 1.0, t h e measured experimental ef fect iveness is plotted against t h e corresponding t 6 eore t i ca l ef fect iveness for t h e F2 t ransfer in Figure 5-8 and for t h e F l t ransfer in Figure 5-9. A xeff value of less than one ~ m p l i e s t h a t
- mddeffect ive - '"dd ' Xeff
and t h e h e a t capaci ty of t h e ca r r i e r (or substrate) per unit mass of e f fec t ive dry desic- c a n t cc is
where
sgf = ra t io of dry silica gel mass t o dry coa ted t a p e mass
C = hea t capaci ty of t h e t a p e (assumed t o be t h a t of Mylar), J/kgK P tap2
= h e a t capaci ty of dry silica gel, J/kgK. ps
In Figure 5-8, a diagonal line representing n = n th is shown. Note t h a t al l t h e exp d a t a fal l below t h e diagonal, indicating ne, < n t h nzexp exp increases with increasing C2,
with a smooth trend and l i t t le s c a t t e r in t{e experimental data. For n2exp < 0.4, t h e d a t a l ie on a straight line passing through t h e origin, with a slope of approx~mate ly 0.70.
Theoretical effectiveness, r) 2th
Figure 5-8. Measured F2 Transfer Effectiveness Q ~ ~ , VS. Theoretical Effectiveness n2th with Effect ive Mass 8 ract ion xeff = 1.0
4 0
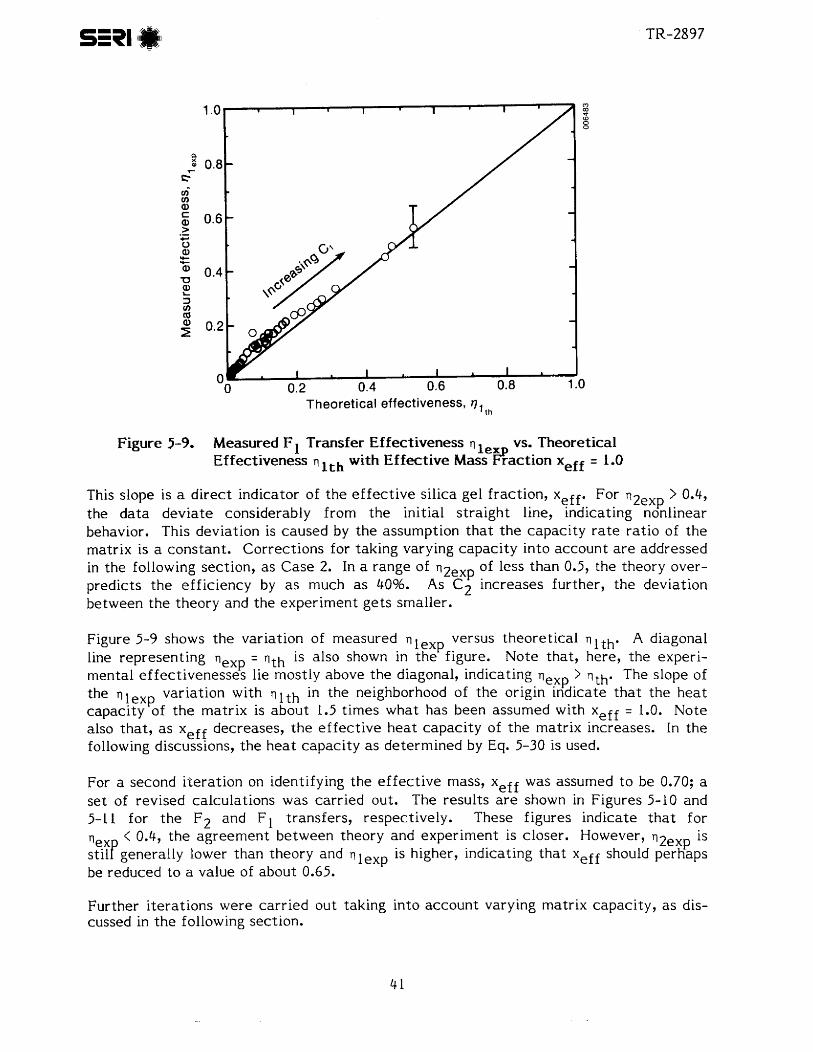
Theoretical effectiveness, q l t h
Figure 5-9. Measured F I Transfer Effectiveness lex VS. Theoretical Effectiveness q lth with Effective Mass g a c t i o n xeff = 1.0
This slope is a d i rec t indicator of t h e e f f e c t i v e silica gel f rac t ion , xCff.. For qzexp > 0.4, t h e d a t a dev ia te considerably f rom t h e initial s t ra ight line, ~ n d i c a t l n g nonlinear behavior. This deviat ion is caused by t h e assumption t h a t t h e capaci ty r a t e r a t io of t h e matr ix is a constant . Correc t ions for taking varying capac i ty in to account a r e addressed in t h e following section, as C a s e 2. In a range of nzexp of less than 0.5, t h e theory over- predicts t h e ef f ic iency by as much as 40%. As C2 increases fur ther , t h e deviat ion between t h e theory and t h e exper iment g e t s smaller.
Figure 5-9 shows t h e variat ion of measured T-I versus theore t ica l q A diagonal line representing qexp =*oth is also shown in t h e figure. No te tha t , here, t h e experi- mental e f fec t ivenesses lle mostly above t h e diagonal, indicating neFp > qth. The slope of t h e n lexp variat ion with n l t h in t h e neighborhood of t h e origin lndicate t h a t t h e h e a t capaci ty of t h e ma t r ix is abou t 1.5 t imes wha t has been assumed with xeff = 1.0. Note also tha t , a s xeff decreases, t h e e f fec t ive h e a t capac i ty of t h e matr ix increases. In t h e following discussions, t h e h e a t capaci ty a s de termined by Eq. 5-30 is used.
For a second i te ra t ion on identifying t h e e f fec t ive mass, xeff was assumed t o be 0.70; a s e t of revised calculat ions was carr ied out. The results a r e shown in Figures 5-10 and 5-1 1 for t h e F2 and Fl t ransfers , respectively. These f igures indica te t h a t for nexP < 0.4, t h e ag reement be tween theory and exper iment is closer. However, nzeXp is s t i l general ly lower than theory and 111 is higher, indicating t h a t xeff should perhaps be reduced t o a value of about 0.65.
e x p
Fur ther i te ra t ions w e r e ca r r i ed out taking in to account varying matr ix capaci ty , a s dis- cussed in t h e following section.
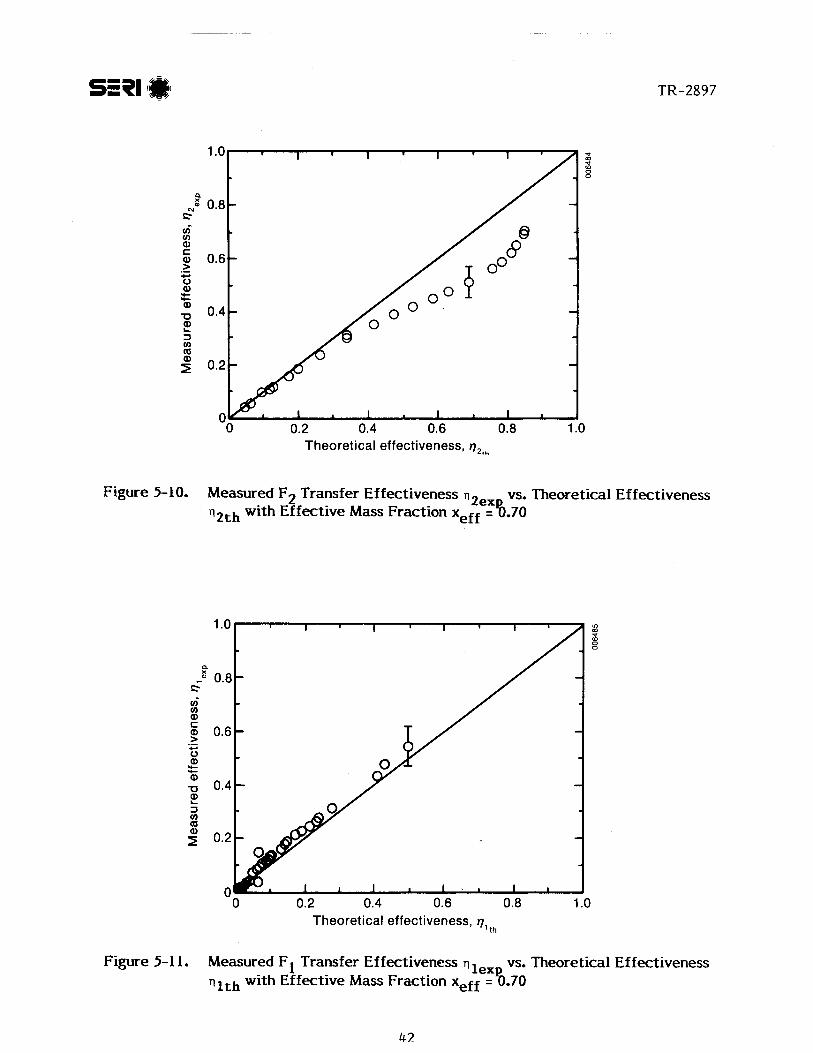
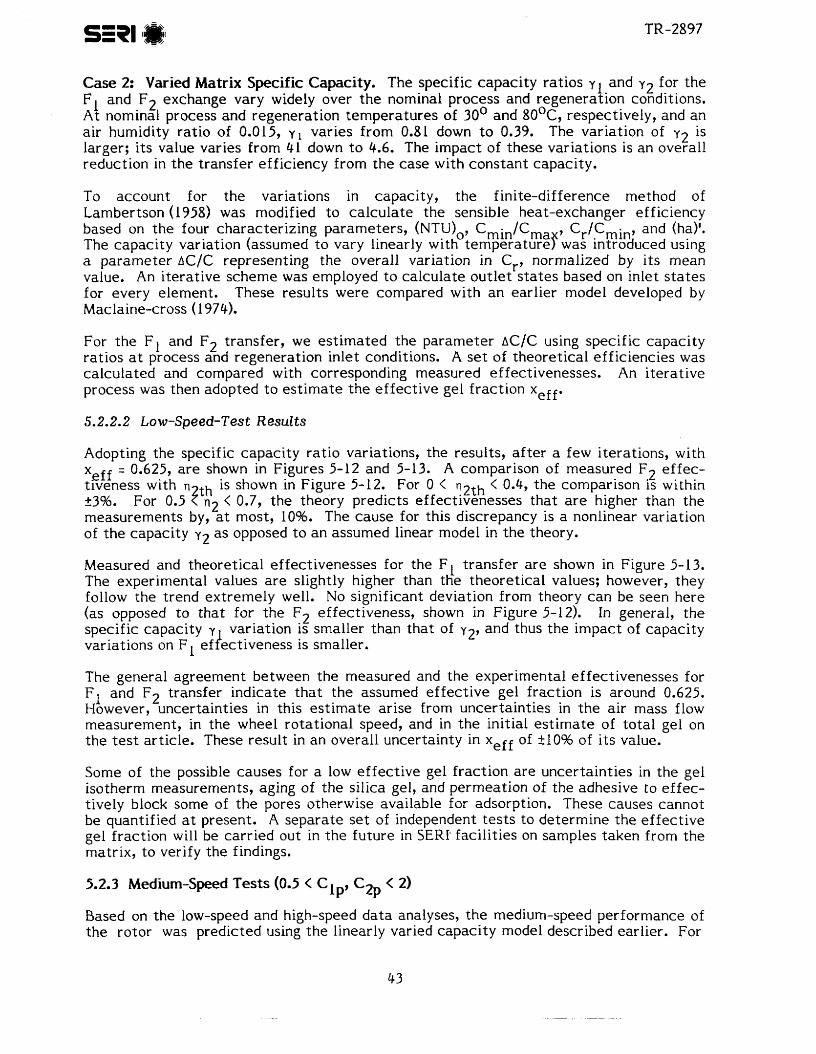
Case 2: Varied Matrix Specific Capacity. The specific capacity ratios y l and y2 for t he F l and F2 exchange vary widely over t he nominal process and regeneration conditions. At nominal process and regeneration temperatures of 30° and 80°c, respectively, and an air humidity ratio of 0.015, y , varies from 0.81 down t o 0.39. The variation of y2 is larger; its value varies from 41 down t o 4.6. The impact of these variations is an overall reduction in the transfer efficiency from the case with constant capacity.
To account for the variations in capacity, the finite-difference method of Lambertson (1958) was modified t o calculate the sensible heat-exchanger efficiency based on the four characterizing parameters, (NTU),, Cmin/Cma 9 Cr/Cmin, and (ha)'. The capacity variation (assumed t o vary linearly with temperaturef was introduced using a parameter AC/C representing the overall variation in Cr, normalized by its mean value. An i terative scheme was employed t o calculate outlet s ta tes based on inlet s ta tes for every element. These results were compared with an earlier model developed by Maclaine-cross (1 974).
For t he F1 and F2 transfer, we estimated the parameter AC/C using specific capacity ratios at process and regeneration inlet conditions. A se t of theoretical efficiencies was calculated and compared with corresponding measured effectivenesses. An iterative process was then adopted t o es t imate t he effective gel fraction xeff.
5.2.2.2 Low-Speed-Test Results
Adopting the specific capacity ratio variations, the results, a f te r a few iterations, with xeff = 0.625, a r e shown in Figures 5-12 and 5-13. A comparison of measured F2 effec- tiveness with rl is shown in Figure 5-12. For 0 < vzth < 0.4, the comparison is within 23%. For 0.5 Ztk2 < 0.7, t h e thedry predicts effectivenesses tha t a r e higher than the measurements by, at most, 10%. The cause for this discrepancy is a nonlinear variation of t he capacity y2 as opposed t o an assumed linear model in the theory.
Measured and theoretical effectivenesses for the FI transfer a r e shown in Figure 5-13. The experimental values a r e slightly higher than the theoretical values; however, they follow the trend extremely well. No significant deviation from theory can be seen here (as opposed t o that for the F2 effectiveness, shown in Figure 5-12). In general, the specific capacity y variation is smaller than that of y2, and thus the impact of capacity variations on FI ef ! ectiveness is smaller.
The general agreement between the measured and the experimental effectivenesses for F1 and F2 transfer indicate tha t the assumed effective gel fraction is around 0.625. However, uncertainties in this es t imate arise from uncertainties in t he air mass flow measurement, in the wheel rotational speed, and in t he initial es t imate of total gel on the t e s t article. These result in an overall uncertainty in xeff of t10% of i ts value.
Some of the possible causes for a low effective gel fraction a r e uncertainties in the gel isotherm measurements, aging of the silica gel, and permeation of the adhesive t o effec- tively block some of t he pores otherwise available for adsorption. These causes cannot be quantified at present. A separate se t of independent tes ts to determine the effective gel fraction will be carried out in the future in SERF facilities on samples taken from the matrix, t o verify the findings.
5.2.3 Medium-Speed Tests (0.5 < C CZp < 2) 1 P'
Based on the low-speed and high-speed da ta analyses, t he medium-speed performance of the rotor was predicted using the linearly varied capacity model described earlier. For
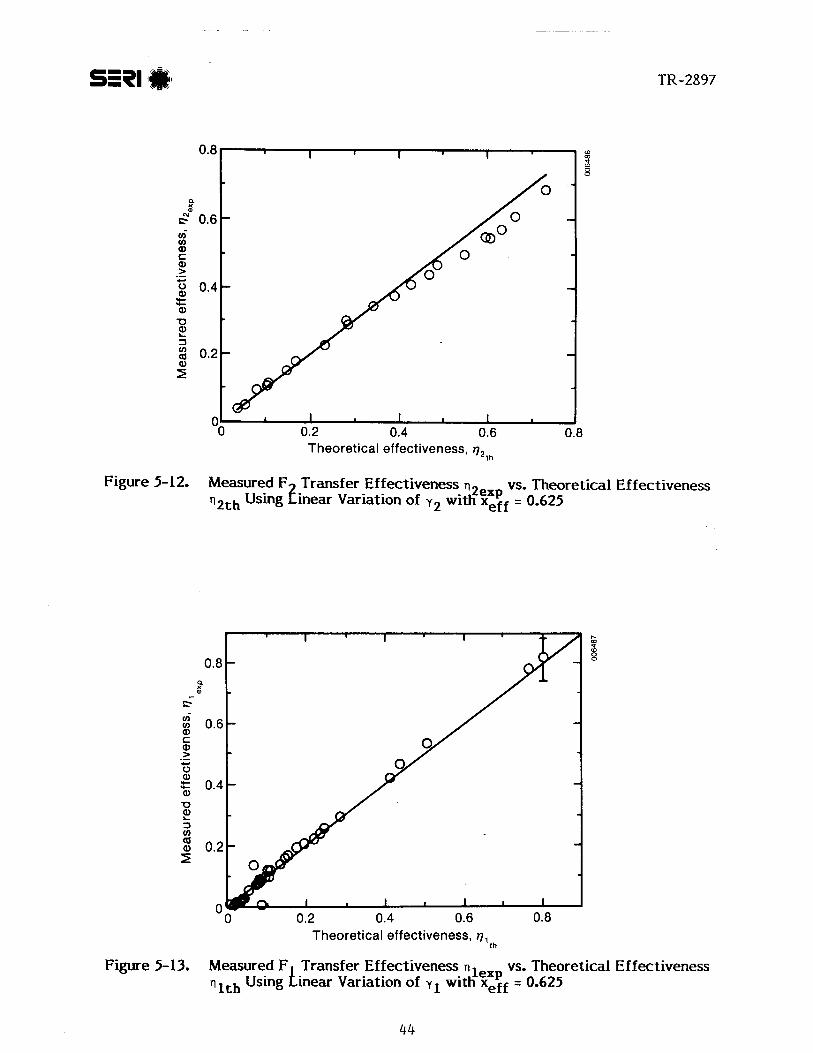
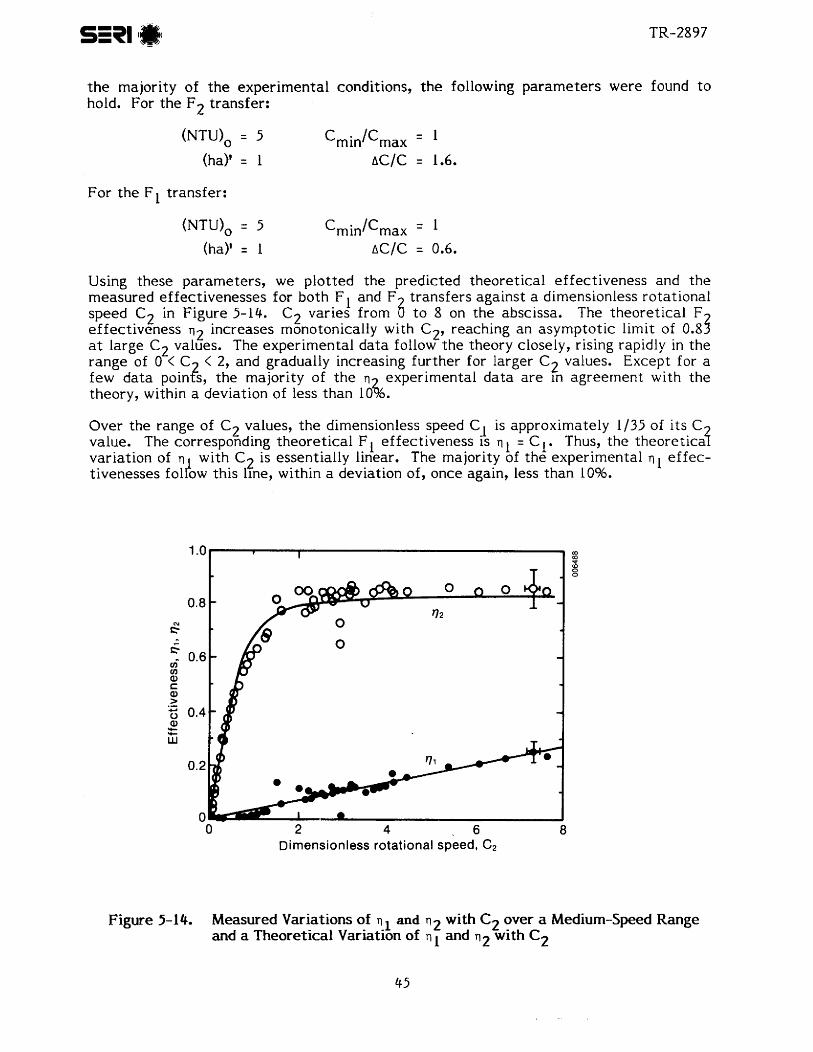
t h e majority of t h e experimental conditions, t h e following parameters were found t o hold. For t he F2 transfer:
(NTU), 5 Cmin/Cmax = I (ha)' = 1 aC/C 1.6.
For t he F l transfer:
(NTU), = 5 Cmin/Cmax = (ha)' = 1 aC/C = 0.6.
Using these parameters, we plotted the predicted theoretical effectiveness and t he measured effectivenesses for both F and F transfers against a dimensionless rotational speed C2 in Figure 5-14. C2 varies from 6 t o 8 on the abscissa. The theoretical F effectiveness TQ increases monotonically with C2, reaching an asymptotic limit of 0.8 5 at large C2 values. The experimental da ta follow t h e theory closely, rising rapidly in the range of 0 < C2 < 2, and gradually increasing further for larger C2 values. Except for a few da ta points, t he majority of t he r~ experimental da ta a r e In agreement with the theory, within a deviation of less than 10%.
Over the range of C2 values, t h e dimensionless speed Cm1 is approximately 1/35 of i ts C value. The corresponding theoretical F l effectiveness is q1 = C1. Thus, the theoretics? variation of v I with Cq is essentially linear. The majority of t he experimental rl effec- tivenesses follow this line, within a deviation of, once again, less than 10%.
0 2 4 6 8 Dimensionless rotational spked. C2
Figure 5-14. Measured Variations of TI and with C2 over a Medium-Speed Range and a Theoretical Variation of r~ and n2 with C2
43
The optimum rotational speed for a dehumidifier using si l ica gel, for balanced flow, with
'eff = 1, was found t o be near C2 = 2 (Jurinak 1982). This speed is close t o C when t h e
ra t io reaches a maximum at rotational speeds g rea te r than 2. a ra t lo q 2 / n l reaches a maximum. For t h e present t e s t ar t ic le , with xeff = .625, this
There a r e more experimental d a t a points in t h e speed range 1.5 < C < 4 than in t h e other C ranges. The s c a t t e r in measured n 2 in this range is also hig er . These d a t a 2 b were ta e n t o identify t h e e f f e c t s of varied a l r flow, process and regeneration temper- a tures , and absolute humidity levels. (See Appendix B on exper imental data.) However, t h e s c a t t e r appears in t h e form of subtle but discernible t rends in t h e variat ion of ef fec- tiveness with C 2 or C l . W e made no a t t e m p t t o analyze these e f f e c t s in more deta i l o ther than using a n overall ef fect iveness variation with speed. A deta i led numerical model such a s MOSHMX (Maclaine-cross 1974) can perhaps be used t o discern individual trends.
6.0 CONCLUDING REMARKS AND RECOMMENDATIONS
An independent ser ies of leak tests, pressure-loss tests, and heat-and mass-transfer experiments on t h e rotary dehumidifiers tes ted led t o the following findings.
Leak tes t s indicated, for seals made of 7Cpm-thick, double-layer Mylar tape, t h a t an "effective" product of t he discharge coefficient t imes leakage a r e a t e r unit length of seal was 1.88 x rn for the circumferential seals and 9.35 x 10- m for the radial seals. Under typical operating conditions, these represent 2% and 3% a i r leaks per seal out of and across the two air streams. Since each percent leak translates into a percent reduction in overall dehumidifier effectiveness, i t is desirable t o develop improved seal designs t o limit the dischar e coefficient t imes leakage a r e a product per unit length of seal t o less than 0.5 x 10q m, without an undue increase in t h e rotor drive power. For the majority of applications, this leakage limit will t ransla te into less than a 1% reduction in dehumidifier t ransfer effectiveness as a result of air leakage.
The pressure-loss t es t s indicated large differences in both the intercept and t he slope between t he measurements and theoretical parallel-passage limits. Nonuniform pas- sage spacing was identified a s the cause of t h e discrepancy. Simple assumptions on t he probability distribution of the gap size reconciled these differences. The assumed distribution implied a Nusselt number intercept, which was later verified from the heat- and mass-transfer tes ts within the experimental uncertainty range. The nonuniform gap spacing resulted in a 46% reduction in the overall NTU from the design value of 10. I t is therefore cri t icai for industry t o obtain a desiccantlgeometry matr ix and manufacturing technique tha t compromises the uniformity of t h e air passages a s l i t t le as possible t o obtain t he best dehumidifier performance. To limit the overall NTU reduction t o less than 5% of a design value, t h e variation in air-passage-gap width should be limited t o less than ?lo% of t he design gap.
The heat- and mass-transfer test da t a were categorized according t o high-, medium-, and low-speed t e s t s and were analyzed by means of a nonlinear analogy theory. For t h e silica-gel dehumidifier, with experimentally inferred overall NTU of over 6 and effect ive Lewis number of less than 2, t h e analogy method was found entirely satisfactory for da t a analyses. The specific a r e a of concern was found t o be t he matrix capaci ty r a t e ra t io variations. The following paragraphs address further details.
The high-speed-test results allowed us t o infer "effective" heat- and mass-transfer ra tes and an overall NTU for the exchange processes. The Nusselt number was found t o be 4.5, approximately 54% of i t s theoretical uniform passage limit. This value is consistent with t h e pressure-loss results referred t o earlier. From the mass-transfer effectiveness, a n "effective" Lewis number for t he matrix was found t o be 1.17. Should the resistance t o mass transfer on the solid side be negligible, a lower limit on t he effect ive Lewis number of 0.846 is possible. The inferred "effective" Lewis number thus implies tha t t he solid side contributes about 38% t o the overall mass- transfer resistance. Inference of the Lewis number enabled us t o calculate a "solid- side conductance geometry factor." The solid-side resistance to mass transfer is inversely proportional t o this conductance geometry factor, the desiccant density, i t s moisture diffusivity, and i ts isothermal r a t e of change of moisture content with respect t o a i r humidity, and i t is directly proportional t o the desiccant particle size. The experimentally inferred solid-side conductance geometry fac to r was found t o be near unity, and no significant variation was indicated with the matrix temperature or moisture content. Provided t ha t a l l other desiccant properties a r e known, the packing factor on a substra te t ape and t he conductance geometry factor permit a n engineering
evaluation t o be made of t h e solid-side resistance t o e s t i m a t e t h e design and performance of a crushed silica gel mat r ix such as those used for these t e s t art icles.
The low-speed-test d a t a corre la ted well with t h e analogy theory; at medium speeds, however, significant deviation from t h e theory was observed. A nonlinear analogy method, incorporating linear variation of t h e matrix capacity, was used t o analyze t h e data. From t h e combined potential t ransfer effectiveness variations with t h e wheel ro ta t ional speed, a n e f fec t ive silica gel fraction was inferred t o be 62.5% with a n un- ce r ta in ty of ? lo% of i t s value. (See Appendix I on s t a t i c capaci ty determination.) Causes f o r a low e f fec t ive fraction a r e surmised t o be adhesive penetration and reduc- tion in gel capacity with age, and they will be evaluated by an independent investi- gation of this result on samples of t h e coa ted t ape from t h e matrix. The implication of t h e reduced e f fec t ive gel f ract ion is t h a t t h e design capaci ty of this part icular dehumidifier must be derated by 38%. However, since t h e reasons for t h e reduced gel f ract ion a r e yet t o be identified, i t is difficult at present t o recommend means t o improve this e f fec t ive fraction. With fur ther research, a t a rge t value of 90% for t h e e f f e c t i v e gel fraction for advanced dehumidifier designs appears t o be achievable.
Using t h e low-speed and high-speed-test results, we predicted t h e medium-speed per- formance with the nonlinear analogy theory. The experimental effectivenesses agree with t h e theoretical model t o within less than +lo%. The linear capaci ty variation used in t h e current model is, however, unsatisfactory. With improvements on t h e base- line model using a nonlinear variation, agreements t o within less than 5% a r e perhaps possible. The analytical method available t o character ize and predict dehumidifier performance provides a valuable tool in evaluating overall solar cooling system options.
Other accomplishments included a n initial a t t e m p t by industry t o fabr ica te a parallel- passage rotor, using double-sided, coa ted plastic t ape with silica gel, of realist ic rotor dimensions. Early a t t e m p t s t o wind t h e wheel were, however, unsuccessful, resulting in floppy t a p e segments and widely varied a i r gaps. The resulting wheel, labeled t es t a r t i c le I , was, however, tes ted over a range of conditions typical t o solar cooling. The results indicated tha t t h e rotor did function as a dehumidifier, but a n adequate basis for a comparison of experiments and existing theory could not be developed.
An a t t e m p t t o rewind t h e rotor a f t e r t h e causes of nonuniformity were found and cor rec ted resulted in considerably improved gap spacings. During t h e course of t h e winding, t h e causes for t h e nonuniformity arising from inadequate radial st iffness were identified a s t h e wide variation in gel part icle sizes, t h e large s ize of t h e part icles in relat ion t o t h e spacer width, and insufficient winding tension. The rewound wheel, labeled t e s t ar t ic le 2, was tes ted over a wide range of operating conditions."
Based on t h e findings of this study, t h e following research activit ies a r e recommended for resolving open issues.
An independent confirmation of t h e effect ive gel - f ract ion must be pursued, using samples from t h e matrix.
Nonuniform passages cause a significant reduction in t h e overall t ransfer effectiveness and a r e important factors in t h e fabrication of practical dehumidifiers. The details of
"During t h e course of these tes ts , a third t e s t ar t ic le was fabricated using a smaller, more uniform microbead silica gel with excellent uniformity in gap spacing. Tests of this t e s t a r t i c le a r e under way and a r e described in a forthcoming report (SERIITR-252-2983).
48
the present approach t o ensuring the uniformity of air gaps must be reviewed for other viable geometries.
a The solid-side conductance geometry factor for formulating an "effective" solid-side mass-transfer coefficient indicates tha t the solid-side resistance can be lowered by using smaller desiccant particles. An additional benefit here is tha t this also ensures more uniform passages. However, the effect of a reduction in the particle size on the effective gel fraction is uncertain and requires additional study.
A suitable means must be found for attaching amorphous desiccants to substrates.
a More creat ive methods for combining polymeric desiccant films or a bet ter extruded desiccant-cum-substrate cornbinat ion could provide solutions to many of these problems.
Contamination of desiccants caused by airborne pollutants and the associated reduc- tion in dehumidifier capacity must be studied.
The approximate analogy theory used here is not an exact solution of the model partial differential equations. A high-speed finite-difference solution based on an algorithm such a s MOSHMX (Maclaine-cross 1974) would eliminate the errors associated with t he approximations of these analyses.
7.0 REFERENCES
Ambrose, C. W., I. L. Maclaine-cross, and E. B. Robson, 1983, The Use of Rotary Regen- e ra t ive Hea t Exchangers f o r t h e Conservation of Energy in Buildings, Final Report Project 109, Canberra, Australia: National Energy Research Development and Demon- s t ra t ion Commit tee , Australian Government.
Banks, P. J., Feb. 1985, "Prediction of Hea t and Mass Regenerator Performance Using Nonlinear Analogy Method: P a r t l-Basis," and "Prediction of Hea t and Mass Regen- e r a t o r Performance Using Nonlinear Analogy Method: P a r t 2-Comparison of Methods," Trans. ASME, J. Heat Transfer, Vol. 107, pp. 222-238.
Banks, P. J., 1972, "Coupled Equilibrium Hea t and Single Adsorbate Transfer in Fluid Flow through a Porous Medium-I, Character is t ic Potentials and Specific Capaci ty Ratios," Chem. Engng. Sci., Vol. 27, pp. 1143-1 155.
Banks, P. J., D. J. Close, and I. L. Maclaine-cross, Sept. 1970, "Coupled Hea t and Mass Transfer in Fluid Flow through Porous Media-An Analogy with Hea t Transfer," Proc. 4 t h Int. Hea t Transfer Conf., Versailles.
Benedict, R. P., 1977, Fundamentals of Temperature, Pressure, and Flow Measurements, New York: John Wiley and Sons.
Benedict, R. P., Dec. 1966, "Most Probable Discharge Coefficients for ASME Flow Nozzles," Trans. ASME, J. Basic Eng., p. 734.
Cornish, R. J., 1928, "Flow in a Pipe of Rectangular Cross-Section," Proc. of t h e Royal Society, Vol. A1 20, pp. 691-700.
Duffie, J. A., and W. A. Beckman, 1980, Solar Engineering of Thermal Processes, New York: John Wiley and Sons.
Dunkle, R. V., P. J. Banks, and I. L. Maclaine-cross, 1980, "Wound Parallel P la te Exchangers for Air-Conditioning Applications," Compact Heat Exchangers, ASME HTD-Vol. 10, edi ted by R. K. Shah et al., pp. 65-72.
Henry, P. S. H., 1939, "Diffusion in Adsorbing Media," Proc. Roy. Soc., Ser. A, Vol. 171, pp. 215-24 1.
Hilsenrath, J., et al., 1960, "Tables of Thermodynamic and Transport Properties of Air, Argon, Carbon Dioxide, Carbon Monoxide, Hydrogen, Nitrogen, Oxygen, and Steam," Oxford, England: Pergamon Press.
Johnston, R. C. R., 1967, "Regenerative Evaporative Air Conditioning with Dehumidi- fication," Aust. Refrigeration, Air Conditioning and -Heating, Vol. 21, No. 2, pp. 29-34 and 65.
Jurinak, J. J., and P. J. Banks, Nov. 1982, "A Numerical Evaluation of Two Analogy Sol- utions for a Rotary Silica Gel Dehumidifier," Hea t Transfer in Porous Media, edi ted by J. V. Beck and L. S. Yao, ASME, Pub. HTD-Vol. 22.
Jurinak, J. J., and J. W. Mitchell, 1984, "Effect of Matrix Properties on t h e Performance of a Counterflow Rotary Dehumidifier," Trans. ASME, J. Heat Transfer, Vol. 106, pp. 638-645.
Jurinak, J. 3., 1982, "Open Cycle Desiccant Cooling - Component Models and Systems Simulations," Ph.D. Thesis, University of Wisconsin, Solar Energy Laboratory.
Kang, T. S., 1985, "Adiabatic Desiccant Open Cooling Cycles," Master of Engineering Thesis, New South Wales, Australia: University of New South Wales.
Kays, W. M., and A. L. London, 1984, Compact Heat Exchangers, 3rd edition, New York: McGraw-Hill,
Lambertson, T. J., 1958, 'lPerformance Factors of a Periodic-Flow Heat Exchanger," Trans. ASME, pp. 586-592.
Lavan, Z., J. B. Monnier, and W. M. Worek, 1982, "Second Law Analysis of Desiccant Cooling Systems," Trans. ASME, J. Solar Energy Eng., Vol. 104, pp. 229-236.
Lee, K. C., Oct. 1984, "Tests on a Compact Shielded Wet Bulb Psychrometer," Bachelor of Engineering Thesis, New South Wales, Australia: The University of New South Wales.
Lunde, P. J., 1980, Solar Thermal Engineering, New York: John Wiley and Sons.
Lundgren, T. S., E. M. Sparrow, and J. 8. Starr, Sept. 1964, "Pressure Drop Due t o the Entrance Region in Ducts of Arbitrary Cross Section,'' ASME J. Basic Engineering, Vol 86, No. 3, pp. 620-626.
Maclaine-cross, I. L., 1985, "High Performance Adiabatic Desiccant Open Cooling Cycles," Trans. ASME, J. Solar Energy Eng., Vol. 107, pp. 102-104.
Maclaine-cross, I. L., 1980, "Effect of Interstitial Fluid Heat Capacity on Regenerator Performance," Trans. ASME, J. Heat Transfer, Vol. 102, pp. 572-573.
Maclaine-cross, I. L., Aug. 1978, "Comparison of the Analogy Theory of Combined Heat and Mass Transfer in Regenerators with a Finite Difference Solution," New South Wales, Australia: Department of Mining and Mineral Sciences, University of New South Wales.
Maclaine-cross, I. L., 1974, ''A Theory of Combined Heat and Mass Transfer in Regen- erators," Ph.D. Thesis, Department of Mechanical Engineering, Monash University.
Maclaine-cross, I. L., 1973, "Combined Heat and Mass Transfer in Regenerators with Multiple Film Transfer Coefficients," paper presented at the First Australian Con- ference on Heat and Mass Transfer, Melbourne, Australia.
Maclaine-cross, I. L., and C. W. Ambrose, Mar. 1980, "Predicted and Measured Pressure Drop in Parallel Plate Rotary Regenerators," Trans. ASME, J. Fluids Engineering, Vol. 102, pp. 39-63.
Maclaine-cross, 1. L., and P. J. Banks, 1972, "Coupled Heat and Mass Transfer in Regen- erators-Prediction Using an Analogy with Heat Transfer," Int. J. Heat Mass Transfer, Vol. 13, pp. 1225-1242.
Maclaine-cross, I. L., and J. M. Parsons, 1986, A Five-Ton Advanced Solid-Desiccant Solar Cooling System with Heating and Service Hot Water, SERI/SP-252-2832, Golden, CO: Solar Energy Research Institute.
Mason, E. A., and L. Monchick, 1965, "Survey of t h e Equation of S t a t e and Transport Properties of Moist Gases," Humidity and Moisture, edi ted by A. Wexler, New York: Reinhold, Vol. 3, pp. 257-272.
Mitchell, J. W., 1983, Energy Engineering, New York: John Wiley and Sons.
Ower, E., and R. C. Pankhurst, 1975, The Measurement of Air Flow, London: Pergamon Press.
Penney, T. R., and I. L. Maclaine-cross, May 1985, "Promising Advances in Desiccant Cooling," SERIITP-252-2683, Golden, CO: Solar Energy Research Institute.
Pennington, N. A., 1955, "Humidity Changer for Air Conditioning," U.S. Pa ten t No. 2,700,537.
Pesaran, A. P., I. L. Maclaine-cross, and E. Van Den Bulck, 1986, Measurements on Prom- ising Dehumidifier Materials and Geometries, SERIITR-252-2898, Golden, CO: Solar Energy Research Institute.
Schlepp, D., and R. Barlow, Sept. 1984, Performance of t h e SERI Parallel-Passage Dehumidifier, SERIITR-252-1951, Golden, CO: Solar Energy Research Institute.
Schlepp, D., K. J. Schultz, and F. Zangrando, 1984, Facil i ty Design f o r Cyclic Testing of Advanced Solid Desiccant Dehumidifiers, SERIITR-252-2464, Golden, CO: Solar Energy Research Institute.
Schultz, K. J., 1986, SERI Desiccant Cooling Test Facility: S ta tus Report: Preliminary Data on t h e Performance of a Rota ry Parallel Passage, Silica Gel Dehumidifier, SERIITR-252-2718, Golden, CO: Solar Energy Research Institute.
Sladek, K. J., E. R. Gilliland, and R. F. Baddour, 1974, "Diffusion on Surfaces 11: Cor- relat ion of Diffusivities of Physically and Chemically Adsorbed Species," Ind. Eng. Chem. Fundam., Vol. 13, No. 2, pp. 100-105.
Spahn, H., and V. Gnielinski, 1971, "Warme und Steffaustausch in Cinem Sorptions Re- generator," Verfahrenstechnik, Vol. 5 , No. 4, pp. 143-149.
Van Den Bulck, E., S. A. Klein, and J. W. Mitchell, Nov. 1985, "Second Law Analysis of Solid Desiccant Rotary Dehumidifiers," paper presented at t h e National Hea t Transfer Conference, AIChE, Denver, CO.
van Leersum, J. G., and D. 3. Close, June 1982, "Experimental Verification of Open Cycle Cooling System Component Models," d ra f t report , University of Wisconsin.
Wylie, R. G., 1981, "Detailed Determination of t h e Psychrometer Coefficient for t h e Wet Cylinder in a Transverse Airstream and a n Analysis of I t s Accuracy," Technical Paper No. 7, Australia: Commonwealth Scientif ic and Industrial Research Organization, Division of Applied Physics.
Wylie, R. G., June 1969, The Psychrometer Problem-A Precise Analysis, PIR Report No. 65, Australia: Commonwealth Scientif ic and Industrial Research Organization.
Wylie, R. G., and T. Lalas, 1981, "The WMO Psychrometer," Technical Paper No. 3, Australia: Commonwealth Scientif ic and Industrial Research Organization, Division of Applied Physics.
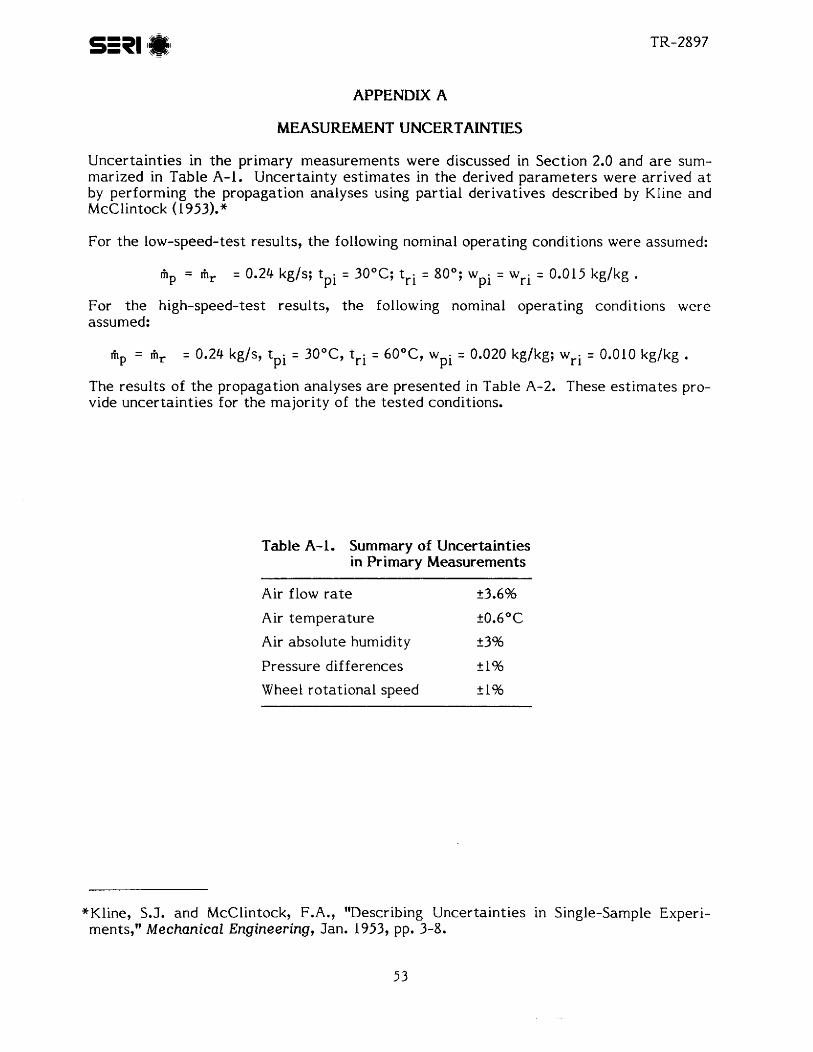
APPENDIX A
MEASUREMENT UNCERTAINTIES
Uncertainties in t h e primary measurements were discussed in Section 2.0 and a r e sum- marized in Table A-1. Uncertainty es t imates in the derived parameters were arrived at by performing t he propagation analyses using partial derivatives described by K line and McClintock (1 953).*
For t he low-speed-test results, t h e following nominal operating conditions were assumed:
For t he high-speed-test results, t h e following nominal operating conditions were assumed:
The results of t h e propagation analyses a r e presented in Table A-2. These es t imates pro- vide uncertainties f or t he majority of t he tes ted conditions.
Table A- 1. Summary of Uncertainties in Primary Measurements
Air flow r a t e +3.6%
Air temperature 20.6"C
Air absolute humidity 23%
Pressure differences 21%
Wheel rotational speed 21%
"Kline, S. J. and McClintock, F.A., "Describing Uncertainties in Single-Sample Experi- ments," Mechanical Engineering, Jan. 1953, pp. 3-8.
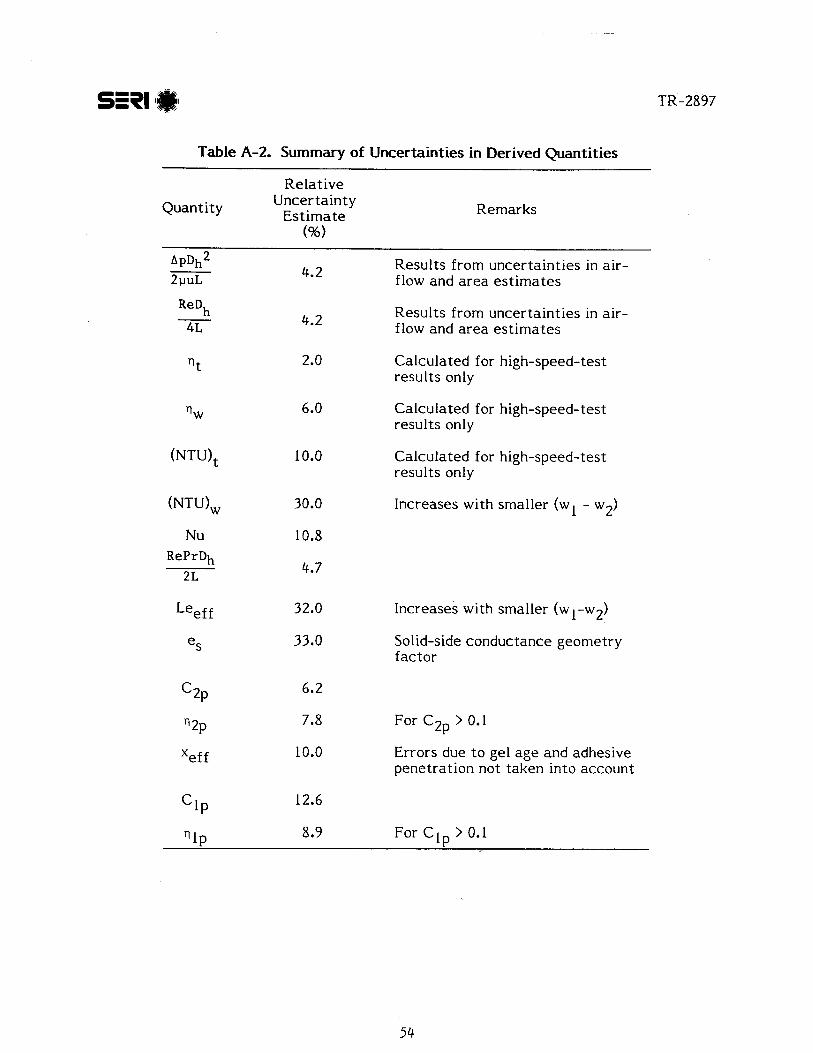
SlPl *I
Table A-2. Summary of Uncertainties in Derived Quantities
Relative
Quantity Uncertainty Estimate Remarks
4.2 Results from uncertainties in air- flow and a r ea est imates
4.2 Results from uncertainties in air- flow and a r ea estimates
"t 2.0 Calculated for high-speed-test results only
"w 6.0 Calculated for high-speed-test results only
(NTU), 10.0 Calculated for high-speed-test results only
(NTU), 30.0 Increases with smaller (wl - w2)
Leef f 32.0 Increases with smaller (w 1 -w2)
es 33.0 Solid-side conductance geometry factor
C 2 ~ 6.2
q 2 ~ 7.8 For CZp > 0.1
'ef f 10.0 Errors due t o gel age and adhesive penetration not taken into account
"1P 8.9 For C l p > 0.1
APPENDIX B
EXPERIMENTAL DATA
The exper imenta l d a t a for t e s t a r t i c l e 2 a r e summarized in Table B-I. The tabular en t r i e s a r e r a the r self-explanatory. For each t e s t , t h e r e a r e two adjacent rows of entries. The f i rs t row re fe r s t o t h e process s t r eam conditions and t h e second row t o t h e corresponding regeneration s t r eam conditions.
Column I contains t h e a rb i t r a ry experimental classif ications t h a t were based on t h e wheel rotat ional speed (low, medium, and high) and o the r primary t e s t variables, such a s process and regeneration temperatures , a i r flow ra tes , and humidity levels. Columns 2 and 3 contain t h e t e s t sequence numbers and identif ication numbers s tored in floppy diskettes. Column 4 identif ies t h e a i r s t r eam as e i the r process or regeneration. Col- umn 5 presents t h e dry a i r mass flow (in kg/s) into t h e ro tary dehumidifier t e s t art icle. In columns 6 and 7 a r e t h e inlet and out le t a i r t empera tu res (in OC). Columns 8 and 9 conta in t h e s t a t i c pressure (in Pa) just upstream and downstream of t h e rotor. The abso- lu te humidity levels (kg/kg of dry a i r ) at t h e rotor inlet and out le t a r e presented in col- umns 10 and 1 1. Column 12 lists t h e wheel rotat ional speed in revolutions per hour, and columns 13 and 14 provide a measure of er ror in mass and energy balances, respectively, in relat ion t o t h e exchange taking place.
The e r ro r s in mass and energy balances a r e calculated a s follows. The exchange error in moisture mass balance,
hP Aw + I, Aw, - - P (lip ~w~l+l+, AW,()/~ '
is expressed as a percentage, and t h e exchange e r ro r in enthalpy balance,
- m Ah * 5, Ah, - P P
(Imp ~ h ~ l + l h ~ hh,1)/2 '
is also expressed a s a percentage. Here, Aw refers to t h e change in t h e absolute humid- ity of t h e process s t r eam, and ~h re fe r s t o rts change in specific enthalpy. Similar defi- ni t ions apply t o the regeneration etrearn.
For pe r fec t mass balance in tests , i t is c lear t h a t these exchange e r ro r s must be zero. The majority of t h e experimental exchange errors quoted a r e within +lo%. However, t h e r e a r e instances in which t h e enthalpy errors a r e large. These high errors occur (a) when t h e wheel ro ta t ional speed is qui te low, and the enthalpy exchange between t h e process and regeneration s t r eams is minimal, and (b) in two of t h e high-speed tests , where t h e enthalpy di f ference between t h e process and t h e regeneration inlet s t r eam was minimal.
These er rors i l lustrate t h e accuracy with which the' process and regeneration effect ive- nesses can be calcula ted and a r e indicators of t h e consistency of t h e t e s t results. Results for 73 t e s t s a r e reported in Table 8-1.
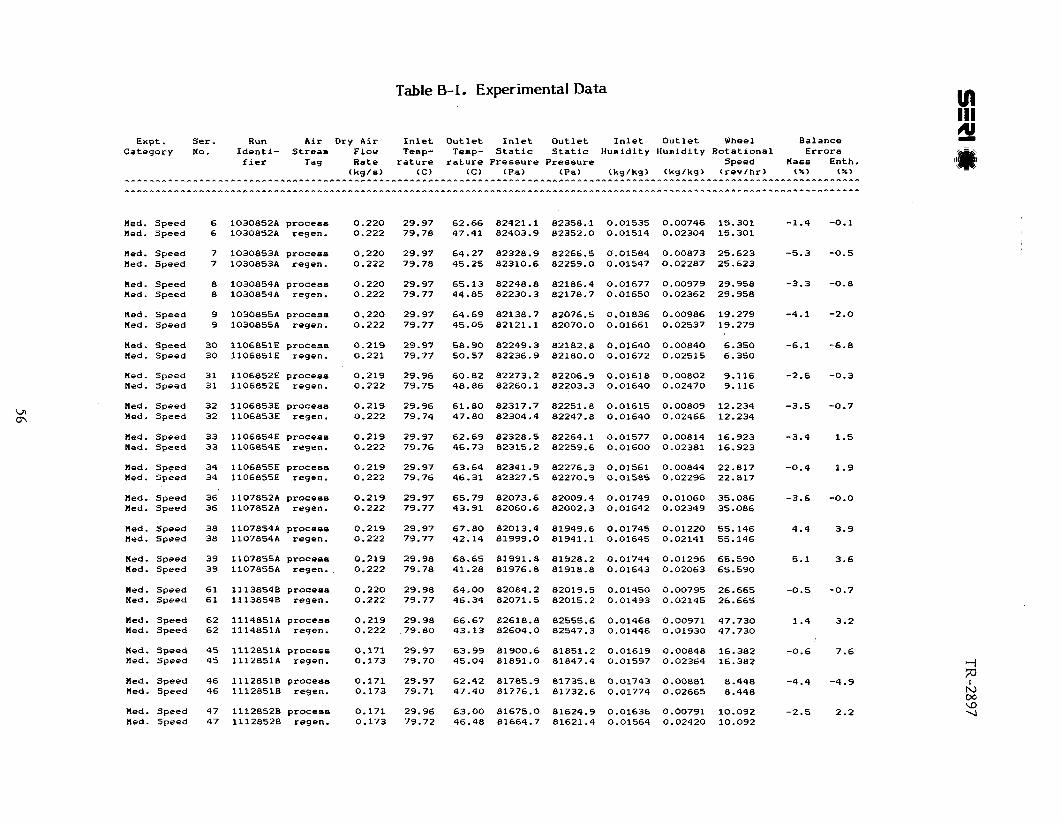
Table B-1. Experimental Data
Expt. Ser. Run Air Dry Air Inlet Outlet Inlet Outlet Inlet Outlet Wheel Balance Category No. Identi- Stream Flow Temp- Temp- Static Static Humidity Humidity Rotational Errors
f ler Tag Rate rature rature Pressure Pressure Speed Ha68 Enth. (kg/s> (C) CC) (Pa) (Pa) (kg/kg) (kg/kg) Crev/hr) t x ) (k)
- ^ - - ^ - ^^ - - - ^ - - - - - - - - - - - - - - * - - - - - - - - - - - - - - - - - - - - - - - - - * - - - - - - - - - - - - -~ - - - - - - - - - - - - - - - - - - - - - - - - - - - - - - - - - - * - - - - - - - * - - - - - - - - -
- I - ^ - - - - - - - - - - ^ - - - - - - - * - - - - - - - - - - A * - - - - - - - - - - - - A - - - - - - - - - - - - - - - - - - - - - - - - - - - - - - - - - - - - - - - - - - - ~ A - - - - - * - - - - - - - - - - - * - * - - - - - -
Hed. Speed 6 1030852A process 0.220 29.97 62.66 82421.1 82358.1 0.01535 0.00746 15.301 -1.4 -0.1 Hed. Speed 6 1030852A regen. 0.222 79.78 47.41 82403.9 82352.0 0.01514 0.02304 15.301
Hed. Speed 7 1030853A process 0.220 29.97 64.27 82328.9 82266.5 0.01584 0.00873 25.623 -5.3 -0.5 Hed. Speed 7 1030853A regen. 0.222 79.78 45.25 82310.6 82259.0 0.01547 0.02287 25.623
Hed. Speed 8 1030854A proceaa 0.220 29.97 65.13 82248.8 82186.4 0.01677 0.00979 29.958 -3.3 -0.8 Med. Speed 8 1030854A regen. 0.222 79.77 44.85 82230.3 82178.7 0.01650 0.02362 29.958
Med. Speed 9 1030855A proceaa 0.220 29.97 64.69 82138.7 82076.5 0.01836 0.00986 19.279 -4.1 -2.0 Med. Speed 9 1030855A regen. 0.222 79.77 45.05 82121.1 82070.0 0.01661 0.02537 19.279
Med. Speed 30 l lO6851E proceaa 0.219 29.97 58.90 82249.3 82182.8 0.01640 0.00840 6.350 -6.1 -6.8 Med. Speed 30 1106851E regen. 0.221 79.77 50.57 82236.9 82180.0 0.01672 0.02515 6.350
Med. Speed 31 1106852E process 0.219 29.96 60.82 82273.2 82206.9 0.01618 0.00802 9.116 -2.6 -0.3 Hed. Speed 31 1106852E regen. 0.222 79.75 48.86 82260.1 82203.3 0.01640 0.02470 9.116
Hed. Speed 32 1106853E process 0.219 29.96 61.80 82317.7 82251.8 0.01615 0.00809 12.234 -3.5 -0.7 Med. Speed 32 1106853E regen. 0.222 79.74 47.80 82304.4 82247.8 0.01640 0.02466 12.234
Hed. Speed 33 1106854E proceaa 0.219 29.97 62.69 82328.5 82264.1 0.01577 0.00814 16.923 -3.4 1.5 Red. Speed 33 1106854E regen. 0.222 79.76 46.73 82315.2 82259.6 0.01600 0.02381 16.923
Med. Speed 34 1106855E process 0.219 29.97 63.64 82341.9 82276.3 0.01561 0.00844 22.817 -0.4 1.9 Med. Speed 34 1106855E regen. 0.222 79.76 46.31 82327.5 82270.9 0.01585 0.02296 22.817
Med. Speed 36 1107852A process 0.219 29.97 65.79 82073.6 82009.4 0.01749 0.01060 35.086 -3.6 -0.0 Med. Speed 36 1107852A regen. 0.222 79.77 43.91 82060.6 82002.3 0.01642 0.02349 35.086
Hed. Speed 38 1107854A process 0.219 29.97 67.80 82013.4 81949.6 0.01745 0.01220 55.146 4.4 3.9 Hed. Speed 38 1107854A regen. 0.222 79.77 42.14 81999.0 81941.1 0.01645 0.02141 55.146
Med. Speed 39 1107855A proceaa 0.219 29.98 68.65 81991.8 81928.2 0.01744 0.01296 65.590 5.1 3.6 Med. Speed 39 1107855A' regen.. 0.222 79.78 41.28 81976.8 81918.8 0.01643 0.02063 65.590
Hed. Speed 6 1 11138548 proceaa 0.220 29.98 64.00 82084.2 82019.5 0.01450 0.00795 26.665 -0.5 -0.7 Med. Speed 6 1 11138548 regen. 0.222 79.77 46.34 82071.5 82015.2 0.01493 0.02145 26.665
Med. Speed 62 1114851A proceaa 0.219 29.98 66.67 e2618.8 82555.6 0.01468 0.00971 47.730 1.4 3.2 Hed. Speed 62 1114851A regen. 0.222 79.80 43.13 82604.0 82547.3 0.01446 0.01930 47.730
Med. Speed 45 1112851A process 0.171 29.97 63.99 81900.6 81851.2 0.01619 0.00848 16.382 -0.6 7.6 Med. Speed 45 1112851A regen. 0.173 79.70 45.04 81891.0 81847.4 0.01597 0.02364 16.382
Hed. Speed 46 11126518 proceaa 0.171 29.97 62.42 81785.9 81735.8 0.01743 0.00881 8.448 -4.4 -4.9 Hed. Speed 46 11126518 regen. 0.173 79.71 47.40 81776.1 81732.6 0.01774 0.02665 8.448
Med. Speed 47 11126528 process 0.171 29.96 63.00 81675.0 81624.9 0.01636 0.00791 10.092 -2.5 2.2 Med. Speed 47 11128528 regen. 0.173 79.72 46.48 81664.7 81621.4 0.01564 0.02420 10.092
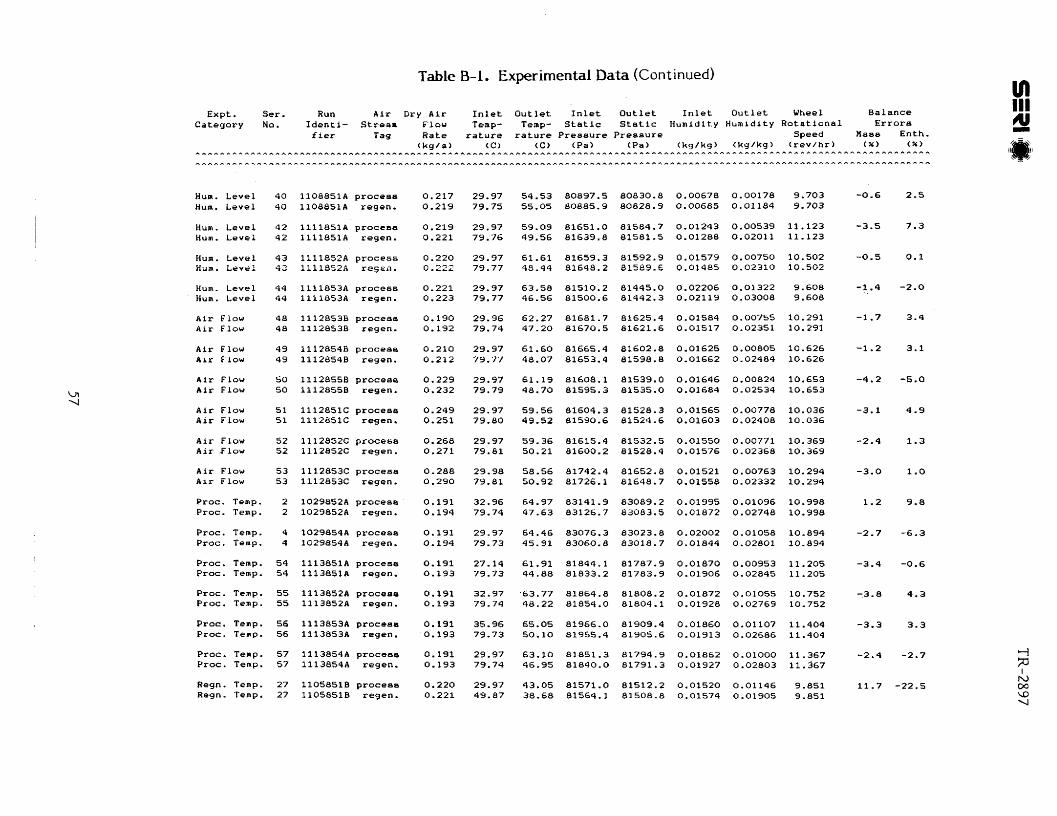
Table B-1. Experimental Data (Continued)
Expt. Ser. Run Air Dry Air Inlet Outlet Inlet Outlet Inlet Outlet Wheel Balance Category No. Identi- Stroen Flow Temp- Temp- Static Static Humidity Humidity Rotational Err ore
f ier Tas Rate rature rature Pressure Pressure Speed Mase Enth. (kg/s> (c) <C) (Pa) (Pa) (kg/kg) <kg/kg) (rev/hr) ( X ) ( X )
- - * A A - A * - * * A ~ ~ A ~ h A * * * * A * A ~ * * A A ~ ~ ~ ~ ~ A ~ ~ ~ ~ ~ ~ * A A ~ ~ A * A A * A ~ * A * A h A * ~ A * A ~ A A ~ * A ~ A A * A A * A A * ~ A * A * A ~ A A ~ A * - - - A A ~ * A * A A * ~ ~ * A * A ~ ~ A ~ ~ A ~ *
Hum. Level 40 11088516 proceaa 0.217 29.97 54.53 80897.5 80830.8 0.00678 0.00178 9.703 -0.6 2.5 Hun. Level 40 llO8851A regen. 0.219 79.75 55.05 80885.9 80828.9 0.00685 0.01184 9.703
Hum. Level 42 1111851A process 0.219 29.97 59.09 81651.0 81584.7 0.01243 0.00539 11.123 -3.5 7.3 Hum. Level 42 1111851A regen. 0.221 79.76 49.56 81639.8 81581.5 0.01280 0.02031 11.123
Hum. Level 43 1111852A process 0.220 29.97 61.61 81659.3 81592.9 0.01579 0.00750 10.502 -0.5 0.1 Hum. LeveL 43 11118528 resca. 0.222 79.77 49.44 81648.2 81589.6 0.01485 0.02310 10.502
Hum. Level 44 1111853A process 0.221 29.97 63.58 81510.2 81445.0 0.02206 0.01322 9.608 -1.4 -2.0 Hum. Level 44 1111853A regen. 0.223 79.77 46.56 81500.6 81442.3 0.02119 0.03008 9.608
Air Flow 48 1112853B proceaa 0.190 29.96 62.27 81681.7 81625.4 0.01584 0.00755 10.291 -1.7 3.4 Air Flow 48 1112853B regen. 0.192 79.74 47.20 81670.5 81621.6 0.01517 0.02351 10.291
Air Flow 49 1112854B proceaa 0.210 29.97 61.60 81665.4 81602.8 0.01625 0.00805 10.626 -1.2 3.1 Air Flow 49 11128548 regen. 0.212 79.77 48.07 81653.4 81598.8 0.01662 0.02484 10.626
Air Flow 50 11128556 proceaa 0.229 29.97 61.19 81608.1 81539.0 0.01646 0.00824 10.653 -4.2 -5.0 Air Flow 50 11128558 regen, 0.232 79.79 48.70 81595.3 81535.0 0.01684 0.02534 10.653
Air Flow 51 1112851C proceoe 0.249 29.97 59.56 81604.3 81528.3 0.01565 0.00778 10.036 -3.1 4.9 Air Flow 51 1112851C regen. 0.251 79.80 49.52 81590.6 81524.6 0.01603 0.02408 10.036
Air Flow 52 1112852C process 0.268 29.97 59.36 81615.4 81532.5 0.01550 0.00771 10.369 -2.4 1.3 Air .Flow 52 1112852C tegen, 0.271 79.81 50.21 81600.2 81528.4 0.01576 0.02368 10.369
Air Flow 53 1112853C procese 0.288 29.98 58.56 81742.4 81652.8 0.01521 0.00763 10.294 -3.0 1.0 Air Flow 53 1112853C regen. 0.290 79.81 50.92 81726.1 81648.7 0.01558 0.02332 10.294
Proc. Temp. 2 1029852A process 0.191 32.96 64.97 83141.9 83089.2 0.01995 0.01096 10.998 1.2 9.8 Proc. Temp. 2 1029852A regen. 0.194 79.74 47.63 83126.7 83083.5 0.01872 0.02748 10.998
Proc. Temp. 4 10298546 process 0.191 29.97 64.46 83076.3 83023.8 0.02002 0.01058 10.894 -2.7 -6.3 Proc. Temp. 4 1029854A regen. 0.194 79.73 45.91 83060.8 83018.7 0.01844 0.02801 10.894
Proc. Temp. 54 1113851A process 0.191 27.14 61.91 81844.1 81787.9 0.01870 0.00953 11.205 -3.4 -0.6 Proc. Temp. 54 1113851A regen. 0.193 79.73 44.88 81833.2 01783.9 0.01906 0.02845 11.205
Proc. Temp. 55 1113852A process 0.191 32.97 .63.77 81864.8 81808.2 0.01872 0.01055 10.752 -3.8 4.3 Proc. Temp. 55 1113852A regen. 0.193 79.74 48.22 81854.0 81804.1 0.01928 0.02769 10,752
Proc. Temp. 56 1113853A proceae 0.191 35.96 65.05 81966.0 81909.4 0.01860 0.01107 11.404 -3.3 3.3 Proc. Temp. 56 1113853A regen. 0.193 79.73 50.10 81955.4 81905.6 0.01913 0.02586 11.404
Proc. Temp. 57 1113854A procese 0.191 29.97 63.10 81851.3 81794.9 0.01862 0.01000 11.367 -2.4 -2.7 Proc. Temp. 57 1113854A regen. 0.193 79.74 46.95 81840.0 81791.3 0.01927 0.02803 11.367
Regn. Temp. 27 11058518 proceaa 0.220 29.97 43.05 81571.0 81512.2 0.01520 0.01146 9.851 11.7 -22.5 Regn. Temp. 27 11058518 regen. 0.221 49.87 38.68 81564.1 81508.8 0.01574 0.01905 9.851
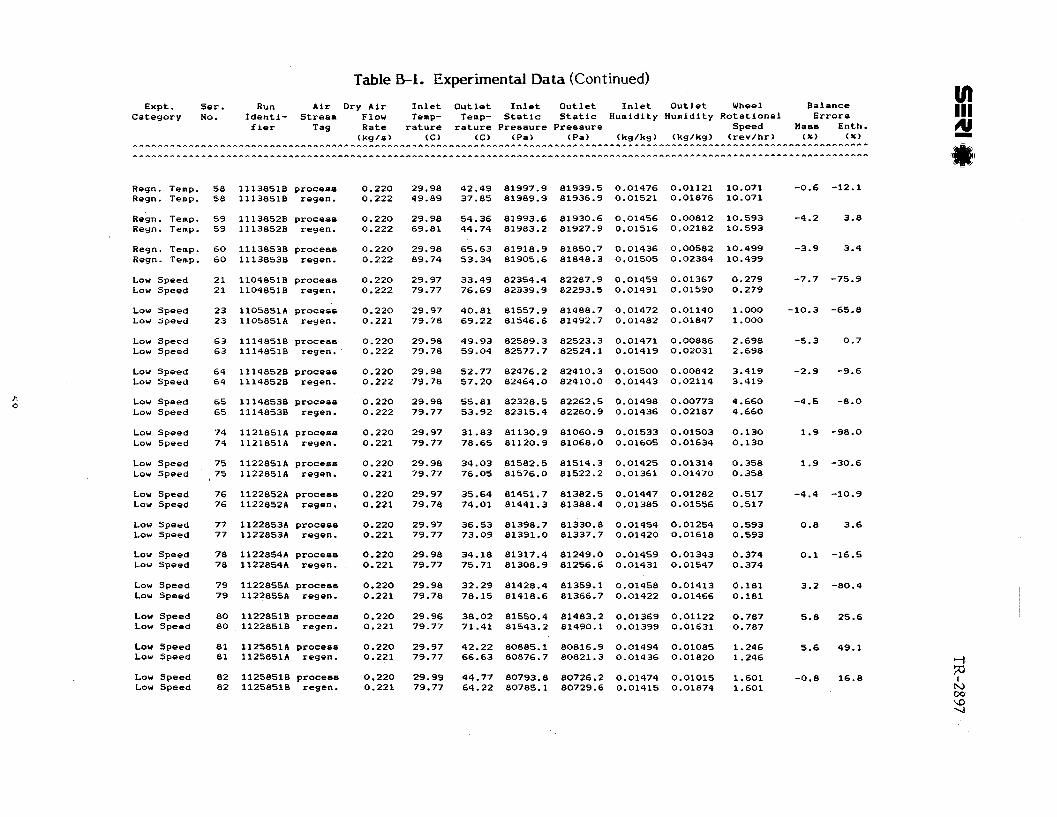
Table 8-1. Experimental Data (Continued)
Expt. Ser. Run Air Dry Air Inlet Outlet Inlet Outlet Inlet Outlet Wheel Balance Category No. Identi- Stream Flow Temp- Temp- Static Static Humidity Humidity Rotational Errora
f ier Tag Rate rature rature Preeeure Preeaure Speed Maee Enth. (kg/s) (C) (C) (Pa) (Pa) (kg/kg) (kg/kg) (rev/hr) (X) (%)
- ^ ^ A ^ ^ ^ A A I ^ A ^ ^ L I ^ ^ ^ - - A A A - A - - - - A A A A - A - A - - - - - - A - - A A A A - - - - - - - - - - A - A - - - - A A - - - A A - A A A A - A - A A - A - - - - - A - A - A - - A A A A - - - A - A - - - - - - A A - -
Regn. Temp. 58 11138518 proceee 0.220 29.98 42.49 81997.9 81939.5 0.01476 0.01121 10.071 -0.6 -12.1 Regn. Temp. 58 11138518 regen. 0.222 49.89 37.85 81989.9 81936.9 0.01521 0.01876 10.071
Regn. Temp. 5 9 11138528 process 0.220 29.98 54.36 81993.6 81930.6 0.01456 0.00812 10.593 -4.2 3.8 Regn. Temp. 59 11138528 regen. 0.222 69.81 44.74 81983.2 81927.9 0.01516 0.02182 10.593
Regn. Temp. 60 Regn. Temp. 60
Low Speed 21 Low Speed 21
Low Speed 23 Low Speed 23
Low Speed 6 3 Low Speed 6 3
Low Speed 6 4 Low Speed 6 4
Low Speed Low Speed
Low Speed Low Speed
Low Speed Low Speed
Low Speed Low Speed
Low Speed Low Speed
Low Speed Low Speed
Low Speed Lou Speed
Low Speed Low Speed
Lou Speed Low Speed
Low Speed Low Speed
11138538 proceas 11138538 regen.
11048518 proceaa 11048518 regen.
1105851A process 1105851A regen.
11148518 process 11148518 regen.
11148528 proceee 11148528 regen.
11148538 proceaa 11148538 regen.
1121851A proceee 1121851A regen.
1122851A proceee 11228518 regen.
1122852A process 1122852A regen.
1122853A procese 11228531 regen.
1122854A proceae 1122854A regen.
11228556 proceee 1122855A regen.
11228518 proceee 11228518 regen.
1125851A proceee 1125851A regen.
11258518 process 11258518 regen.
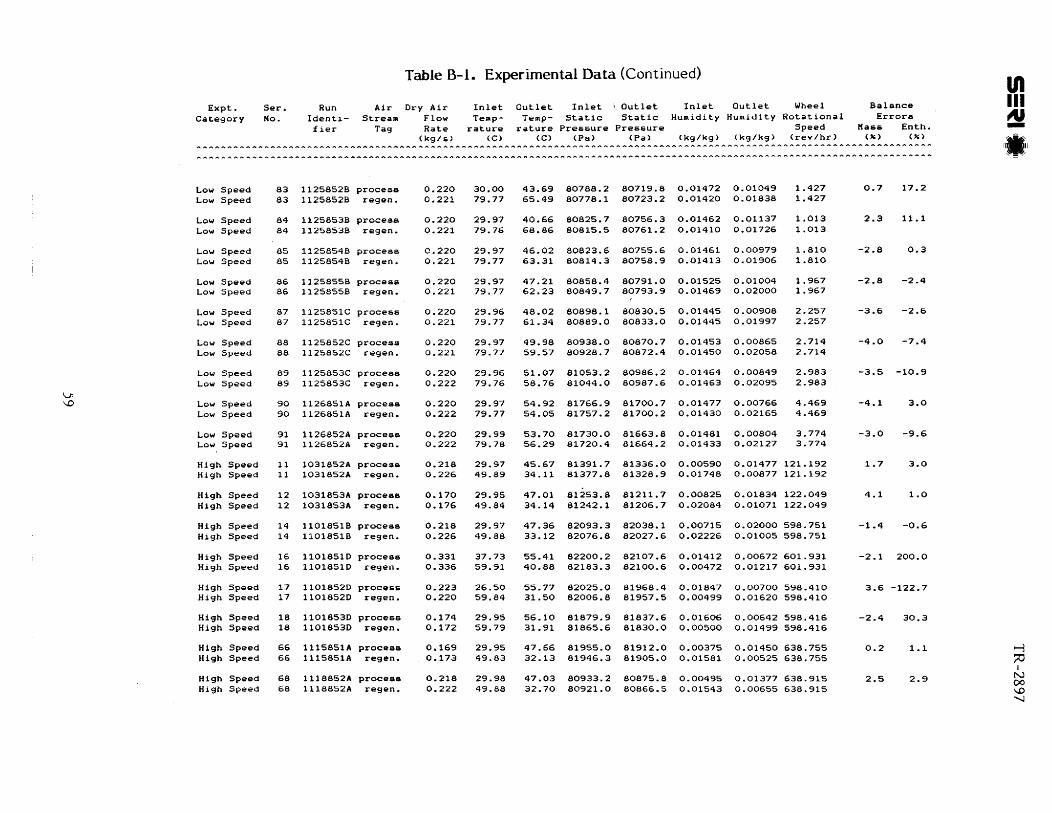
Table B- 1. Experimental Data (Continued)
Expt. Ser. Run Air Dry Air Inlet Outlet Inlet Outlet Inlet Outlet Wheel Balance Category No. Identi- Stream Flow Temp- Temp- Static Static Humidity Humidity Rotational Errors
f ier Tag Rate rature rature Pressure Pressure Speed M a 6 6 Enth. (kg/s) ( C ) (C) (Pa) (Pa) (kg/kg) (kg/kg) (rev/hr) % < % )
A l * * ~ * ~ r r l l - * ~ * r l A ~ A ~ ~ - * - A ~ A * - - * 4 * - A * A A A A A - * A * * A ~ A * - - - A A - - A ~ - A A - A * ~ * * A * * * * * A * - - ~ 4 A A A * A A A ~ ~ - A A A ~ * - ~ * A - - - A * A A A A * A A - - - - ~ * ~
Low Speed 83 1125852B procese 0.220 30.00 43.69 80788.2 80719.8 0.01472 0.01049 1.427 0.7 17.2 Low Speed 83 11258528 regen. 0.221 79.77 65.49 80778.1 80723.2 0.01420 0.01838 1.427
Low Speed 84 1125853B procesa 0.220 29.97 40.66 80825.7 80756.3 0.01462 0.01137 1.013 2.3 11.1 Low Speed 84 1125853B regen. 0.221 79.76 68.86 80815.5 80761.2 0.01410 0.01726 1.013
Lou Speed 85 11258548 process C.220 29.97 46-02 80823.5 80755.6 0.01461 0.00979 1.810 -2.8 0.3 Lou Speed 85 1125854B r e g e n . 0.221 79.77 63.31 80814.3 80758.9 0.01413 0.01906 1.810
Low Speed 86 1125855B process 0.220 29.97 47.21 80858.4 80791.0 0.01525 0.01004 1.967 -2.8 -2.4 Low Speed 86 1125855B regen. 0.221 79.77 62.23 80849.7 80793.9 0.01469 0.02000 1.967
Low Speed 87 1125851C process 0.220 29.96 48.02 80898.1 80830.5 0.01445 0.00908 2.257 -3.6 -2.6 Low Speed 87 1125851C regen. 0.221 79.77 61.34 80889.0 80833.0 0.01445 0.01997 2.257
Low Speed 88 1125852C process 0.220 29.97 49.98 80938.0 80870.7 0.01453 0.00865 2.714 -4.0 -7.4 Low Speed 88 1125852C regen. 0.221 79.77 59.57 80928.7 80872.4 0.01450 0.02058 2.714
Lou Speed 89 1125853C process 0.220 29.96 51.07 81053.2 80986.2 0.01464 0.00849 2.983 -3.5 -10.9 Low Speed 89 11258536 regen. 0.222 79.76 58.76 81044.0 80987.6 0.01963 0.02095 2.983
Low Speed 90 11268516 process 0.220 29.97 54.92 81766.9 81700.7 0.01477 0.00766 4.469 -4.1 3.0 Low Speed 90 1126851A regen. 0.222 79.77 54.05 81757.2 81700.2 0.01430 0.02165 4.469
Low Speed 91 1126852A process 0.220 29.99 53.70 81730.0 81663.8 0.01481 0.00804 3.774 -3.0 -9.6 Lou Speed 91 11268528 regen. 0.222 79.78 56-29 81720.4 81664.2 0.01433 0.02127 3.774
High Speed 11 1031852A procese 0.218 29.97 45-67 81391.7 81336.0 0.00590 0.01477 121.192 1.7 3.0 High Speed 11 1031852A regen. 0.226 49.89 34.11 81377.8 81328.9 0.01748 0.00877 121.192
High Speed 12 1031853A proceas 0.170 29.95 47.01 81253.8 81211.7 0.00825 0.01834 122.049 4.1 1.0 High Speed 12 1031853A regen. 0.176 49.84 34.14 81242.1 81206.7 0.02084 0.01071 122.049
High Speed 14 11018SlB proceaa 0.218 29.97 47.36 82093.3 82038.1 0.00715 0.02000 598.751 -1.4 -0.6 High Speed 14 11018518 regen. 0.226 49.88 33.12 82076.8 82027.6 0.02226 0.01005 598.751
High Speed 16 1101851D procees 0.331 37.73 55.41 82200.2 82107.6 0.01412 0.00672 601.931 -2.1 200.0 High Speed 16 1101851D r e g e n . 0.336 59.91 40.88 82183.3 82100.6 0.00472 0.01217 601.931
High Speed 17 1101852D process 0.223 26.50 55.77 82025.0 81968.4 0.01847 0.00700 598.410 3.6 -122.7 High Speed 17 1101852D regen. 0.220 59.84 31.50 82006.8 81957.5 0.00499 0.01620 598.410
High Speed 18 1101853D process 0.174 29.95 56.10 81879.9 81837.6 0.01606 0.00642 598.416 -2.4 30.3 High Speed 18 1101853D regen. 0.172 59.79 31.91 81865.6 81830.0 0.00500 0.01499 598.416
High Speed 66 1115851A proceee 0.169 29.95 47.66 81955.0 81912.0 0.00375 0.01450 638.755 0.2 1.1 High Speed 66 1115851A regen. 0.173 49.83 32.13 81946.3 81905.0 0.01583 0.00525 638.755
High Speed 68 1118852A proceaa 0.218 29.98 47.03 80933.2 80875.8 0.00495 0.01377 638.915 2.5 2.9 High Speed 68 lll8852A regen. 0.222 49.88 32.70 80921.0 80866.5 0.01543 0.00655 638.915
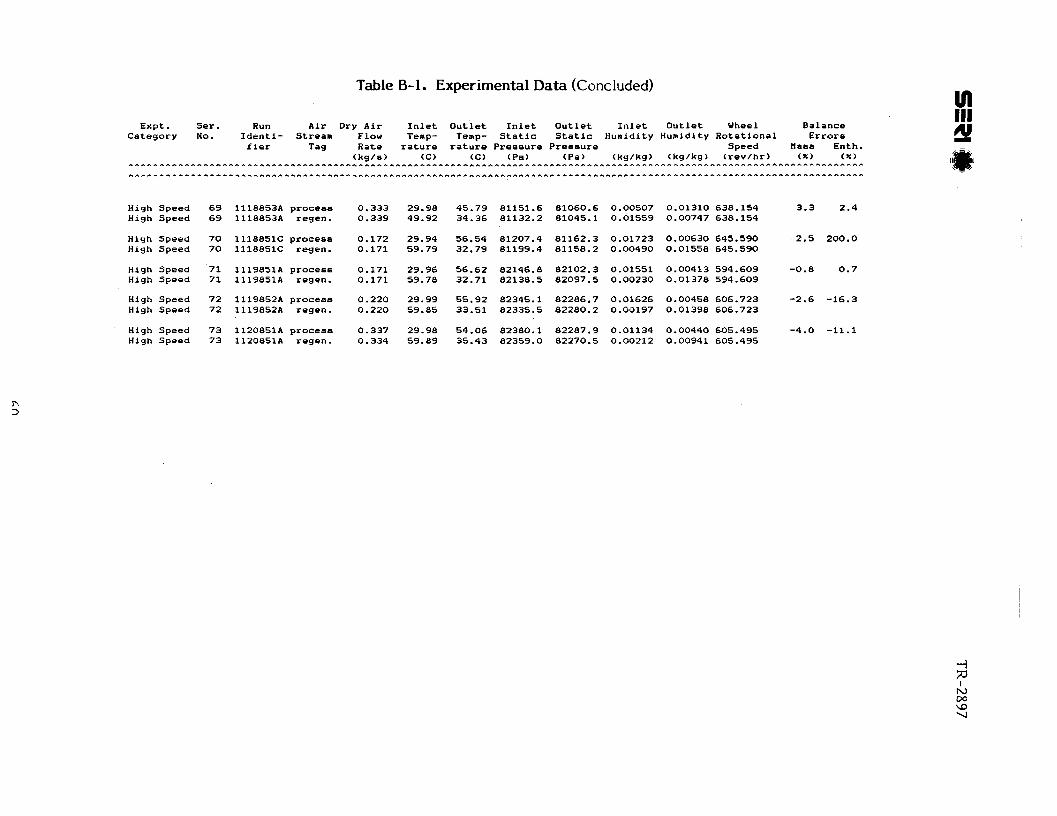
Table 8-1. Experimental Data (Concluded)
Expt. Ser. Run Air Dry Air Inlet Outlet Inlet Outlet Inlet Outlet Wheel Balance Category No. Identi- Stream Flow Temp- Temp- Static Static Humidity Humidity Rotational Errors
f ier Tag Rate rature rature Preasure Pressure Speed Mass Enth. (kg/a) CC) (C) (Pa) (Pa) (kg/kg) (kg/kg) (rev/hr) (X) (X)
- ~ ~ ^ A A A A A A A A ~ A A ~ ~ - ^ - A - - ~ ~ ~ - ~ A ~ ~ A A A - A ~ - - ~ - - - - - - ~ - - - ~ - ~ ~ - - A ~ A A A ~ A - ~ - - - - - A ~ ~ ~ - - - ~ ~ ~ - A A ~ ~ ~ - - - - - - A A A - - - - - - ~ A A A A A A A ~ ~ - ~ - - A - - -
A A A ~ ^ - - ^ - - A - - - ~ ~ - A A - - A A ~ A A - - - - - - A - ~ - ~ - ~ - - ~ ~ - A A A A ~ A ~ ~ - - - - A A - A A ~ A A A A - A - ~ - ~ - A A A - A - - - ~ - - A A - - - - - - - - - A ~ ~ - - A - - - - - ~ A - ~ A - - - - - A A ~
High Speed 69 1118853A process 0.333 29.98 45.79 81151.6 81060.6 0.00507 0.01310 638.154 3.3 2.4 High Speed 69 1118853A regen. 0.339 49.92 34.36 81132.2 81045.1 0.01559 0.00747 638.154
High Speed 70 1118851C process 0.172 29.94 56.54 81207.4 81162.3 0.01723 0.00630 645.590 2.5 200.0 High Speed 70 1118851C regen. 0.171 59.79 32.79 81199.4 81158.2 0.00490 0.01558 645.590
High Speed 71 1119851A process 0.171 29.96 56.62 82146.8 82102.3 0.01551 0.00413 594.609 -0.8 0.7 High Speed 71 1119851A regen. 0.171 59.78 32.71 82138.5 82097.5 0.00230 0.01378 594.609
High Speed 72 1119852A proceaa 0.220 29.99 55.92 82345.1 82286.7 0.01626 0.00458 606.723 -2.6 -16.3 High Speed 72 1119852A regen. 0.220 59.85 33.51 82335.5 82280.2 0.00197 0.01398 606.723
High Speed 73 1120851A proceea 0.337 29.98 54.06 82380.1 82287.9 0.01134 0.00440 605.495 -4.0 -11.1 High Speed 73 1120851A regen. 0.334 59.89 35.43 82359.0 82270.5 0.00212 0.00941 605.495
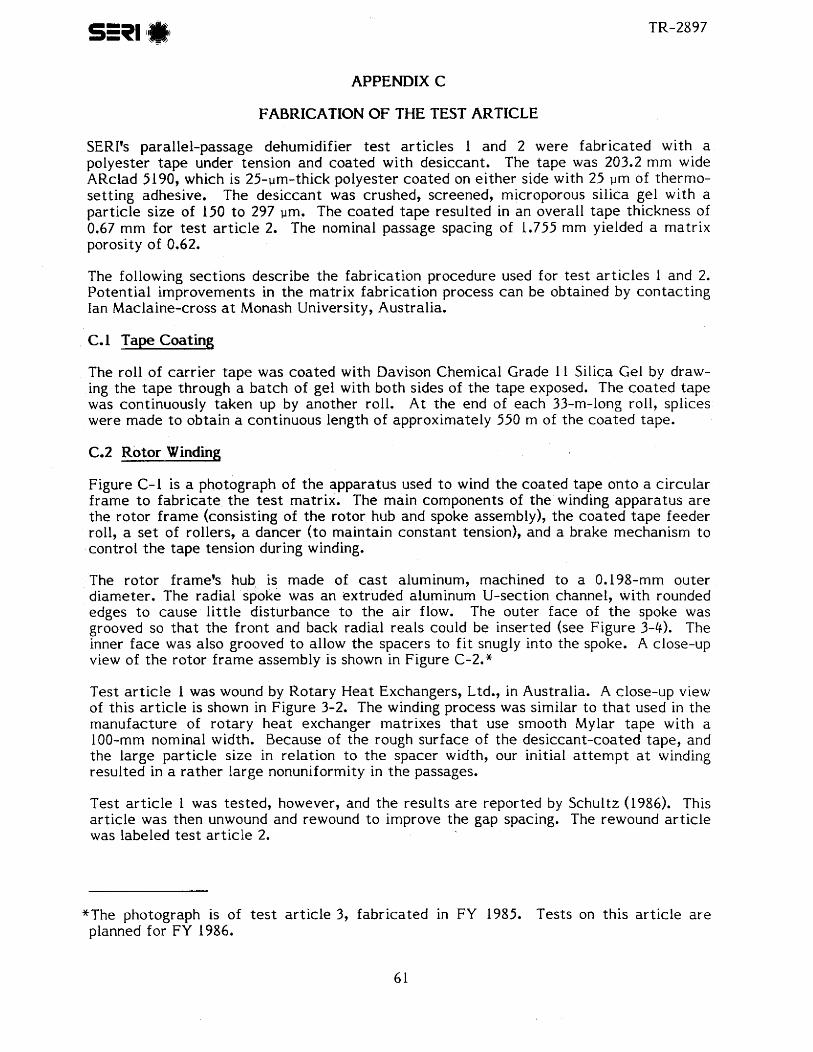
APPENDIX C
FABRICATION OF THE TEST ARTICLE
SERI's parallel-passage dehumidifier test ar t ic les I and 2 were fabr icated with a polyester t ape under tension and coated with desiccant. The tape was 203.2 mm wide ARclad 5190, which is 25-pm-thick polyester coated on e i ther side with 25 pm of thermo- sett ing adhesive. The desiccant was crushed, screened, microporous silica gel with a particle s ize of 150 t o 297 pm. The coated tape resulted in an overall t ape thickness of 0.67 mm for t es t a r t i c le 2. The nominal passage spacing of 1.755 mm yielded a matrix porosity of 0.62,
The following sections describe t he fabrication procedure used for t es t a r t i c les 1 and 2. Potential improvements in t he matrix fabrication process c an be obtained by contacting Ian Maclaine-cross at Monash University, Australia.
C.1 Tape Coating
The roll of carr ier t ape was coated with Davison Chemical Grade I1 Silica Gel by draw- ing the t a p e through a batch of gel with both sides of t he t ape exposed. The coa ted tape was continuously taken up by another roll. A t the end of each 33-m-long roll, splices were made t o obtain a continuous length of approximately 550 m of the coa ted tape.
C.2 Rotor Winding
Figure C-1 is a photograph of the apparatus used t o wind t he coated tape onto a circular f rame t o fabr icate t h e test matrix. The main components of t h e winding apparatus are the rotor f r ame (consisting of t he rotor hub and spoke assembly), t he coa ted t ape feeder roll, a set of rollers, a dancer ( to maintain constant tension), and a brake mechanism t o control t h e t ape tension during winding.
The rotor frame's hub is made of cast aluminum, machined t o a 0.198-mm outer diameter. The radial spoke was an extruded aluminum U-section channel, with rounded edges t o cause l i t t le disturbance t o t h e a i r flow. The outer face of t h e spoke was grooved so t ha t the f ront and back radial reals could be inserted (see Figure 3-4). The inner face was also grooved t o allow the spacers t o f i t snugly into the spoke. A close-up view of t he rotor f rame assembly is shown in Figure C-2."
Test a r t i c le 1 was wound by Rotary Heat Exchangers, Ltd., in Australia. A close-up view of this a r t i c le is shown in Figure 3-2. The winding process was similar t o t ha t used in the manufacture of rotary heat exchanger matrixes t ha t use smooth Mylar t ape with a 100-mm nominal width. Because of the rough surface of the desiccant-coated tape, and the large particle size in relation t o t h e spacer width, our initial a t t emp t a t winding resulted in a rather large nonuniformity in t h e passages.
Test a r t i c le 1 was tes ted, however, and t h e results a r e reported by Schultz (1986). This ar t ic le was then unwound and rewound t o improve the gap spacing. The rewound ar t ic le was labeled tes t a r t i c le 2.
*The photograph is of t e s t ar t ic le 3, fabricated in FY 1985. Tests on this ar t ic le a r e planned for FY 1986.
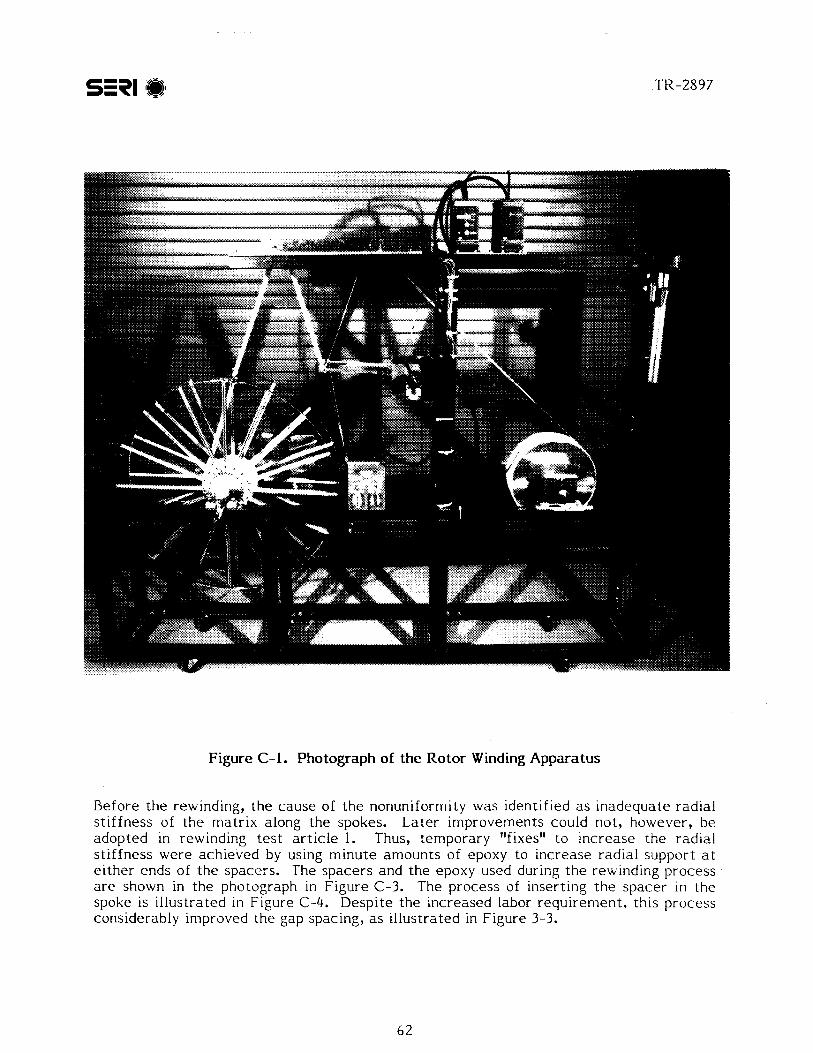
Figure C-1. Photograph of the Rotor Winding Apparatus
Before t h e rewinding, t h e cause of t h e nonuniformity was ident i f ied as inadequa te rad ia l s t i f fnes s of t h e ma t r ix along t h e spokes. L a t e r improvements could not , however, b e adop ted in rewinding t e s t a r t i c l e 1. Thus, t empora ry "fixes" t o i nc rease t h e radia l s t i f fness w e r e achieved by using minu te amoun t s of epoxy t o increase radia l suppor t a t e i t h e r ends of t h e spacers . The space r s and t h e epoxy used during t h e rewinding process a r e shown in t h e photograph in F igure C-3. The process of insert ing t h e space r in t h e spoke is i l lus t ra ted in Figure C-4. Desp i t e t h e increased labor r equ i r emen t , th is process considerably improved t h e gap spacing, as i l lus t ra ted in F igure 3-3.

Figure C-2. Photograph Illustrating the Rotor Tape Winding Mechanism
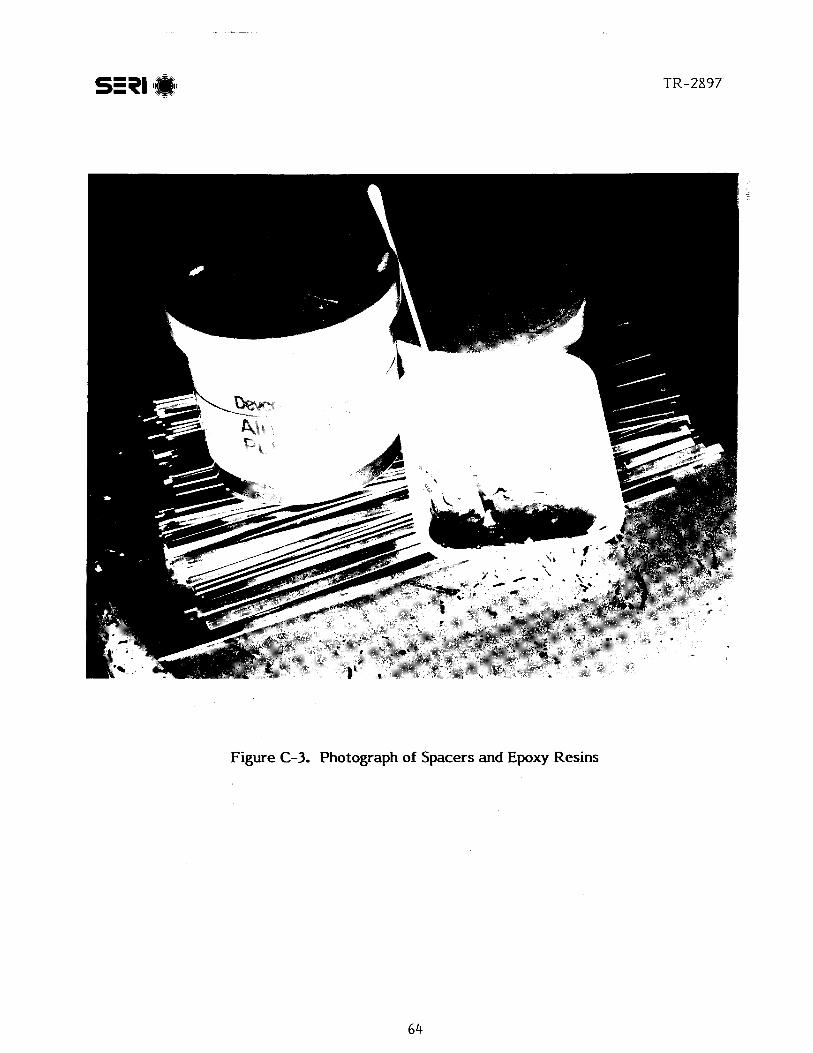
Figure C-3. Photograph of Spacers and Epoxy Resins
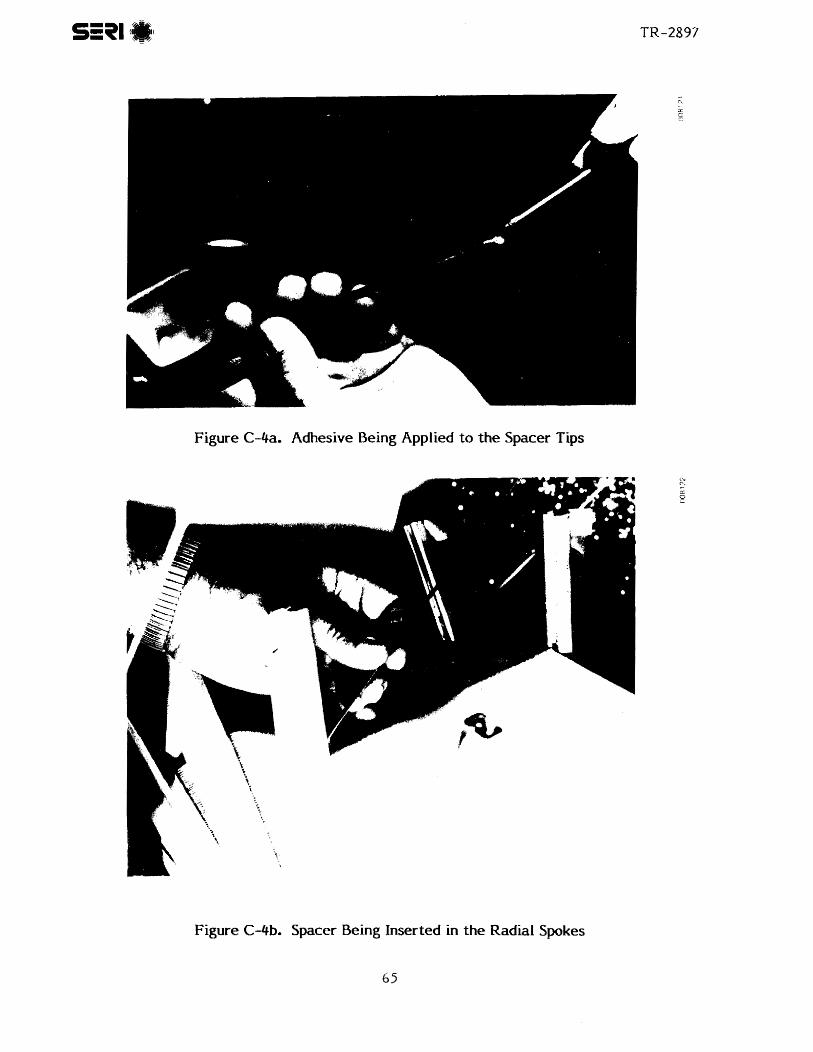
Figure C-4a. Adhesive Being Applied to the Spacer Tips
Figure C-4b. Spacer Being Inserted in the Radial Spokes
6 5
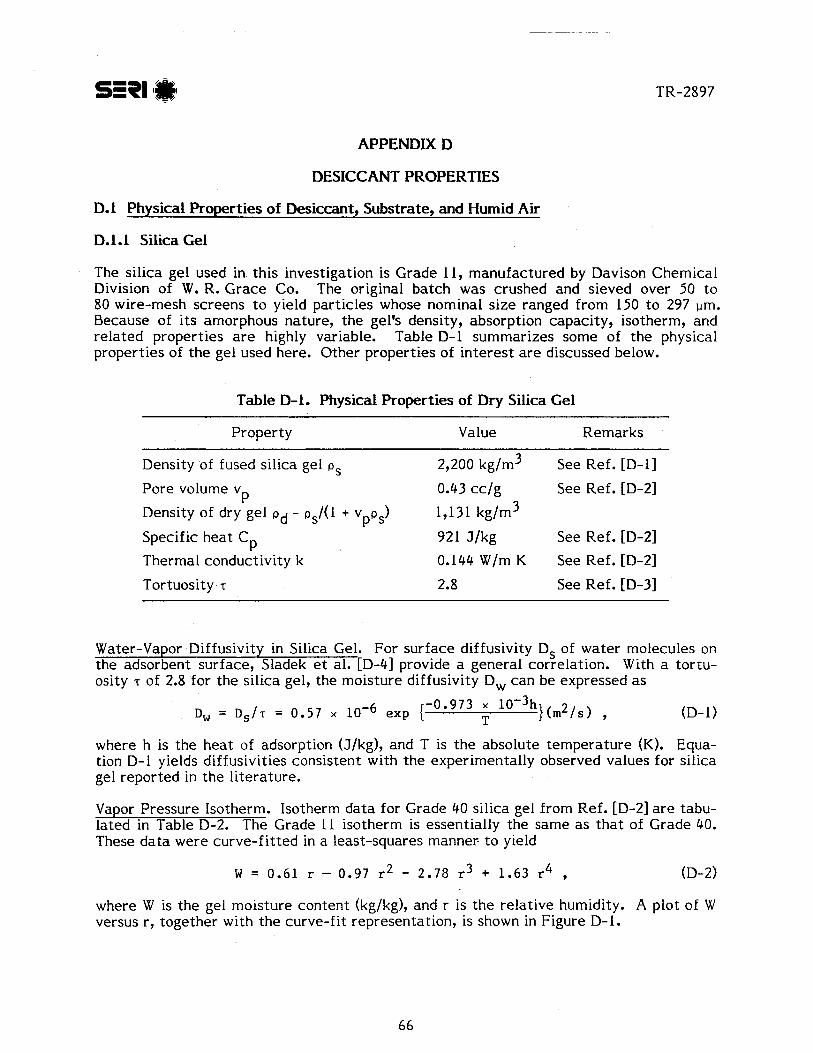
APPENDIX D
DESICCANT PROPERTIES
D.l Physical Properties of Desiccant, Substrate, and Humid Air
D. 1.1 Silica Gel
The silica gel used in this investigation is Grade 11, manufactured by Davison Chemical Division of W. R. Grace Co. The original batch was crushed and sieved over 50 t o 80 wire-mesh screens t o yield particles whose nominal size ranged from 150 t o 297 um. Because of i t s amorphous nature, t he gel's density, absorption capacity, isotherm, and related properties a r e highly variable. Table D-1 summarizes some of t he physical properties of t he gel used here. Other properties of interes t a r e discussed below.
Table D-1. Physical Properties of Dry Silica Gel
Property Value Remarks
Density of fused silica gel 0, 2,200 kg/m3 See Ref. [D-11
Pore volume v P
0.43 cc /g See Ref. [D-21
Density of dry gel pd - ~ , / ( l + v r, ) P S
1,131 kg/m3
Specific heat Cp 921 J /kg See Ref. [D-21
Thermal conductivity k 0.144 W/m K See Ref. [D-21
Tortuosity r 2.8 See Ref. [D-31
Water-Vapor Diffusivity in Silica Gel. For surface diffusivity Ds of water molecules on the adsorbent surface, Sladek et al. [D-41 provide a general correlation. With a tortu- osity r of 2.8 for t he silica gel, the moistu;; diffusivity Dw can be expressed as
-0.973 x 10⁻³hl(m2,s) D, = D,/T = 0.57 x exp { T 9
where h is t he heat of adsorption (J/kg), and T is t he absolute temperature (K). Equa- tion D-l yields diffusivities consistent with t he experimentally observed values for silica gel reported in t he literature.
Vapor Pressure Isotherm. Isotherm da ta for Grade 40 silica gel from Ref. [D-21 a r e tabu- lated in Table D-2. The Grade 11 isotherm is essentially t he same a s t ha t of Grade 40. These da ta were curve-fitted in a least-squares manner- t o yield
where W is t he gel moisture content (kg/kg), and r is t h e relative humidity. A plot of W versus r, together with t h e curve-fit representation, is shown in Figure D-1.
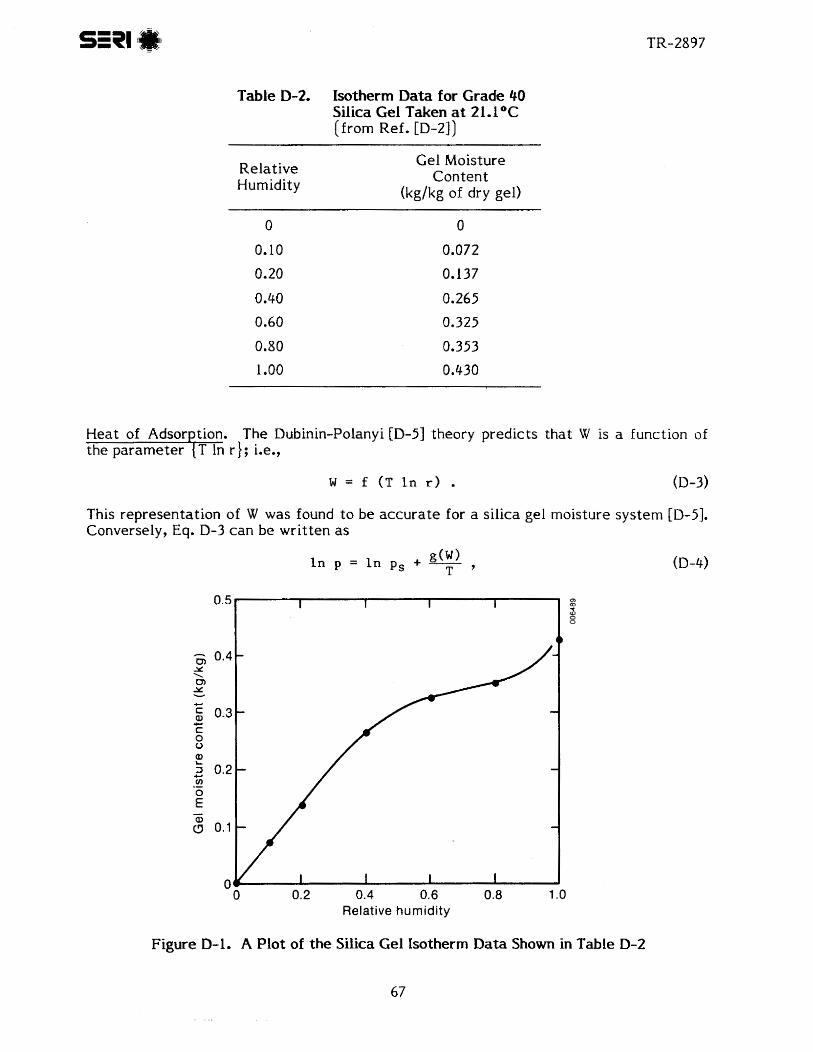
Table D-2. Isotherm Data for Grade 40 Silica Gel Taken at 21. f OC (from Ref. [D-21)
Relat ive Humidity
Ge l Moisture Con ten t
(kg/kg of dry gel)
Hea t of Adsorption. The Dubinin-Polanyi [D-51 theory predicts t h a t W is a function of t h e pa ramete r {T in r}; i.e.,
This representa t ion of W was found to be a c c u r a t e for a si l ica gel moisture sys tem [D-51. Conversely, Eq. D-3 c a n be wr i t t en as
Relative humidity
Figure D-1. A Plot of the Silica Gel Isotherm Data Shown in Table D-2
where
p t he vapor pressure (Pa)
ps = t he saturation pressure (Pa) at T temperature (K) g(W) = an arbitrary function of W alone.
Using the Clausius-Clapeyron equation, the heat of adsorption h can be written a s
where hs is the latent heat of vaporization (Jlkg).
Reducing Eq. D-5, using Eq. D-4, yields
D. 1.2 Substrate Tape
The substrate tape used in the matrix fabrication was ARclad 5190. The 25-pm-thick Mylar tape was covered with a 25-pm adhesive layer on both sid s. The tape width used 5 was 0.2032 m. The nominal tape surface density was 0.086 kg/m . The heat capacity of t he tape was taken t o be that of Mylar [D-61:
w h e r ~ t is the temperature ("C).
D.1.3 Humid Air
The following describe the air properties that a r e used in this report.
Universal gas constant: R = 8.3141 Jlmole K
Molecular weight of air: Ma = 28.964 x kglmole
Molecular weight of water: MR= 18.01534 x kglmole
Specific enthalpy of moist air h:
where t = temperature ("C) w = absolute humidity.
Dynamic viscosity of moist air p:
where T is the absolute temperature (K).
PrandtL number Pr:
Schmidt number Sc:
Vapor pressure of water pr:
p, = exp (23.28199 - 3780.82 - 22.5805 T ~2 1
D.2 Evaluation of F: Transfer Pro~erties
The evaluation of F i transfer properties for a silica gel-air-water system follows t h e procedures described by Banks [D-71 and Banks and Close [D-81, as modified by Maclaine- cross [D-91. A brief outline of t h e procedure is provided here.
The basic heat and moisture transfer equations are wri t ten as
Here, w and W a r e t h e ratios of t he mass of t h e moisture to t ha t of dry air and the matrix, respectively; w represents t h e absolute humidity! and W is the matrix moisture content. Also, h and H represent the specific enthalpies of the moist a i r and the matrix, respectively. x represents a distance in the direction of fluid flow, and o represents t ime,
When h, H, and W can be represented as functions of t and w alone, Eqs. D-7 and D-8 can be writ ten a s
where
and
for air-water systems at ambient pressures, and where
(D- 1 2)
The quantities a- and yi have been expressed in t e rms of convenient parameters derived from partial difkerentials of t he properties of t he fluid mixture and t he matrix with respect t o each other. Thus,
a t ah = -(--)h and aW = - (%) a w w
a r e t he slopes of lines of constant h and W, respectively, on a t-w plot;
is the ratio of the heat of sorption and the enthalpy of t he sorbate in the fluid mixture;
is t h e rat io of t h e specific heats of t he porous medium and the fluid mixture; and
is a sorption parameter, which contributes t o the parameter
which is termed the sorbability of the porous medium for t he sorbate.
Quantities Fl(t,w) a r e now introduced, which satisfy the equations
so tha t multiplying Eqs. D-9 by (aFi/at),, one obtains
(D- 13)
(D- 14)
Equation D-13 may be written
(D- 15)
Hence, each quantity F i is such tha t the slope of a line of constant Fi on a t-w plot is given by ai, which has been defined above in terms of t he similar slopes ah and a,.
For a mixture of perfect gases,
(D- 16)
where p is the partial pressure of the water vapor in the gas mixture, and r is i ts relative humidity p/ps.
For water vapor in air , a t near atmospheric pressures,
(D- 17)
Using Eq. D-5, and defining t h e pa ramete r $ as
a n expression fo r t h e sorption pa ramete r u is
(D- 18)
(D- 1 9)
where
depends on t h e variat ion of t h e sa tura t ion vapor pressure of t h e so rba te with t emper - a tu re , and
depends on t h e sorption isotherm slope.
From par t ia l d i f ferent ia t ion and Eq. D-17, w e der ive
where
The s e t of equations ahove provides a means of evaluat ing a i and y i as defined in Eq. D-10 and D-12, provided t h e vapor pressure isotherm relationship (D-2) is available. The convention of y2 > Y is used in a l l evaluations. The fugaci ty of w a t e r vapor in a i r ,
f w b = 1.0030, was lower t a n t h a t used by Maclaine-cross [D-91 because of t h e reduced a tmospher ic pressure at Golden, Colo. (a l t i tude = 1756 m).
D.3 Evaluation of the Intersection Point
Given t h e process and regenerat ion inlet conditions tpi, wpi, and tri, wri, respectively, t h e initial values of a and y at these points a r e evaluated a s described earl ier . The intersection point i:, projected a s t h e in tersec t ion of a line wi th a slope of
a t al [= (G)Fl} originating f rom t h e process inlet condition and of a line with a slope of a2 orlginating f rom t h e regenerat ion inlet condition. An incrementa l s t ep is t aken toward t h e intersection and updated values of a are evaluated. The e s t i m a t e of t h e intersection point is revised and t h e procedure is continued until t h e f inal in tersec t ion is achieved.
During th is procedure, a continual updating of t h e process mean values of y2 along t h e FL lines and along t h e F2 line is a lso evaluated by integrat ing t h e local values of y l and y2*
D.4 References
D-I. Handbook of Chemistry and Physics, CRC Press, 56th Edition, 1975, p. F-78.
D-2. "Silica Gel Grade Chart and Application Guide," Davison Chemical Division, W. R. Grace and Co., Technical Bulletin ADS-16-373, Baltimore, MD.
D-3. Pesaran, A. A., "Moisture Transportation in Silica Gel Particles Bed," Ph.D. Disser- tation, School of Engineering, University of California at Los Angeles, 1983.
D-4. Sladek, K. J., E. R. Gilliland, and R. F. Baddour, "Diffusion on Surfaces, 11. Corre- lation of Diffusivities of Physically and Chemically Adsorbed Species," Ind. Eng. Chem. Fundam., Vol. 13, No. 2, 1974, pp. 100-105.
D-5. Ruthven, D. M., Principles of Adsorption and Adsorption Processes, New York: John Wiley and Sons, 1984, pp. 82-85.
D-6. Smith, C. W., and M. Dole, "Specific Heat of Synthetic High Polymers, VII. Polyeth- ylene Terephthalate," J. Polymer Science, Vol. 20, 1956, pp. 37-56.
D-7. Banks, P. J., "Coupled Equilibrium Heat and Single Adsorbate Transfer in Fluid Flow through a Porous Medium, I. Characteristic Potentials and Specific Capacity Ratios," Chem. Eng. Sci., Vol. 27, 1972, pp. 1143-1 155.
D-8. Banks, P. J., and D. J. Close, "Coupled Equilibrium and Single Adsorbate Transfer in Fluid Flow through a Porous Medium, 11. Predictions for Silica-gel Air-Drier using Characteristic Charts," Chem. Eng. Sci., Vol. 27, 1972, pp. 1157-1 169.
D-9. Maclaine-cross, I. L., "A Theory of Combined Heat and Mass Transfer in Regenerators," Ph.D. Thesis, Department of Mechanical Engineering, Monash University, 1974.
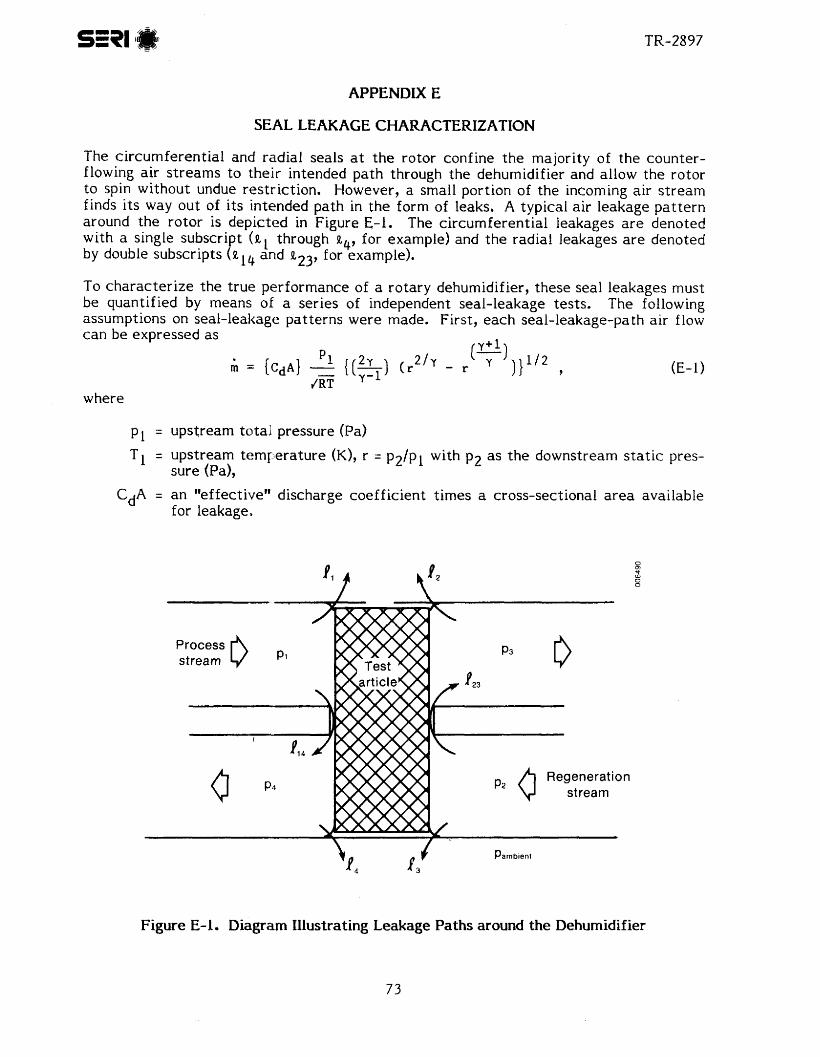
APPENDIX E
SEAL LEAKAGE CHARACTERIZATION
The c i rcumferent ia l and radial seals at t h e rotor confine t h e majori ty of t h e counter- flowing a i r s t r e a m s t o thei r intended path through t h e dehumidifier and allow t h e rotor t o spin without undue restr ict ion. However, a small portion of t h e incoming a i r s t r e a m finds i t s way ou t of i t s intended path in t h e form of leaks. A typical a i r leakage pa t t e rn around t h e ro tor is depic ted in Figure 6-1. The c i rcumferent ia l leakages a r e denoted with a single subscript ( a l through a4, for example) and t h e radial leakages a r e denoted by double subscripts ( e 1 4 and eZ3, for example).
To charac te r i ze t h e t r u e performance of a rotary dehumidifier, these seal leakages must be quantif ied by means o f a ser ies of independent seal-leakage tests. The following, assumptions on seal-leakage patterns were made. First, e a c h seal-leakage-path a i r flow c a n be expressed a s
P1 2 y = k d ~ l - - ( r (E-1) 2 / y - r
JRT where
P I = upstream total pressure (Pa)
T1 = upstream tempera tu re (K), r = p2/pI with p2 a s t h e downstream static pres- sure (Pa),
CdA = a n "effective" discharge coeff ic ient t imes a cross-sectional a r e a available fo r leakage.
Figure E-1. Diagram Illustrating Leakage Paths around the Dehumidifier
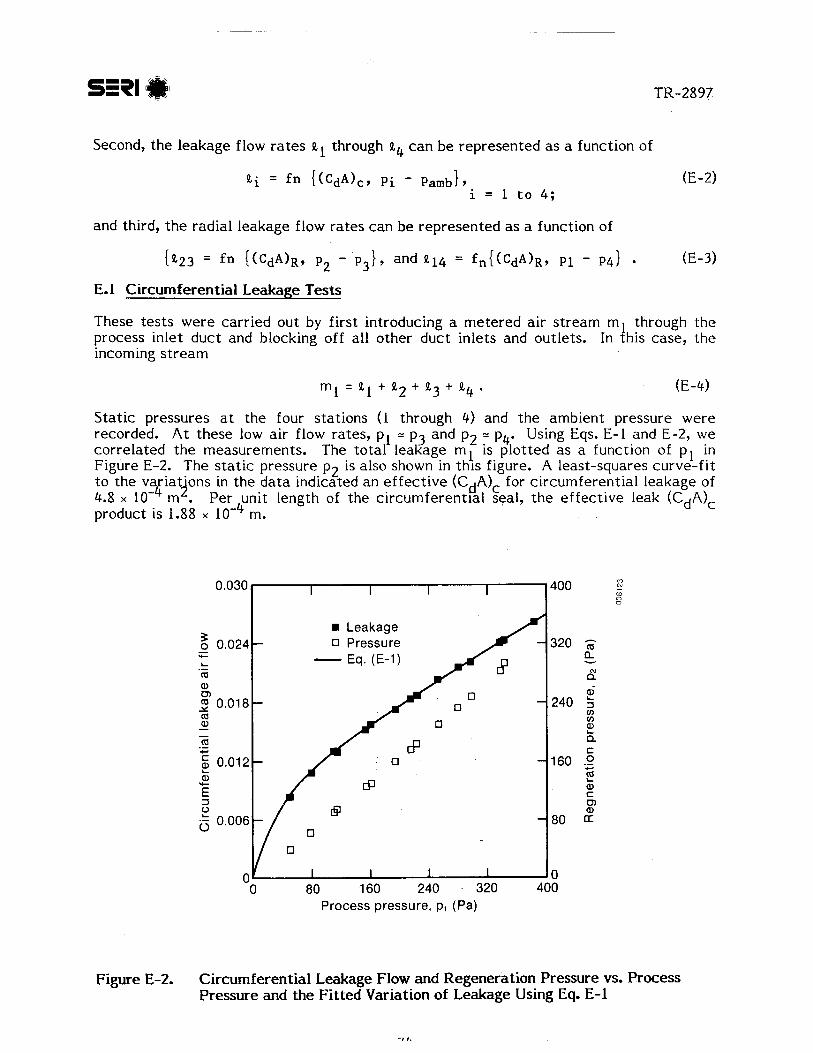
Second, t h e leakage flow r a t e s k l through g4 c a n be represented as a function o f
and third, t h e radial leakage flow ra tes can be represented as a function of
E.1 Circumferent ia l Leakage Tes t s
These t es t s were carr ied out by first introducing a mete red a i r s t r eam m l through t h e process inlet duc t and blocking off al l o ther duc t inlets and outlets. In this case, t h e incoming s t r e a m
Sta t i c pressures at t h e four stat ions ( I through 4) and t h e ambient pressure were recorded. A t these low a i r flow rates, p l - p3 and p2 p4. Using Eqs. E-1 and E-2, we correlated t h e measurements. The to ta l leakage m l 1s- plotted as a function of p l In Figure E-2. The s t a t i c pressure p2 is also shown in t h ~ s f ~ g u r e . A least-squares c u r v e - f ~ t t o t h e v r iat 'ons in t h e d a t a indicated a n e f fec t ive (CdA)c for circumferential leakage of 4.8 x 10% mi. Per unit length of t h e circumferential seal, t h e effect ive leak (CdA), product is 1.88 x m.
Pressure .,- L .- m Q) 0)
0.018 - m 0 - - cu n .-
L
al C 0)
- 8 0
" 0 80 160 240 - 320 400
Process pressure, p, (Pa)
Figure E-2. Circumferent ia l Leakage Flow and Regeneration Pressure vs. Process Pressure and t h e Fi t ted Variation of Leakage Using Eq. E-1
E.2 Radial Leakage Tests
The mete red air s t ream m l introduced through t h e process inlet duct was allowed t o exi t through t h e regeneration inlet duct. Pressures pl through p4 and t he ambient pressure pamb were again monitored.
For this arrangement, t he incoming flow can be expressed as
From t h e ear l ier circumferential leakage tests, e l through Q4 could then be estimated.
The sum of t h e radial leakages were then corre la ted as functions of t he appropriate pres- sure di f fe e n es to yield a n effect ive radial discharge coefficient t imes a r e a (CdA)R of 15.2 x lo-' m'. Per unit length of the radial seal, t h e effect ive (CdA) was found to be 9.35 10-4 m.
During t h e radial tests, we found t h a t t h e radial leakage is somewhat a function of the wheel seal position in relation t o t he seal plate, i.e., whether a single-seal strip is effec- tive or double str ips are. Therefore, d a t a were obtained for wheel positions when t he seal leakage is high (i.e., when bp between stations 1 and 4 is low) and when the seal leakage is low. The quoted (CdA)R represents an "average" leakage between t he low and high sealing positions of t he rotor.
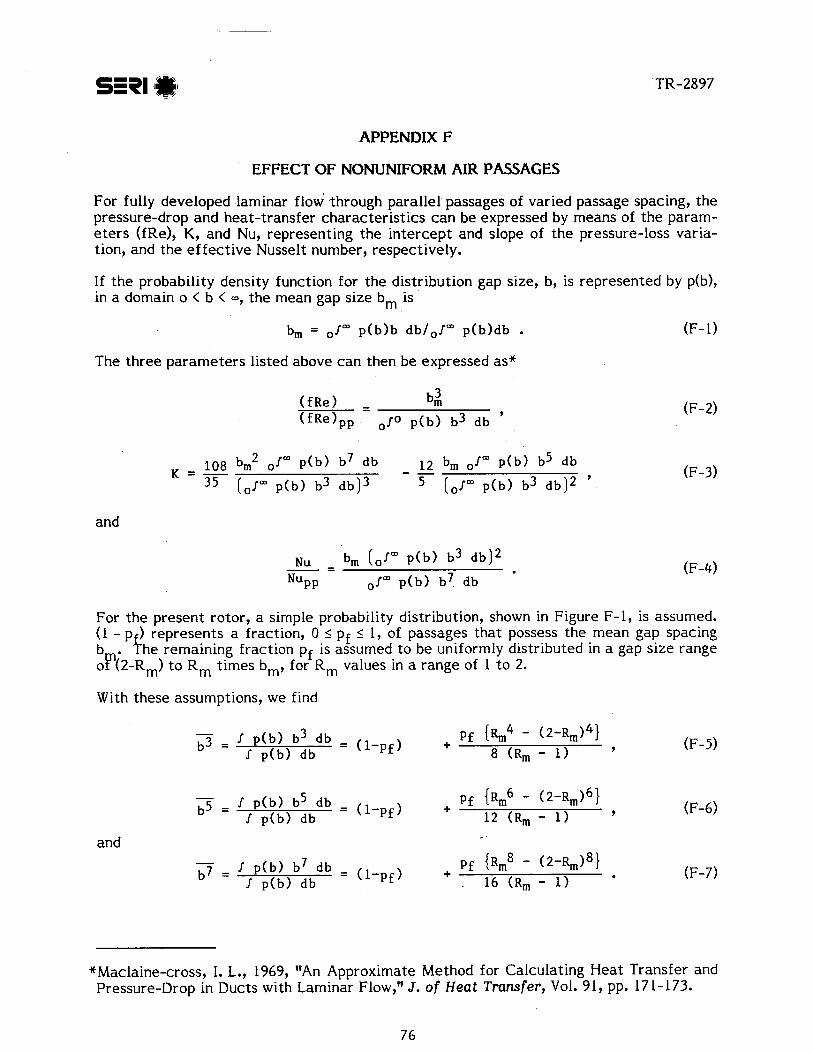
APPENDIX F
EFFECT OF NONUNIFORM AIR PASSAGES
For fully developed laminar flow through parallel passages of varied passage spacing, the pressure-drop and heat-transfer characteristics can be expressed by means of the param- e t e r s (fRe), K, and Nu, representing the intercept and slope of the pressure-loss varia- tion, and the effect ive Nusselt number, respectively.
If t he probability density function for the distribution gap size, b, is represented by p(b), in a domain o < b < m, the mean gap size bm is
The three parameters listed above can then be expressed as*
and
For t he present rotor, a simple probability distribution, shown in Figure F-I, is assumed. ( I - p ) represents a fraction, 0 < pf 5 1, of passages that possess the mean gap spacing b . t h e remaining fraction pf is assumed t o be uniformly distributed in a gap size range 0!?(2-~,) t o Rm times bm, for Rm values in a range of 1 t o 2.
With these assumptions, we find
and
"Maclaine-cross, I. L., 1969, "An Approximate Method for Calculating Heat Transfer and Pressure-Drop in Ducts with Laminar Flow," J. of Heat Transfer, Vol. 91, pp. 171-173.
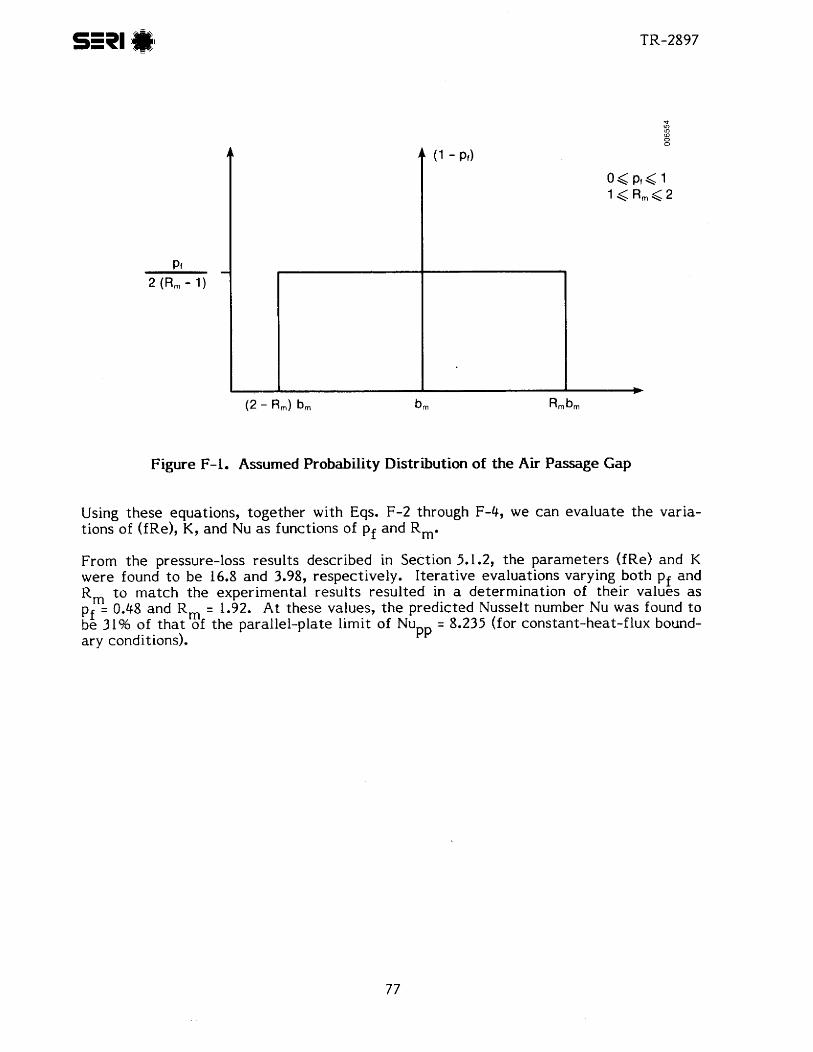
Figure F-1. Assumed Probability Distribution of the Air Passage Gap
Using these equations, together with Eqs. F-2 through F-4, we can evaluate t he varia- tions of (fRe), K, and Nu as functions of pf and R,.
From t h e pressure-loss results described in Section 5.1.2, the parameters (f Re) and K were found t o be 16.8 and 3.98, respectively. I terative evaluations varying both pf and R, to match t he experimental results resulted in a determination of their values as pf 0.48 and Rm 1.92. At these values, t he predicted Nusselt number Nu was found t o be 3 1% of t ha t of the parallel-plate limit of Nu = 8.235 (for constant-heat-flux bound- ary conditions). PP
srn APPENDIX G
RAW DATA PROCESSING PROCEDURE
Since finite circumferential and radial leaks exist at the rotor housing, t he recorded da ta must be corrected t o arrive at "true" measured rotor inlet and outlet conditions. Correc- tions must also be made for air carried over between s t reams (especially at high rota- tional speeds) and for heat loss through ducts from the measuring stations t o locations adjacent t o t he dehumidifier. The correction procedure t o accomplish this is described next.
The raw experimental da ta provide the following information for the process and regen- eration streams, respectively:
fil, fi2 dry-air flow rates t o t he rotor housing (kg/s)
t l , t2 inlet air temperatures (OC)
tdp19 tdp2 inlet a i r dew-point temperatures (OC)
t3' t4 outlet air temperatures (OC)
tdp39 tdp4 outlet air dew-point temperatures (OC)
APp, APr s ta t ic pressure difference across the dehumidifier (Pa)
'Ppo, 'Pro s ta t ic pressure difference across outlet flow metering nozzles (Pa).
In addition, ambient pressure, temperature, and dew points a r e also recorded a t each tes t condition.
(1) Estimates of s ta t ic pressures upstream and downstream of the rotor for each stream a r e found as
- Ppo - Pamb + 'ppo 9 (G- 1)
- Ppi - ppo + ApP (G-2)
and similarly,
Pro = Pamb + 'pro 9 (G-3)
- (G-4) P r i - Pro + 'Pr
(2) The circumferential leakages a l through Q4 a r e calculated a s in Appendix E.
(3) The direction of cross leakage between the two streams is determined by checking the sign of (p - pro) for Q14 and (pri - p .) for E Z 3 Positive signs for both these pressure d i f fgences indicate that the leaRagei e14 and ep3 a r e positive; i.e., leak- age occurs from the process inlet a r ea t o the regeneratlon outlet and from the regeneration inlet t o the process outlet.*
*For balanced flow, only positive cross leakage was found t o occur in all the t e s t da ta reported.
4 Based on the appropriate pressure difference, t he cross-leakage flow ra tes e l 4 and
'23 a re calculated (see Appendix E).
( 5 ) The dry a i r mass flow into the process and regeneration sides of t he t e s t ar t ic le a r e calculated as
and
( 6 ) The measured dew points a r e converted t o absolute humidity in terms of kg of vapor per kg of dry air, based on the s ta t ic pressure inferred in s tep I. The abso- lute humidities a r e now denoted by wl through w4.
(7) Since both a14 and e were found t o be positive for all the reported tes t condi- tions, the process anc??egeneration inlet conditions a r e the same a s those measured a t stations I and 2, respectively; i.e.,
and
(8) From the downstream seals, an additional air leak out of the housing causes the mass flow at measurement stations 3 and 4 t o be, respectively,
and
h4 = ti, - $4 f %14 . (9) The measured temperatures at stations 1 through 4 a r e corrected for heat loss from
the ducts t o arrive a t temperatures at the dehumidifier's entry and exit.
(10) For high-speed tests, the process and regeneration outlet conditions a r e also cor- rected for air carried over from one side t o the other.
and h represent the t rue rotor outlet temperature, humidity, and $spectively, then the mass and enthalpy balance for the mixing
of the cross-leakage stream from the regeneration inlet yields
and
(G- 12)
Here, hg is the specific enthalpy at station 3.
Equations G-11 and G-12 a r e then solved t o arrive at wpo and hpo; tpo can readily be found from w and h
PO PO*
(12) A similar se t of calculations, described in s tep 11, is repeated for the regeneration side t o arrive at the t rue rotor outlet temperature, humidity, and enthalpy, namely, tro, wro, and hro, respectively.
(13) Estimates of heat loss through the ducts from the measurement stations t o loca- tions adjacent t o the dehumidifier a r e made; the temperatures of the air s t ream a t all four locations a r e revised. All steps through s tep 13 a r e repeated until a con- vergence t o within t 0 .02 '~ of all temperatures is achieved.
(14) Energy and mass balances across the dehumidifier a r e then made t o verify the cal- culations and the experimental data t o ensure overall balance errors of less than 2%.
The experimental data reported in Appendix B represent the t rue rotor inlet and outlet conditions for both streams.
APPENDIX H
DETAILED OPERATING PROCEDURE
The following is a short description of t he experimental procedure, assuming t ha t t he operator is s tar t ing the loop from i ts overnight shutdown. When the system is l e f t unattended overnight, power t o the main system components is turned off at t he main breaker panels. To s t a r t t he system, t he f i rs t s t ep is t o supply power t o these com- ponents. Four switches on t h e 480-V breaker panel provide power t o t he fans, heaters, and boiler, and a single switch on the 120-V breaker panel provides power t o t he boiler SCR control loop. The following is a list of additional switches and valves located adja- c en t t o t he components; i t is important t o ensure tha t they a r e a l l in the "on" position for system operation.
a Fans (same for both process and regeneration fans) - A large, enclosed switch t o connect power t o t he fan and t he Fincor variable-speed
controller - Switch to "auto" position and press run button
a 6-kW heater (process s t ream heater)
- "Door closing'' switch - 120-VAC switch t o connect power t o con tac te r s
a 35-kW hea te r (regeneration s t ream heater)
- "Door closing" switch - "Step no. 1" switch t o connect power t o con tac te r s
a Wheel drive - Onloff switch on KEPCO power supply t o power the drive motor - Archer AC adapter plugged in and s e t t o 4.5 V t o supply power for t h e optical
encoder
Boiler - Two switches t o connect power t o boiler SCR control loop - Water supply valve
Humidifiers (same for both process and regeneration humidifiers) - Compressed air valve open t o the pneumatic control valve - Steam valve from boiler open t o supply humidifier - Bleedvalve openslightly.
A t this point, t h e operator must check t ha t al l the instrumentation is connected and functioning properly. The sampling pumps in t h e four humidity sensing loops must be on, and checking t h e flow mete rs in these loops is a convenient way t o be sure they are. The thermocouple connectors and t h e lines t o t h e six differential-pressure transducers should also be checked visually. Mirrors inside each of the four humidity sensors should be cleaned every 4-6 weeks. This is the point in t h e procedure, before the hygrometers have been balanced, at which t he mirrors should be cleaned. Finally, the five hygrometers (including t he ambient hygrometer) a r e balanced, and t he differential pressure trans- ducers a r e zeroed (on t h e DAS control panel for PI-P4, and at t he transducer for P5-P7). Ambient temperature and pressure a r e read and recorded from a thermometer and
barometer on the east wall of t he laboratory and checked against t he thermocouple thermometers (now reading approximately ambient temperature) and P7 (the ambient pressure).
If d a t a a r e t o be saved on a diskette, a diskette with enough space for a day's da ta must be inserted in drive B of t he IBM PC. This is the best t ime t o check how much space is remaining. If less than 100 kilobytes a r e available, i t is advisable t o use a new diskette. The IBM Basic da ta acquisition program "JPDAS" can then be loaded and run.
The initial program prompt asks for t he correct date. Data files a r e named using the da t e given, so if da ta a r e being taken, i t is important that the da te be correct. The operator can then en te r up t o five experiments, specifying inlet temperatures, humidity ratios, mass flow rates, and wheel speeds for each experiment. W e have found i t con- venient t o enter five experiments: four for data-taking purposes, and the fifth a s a cooling-down period during which room air is circulated through the system. Typically, we have chosen values of 10 readings for pressure averages, 10 seconds for the da ta update interval, and 60 seconds for t h e printer and storage update interval.
Once an experiment has begun, the operator can be confident tha t t he temperature and mass flow ra tes specified will be reached within 5 minutes. But the experimenter must manually control the humidity ratios (from the keyboard) and the 'wheel speed ( a t the drive motor power supply). The humidity ratios can take up t o an hour t o come close t o t he specified conditions, i.e., with 0.0005 kg/kg above or below the specified humidity ratio.
The inlet and outlet temperatures, mass flow rates, humidity ratios, t he wheel speed, and the enthalpy and mass balance errors a r e updated as often as every 10 seconds on the CRT screen. A trend plot on a Leeds and Northrup strip char t t races t he inlet and outlet temperatures and dew-point temperatures. The operator remains in t he transient data routine until t he update screen shows low enthalpy and mass balance errors (+I%), and the trend plot shows the inlet and out le t conditions t o be in a steady state. As a rule of thumb for low and medium wheel speeds, once both of the conditions above have been me t for 15 minutes, the operator strikes the appropriate key t o enter the steady-state routine. The length of t ime spent in the steady-state routine depends on the wheel speed. At very low speeds, we allow at least four segments of the rotor t o rotate from one flow stream t o the other. Because of the periodic nature of the out le t s ta tes a t low wheel speeds, i t is important t o exit t he steady-state routine only a f t e r an integral num- ber of periods. At medium speeds, t he outlet s ta tes a r e much less periodic, and we nor- mally remain in the steady-state routine for 20 minutes before going on to the next experiment. As indicated earlier, da ta gathering for high speeds occurs over a much longer t ime interval.
At t he end of a series of tests, the da ta acquisition program is ended. All equipment and instruments a r e shut down in an order that is exactly the reverse of the start-up sequence.
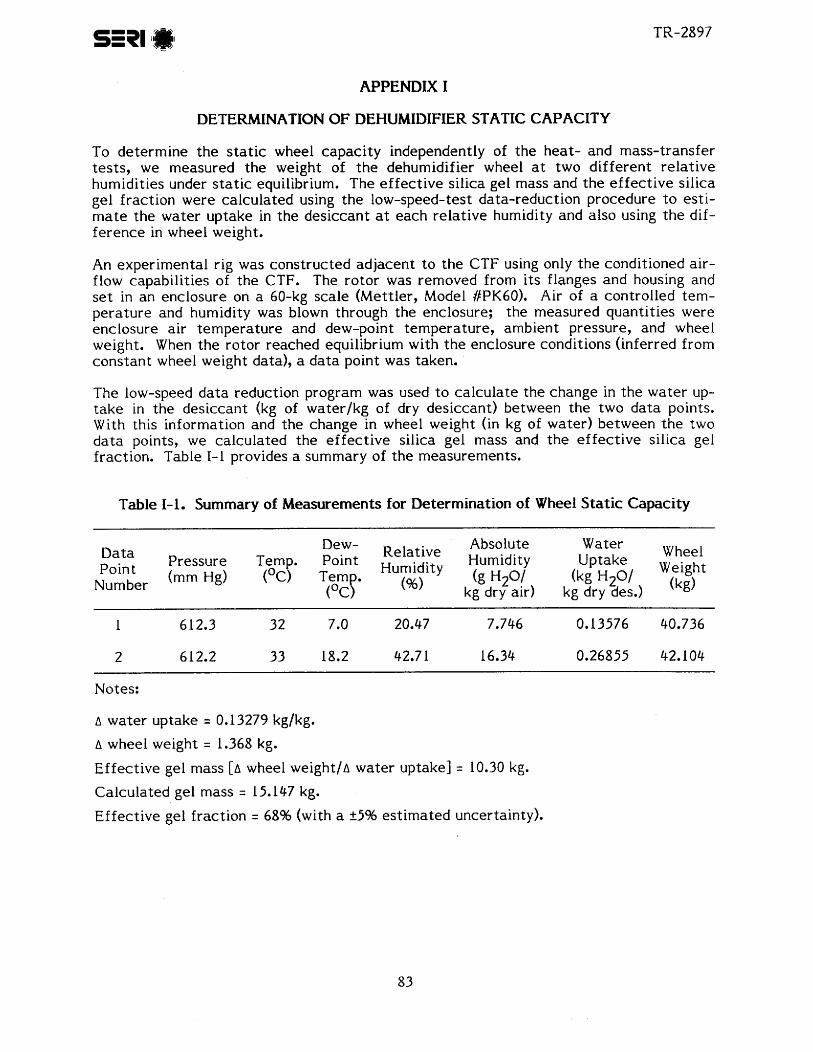
APPENDIX I
DETERMINATION OF DEHUMIDIFIER STATIC CAPACITY
To determine t h e s t a t i c wheel capaci ty independently of the heat- and mass-transfer tests, we measured t he weight of t h e dehumidifier wheel at two dif ferent re la t ive humidities under s t a t i c equilibrium. The effect ive silica gel mass and t h e e f fec t ive silica gel fraction were calculated using t he low-speed-test data-reduction procedure t o esti- mate the water uptake in the desiccant at each relative humidity and also using t h e dif- fe rence in wheel weight.
An experimental rig was constructed adjacent t o t he CTF using only t h e conditioned air- flow capabilities of the CTF. The rotor was removed from its flanges and housing and s e t in an enclosure on a 60-kg scale (Mettler, Model fPK60). Air of a controlled tem- perature and humidity was blown through the enclosure; the measured quanti t ies were enclosure a i r temperature and dew-point temperature, ambient pressure, and wheel weight. When t he rotor reached equilibrium with t h e enclosure conditions (inferred from constant wheel weight data), a da t a point was taken.
The low-speed da t a reduction program was used t o calculate the change in t he water up- t ake in the desiccant (kg of water lkg of dry desiccant) between the two da t a points. With this information and t he change in wheel weight (in kg of water) between t he two data points, we calculated the e f fec t ive silica gel mass and t h e e f fec t ive silica gel fraction. Table 1-1 provides a summary of t he measurements.
Table 1-1. Summary of Measurements for Determination of Wheel Static Capacity
Data Dew- Relative Humidity Absolute Pressure Temp. Point Humidity Water Wheel
Point (mm Hg) (OC) Temp. (g H20/ Uptake Weight Number (Oc)
(kg H z 0 1 (kg) (%) kg dry air) kg dry des.)
Notes:
A wa te r uptake = 0.13279 kg/kg.
A wheel weight = 1.368 kg.
Effective gel mass [A wheel w e i g h t l ~ water uptake] = 10.30 kg.
Calculated gel mass = 15,147 kg.
Effective gel fraction 68% (with a +5% est imated uncertainty).
SELECTED DISTRIBUTION LIST
William M. Anderson Anderson Consulting 7605 E. Windlawn Way Parker, C O 80134
Carl Bergt Trane Systems Engineering Co. 6200 Troup Highway Tyler, TX 757 11
Kennard L, Bowlen Cargocaire Engineering Corp. 79 Monroe St. Amesbury, MA 0191 3
Glen Chinery Tennessee Valley Authority 217 Power Board Bldg Chattanooga, TN 37401
James Coellner, Director R&E American Solar King Corp. 700 Loop 340 South Waco, TX 76710
Barry Cohen Thermal Products Division ThermoElectron Corporation 45 First Avenue Waltham, MA 02154
Kirk Collier, Ph.D. Ever scope, Inc. 4886 W. Port Au Prince Glendale, AZ 85306
Keith Davidson Gas Research Institute 8600 West Bryn Mawr Avenue Chicago, IL 60631
Jim Hill, Ph.D. National Bureau of Standards Technology B- 148 Washington, DC 20585
Michael Epstein Fauske & Associates, Inc. 162070 West 83rd S t ree t Burr Ridge, IL 60521
Phillip Fairey Florida Solar Energy Center 300 S t a t e Road, 401 Cape Canaveral, FL 32920
A. Hunter Fanney, Ph.D. Bldg. 226, Room B310 National Bureau of Standards Washington, DC 20234
Stephen D. Fitch Bry-Air P. 0. Box 795 Sunbury, OH 43074
Paul Gandhidasan, Ph.D. Dept. Mechanical Engineering Texas A&M University College Station, TX 77843
John Goldsmith U.S. Department of Energy Route CE-3 1 1, Room 5H065 1000 Independence Ave., S.W. Washington, DC 20585
William C. Griffiths Midland Ross Corporation P. 0. Box 791 New Brunswick, NJ 08903
R. Harkins ASES 2030 17th St. Boulder, C O 80302
Richard B. Hayter, Ph.D. Engineering Extension Ward Hall, Kansas S t a t e University Manhattan, KS 66506
Anthony Hines, Ph.D. College of Engineering Oklahoma Sta te University Stillwater, OK 74078
Ralph Johnson NAHB Research Foundation, Inc. 3720 T St., N.W. Washington, DC 20007
Robert Jones Los Alamos National Lab P.O. Box 1663 Mail Stop H577 Los Alamos, NM 87545
K. LaPorta SEIA 1156 15th St., N.W., Suite 520 Washington, DC 20005
Zalman Lavan, Ph.D. Illinois Insti tute of Technology Department of Mechanical Engineering Illinois Insti tute of Technology
Center Chicago, IL 60616
Robert LeChevalier U.S. Depar tment of Energy San Francisco Operations Off ice 1333 Broadway Oakland, CA 946 12
George 0. G. Lof, Ph.D. Colorado S t a t e University Solar Energy Applications Lab For t Collins, CO 80523
John Mitchell, Ph.D. University o f . Wisconsin-Madison Engineering Research Building 1500 Johnson Drive Madison, W I 53706
Jeff Morehouse Department of Mechanical Engineering University of South Carolina Columbia, SC 29208
Frederick Morse, Ph.D. U.S. Department of Energy Route CE-3 1, Room 5H-095 1000 Independence Ave., S.W. Washington, DC 20585
Stanley A. Mumma 104 Engineering !'AA" Building University Park, PA 16802
Yves 0. Parent Res. Eng. Industrial Chemicals Research Davison Chemical Division W. R. Grace & Co. Washington Research Center 7379 Route 32 Columbia, MD 2 1044
David Pellish Solar Buildings Technology Division Off ice of Solar Heat Technology U.S. Depar tment of Energy Forrestal Building, Room 5H-04 1 1000 independence Ave., S. W. Washington, DC 20585
D. M. Ruthven, Ph.D. University of New Brunswick P. 0. Box 4400 Fredericton, N.B. Canada E58 3A3
William Seaton ASHRAE 1791 Tullie Circle, NE Atlanta, GA 30329
M. Wahlig, Ph.D. Lawrence Berkeley Laboratories University of California I Cyclotron Berkeley, CA 94720
Alex Willman ACEC Resource and Management
Foundation 1015 15th Street , N.W. Washington, DC 20005
Byard Wood, Ph.D. Department of Mechanical & Aerospace
Engineering Arizona S t a t e University Tempe, AZ 85287
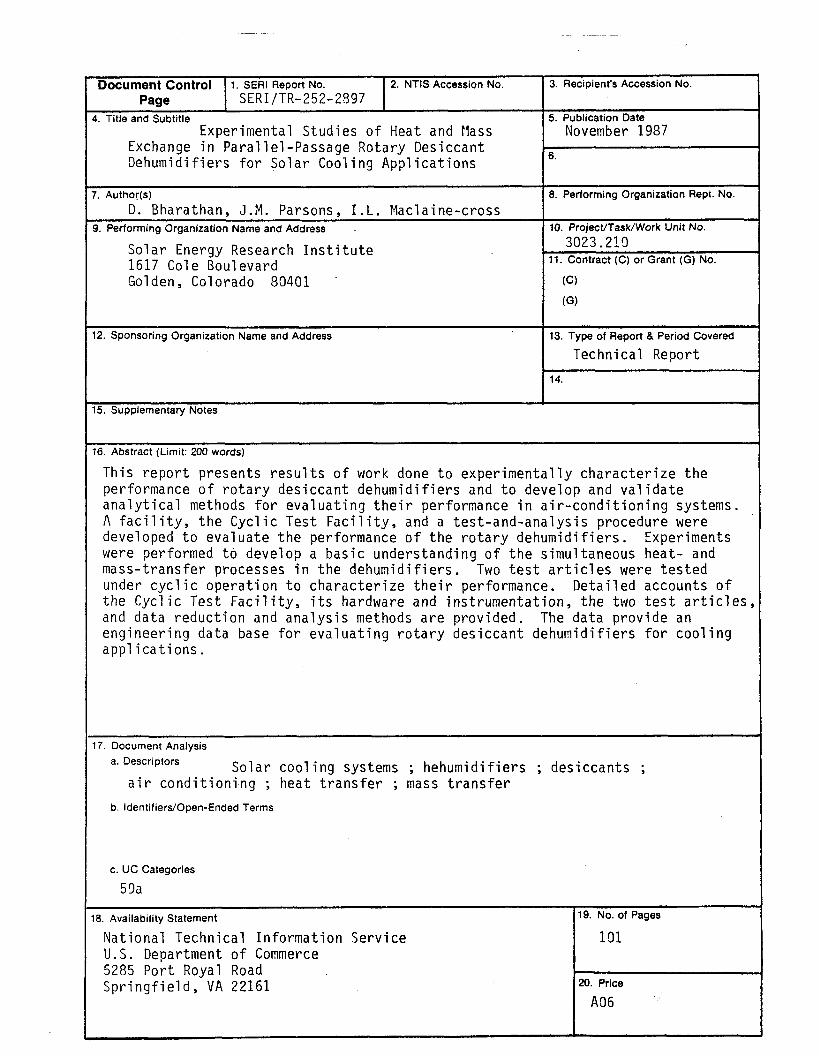
3. Recipient's Accession No.
5. Publication Date November 1987
6.
8. Performing Organization Rept. No.
10. Project/Task/Work Unit No.
3023.219 11. Contract (C) or Grant (G) No.
(C)
(GI
13. Type of Report 8. Period Covered
Technical Report
14.
Document Conttol Page
4. Title and Subtitle Experimental Studies of Heat and Hass
Exchange in Para1 le l -Passage Rotary Desiccant Dehumidifiers for Solar Cooling Applications
7. Author@)
D . Bharathan, J.M. Parsons, I.L. Maclaine-cross 9. Performing Organization Name and Address .
Solar Energy Research Ins t i tu te 1617 Cole Boulevard Golden, Colorado 80401 -
12. Sponsoring Organization Name and Address
15. Supplementary Notes
1. SERl Report No. SERI/TR-252-2897
16. Abstract (Limit: 200 words)
This report presents resul ts of work done t o experimentally characterize the performance of rotary desiccant dehumidifiers and to develop and validate analytical methods for evaluating the i r performance in air-conditioning systems. A f a c i l i t y , the Cyclic Test Faci l i ty , and a test-and-analysis procedure were developed t o evaluate the performance of the rotary dehumidifiers. Experiments were performed t o develop a basic understanding of the simultaneous heat- and mass-transfer processes in the dehumidifiers. Two t e s t a r t i c l e s were tested under cyclic operation t o characterize the i r performance. Detailed accounts of the Cyclic Test Facili ty, i t s hardware and instrumentation, the two t e s t a r t i c l e s , a n d data reduction and analysis methods are provided. The data provide an engineering data base for evaluating rotary desiccant dehumidifiers for cool i n g appl ications.
17. Document Analysis a. Descriptors Solar cooling systems ; hehumidifiers ; desiccants ;
a i r conditioning ; heat transfer ; mass transfer
b. Identifiers/Open-Ended Terms
c. UC Categories
5 3a
2. NTlS Accession No.
18. Availability Statement
National Technical Information Service U.S. Department of Commerce 5285 Port Royal Road Springfield, VA 22161
19. No. of Pages
1111
20. Price
A06


![UNSTEADY NATURAL CONVECTION BOUNDARY LAYER HEAT AND MASS ...scientificadvances.co.in/admin/img_data/690/images/[2] JPAMAA... · ... heat and mass transfer ... LAYER HEAT AND MASS](https://img.pdfslide.us/doc/110x75/5b3f0ca47f8b9a2f138ba06b/unsteady-natural-convection-boundary-layer-heat-and-mass-2-jpamaa-.jpg)