Embed Size (px)
Citation preview

www.3ieimpact.orgMarie M. Gaarder
Experimental and QuasiExperimental and Quasi--Experimental DesignsExperimental Designs
Marie M. Gaarder, Deputy Director, 3ieMarie M. Gaarder, Deputy Director, 3ie
PraguePragueJanuary 14, 2010January 14, 2010
International Initiative for Impact Evaluation
www.3ieimpact.orgMarie M. Gaarder
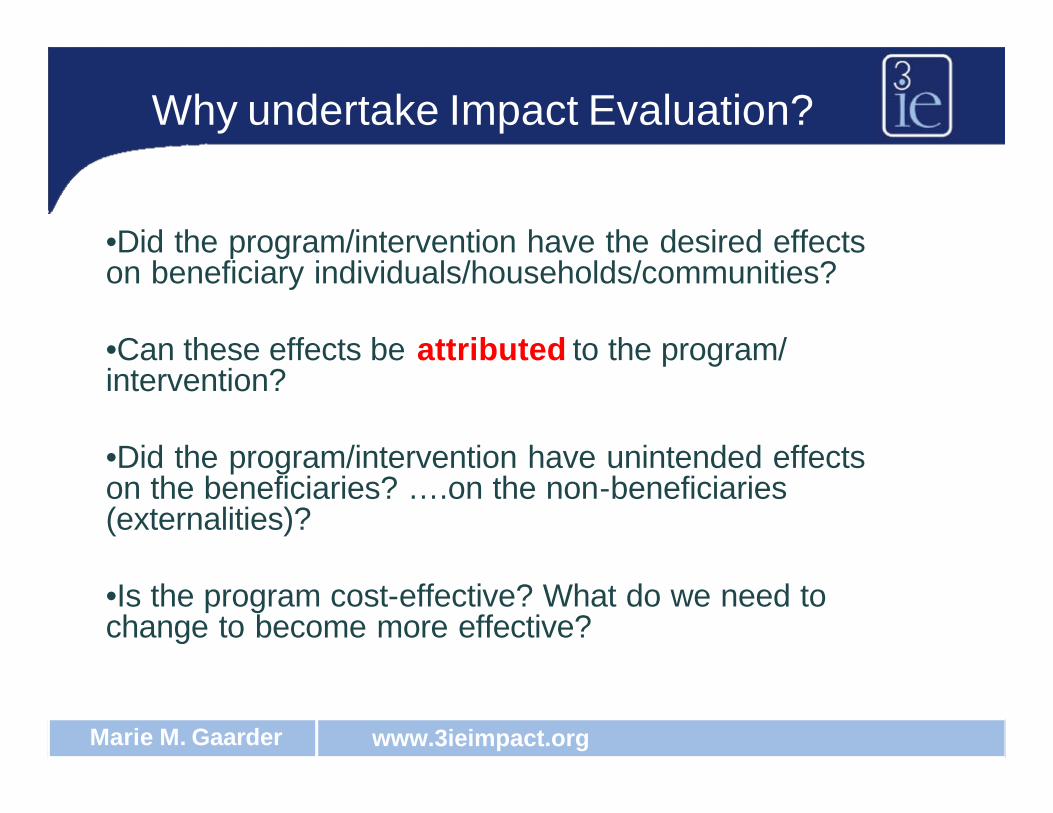
•Did the program/intervention have the desired effects on beneficiary individuals/households/communities?
•Can these effects be attributed to the program/ intervention?
•Did the program/intervention have unintended effects on the beneficiaries? ….on the non-beneficiaries (externalities)?
•Is the program cost-effective? What do we need to change to become more effective?
Why undertake Impact Evaluation?
www.3ieimpact.orgMarie M. Gaarder
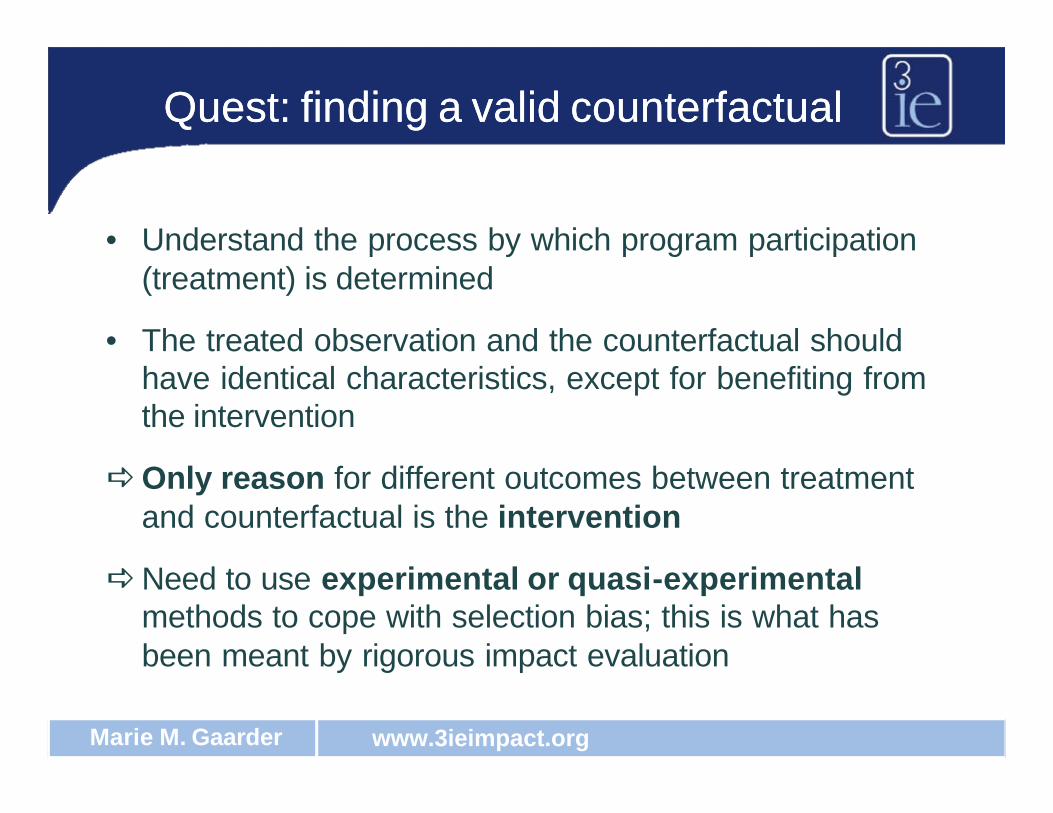
Quest: finding a valid counterfactualQuest: finding a valid counterfactual
• Understand the process by which program participation (treatment) is determined
• The treated observation and the counterfactual should have identical characteristics, except for benefiting from the intervention
aOnly reason for different outcomes between treatment and counterfactual is the intervention
aNeed to use experimental or quasi-experimental methods to cope with selection bias; this is what has been meant by rigorous impact evaluation
www.3ieimpact.orgMarie M. Gaarder
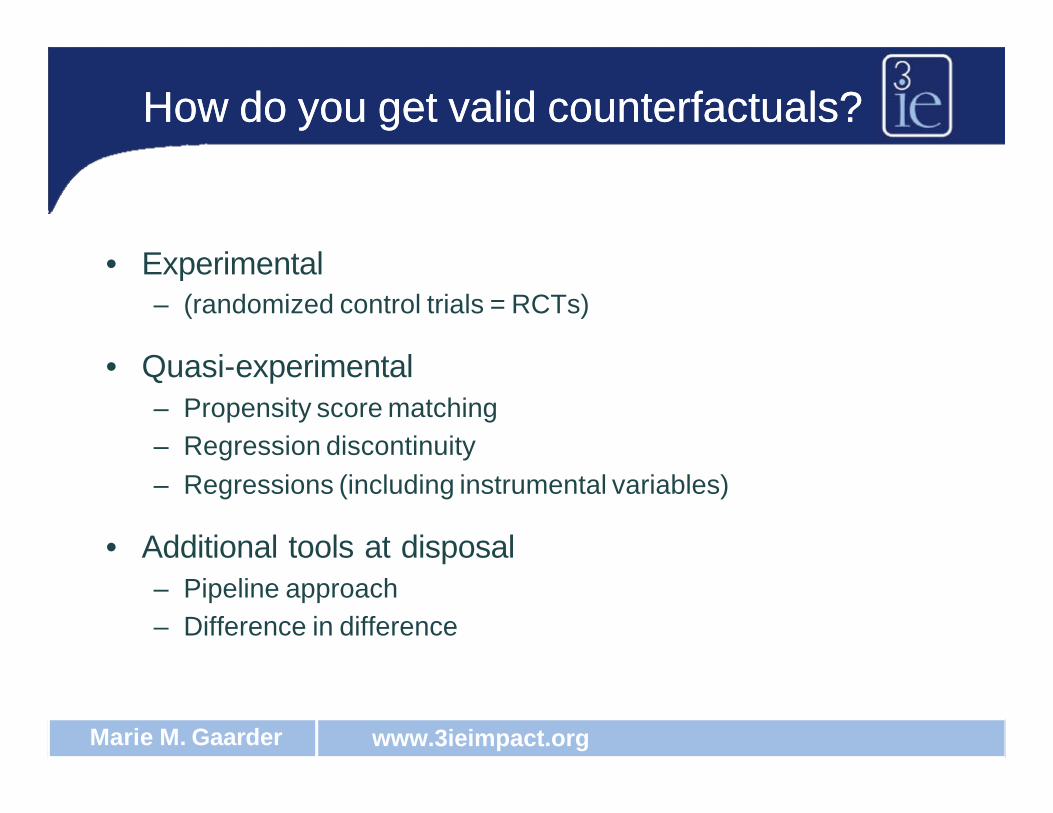
• Experimental – (randomized control trials = RCTs)
• Quasi-experimental– Propensity score matching– Regression discontinuity– Regressions (including instrumental variables)
• Additional tools at disposal– Pipeline approach– Difference in difference
How do you get valid counterfactuals?How do you get valid counterfactuals?
www.3ieimpact.orgMarie M. Gaarder
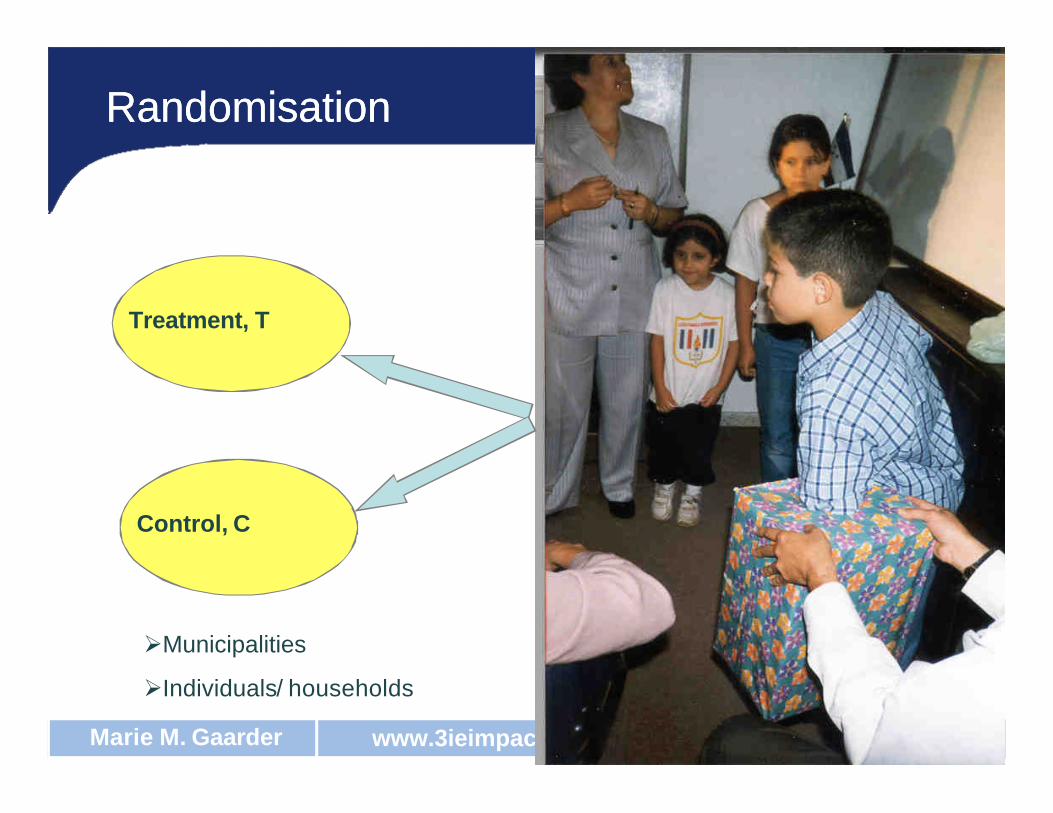
RandomisationRandomisation
Treatment, T
Control, C
ØMunicipalities
ØIndividuals/ households
www.3ieimpact.orgMarie M. Gaarder
• Randomization addresses the problem of selection bias by the random allocation of the treatment
• Randomization may not be at the same level as the unit of intervention– Randomize across schools but measure individual learning
outcomes– Randomize across sub-districts but measure village-level
outcomes
• The less units over which you randomize the higher your standard errors
• But you need to randomize across a ‘reasonable number’ of units
Randomization (RCTs)Randomization (RCTs)
www.3ieimpact.orgMarie M. Gaarder
• Can randomize across the pipeline
• Is no less ethical than any other method with a control group (perhaps more ethical)
• Any intervention which is not immediately universal in coverage has an untreated population to act as a potential control group
Issues in RandomizationIssues in Randomization
www.3ieimpact.orgMarie M. Gaarder
• Has to be an ex-ante design• Has to be politically feasible, and confidence that
program managers will maintain integrity of the design• Perform power calculation to determine sample size (and
therefore cost)• Adopt strict randomization protocol• Maintain information on how randomization done,
refusals and ‘cross-overs’• A, B and A+B designs (factorial designs)• Collect baseline data to:
– Test quality of the match– Conduct difference in difference analysis
Conducting an RCTConducting an RCT

www.3ieimpact.orgMarie M. Gaarder
When is randomization really not possible?When is randomization really not possible?
• The treatment has already been assigned and announced
• The program is over (retrospective)
• Universal eligibility and universal access
• Operational / political constraints
www.3ieimpact.orgMarie M. Gaarder
Example of RCT: PESExample of RCT: PES
Testing the Effectiveness of Payments for Ecosystem Services (PES) to Enhance Conservation in Uganda– Chimpanzees– Carbon sequestration
• Intervention: Local landowners receive financial compensation for conserving forest areas on their land and undertaking reforestation
• Evaluation design:– Objective: measure the causal effect of the PES scheme on the
rate of deforestation and socio-economic welfare– The PES scheme will randomly select villages (i.e. clustered
random sampling) among a pool of eligible villages– 400 local landowners will participate in the program– Control: similar number of landowners from the control villages
www.3ieimpact.orgMarie M. Gaarder
ExerciseExercise
• Is random assignment an option in your program?
• What is the level at which you would randomize? (Remember, this is not necessarily the same as the unit of intervention)

www.3ieimpact.orgMarie M. Gaarder
MatchingMatching
Treatment, T Comparison, C
Maria IvanJulia
Carlos DorisJose JuanLena
Matching on observable characteristics:
Gender, age, education, house with dirt floor, TV…
Propensity Score Matching:Estimation of probability of participating in the program given a range of observable
characteristics
BUT: BUT: possible selection bias (unobservables)
www.3ieimpact.orgMarie M. Gaarder
Types of matchingTypes of matching
• Nearest neighbor (allows ‘reuse’)
• Matching without replacement
• Radius matching (focus on distance between matched treated and control units)
• Kernel matching (treated observations matched with weighted average of all controls, with weights inversely proportional to the distance between the propensity scores of treated and controls)
• etc
www.3ieimpact.orgMarie M. Gaarder
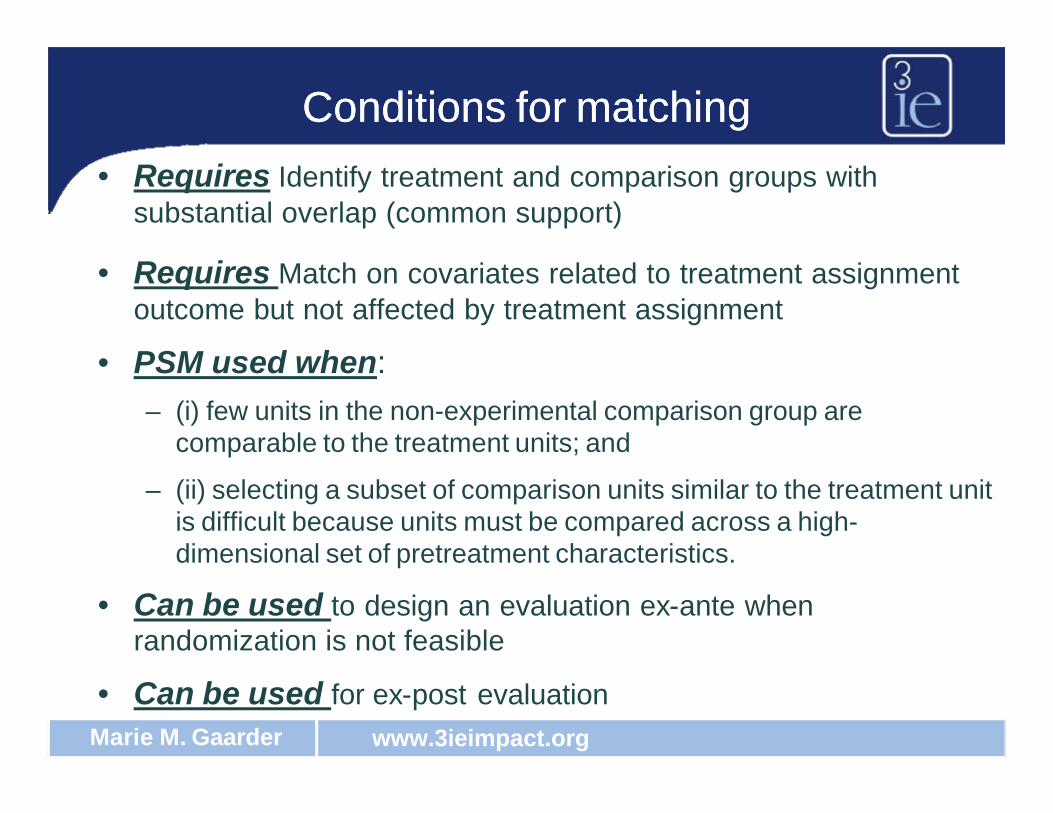
Conditions for matchingConditions for matching• Requires Identify treatment and comparison groups with
substantial overlap (common support)
• Requires Match on covariates related to treatment assignment outcome but not affected by treatment assignment
• PSM used when: – (i) few units in the non-experimental comparison group are
comparable to the treatment units; and
– (ii) selecting a subset of comparison units similar to the treatment unit is difficult because units must be compared across a high-dimensional set of pretreatment characteristics.
• Can be used to design an evaluation ex-ante when randomization is not feasible
• Can be used for ex-post evaluation
www.3ieimpact.orgMarie M. Gaarder
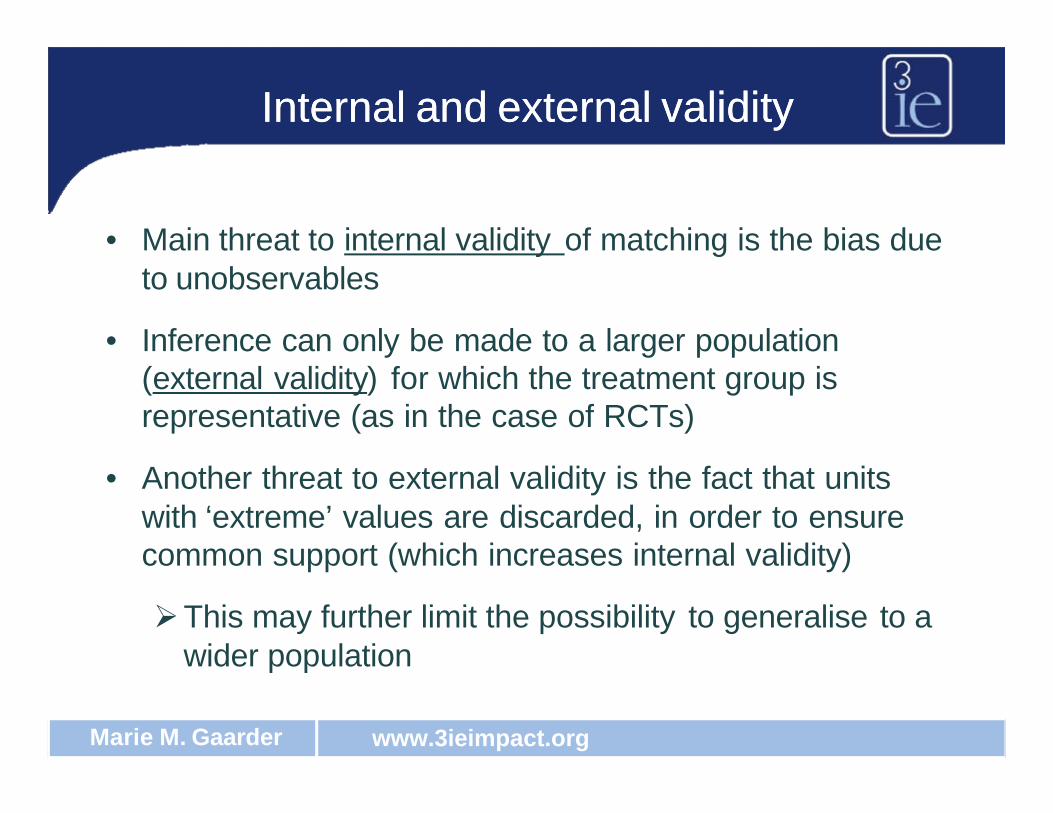
Internal and external validityInternal and external validity
• Main threat to internal validity of matching is the bias due to unobservables
• Inference can only be made to a larger population (external validity) for which the treatment group is representative (as in the case of RCTs)
• Another threat to external validity is the fact that units with ‘extreme’ values are discarded, in order to ensure common support (which increases internal validity)
ØThis may further limit the possibility to generalise to a wider population
www.3ieimpact.orgMarie M. Gaarder
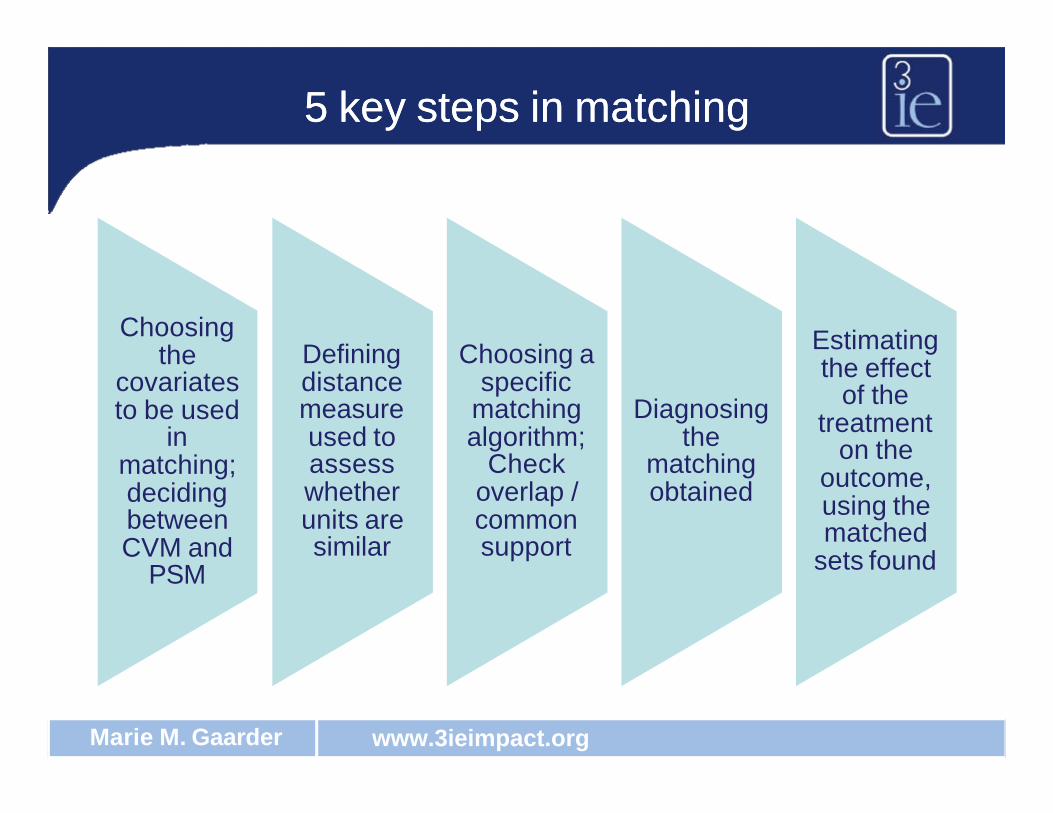
5 key steps in matching5 key steps in matching
Choosing the
covariates to be used
in matching; deciding between CVM and
PSM
Defining distance measure used to assess whether units are similar
Choosing a specific
matching algorithm;
Check overlap / common support
Diagnosing the
matching obtained
Estimating the effect
of the treatment
on the outcome, using the matched
sets found
www.3ieimpact.orgMarie M. Gaarder
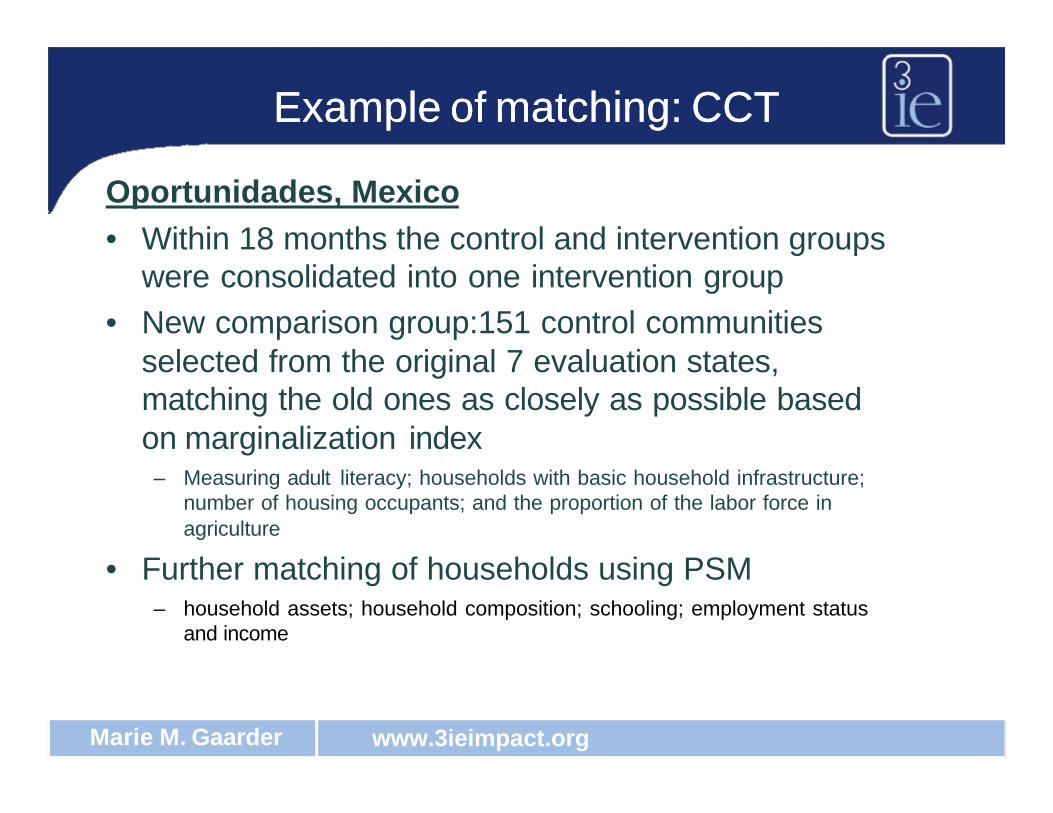
Example of matching: CCTExample of matching: CCT
Oportunidades, Mexico• Within 18 months the control and intervention groups
were consolidated into one intervention group • New comparison group:151 control communities
selected from the original 7 evaluation states, matching the old ones as closely as possible based on marginalization index
– Measuring adult literacy; households with basic household infrastructure; number of housing occupants; and the proportion of the labor force in agriculture
• Further matching of households using PSM– household assets; household composition; schooling; employment status
and income
www.3ieimpact.orgMarie M. Gaarder
ExerciseExercise
• What would be 4 good covariates to use for matching purposes in your program?

www.3ieimpact.orgMarie M. Gaarder
Regression Discontinuity DesignRegression Discontinuity Design
• It is a ‘design’, not a ‘method’, and relies on knowledge of the selection process
• Assignment to the treatment depends on a continuous score:– Potential beneficiaries are ordered by looking at the
score– There is a cut-off point for eligibility – clearly defined
criteria determined ex-ante– Cut-off determines the assignment to the treatment or
no-treatment groups
www.3ieimpact.orgMarie M. Gaarder
RDD cont.RDD cont.
• General idea: want to give any outcome difference around the cut-off a causal interpretation
• Assumption: in the absence of the intervention, the outcome-by-score profile would have been continuous at cut-off
• A fair enough interpretation: any ‘jump’ in the outcome is induced by participation, and would have not been there otherwise!
www.3ieimpact.orgMarie M. Gaarder
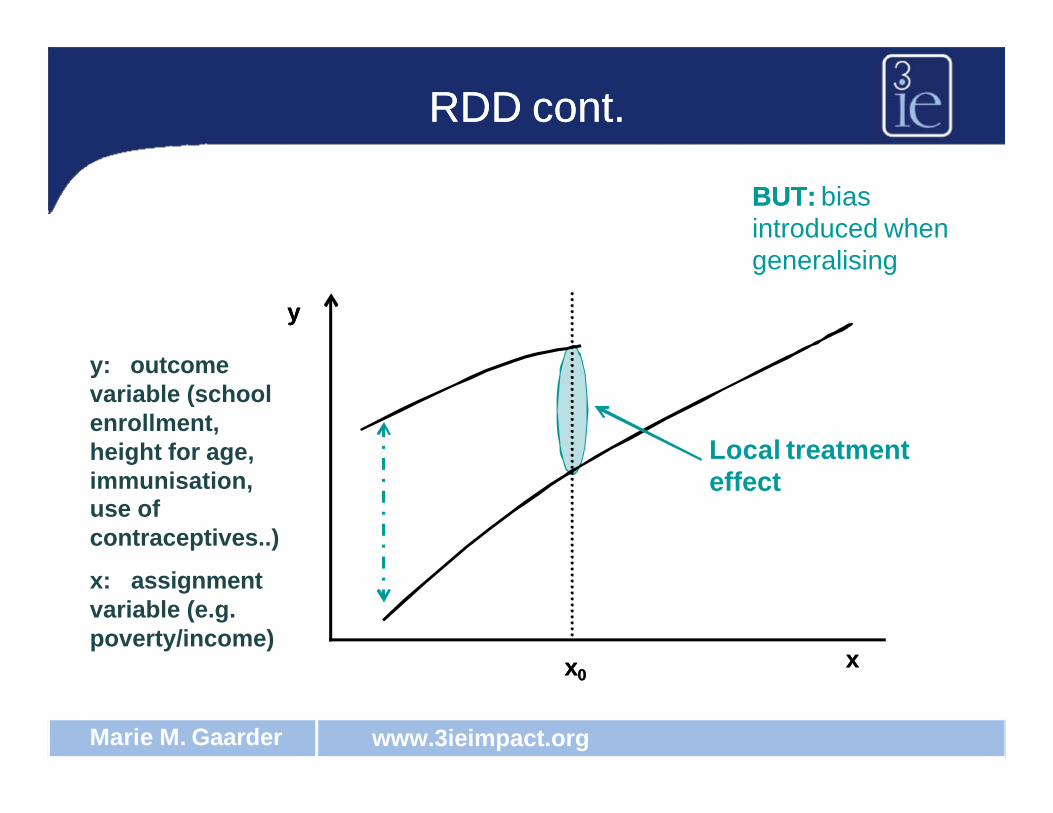
RDD cont.RDD cont.
yy
xxxx00
Local treatmenteffect
y: outcome variable (school enrollment, height for age, immunisation, use of contraceptives..)
x: assignment variable (e.g. poverty/income)
BUT: BUT: bias introduced when generalising
www.3ieimpact.orgMarie M. Gaarder
Limits to internal and external validityLimits to internal and external validity
• As good as an experiment, but only at cut-off
• The effect estimated is for individuals marginally eligible for benefits using individuals marginally excluded from benefits to define counterfactuals
Causal conclusions are limited to individuals/ Causal conclusions are limited to individuals/ households/localities at the cuthouseholds/localities at the cut--off off ––extrapolation beyond this point (whether to the extrapolation beyond this point (whether to the rest of the sample or to a larger population rest of the sample or to a larger population needs additional, often unwarranted, assumptionsadditional, often unwarranted, assumptions
www.3ieimpact.orgMarie M. Gaarder
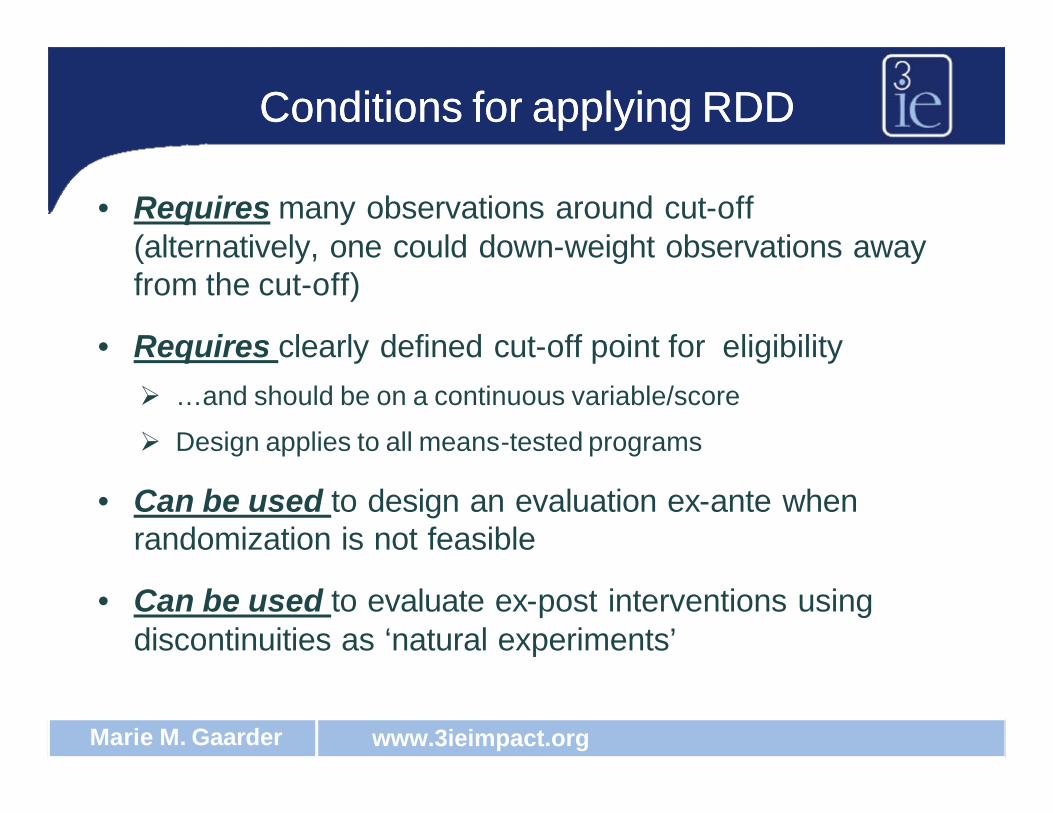
Conditions for applying RDDConditions for applying RDD
• Requires many observations around cut-off (alternatively, one could down-weight observations away from the cut-off)
• Requires clearly defined cut-off point for eligibilityØ …and should be on a continuous variable/score
Ø Design applies to all means-tested programs
• Can be used to design an evaluation ex-ante when randomization is not feasible
• Can be used to evaluate ex-post interventions using discontinuities as ‘natural experiments’
www.3ieimpact.orgMarie M. Gaarder
ExerciseExercise
• Identify a threshold rule (cut-off point) that you could apply in your program
www.3ieimpact.orgMarie M. Gaarder
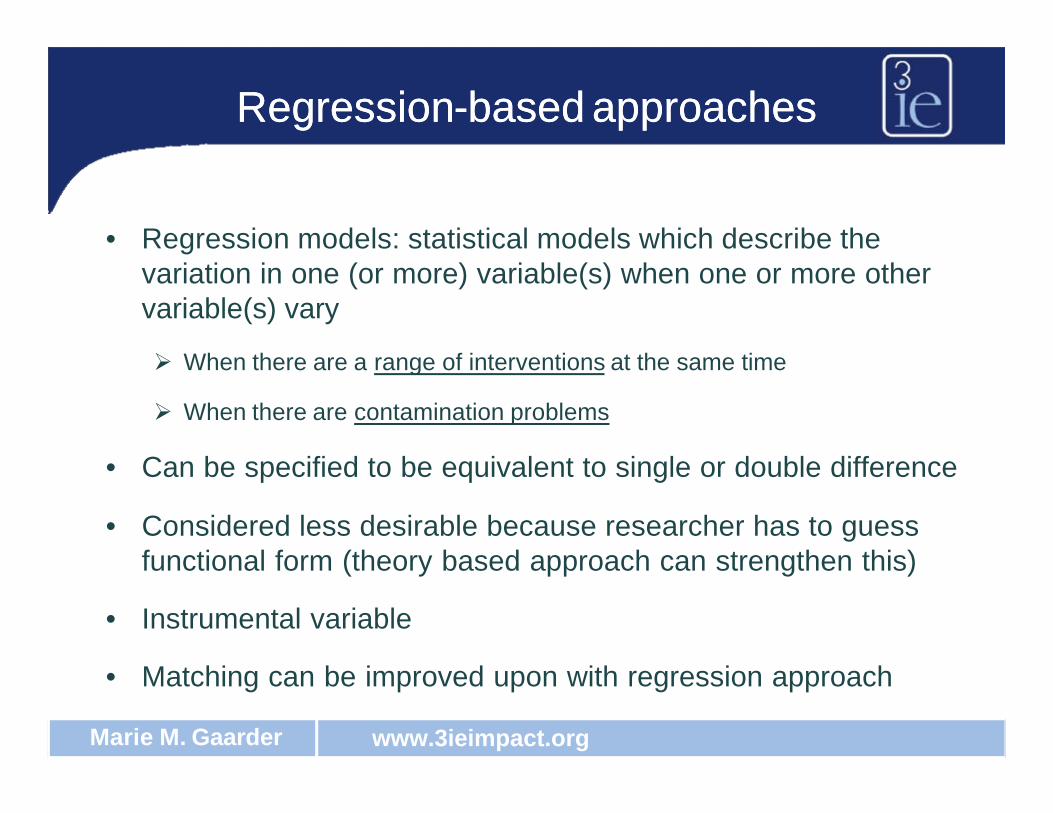
RegressionRegression--based approachesbased approaches
• Regression models: statistical models which describe the variation in one (or more) variable(s) when one or more other variable(s) vary
Ø When there are a range of interventions at the same time
Ø When there are contamination problems
• Can be specified to be equivalent to single or double difference
• Considered less desirable because researcher has to guess functional form (theory based approach can strengthen this)
• Instrumental variable
• Matching can be improved upon with regression approach
www.3ieimpact.orgMarie M. Gaarder
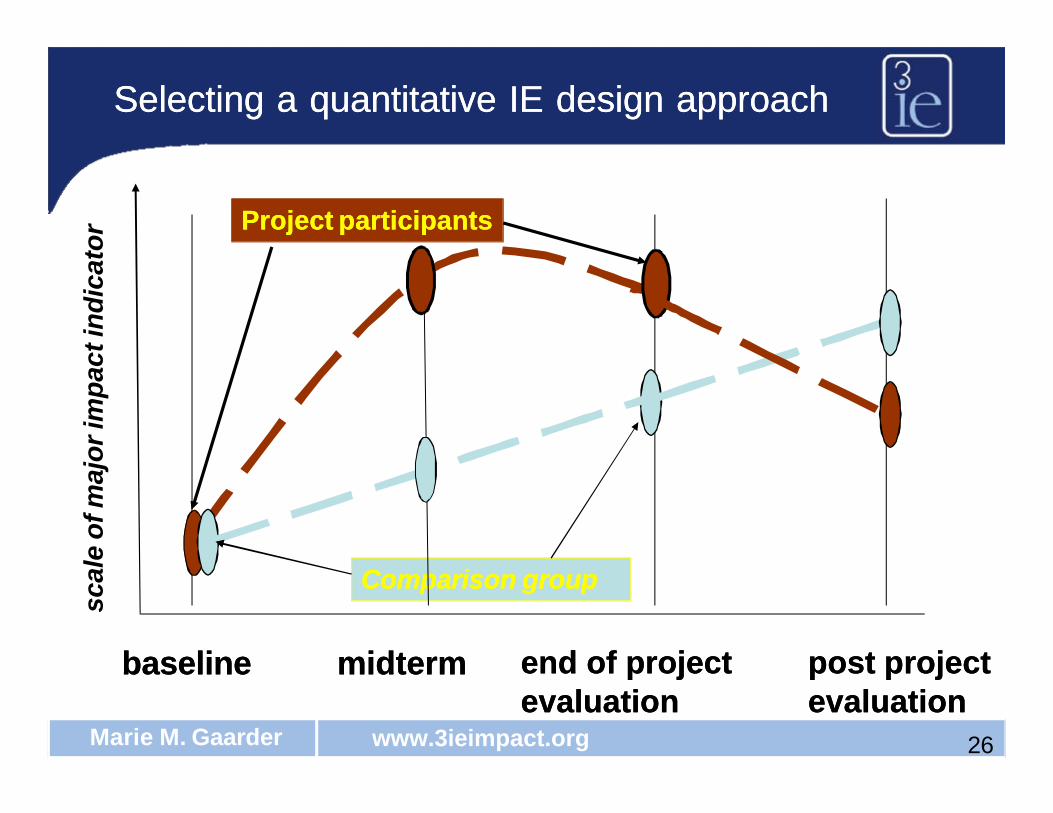
baselinebaseline end of project end of project evaluationevaluation
Project participantsProject participants
Comparison groupComparison group
post project post project evaluationevaluation
Selecting a quantitative IE design approachSelecting a quantitative IE design approachsc
ale
of m
ajo
r im
pac
t in
dic
ato
r
26
midtermmidterm
www.3ieimpact.orgMarie M. Gaarder
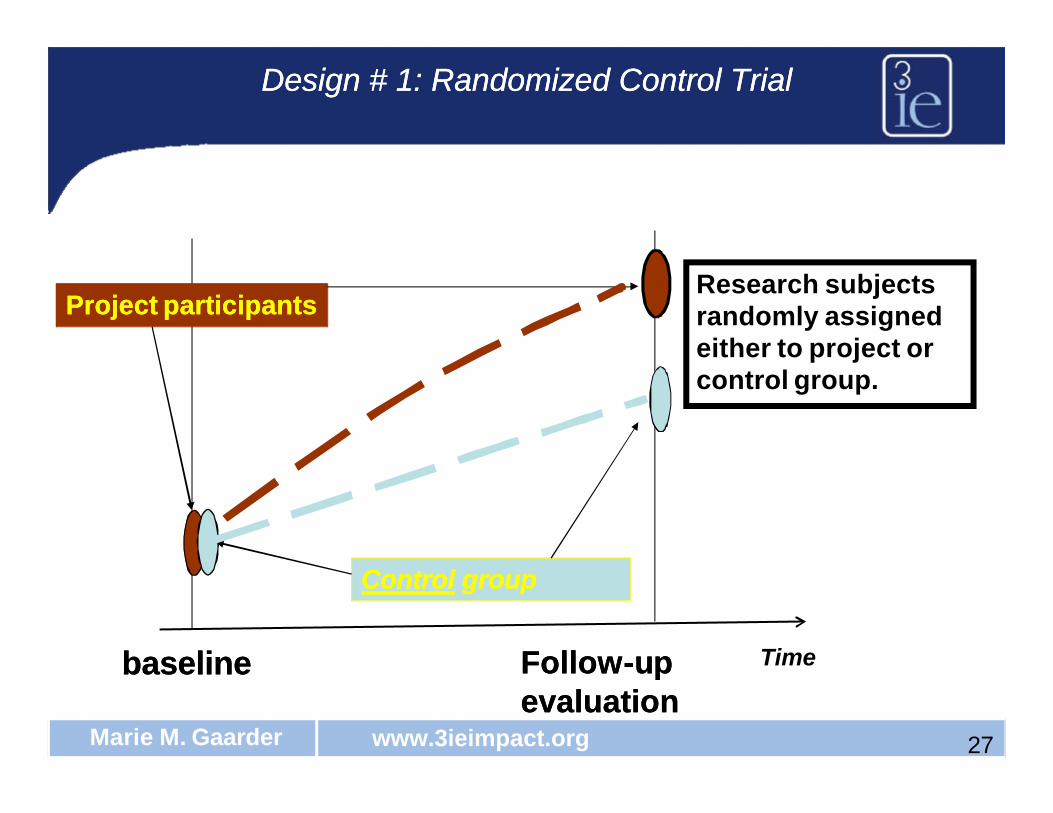
baselinebaseline FollowFollow--up up evaluationevaluation
ControlControl groupgroup
Design # 1: Randomized Control Trial Design # 1: Randomized Control Trial
Project participantsProject participants
27
Research subjects randomly assigned either to project or control group.
Time
www.3ieimpact.orgMarie M. Gaarder
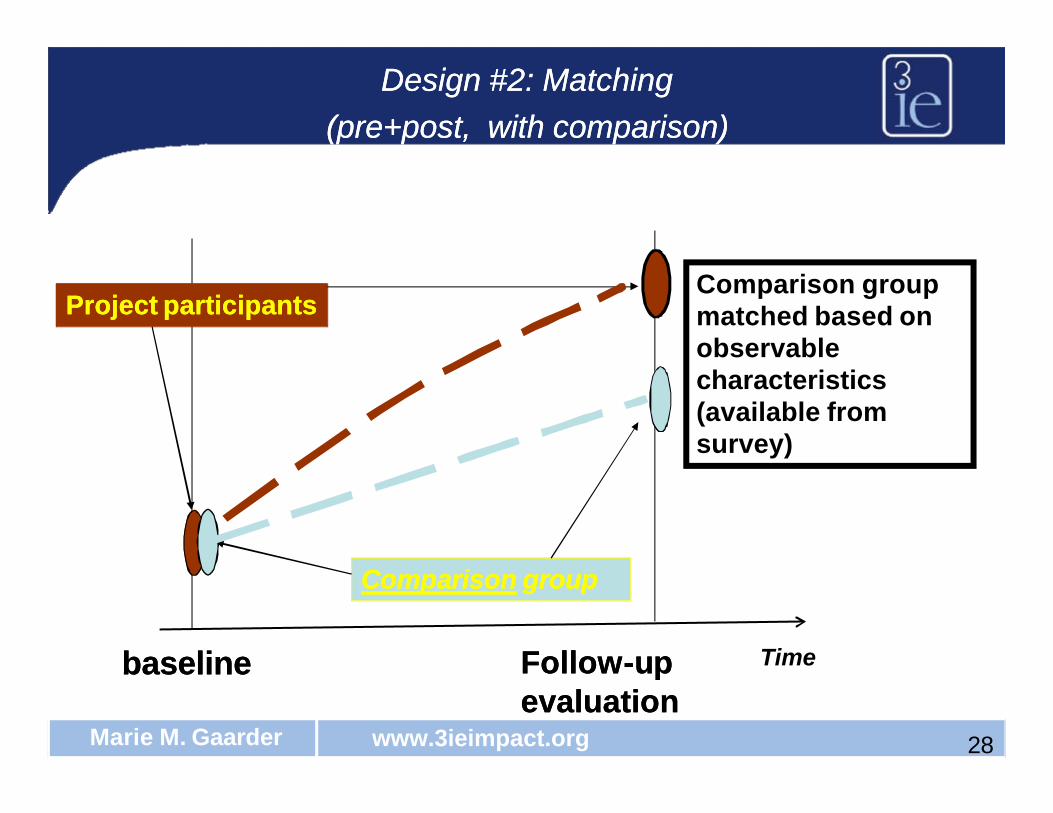
Design #2: Matching Design #2: Matching (pre+post, with comparison) (pre+post, with comparison)
28
baselinebaseline
ComparisonComparison groupgroup
Project participantsProject participants
FollowFollow--up up evaluationevaluation
Time
Comparison group matched based on observable characteristics (available from survey)
www.3ieimpact.orgMarie M. Gaarder
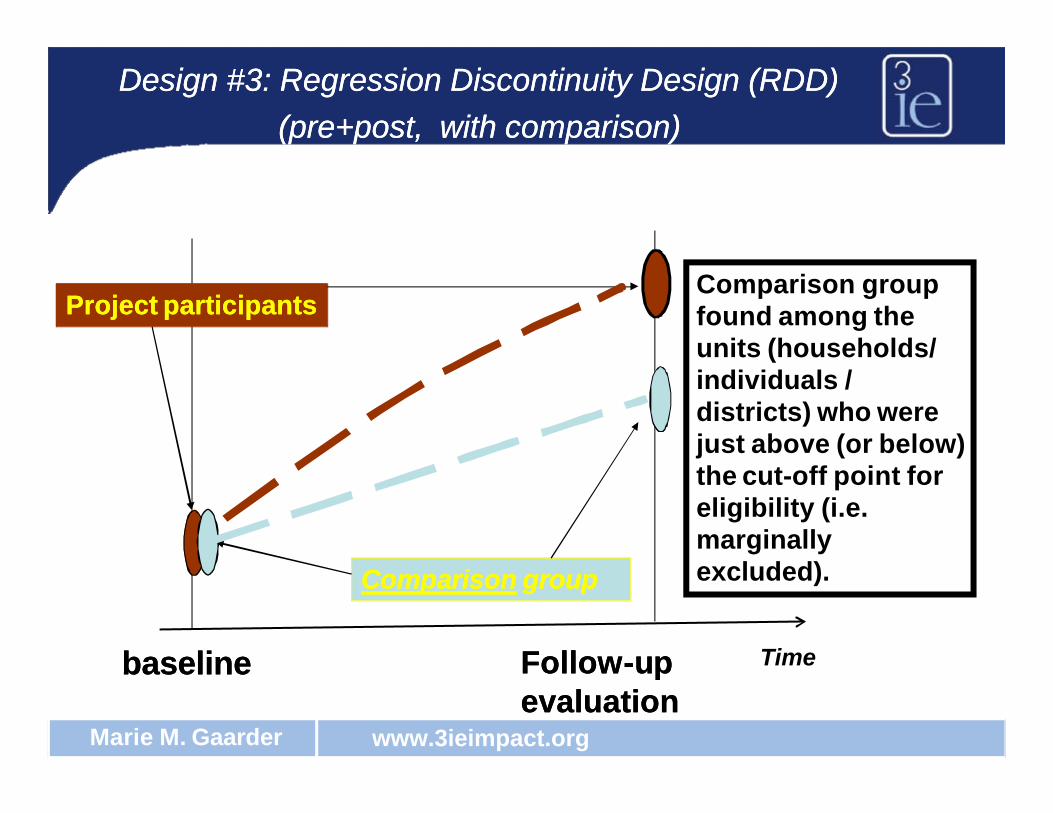
Design #3: Regression Discontinuity Design (RDD)Design #3: Regression Discontinuity Design (RDD)(pre+post, with comparison) (pre+post, with comparison)
baselinebaseline
ComparisonComparison groupgroup
Project participantsProject participants
FollowFollow--up up evaluationevaluation
Comparison group found among the units (households/ individuals / districts) who were just above (or below) the cut-off point for eligibility (i.e. marginally excluded).
Time
www.3ieimpact.orgMarie M. Gaarder
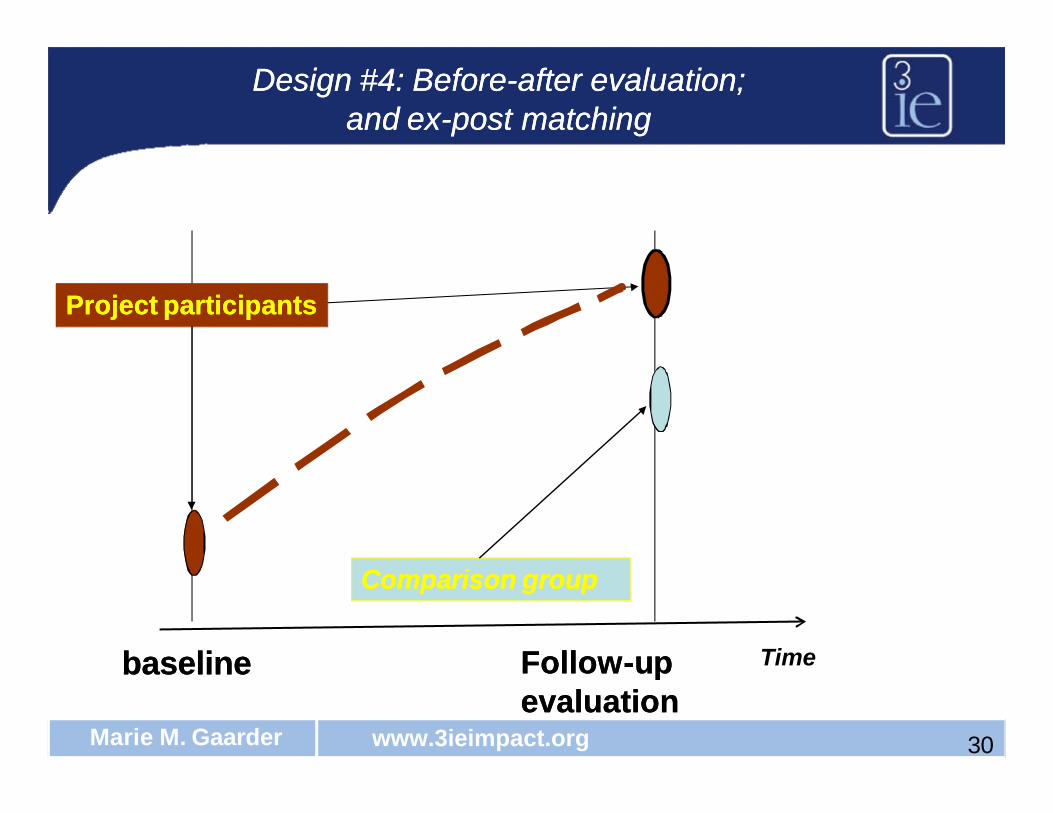
Design #4: BeforeDesign #4: Before--after evaluation; after evaluation; and exand ex--post matchingpost matching
30
baselinebaseline
Comparison groupComparison group
Project participantsProject participants
TimeFollowFollow--up up evaluationevaluation
www.3ieimpact.orgMarie M. Gaarder
Comparison groupComparison group
Project participantsProject participants
TimeFollowFollow--up up evaluationevaluation
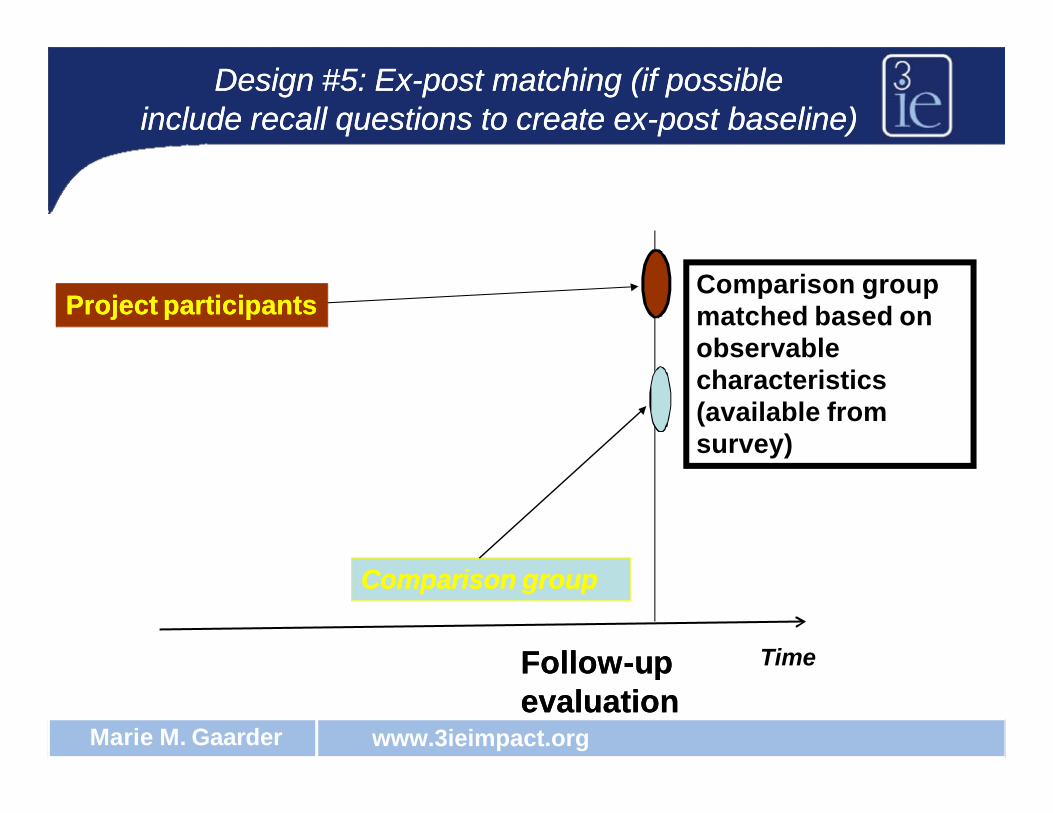
Design #5: ExDesign #5: Ex--post matching (if possible post matching (if possible include recall questions to create exinclude recall questions to create ex--post baseline)post baseline)
Comparison group matched based on observable characteristics (available from survey)
www.3ieimpact.orgMarie M. Gaarder
Comparison groupComparison group
Project participantsProject participants
TimeFollowFollow--up up evaluationevaluation
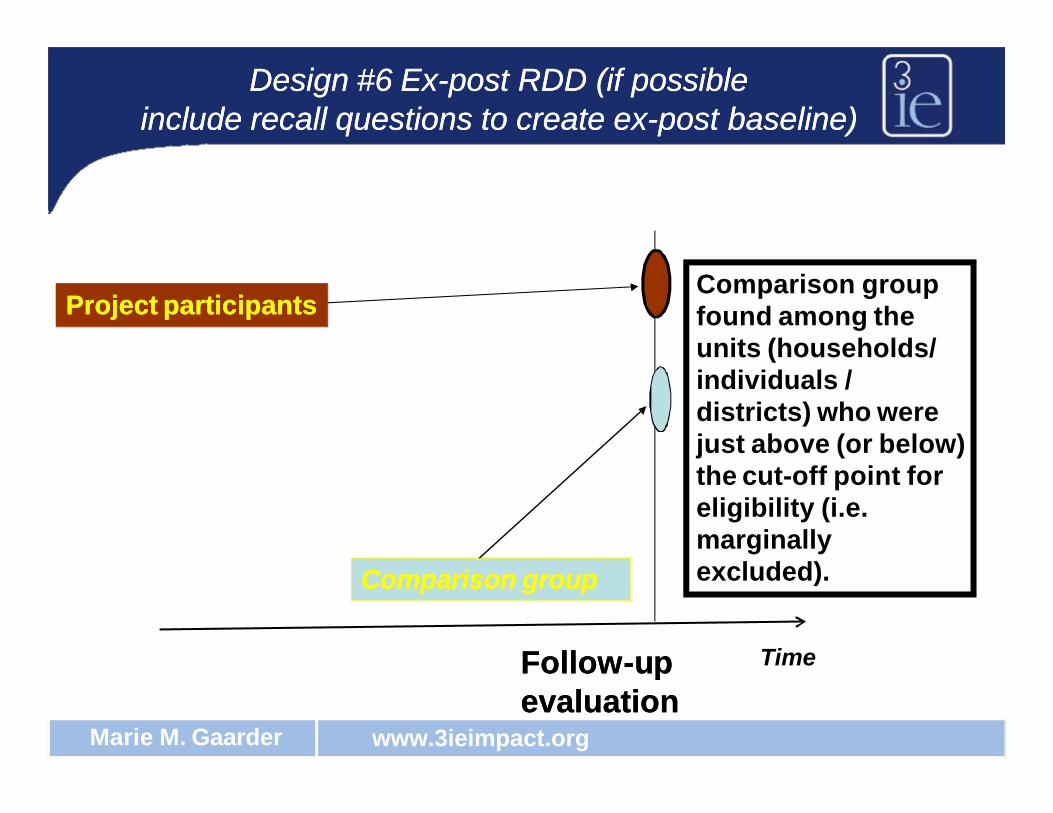
Design #6 ExDesign #6 Ex--post RDD (if possible post RDD (if possible include recall questions to create exinclude recall questions to create ex--post baseline)post baseline)
Comparison group found among the units (households/ individuals / districts) who were just above (or below) the cut-off point for eligibility (i.e. marginally excluded).

www.3ieimpact.orgMarie M. Gaarder
baselinebaseline
Design #7: Before and after evaluation Design #7: Before and after evaluation
Project participantsProject participants
33
TimeFollowFollow--up up evaluationevaluation
Case-study approach
www.3ieimpact.orgMarie M. Gaarder
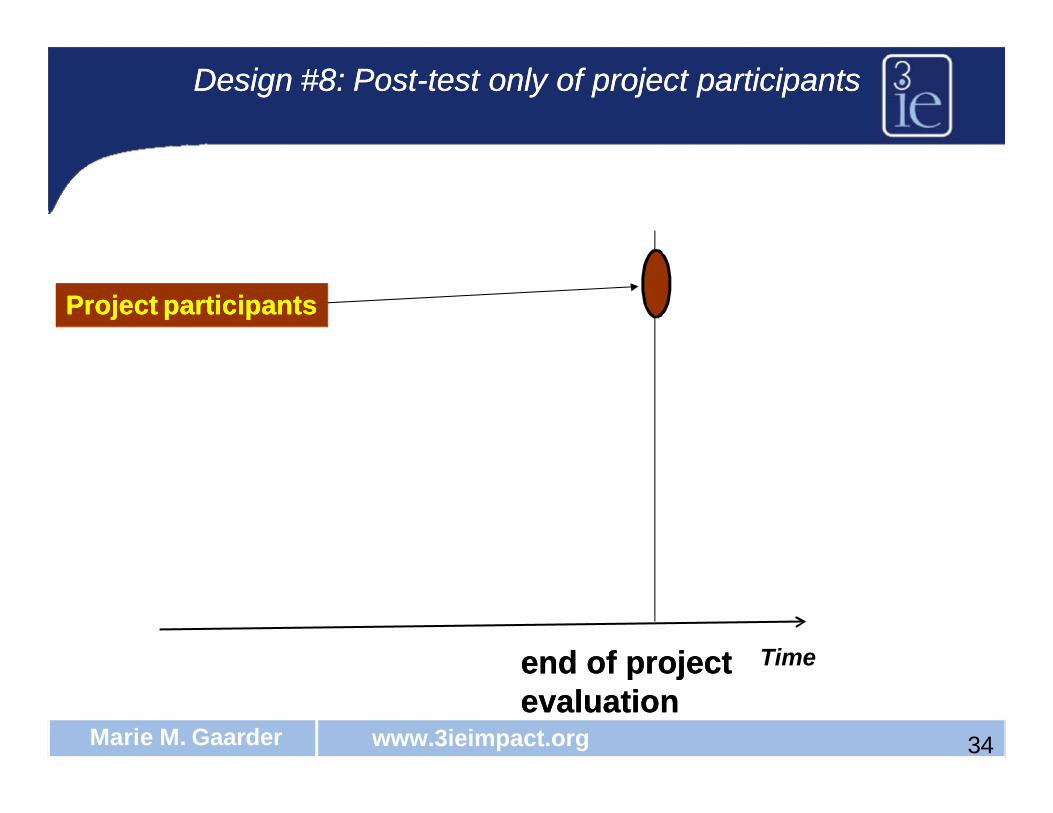
end of project end of project evaluationevaluation
Design #8: PostDesign #8: Post--test only of project participants test only of project participants
Project participantsProject participants
34
Time

www.3ieimpact.orgMarie M. Gaarder
baselinebaseline end of project end of project evaluationevaluation
Project participantsProject participants
Comparison groupComparison group
post project post project evaluationevaluation
Selecting a quantitative IE design approachSelecting a quantitative IE design approachsc
ale
of m
ajo
r im
pac
t in
dic
ato
r
35
midtermmidterm
www.3ieimpact.orgMarie M. Gaarder
ExerciseExercise
• What sort of quasi-experimental design seems appropriate for your program
www.3ieimpact.orgMarie M. Gaarder
Thank you
Visit:www.3ieimpact.org
International Initiative for Impact Evaluation
www.3ieimpact.orgMarie M. Gaarder
Annex AAnnex A
• Calculating sample size

www.3ieimpact.orgMarie M. Gaarder
Sample size for randomized evaluationsSample size for randomized evaluations
• How large does the sample need to be to credibly detect a given effect size?
• What does credibly mean? Measuring with a certain degree of confidence the difference between participants and non-participants
• Key ingredients: number of units (e.g. villages) randomized; number of individuals (e.g. households) within units; info on the outcome of interest and the expected size of the effect
www.3ieimpact.orgMarie M. Gaarder
Type 1 errorType 1 error
• First type of error: conclude that there is an effect when there is none
• The significance level of the test is the probability that you will falsely conclude that the program has an effect, when in fact it does not. So with a level of 5%, you can be 95% confident in the validity of your conclusion that the program had an effect
• For policy purpose, you want to be very confident in the answer you give: the level will be set fairly low. Common levels are 5%, 10%

www.3ieimpact.orgMarie M. Gaarder
Type 2 errorType 2 error
• Second type of error: fail to reject that the program had no effect, when it fact it does have an effect
• The power of a test is the probability that I will be able to find a significant effect in my experiment if indeed there truly is an effect
www.3ieimpact.orgMarie M. Gaarder
Practical stepsPractical steps
• Set a pre-specified significance level (5%)
• Set a range of pre-specified effect sizes (what you think the program will do). What is the smallest effect that would prompt a policy response?
• Decide for a sample size that allows to achieve a given power. Should not be lower than 80%. Intuitively, the larger the sample, the larger the power
• Power is a planning tool: one minus the power is the probability to be disappointed…
www.3ieimpact.orgMarie M. Gaarder
Sample size calculationSample size calculation
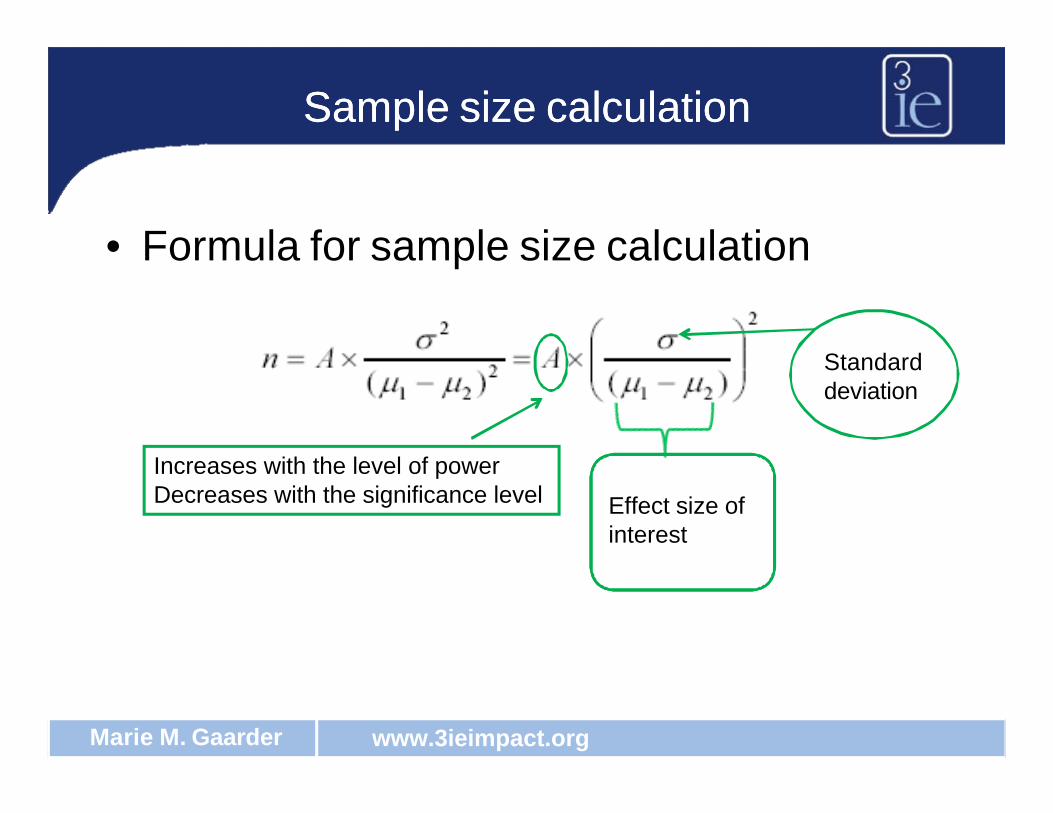
• Formula for sample size calculation
Increases with the level of powerDecreases with the significance level Effect size of
interest
Standard deviation
www.3ieimpact.orgMarie M. Gaarder
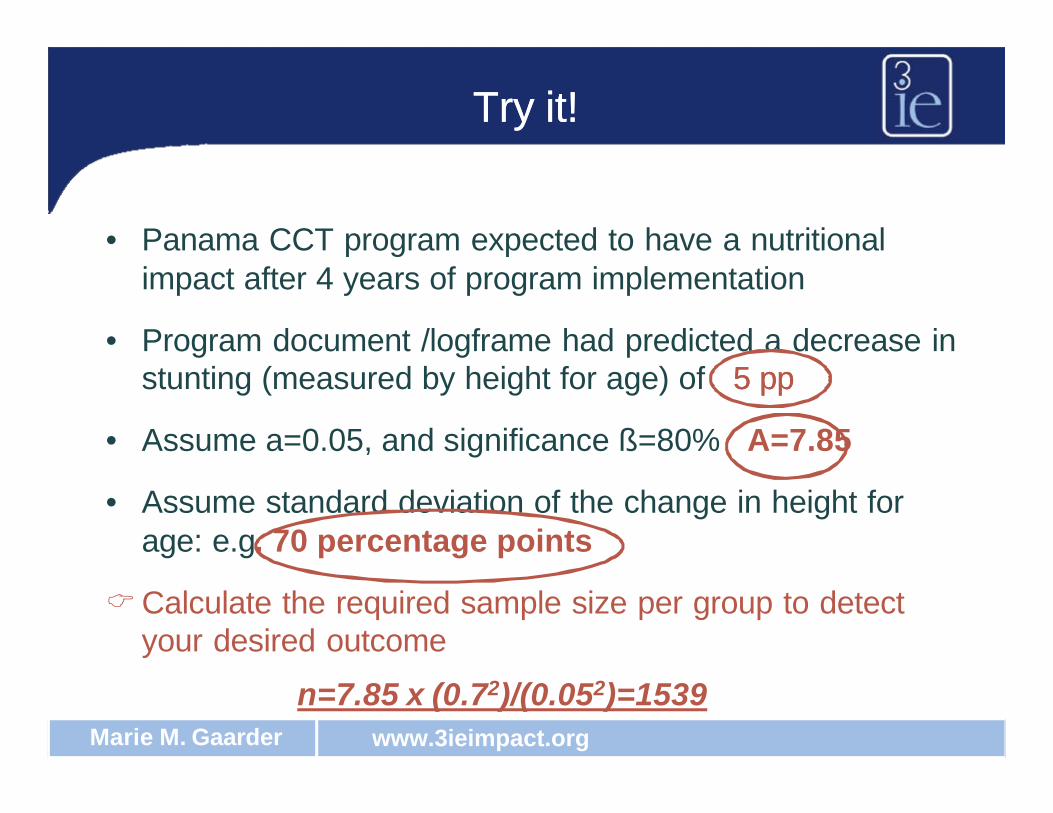
Try it!Try it!
• Panama CCT program expected to have a nutritional impact after 4 years of program implementation
• Program document /logframe had predicted a decrease in stunting (measured by height for age) of 5 pp5 pp
• Assume a=0.05, and significance ß=80% A=7.85
• Assume standard deviation of the change in height for age: e.g. 70 percentage points
CCalculate the required sample size per group to detect your desired outcome
n=7.85 x (0.72)/(0.052)=1539
www.3ieimpact.orgMarie M. Gaarder
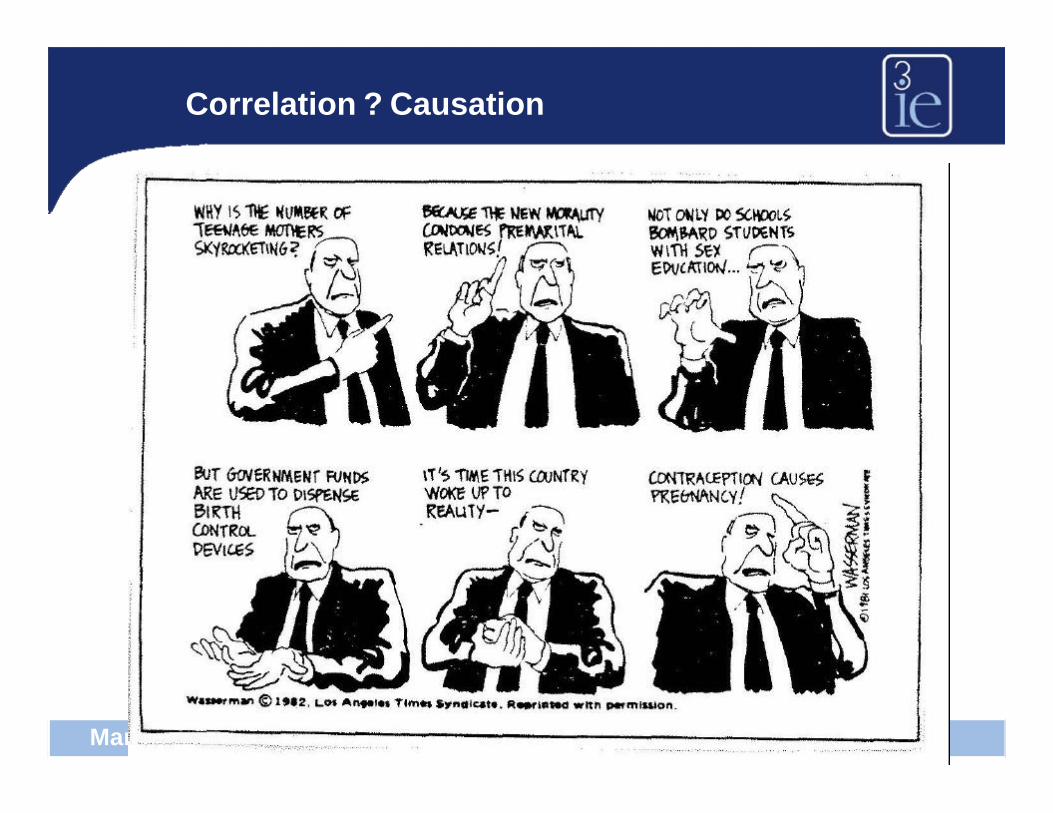
Correlation ? Causation