Embed Size (px)
Citation preview
Experimental Model of Ocular Hypertension in the Rat:Study of the Optic Nerve Capillaries and Action ofHypotensive Drugs
Florentina Díaz,1 Alicia Villena,1 Lourdes Vidal,1 Mercedes Moreno,2 Jose García-Campos,2
and Ignacio Perez de Vargas1
PURPOSE. To investigate quantitatively the effect of elevatedintraocular pressure (IOP) on the microvasculature of the opticnerve with and without topical treatment with two hypoten-sive drugs, timolol and latanoprost.
METHODS. Three groups of rats underwent cauterization ofthree episcleral veins to produce elevated IOP in the right eye.Two of these groups were treated with timolol or latanoprostfor 3 months. Eyeballs were incubated with anti–GLUT-1 poly-clonal antibody. GLUT-1–positive capillaries of the optic nervehead (ONH) and optic nerve exit (ON) were examined andanalyzed for their number per square millimeter, volume frac-tion, length per unit volume, surface area per unit volume, andmean diameter.
RESULTS. An increase in IOP resulted in a significant decrease inmicrovessel density in the laminar region (LR) and postlaminarregion (PR) and ON compared with the control group. Theother parameters fell significantly in all regions of the opticnerve. Topical treatment with timolol or latanoprost did notmodify the density of the capillaries, although the other param-eters increased significantly compared with the untreated ex-perimental group. Additionally, the mean diameter of the cap-illaries in the LR and the PR recovered after treatment.
CONCLUSIONS. The results indicate that the capillaries of the LRand the PR of the ONH are the most susceptible to IOPelevation. The authors suggest that timolol and latanoprosthave a certain vascular action by increasing the available bloodvolume, surface area per unit volume, length per unit volume,and diameter of the capillaries of the ONH in these tworegions. (Invest Ophthalmol Vis Sci. 2010;51:946–951) DOI:10.1167/iovs.09-3667
Glaucoma is an optic neuropathy characterized by progres-sive loss of the visual field as a result of optic degeneration
and subsequent loss of retinal ganglion cells (RGCs). Althoughelevated intraocular pressure (IOP) is considered the main riskfactor in patients with glaucoma, this alone cannot explain all
the clinical and experimental observations. Two theories, notmutually exclusive—alteration in ocular blood flow and me-chanical compression of the axons of the RGCs at the level ofthe lamina cribrosa—have been postulated to explain themechanisms that lead to the neurodegenerative lesions.1–3
The �-adrenoreceptor antagonist timolol and the prosta-glandin F2� analog latanoprost are two of the most importantdrugs used clinically to lower IOP in patients with glaucoma.4
Betaxolol, levobunolol, and timolol all increase blood velocitiesin retinal and epipapillary capillaries, but their ocular hemody-namic effects are not well known.5 It has been suggested thatthey might increase the perfusion of the optic nerve head(ONH) by an indirect hemodynamic mechanism.6 Other stud-ies have shown that treatment with latanoprost increases theblood flow at the ONH7 and has neuroprotective effects thatmay contribute to its efficacy in glaucoma therapy.8
Several different markers have been used to study the char-acteristics of the blood-brain barrier (BBB), including those ofthe glucose transporters gene family (GLUT). The brain GLUTsare divided into class 1 (GLUTs 1–4), class 2 (GLUT-5), andclass 3 (GLUT 6–8 and 10).9,10 The GLUT-1 isoform can beused as an immunohistochemical marker11 because of its pres-ence on the endothelial cell membrane (55-kDa isoform),12 andthe astrocyte feet surrounding the capillaries and astrocyte cellbodies (45-kDa isoform).10–12
The purpose of this study was to use an experimental ratmodel of elevated IOP to examine the changes in the microves-sels of the optic nerve after elevation of the IOP. GLUT-1(45-kDa isoform) was used as an immunohistochemical markerof the capillaries. After evaluating stereologic microvascularparameters in the ONH and ON in this model of elevated IOP,we undertook a comparative examination of the microvascularnetwork of the optic nerve of rats treated topically for 3months with 1 of 2 hypotensive drugs, timolol or latanoprost.
METHODS
Animals
We used male, adult Wistar rats (Charles Rivers Laboratories, Barce-lona, Spain), each weighing 250 to 300 g at the start of the study. Therats were divided into four groups: control (n � 6), experimental (n �8), treated with timolol (n � 8) or treated with latanoprost (n � 6).They were housed in individual home cages in an air-conditioned room(21° � 1°C with 66 � 3% humidity) with a 12-hour light/12-hour darkdiurnal cycle. They had free access to food (dry pellets) and tap water.To minimize animal suffering and the number of animals used, theexperiments were carried out in accordance with the guidelines of theEuropean Union Council (86/609/EU) for the use of laboratory animalsand in compliance with the ARVO Statement for the Use of Animals inOphthalmic and Vision Research.
From the Departments of 1Histology and Histopathology and2Ophthalmology, School of Medicine, University of Malaga, Malaga,Spain.
Supported by the Plan Nacional de Investigacion Científica, De-sarrollo e Innovacion Tecnologica (I�D�I), and the Instituto de SaludCarlos III, Fondo de Investigaciones Sanitarias (FIS PI021295/2002).
Submitted for publication March 5, 2009; revised June 11 and July24, 2009; accepted August 30, 2009.
Disclosure: F. Díaz, None; A. Villena, None; L. Vidal, None; M.Moreno, None; J. García-Campos, None; I. Perez de Vargas, MSDde Espana S. A. (F), Pharmacia de Espana S. A. (F)
Corresponding author: Florentina Díaz, Department of Histologyand Histopathology, School of Medicine, University of Malaga, Boule-vard Louis Pasteur 32, 29071 Malaga, Spain; [email protected].
Glaucoma
Investigative Ophthalmology & Visual Science, February 2010, Vol. 51, No. 2946 Copyright © Association for Research in Vision and Ophthalmology
Surgical Procedure
One group of rats was not submitted to the surgical procedure and wasused as a control group. The remainder of the animals underwentunilateral ocular surgical manipulation, with the contralateral eye re-maining untouched. These rats were deeply anesthetized by intraperi-toneal injection of 8% chloral hydrate (0.1 mL/30 g body weight). Righteye limbus-draining veins were exposed by incising the conjunctiva,and three of the four veins were cauterized using a small vesselcauterizer (Ophthalmic Cautery-Cautere, Moria, Antony, France).13–15
After surgery, the eyes were treated topically with an antibiotic (To-brex; Alcon Cusí S.A., Barcelona, Spain) during recovery. These ratswere then divided into three groups, an untreated group and twogroups treated with either timolol (Timoftol; MSD de Espana S.A.,Madrid, Spain) or latanoprost (Xalatan; Pharmacia Espana, S.A., Barce-lona, Spain) and were caged individually. Timolol and latanoprosttreatment was started 2 weeks after elevated IOP was induced. Afterdetermining that the IOP remained high during this period, we beganto instill in the operated eye 2 drops/day timolol 0.5% and 1 drop/daylatanoprost (0.005%), thus completing the period of 3 months after thesurgical procedure. All ocular tissues, including the cornea, lens, andsclera, appeared normal throughout the experiment.
IOP Measurements
The IOP of each eye was measured using a calibrated tonometer(Tono-Pen XL; Mentor Ophthalmics, Inc., Norwell, MA) before andimmediately after cauterization and every 2 weeks for the following 3months as well as immediately before perfusion. One drop of topicalanesthetic (proparacaine hydrochloride; Alcon Inc., Mississauga ON,Canada) was instilled. With the eye under good illumination, thetonometer (Tono-Pen XL; Mentor Ophthalmics, Inc.) was orientedperpendicularly to the cornea and, using a swift and steady stroke, the
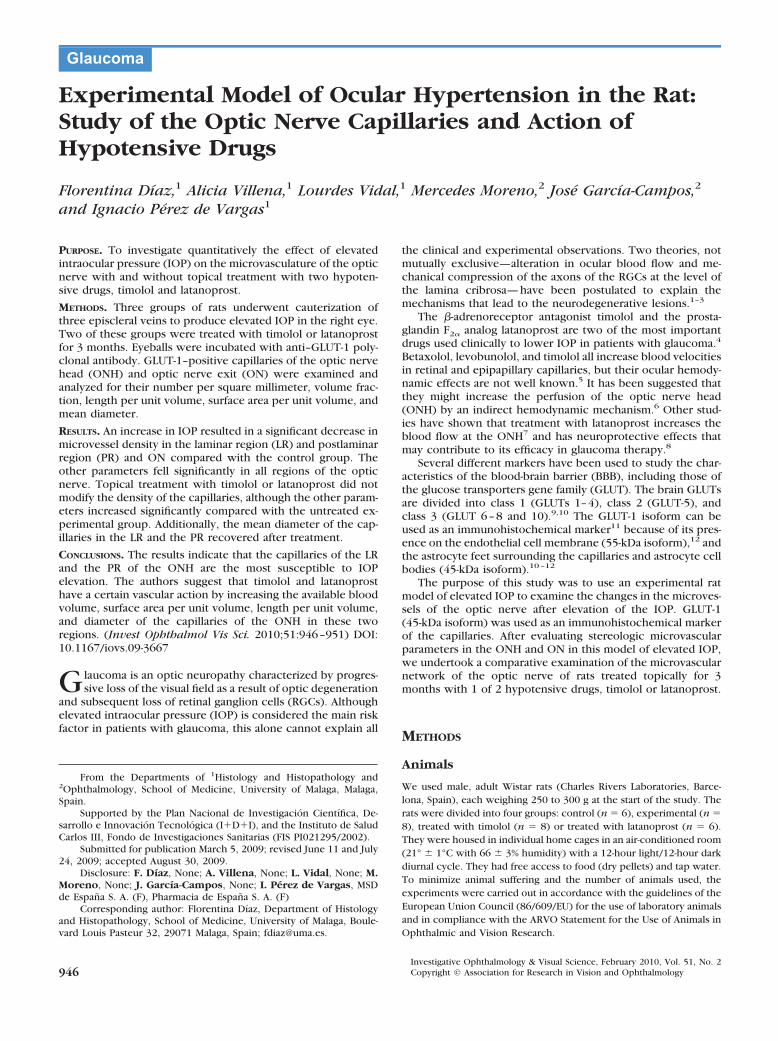
tip was bought into contact with the cornea.16 Each IOP registered wasan average of three consecutive measurements made at the same timeof day to correct for diurnal variations in IOP (10 am-12 pm) andimmediately before killing by perfusion. Mean IOP in the control eyeswas 14.85 � 0.65 mm Hg. Immediately after the surgical procedure,the mean IOP increased to 33.5 � 1.06 mm Hg and remained signifi-cantly elevated at 15 days and for the entire length of the experiment(Fig. 1). In the groups of rats treated with timolol or latanoprost, IOPat the start of the treatment was similar to that of the experimentalgroup. Measurements of the IOP taken every 2 weeks for 3 monthsshowed a decrease to normal values, with mean values of 14.05 � 0.81and 14.11 � 0.72 mm Hg, respectively, at 3 months (Fig. 1).
Immunohistochemical Procedure
Under deep anesthesia, as described, we performed perfusion throughthe heart in control, experimental, timolol-, and latanoprost-treatedanimals with 4% paraformaldehyde in 0.1 M phosphate buffer (pH 7.4).After perfusion, the eyeballs were removed and postfixed in the samefixative for 4 hours, transferred to ethanol 70°, embedded in paraffin,and cut into 6-�m-thick sagittal sections. The sections were mountedonto pretreated glass slides. They were deparaffinized in xylene andrehydrated with distilled water through the conventional ethanol scale,preincubated in citrate buffer (pH 6.0) in a pressure cooker, andtreated with 0.06% H2O2 for 15 minutes. The sections were thenincubated with the primary antibody overnight at 4°C. We used rabbitpolyclonal antibody anti-GLUT-1 (AB 1340; Chemicon International,Temecula, CA; dilution 1:1000) as the primary antibody. Slides wererinsed in phosphate buffer, incubated with biotinylated goat anti-rabbit(Dako A/S, Denmark) for 1 hour (dilution 1:600), and treated with theavidin-biotin peroxidase complex (Vectastain-ABC Kit; Vector Labora-tory Inc., Burlingame, CA) for 60 minutes and 3,3�-diaminobenzidinetetrahydrochloride (Sigma Chemical, St. Louis, MO) as the peroxidasesubstrate for 5 minutes. Finally, the slides were lightly counterstainedwith hematoxylin, dehydrated, mounted with mounting medium (En-tellan; Merck, Whitehouse Station, NJ), and examined under a micro-scope (H550L; Nikon, Tokyo, Japan).
Also included as a negative control was one section from eachanimal processed according to the same protocol but with omission ofthe primary antibody.
Morphometric Procedure
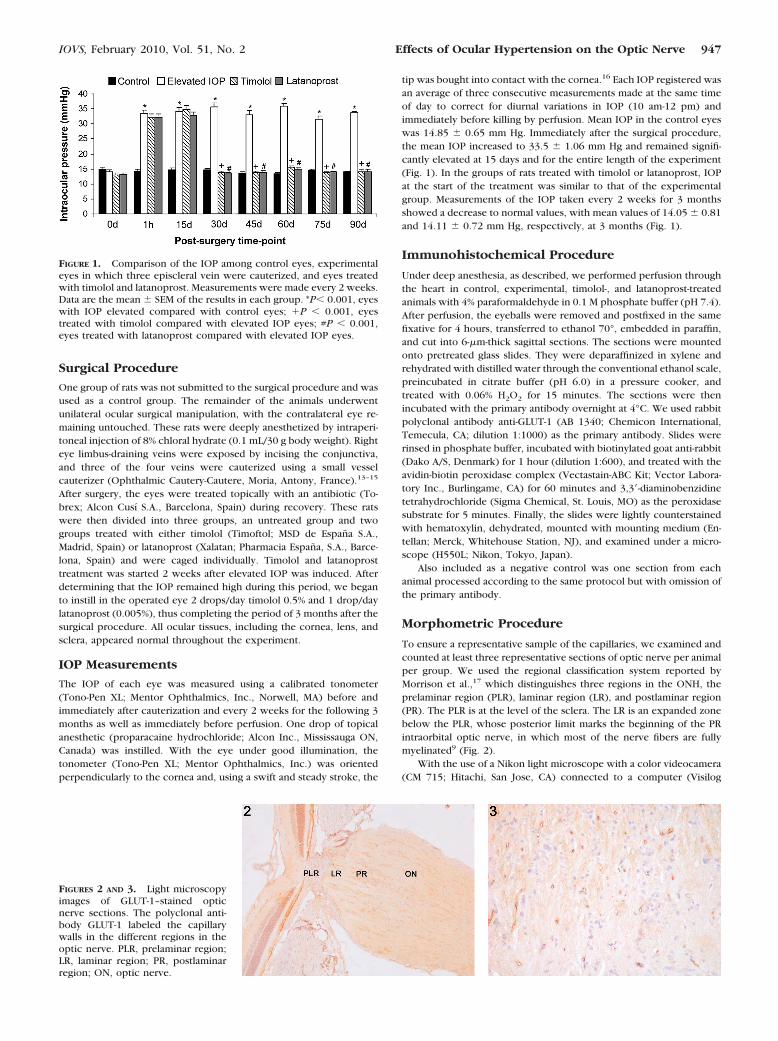
To ensure a representative sample of the capillaries, we examined andcounted at least three representative sections of optic nerve per animalper group. We used the regional classification system reported byMorrison et al.,17 which distinguishes three regions in the ONH, theprelaminar region (PLR), laminar region (LR), and postlaminar region(PR). The PLR is at the level of the sclera. The LR is an expanded zonebelow the PLR, whose posterior limit marks the beginning of the PRintraorbital optic nerve, in which most of the nerve fibers are fullymyelinated9 (Fig. 2).
With the use of a Nikon light microscope with a color videocamera(CM 715; Hitachi, San Jose, CA) connected to a computer (Visilog
FIGURE 1. Comparison of the IOP among control eyes, experimentaleyes in which three episcleral vein were cauterized, and eyes treatedwith timolol and latanoprost. Measurements were made every 2 weeks.Data are the mean � SEM of the results in each group. *P� 0.001, eyeswith IOP elevated compared with control eyes; �P � 0.001, eyestreated with timolol compared with elevated IOP eyes; #P � 0.001,eyes treated with latanoprost compared with elevated IOP eyes.
FIGURES 2 AND 3. Light microscopyimages of GLUT-1–stained opticnerve sections. The polyclonal anti-body GLUT-1 labeled the capillarywalls in the different regions in theoptic nerve. PLR, prelaminar region;LR, laminar region; PR, postlaminarregion; ON, optic nerve.
IOVS, February 2010, Vol. 51, No. 2 Effects of Ocular Hypertension on the Optic Nerve 947
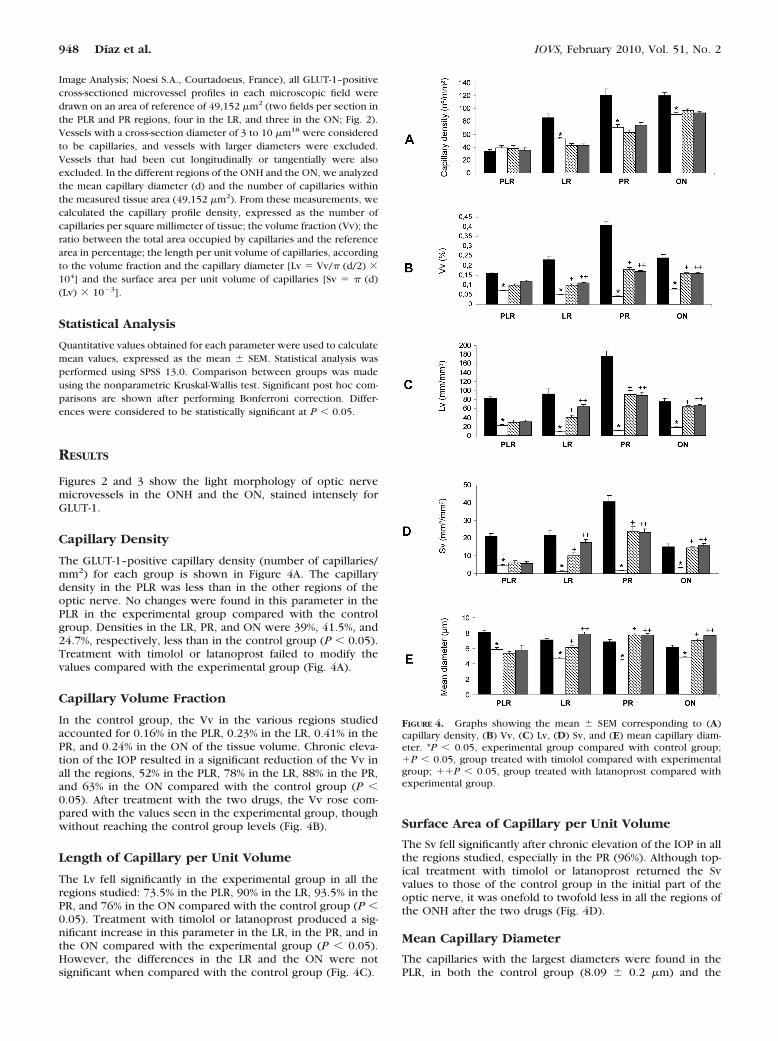
Image Analysis; Noesi S.A., Courtadoeus, France), all GLUT-1–positivecross-sectioned microvessel profiles in each microscopic field weredrawn on an area of reference of 49,152 �m2 (two fields per section inthe PLR and PR regions, four in the LR, and three in the ON; Fig. 2).Vessels with a cross-section diameter of 3 to 10 �m18 were consideredto be capillaries, and vessels with larger diameters were excluded.Vessels that had been cut longitudinally or tangentially were alsoexcluded. In the different regions of the ONH and the ON, we analyzedthe mean capillary diameter (d) and the number of capillaries withinthe measured tissue area (49,152 �m2). From these measurements, wecalculated the capillary profile density, expressed as the number ofcapillaries per square millimeter of tissue; the volume fraction (Vv); theratio between the total area occupied by capillaries and the referencearea in percentage; the length per unit volume of capillaries, accordingto the volume fraction and the capillary diameter [Lv � Vv/� (d/2) �104] and the surface area per unit volume of capillaries [Sv � � (d)(Lv) � 10�3].
Statistical Analysis
Quantitative values obtained for each parameter were used to calculatemean values, expressed as the mean � SEM. Statistical analysis wasperformed using SPSS 13.0. Comparison between groups was madeusing the nonparametric Kruskal-Wallis test. Significant post hoc com-parisons are shown after performing Bonferroni correction. Differ-ences were considered to be statistically significant at P � 0.05.
RESULTS
Figures 2 and 3 show the light morphology of optic nervemicrovessels in the ONH and the ON, stained intensely forGLUT-1.
Capillary Density
The GLUT-1–positive capillary density (number of capillaries/mm2) for each group is shown in Figure 4A. The capillarydensity in the PLR was less than in the other regions of theoptic nerve. No changes were found in this parameter in thePLR in the experimental group compared with the controlgroup. Densities in the LR, PR, and ON were 39%, 41.5%, and24.7%, respectively, less than in the control group (P � 0.05).Treatment with timolol or latanoprost failed to modify thevalues compared with the experimental group (Fig. 4A).
Capillary Volume Fraction
In the control group, the Vv in the various regions studiedaccounted for 0.16% in the PLR, 0.23% in the LR, 0.41% in thePR, and 0.24% in the ON of the tissue volume. Chronic eleva-tion of the IOP resulted in a significant reduction of the Vv inall the regions, 52% in the PLR, 78% in the LR, 88% in the PR,and 63% in the ON compared with the control group (P �0.05). After treatment with the two drugs, the Vv rose com-pared with the values seen in the experimental group, thoughwithout reaching the control group levels (Fig. 4B).
Length of Capillary per Unit Volume
The Lv fell significantly in the experimental group in all theregions studied: 73.5% in the PLR, 90% in the LR, 93.5% in thePR, and 76% in the ON compared with the control group (P �0.05). Treatment with timolol or latanoprost produced a sig-nificant increase in this parameter in the LR, in the PR, and inthe ON compared with the experimental group (P � 0.05).However, the differences in the LR and the ON were notsignificant when compared with the control group (Fig. 4C).
Surface Area of Capillary per Unit Volume
The Sv fell significantly after chronic elevation of the IOP in allthe regions studied, especially in the PR (96%). Although top-ical treatment with timolol or latanoprost returned the Svvalues to those of the control group in the initial part of theoptic nerve, it was onefold to twofold less in all the regions ofthe ONH after the two drugs (Fig. 4D).
Mean Capillary Diameter
The capillaries with the largest diameters were found in thePLR, in both the control group (8.09 � 0.2 �m) and the
FIGURE 4. Graphs showing the mean � SEM corresponding to (A)capillary density, (B) Vv, (C) Lv, (D) Sv, and (E) mean capillary diam-eter. *P � 0.05, experimental group compared with control group;�P � 0.05, group treated with timolol compared with experimentalgroup; ��P � 0.05, group treated with latanoprost compared withexperimental group.
948 Díaz et al. IOVS, February 2010, Vol. 51, No. 2
experimental group (5.83 � 0.2 �m). Compared with thecontrol group, we found a significant decrease in capillarydiameter in all regions of the optic nerve in the experimentalgroup (P � 0.05; Fig. 4E). After treatment, the mean capillarydiameter increased significantly, except in the PLR (Fig. 4E).
DISCUSSION
For several years now experimental models of ocular hyper-tension have provided valuable information about the pathol-ogy of glaucoma. One model, cauterization of one to four largeepiscleral veins, is one of the procedures used to obtain eleva-tion of the IOP.15 Our results demonstrate that cauterization ofthree episcleral veins in Wistar rats produces a constant pro-longed increase in IOP. The IOP remains consistently elevatedin cauterized eyes for at least 3 months.19,20 Additionally,axonal transport appears blocked in the optic nerve by theelevation of IOP,19 and there is an increased expression ofnitric oxide synthases 1 and 2 in the ONH,20 with neurotoxicaction on the ganglion cells.
The ocular vasculature has a vital role in the maintenance ofthe ocular blood flow. In the rat and other species, the vascularsupply to the ONH originates from the short ciliary arteries andthe central retinal artery.21,22 Branches from the posteriorciliary arteries supply most of the optic nerve head, and thecentral retinal artery supplies its anterior regions.21 There isevidence that localized vascular insufficiency leading to perfu-sion deficits of ocular structures appears to be an early mani-festation of optic neuropathy glaucoma.23 Several studies havedemonstrated alterations of the ocular blood flow in patientswith this condition,23,24 and circulatory disturbances in thePLR of the optic nerve head,2 and derangement in the posteriorciliary artery in the ONH are primarily responsible for thecommon ischemic diseases.25
The capillaries of the optic nerve are continuous, with aprotective wall of endothelial cells that form a BBB,26,27 exceptin the PLR.11 The BBB endothelium can be defined immuno-histochemically by its expression of specific membrane pro-teins. Most are involved in regulating the passage of substancesthrough the capillary wall. The best known of these transport-ers is the glucose transporter. Of these, the 55-kDa GLUT-1isoform12 has been used as a marker of the BBB given itspresence in the membrane of endothelial cells, and the 45-kDaisoform11,12 has been used as a marker of the perivascular feetof astrocytes of the capillary wall. Using this latter marker weanalyzed several parameters of the microvasculature of theepiscleral vein cauterization model after 3 months of elevatedIOP and after topical treatment for 3 months with two hypo-tensive drugs, the �-adrenoreceptor blocker timolol and theprostaglandin F�2 analog latanoprost.
This study shows that elevation of the IOP does not modifythe capillary density. These data are in agreement with thoseobtained in control nerves in monkeys with experimentallyincreased IOP.28,29 In the other regions, we noted a significantreduction in the number of capillaries per square millimetercompared with the control group.
The damaging effect of elevated IOP on optic nerve fibers isgenerally assumed to manifest itself mainly in the lamina cri-brosa,30 which could explain the significant reduction in cap-illary density noted in this region. A previous study in humanswith primary open-angle glaucoma showed that capillary den-sity in the PR of the optic nerve also decreases in parallel withaxon loss and with increased connective tissue thickness in thesepta.31 Our findings in the same region in rodents showsimilarities with the results in humans, with a significant de-crease in capillaries per square millimeter (41.5%) in the ex-perimental group compared with the control group.
The Vv, a parameter useful for estimating the blood volumeavailable in the capillary bed,32,33 decreased significantly in allthe regions of the ONH in the experimental group comparedwith the control group (52% in the PLR, 78% in the LR, and 88%in the PR), which suggests there is less blood supply for theseregions.32,33 This reduction probably also correlates with thechanges observed in the mean capillary diameter and the totallength of the capillaries.
The total length of the capillaries was significantly reducedper unit volume of tissue in the experimental group comparedwith the control group in all the regions studied, especially inthe LR and the PR (90% and 93.5%, respectively). These datacan be considered to confirm that the increase in the IOPcompresses the capillaries of the ONH, as shown ultrastructur-ally.34 Additionally, the Sv, which represents the capillary sur-face area available for metabolic exchange, also fell signifi-cantly in all regions in this same group, again markedly in theLR and the PR (93% and 96%, respectively). This may reflectchanges in the permeability in the capillaries of these regions,failing to ensure an adequate supply of nutrients after IOPelevation. Of note, too, is the fact that progressive glaucoma isassociated with decreased blood flow velocities in the smallretrobulbar vessels supplying the ONH.35
Results concerning the mean capillary diameter in the con-trol group showed values of 8 �m in the PLR and slightly lowervalues in the other regions (7.1 �m in the LR, 6.9 �m in thePLR, and 6.1 �m in the initial part of the ON). Mean capillarysize in the experimental group fell significantly in the differentregions of the ONH (28% in the PLR; 34% in the LR, and 36%in the PR), which corroborates the occlusion of the capillarywall as a consequence of IOP elevation.34 These changes couldbe related to the mechanism of self-regulation of the bloodflow of the ONH in response to an increase in the IOP,36 suchthat when the ONH is compressed by elevated IOP, a reductionin blood flow is produced, causing the vessels to undergovasoconstriction.37
To determine the effects on the capillaries of the opticnerve of two hypotensive drugs, timolol and latanoprost, ineyes submitted to elevated IOP, we analyzed all these param-eters after 3 months of treatment. Timolol, a nonselective�-adrenoreceptor antagonist, lowers IOP by decreasing theformation of aqueous humor in the ciliary epithelium.38 It hasa hypotensive effect in the rat,19 decreasing [Ca2�] by acting asa Ca2� channel blocker,39 and a neuroprotective effect on theRGCs and other neurons of the retina.19,20,40,41 Applied topi-cally, timolol reaches the retina-choroid at concentrationswithin the effective pharmacologic range.42 The other drugused, a prostaglandin F�2 analog, latanoprost, exerts its hypo-tensive action by increasing uveoscleral outflow, although theexact mechanism of action is not known.43 Its hypotensiveeffect has also been shown,20,44 as has its neuroprotective inthe rat.44
Our data show that timolol and latanoprost do not changethe GLUT-1–positive capillary density in the different regionsof the optic nerve. However, both drugs cause a significantincrease in Vv, especially in the PR (approximately 73%), with-out reestablishing the values to those of the control group. TheLv also rises in the LR, the PR, and the initial part of the ON,ranging from 78% to 87% depending on the exact region.Notably, treatment with latanoprost reestablished the Lv in theLR and the ON to levels of the control group.
Treatment with the drugs produced no changes in Sv in thePLR compared with the experimental group. In the threeregions, however, there was a significant increase (85%–90%)in the exchange surface, although without reaching the controlgroup values. Tamaki et al.7 showed in the human ONH andretinal circulation that blood velocity is increased, at leasttemporarily, with a single instillation of latanoprost. However,
IOVS, February 2010, Vol. 51, No. 2 Effects of Ocular Hypertension on the Optic Nerve 949
a comparative study with timolol and latanoprost in patientswith glaucoma found no substantial hemodynamic changes inthe retrobulbar vessels.45
Finally, our data on the mean capillary diameter show anincrease in the mean size of the LR and the PR after treatmentwith the drugs, which we attribute to their possible vasodilatoraction.
In summary, this is the first study in rodents to analyzequantitatively the effects of experimental elevation of the IOPon the capillaries of the ONH and the initial part of the ON. Theresults indicate that the ONH capillaries are susceptible to IOPelevation. We also suggest that the hypotensive effects oftimolol and latanoprost are associated with a certain degreeof vascular action by increasing the blood volume availablein the capillary bed, the capillary surface area available formetabolic exchange, the length of the capillaries per unitvolume of tissue, and the capillary diameter, especially inthe LR and the PR.
Acknowledgments
The authors thank Carmen Alba and Carmen Rios for their excellenttechnical assistance and Ian Johnstone for editorial assistance.
References
1. Hayreh SS. Structure and blood supply of the optic nerve. InHeilmann K, Richardson KT, eds. Glaucoma: Conceptions of theDisease. Stuttgart: Thieme; 1978:78–96.
2. Maumenee AE. Causes of optic nerve damage in glaucoma. Oph-thalmology. 1983;90:741–752.
3. Quigley HA, Anderson DR. The dynamics and location of axonaltransport blockade by acute intraocular pressure elevation inprimate optic nerve. Invest Ophthalmol Vis Sci. 1976;15:606 –616.
4. Hoyng PF, van Beek LM. Pharmacological therapy for glaucoma: areview. Drugs. 2000;59:411–434.
5. Arend O, Harris A, Arend S, Remky A, Martin BJ. The acuteeffect of topical beta-adrenoreceptor blocking agents on retinaland optic nerve head circulation. Acta Ophthalmol Scand.1998;76:43– 49.
6. Braakman R, van der Linden P, Sipkema P. Effects of topicalbeta-blockers on the diameter of the isolated porcine shortposterior ciliary artery. Invest Ophthalmol Vis Sci. 1999;40:370 –377.
7. Tamaki Y, Nagahara M, Arai M, Tomita K, Sandoh S, Tomidokoro A.Topical latanoprost and optic nerve head and retinal circulation inhumans. J Ocul Pharmacol Ther. 2001;17:403–411.
8. Nomura S, Hashimoto M. Pharmacological profiles of latanoprost(Xalatan), a novel anti-glaucoma drug. Nippon Yakurikagu Zasshi.2000;115:280–286.
9. Joost HG, Bell GI, Bets JD, et al. Nomenclature of the GLUT/SLC2Afamily of sugar /polyol transport facilitators. Am J Physiol Endo-crinol Metab. 2002;282:E974–E976.
10. McEwen BS, Reagan LP. Glucose transporter expression in thecentral nervous system: relationship to synaptic function. EurJ Pharmacol. 2004;490:13–24.
11. Hofman P, Hoyng P, vanderWerf F, Vrensen GF, Schlingemann RO.Lack of blood-brain barrier properties in microvessels of the pre-laminar optic nerve head. Invest Ophthalmol Vis Sci. 2001;42:895–901.
12. Duelli R, Kuschinsky W. Brain glucose transporters: relationship tolocal energy demand. New Physiol Sci. 2001;16:71–76.
13. García-Valenzuela E, Shareef S, Walsh J, Sharma SC. Programmedcell death of retinal ganglion cells during experimental glaucoma.Exp Eye Res. 1995;61:33–44.
14. Laquis S, Chandhary P, Sharma SC. The patterns of retinal ganglioncell death in hypertensive eyes. Brain Res. 1998;784:100–104.
15. Shareef SR, García-Valenzuela E, Salierno A, Walsh J, Sharma SC.Chronic ocular hypertension following episcleral venous occlu-sion in rats. Exp Eye Res. 1995;61:379–382.
16. Moore CG, Milne ST, Morrison JC. Noninvasive measurements ofrat intraocular pressure with the Tono-Pen. Invest Ophthalmol VisSci. 1993;34:363–369.
17. Morrison JC, Johnson EC, Cepurna W, Jial L. Understanding mech-anisms of pressure-induced optic nerve damage. Prog Retin EyeRes. 2005;24:217–240.
18. Rhodin JAG. Histology: A Text and Atlas. New York: OxfordUniversity Press; 1974:332–370.
19. Díaz F, Villena A, Moreno M, et al. Effects of a non-selective�-blocker on adult rat anterograde axonal transport and retinalganglion layer after increased intraocular pressure. Histol His-topathol. 2005;20:1077–1084.
20. Vidal L, Díaz F, Villena A, Moreno M, García-Campos J, Perez deVargas I. Nitric oxide synthase in retina and optic nerve head of ratwith increased intraocular pressure and effect of timolol. BrainRes Bull. 2006;70:406–413.
21. Morrison JC, Johnson EC, Cepurna WO, Funk W. Microvasculatureof the rat optic nerve head. Invest Ophthalmol Vis Sci. 1999;40:1702–1709.
22. Hayreh, SS. Blood supply of the optic nerve head in health anddisease. In: Lambrou G, Greve E, eds. Ocular Blood Flow inGlaucoma. Berkeley, CA: Kugler Publications; 1989:3–48.
23. Fuchsjager-Mayrl G, Wally B, Rainer G, et al. Effect of dorzolamideand timolol on ocular flow in patients with primary open angleglaucoma and ocular hypertension. Br J Ophthalmol. 2005;89:1293–1297.
24. Flammer J, Orgul S, Costa VP, et al. The impact of ocular bloodflow in glaucoma. Prog Retin Eye Res. 2002;21:359–393.
25. Hayreh SS. The 1994 Von Sallman Lecture: the optic nerve headcirculation in health and disease. Exp Eye Res. 1995;61:259–272.
26. Kiernan J. Axonal and vascular changes following injury to the rat’soptic nerve. J Anat. 1985;141:139–154.
27. Crespo D, Fernandez Viadero C. The microvascular system of theoptic nerve in control and enucleated rats. Microvasc Res. 1989;38:237–242.
28. Quigley HA, Hohman RM, Addicks EM, Green WR. Blood vessels ofthe glaucomatous optic disc in experimental primate and humaneyes. Invest Ophthalmol Vis Sci. 1984;25:918–931.
29. Furoyoshi N, Furoyoshi M, May CA, Hayreh SS, Alm A, Lutjen-Drecoll E. Vascular and glial changes in the retrolaminar opticnerve in glaucomatous monkey eyes. Ophthalmologica. 2000;214:24–32.
30. Fechtner RD, Weinreb RN. Mechanisms of optic nerve damage inprimary open angle glaucoma. Surv Ophthalmol. 1994;39:23–42.
31. Gottanka J, Kuhlman A, Scholz M, Johnson DH, Lutjen-Drecoll E.Pathophysiologic changes in the optic nerves of eyes with primaryopen angle and pseudoexfoliation glaucoma. Invest OphthalmolVis Sci. 2005;46:4170–4181.
32. Bell MA, Ball MJ. Morphometric comparison of hippocampal mi-crovasculature in aging and demented people: diameters and den-sities. Acta Neuropathol. 1981;53:299–318.
33. Black JE, Polinsky M, Greenough WT. Progressive failures of cere-bral angiogenesis supporting neural plasticity in aging rats. Neu-robiol Aging. 1989;10:353–358.
34. Feher J, Pescosolido N, Tranquilli Leali FM, Cavalloti C. Microves-sels of the human optic nerve head: ultrastructural and radiore-ceptorial changes in eyes with increased IOP. Can J Ophthalmol.2005;40:492–498.
35. Zeitz O, Galambos P, Wagenfeld L, et al. Glaucoma progression isassociated with decreased blood flow velocities in the short ciliaryartery. Br J Ophthalmol. 2006;90:1245–1248.
36. Pillunat LE, Anderson DR, Knighton RW, Joos KM, Feuer WJ.Autoregulation of human optic nerve head circulation in responseto increased intraocular pressure. Exp Eye Res. 1997;64:737–744.
37. Flammer J, Orgul S. Optic nerve blood-flow abnormalities in glau-coma. Prog Retin Eye Res. 1998;17:267–289.
38. Frishman WH, Fuksbrumer MS, Tannenbaum M. Topical ophthal-mic �-adrenergic blockade for the treatment of glaucoma andocular hypertension. J Clin Pharmacol. 1994;34:795–803.
39. Dong Y, Ishikawa H, Wu Y, Shimizu K, Goseki T, Toshitomi T.Effect of mechanism of betaxolol and timolol on vascular relax-ation in isolated rabbit ciliary artery. Jpn J Ophthalmol. 2006;50:504–508.
950 Díaz et al. IOVS, February 2010, Vol. 51, No. 2
40. Arai K, Wood JPM, Osborne NN. �-Adrenergic receptor agonistsand antagonists counteract LPS-induce neuronal death in retinalcultures by different mechanisms. Brain Res. 2003;985:176 –186.
41. Wood PM, Schmidt K-G, Melena J, Chidlow G, Allmeier H, Os-borne NN. The �-adrenoceptor antagonists metipranolol and timo-lol are retinal neuroprotectants: comparison with betaxolol. ExpEye Res. 2003;76:505–516.
42. Tan AY, Le Vatte TL, Archibald ML, Tremblay F, Kelly ME, ChauhanBC. Timolol concentrations in rat ocular tissues and plasma aftertopical and intraperitoneal dosing. J Glaucoma. 2002;11:134–142.
43. Weinreb RN, Toris CB, Galbert BT, Linndsey JD, Kaufman PL.Effects of prostaglandins on the aqueous humor outflow pathways.Surv Ophthalmol. 2002;47:S53–S64.
44. Hernandez M, Urcola JH, Vecino E. Retinal ganglion cell neuro-protection in a rat model of glaucoma following brimonidine,latanoprost or combined treatments. Exp Eye Res. 2008;86:798 – 806.
45. Nicolela MT, Buckley AR, Walman BE, Drance SM. A compara-tive study of the effects of timolol and latanoprost on blood flowvelocity of the retrobulbar vessel. Am J Ophthalmol. 1996;122:784 –789.
IOVS, February 2010, Vol. 51, No. 2 Effects of Ocular Hypertension on the Optic Nerve 951