Embed Size (px)
Citation preview

Experimental investigations of the Experimental investigations of the flow during the stage separation of a flow during the stage separation of a
space transportation systemspace transportation system
Andrew Hay
Aerospace Engineering with German
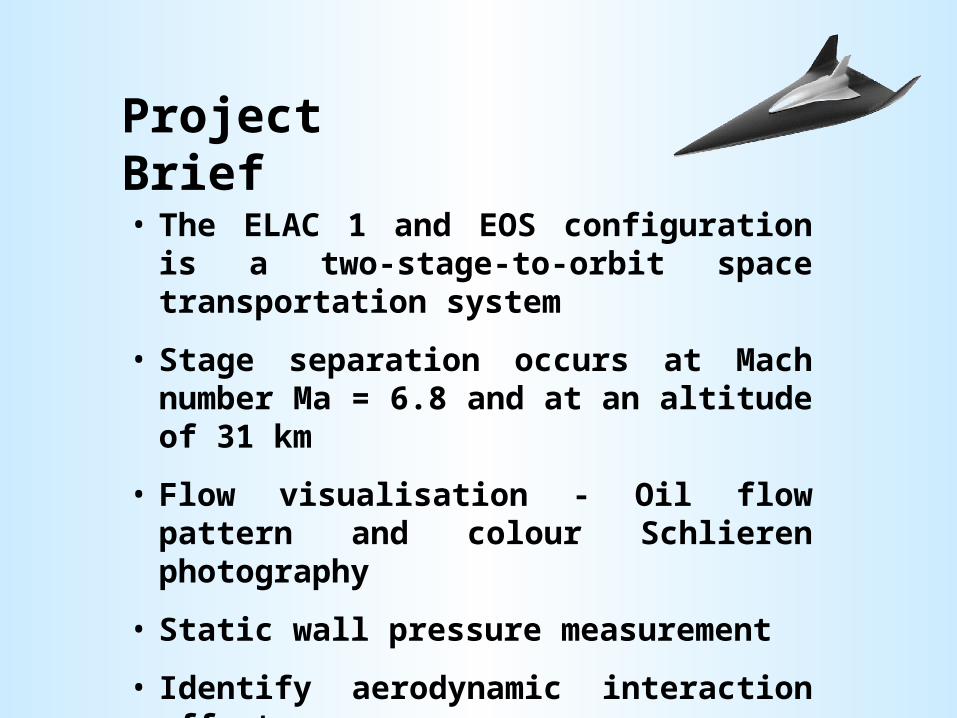
Project Brief
• The ELAC 1 and EOS configuration is a two-stage-to-orbit space transportation system
• Stage separation occurs at Mach number Ma = 6.8 and at an altitude of 31 km
• Flow visualisation - Oil flow pattern and colour Schlieren photography
• Static wall pressure measurement
• Identify aerodynamic interaction effects
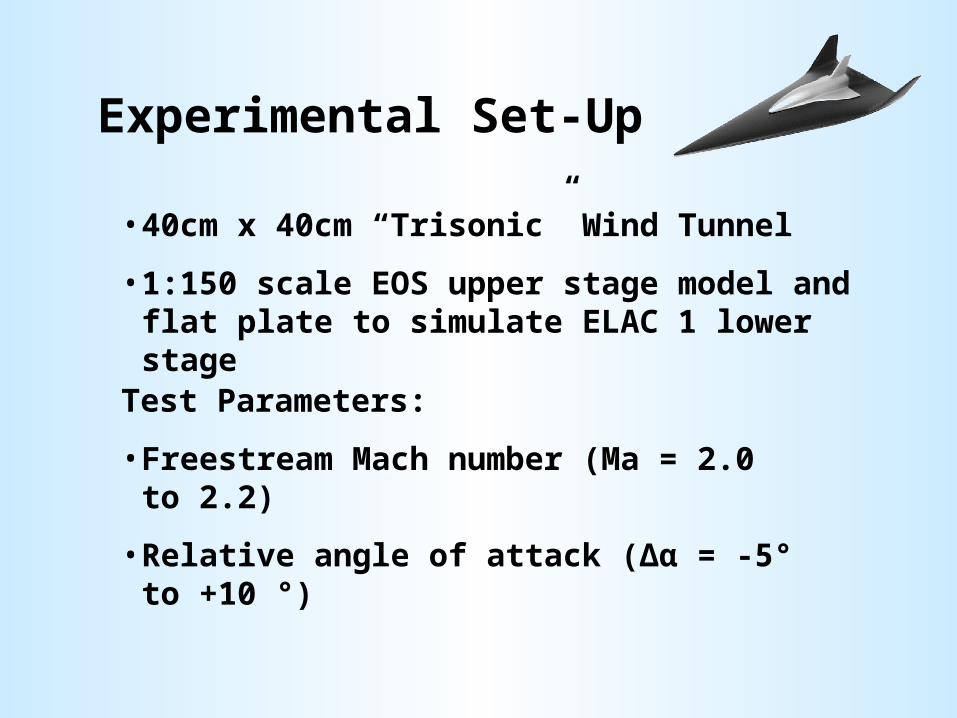
Experimental Set-Up
• 40cm x 40cm “Trisonic” Wind Tunnel
• 1:150 scale EOS upper stage model and flat plate to simulate ELAC 1 lower stage
Test Parameters:
• Freestream Mach number (Ma = 2.0 to 2.2)
• Relative angle of attack (Δα = -5° to +10 °)
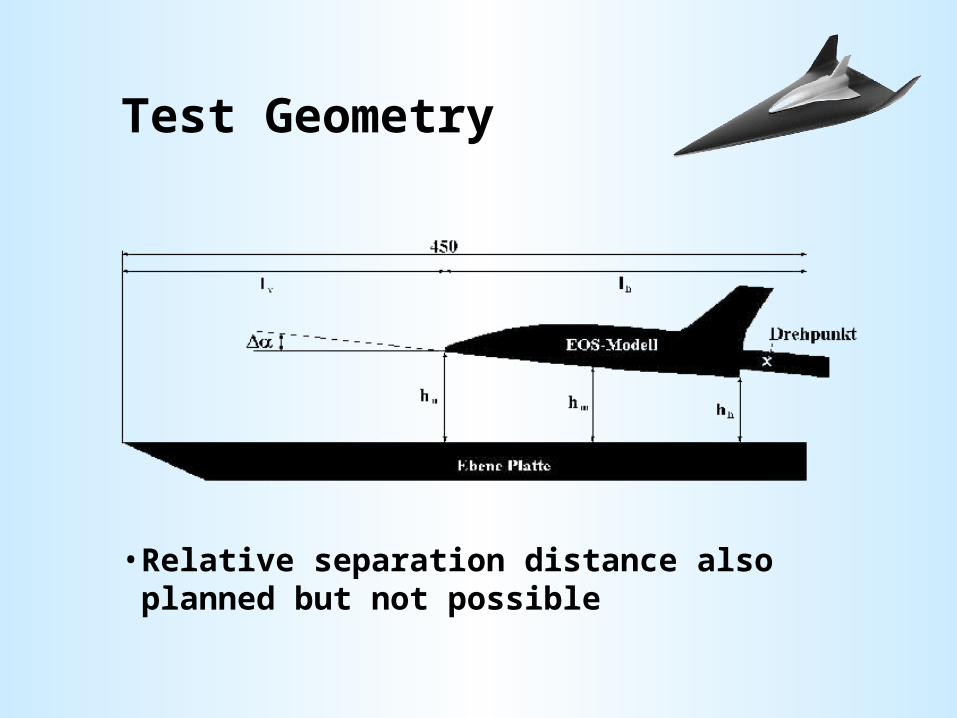
Test Geometry
• Relative separation distance also planned but not possible
Flow Visualisation
Pressure Measurement
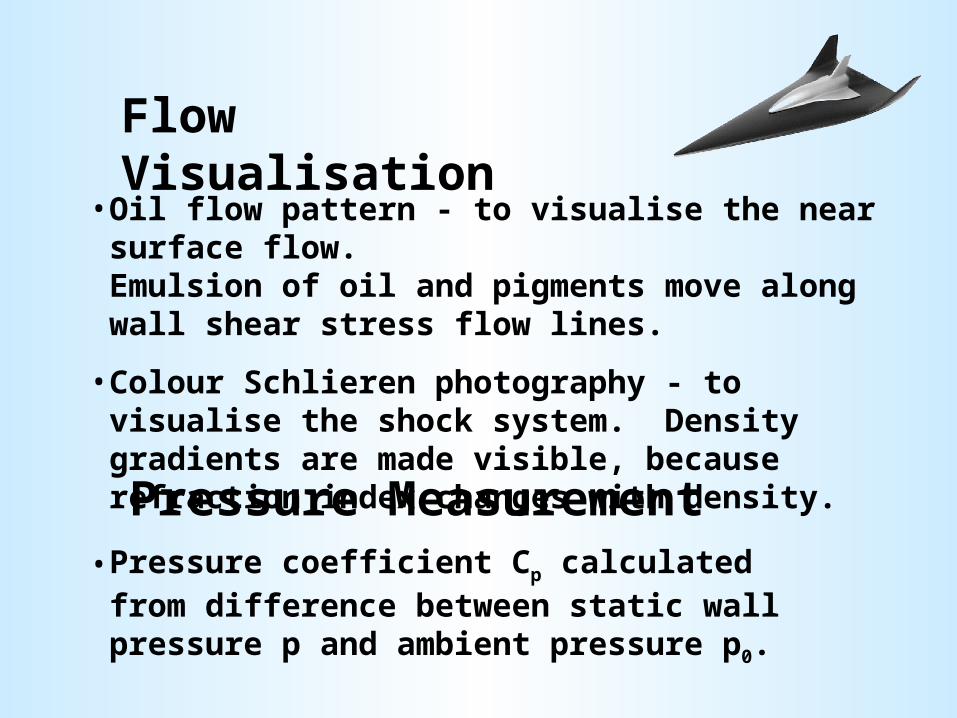
• Oil flow pattern - to visualise the near surface flow.Emulsion of oil and pigments move along wall shear stress flow lines.
• Colour Schlieren photography - to visualise the shock system. Density gradients are made visible, because refraction index changes with density.
• Pressure coefficient Cp calculated from difference between static wall pressure p and ambient pressure p0.
Oil Flow Pattern
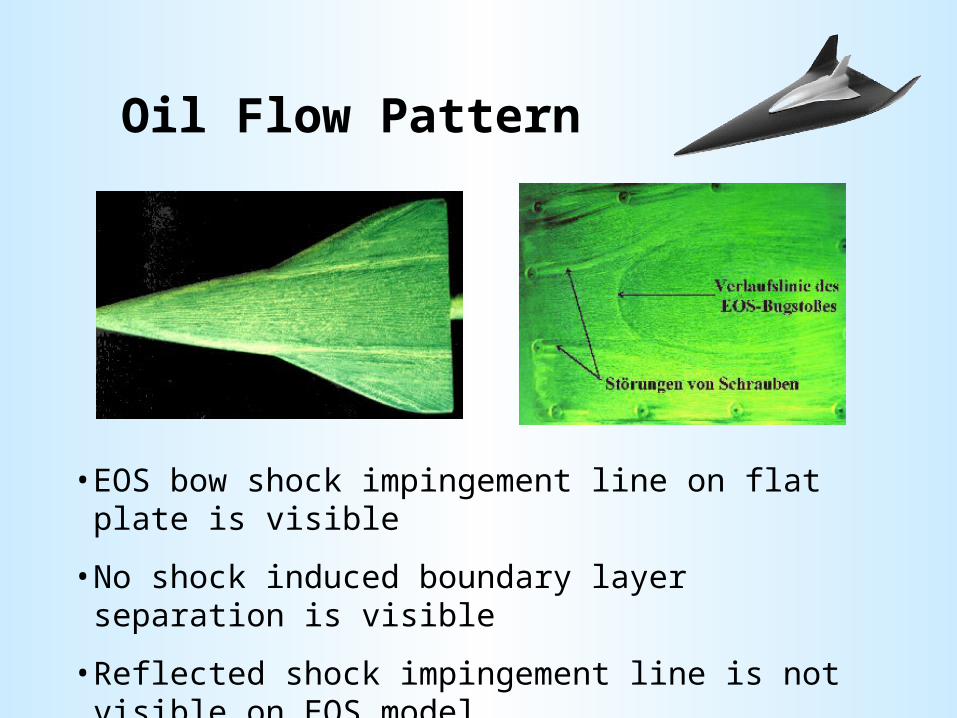
• EOS bow shock impingement line on flat plate is visible
• No shock induced boundary layer separation is visible
• Reflected shock impingement line is not visible on EOS model
Colour Schlieren
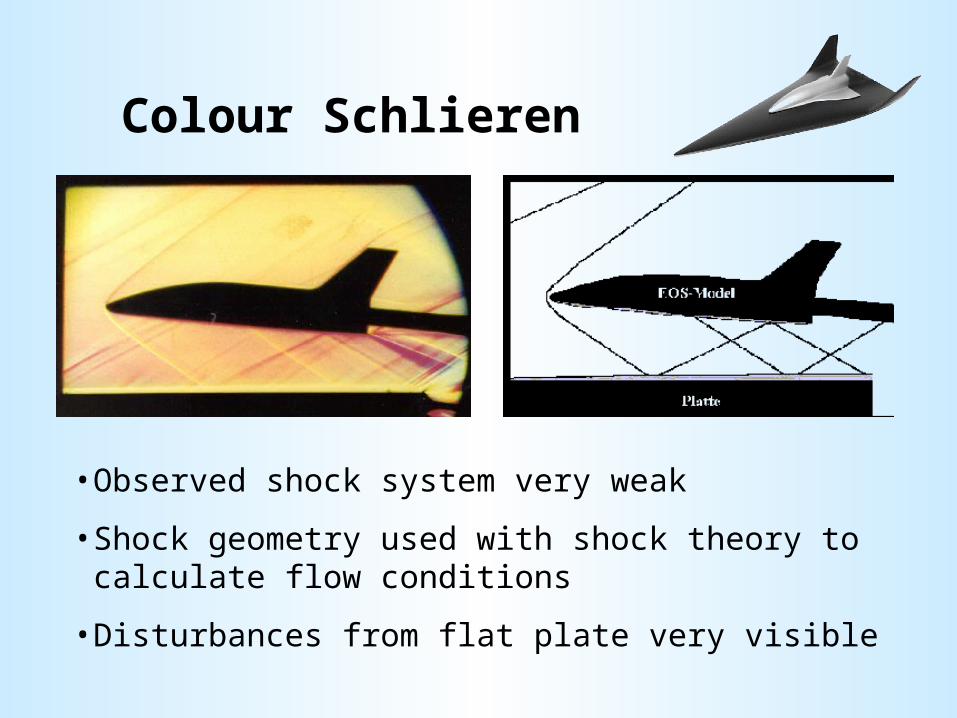
• Observed shock system very weak
• Shock geometry used with shock theory to calculate flow conditions
• Disturbances from flat plate very visible
Pressure Measurement
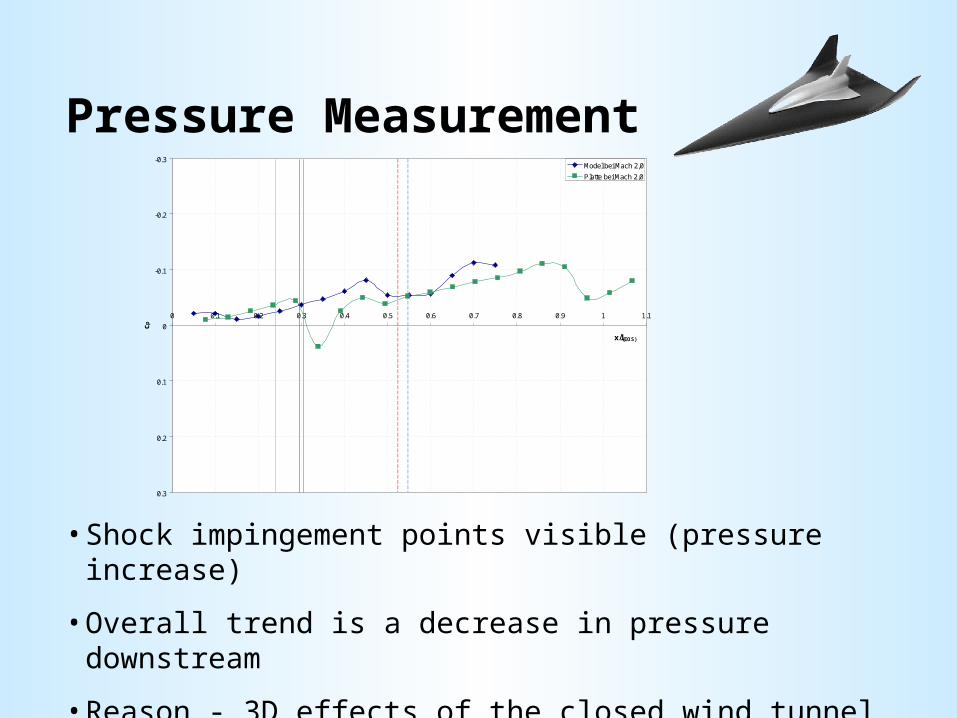
• Shock impingement points visible (pressure increase)
• Overall trend is a decrease in pressure downstream
• Reason - 3D effects of the closed wind tunnel test section
-0.3
-0.2
-0.1
0
0.1
0.2
0.3
0 0.1 0.2 0.3 0.4 0.5 0.6 0.7 0.8 0.9 1 1.1
x/l(EOS)
cp
Model bei Mach 2,0
Platte bei Mach 2,0
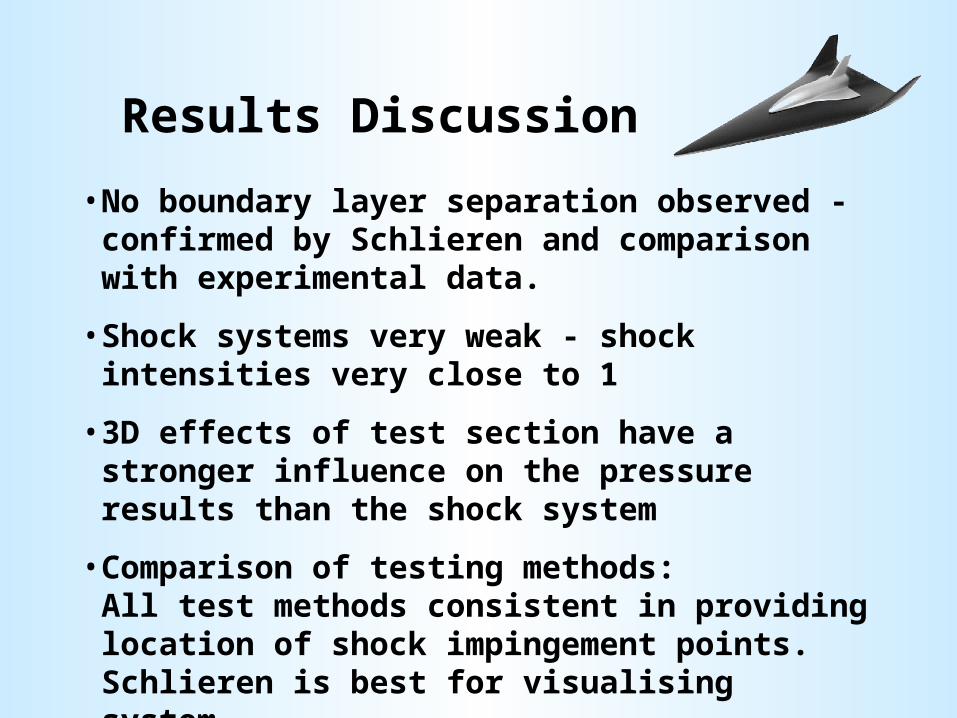
Results Discussion
• No boundary layer separation observed - confirmed by Schlieren and comparison with experimental data.
• Shock systems very weak - shock intensities very close to 1
• 3D effects of test section have a stronger influence on the pressure results than the shock system
• Comparison of testing methods:All test methods consistent in providing location of shock impingement points. Schlieren is best for visualising system.
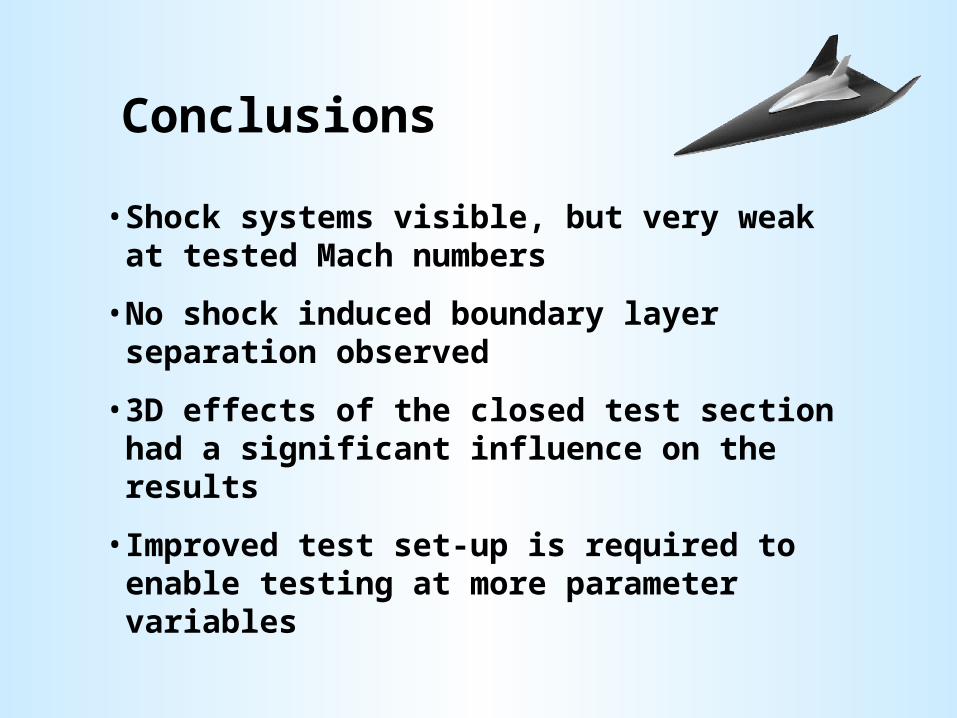
Conclusions
• Shock systems visible, but very weak at tested Mach numbers
• No shock induced boundary layer separation observed
• 3D effects of the closed test section had a significant influence on the results
• Improved test set-up is required to enable testing at more parameter variables
Experimental investigations of the Experimental investigations of the flow during the stage separation of a flow during the stage separation of a
space transportation systemspace transportation system
Andrew Hay
Aerospace Engineering with German
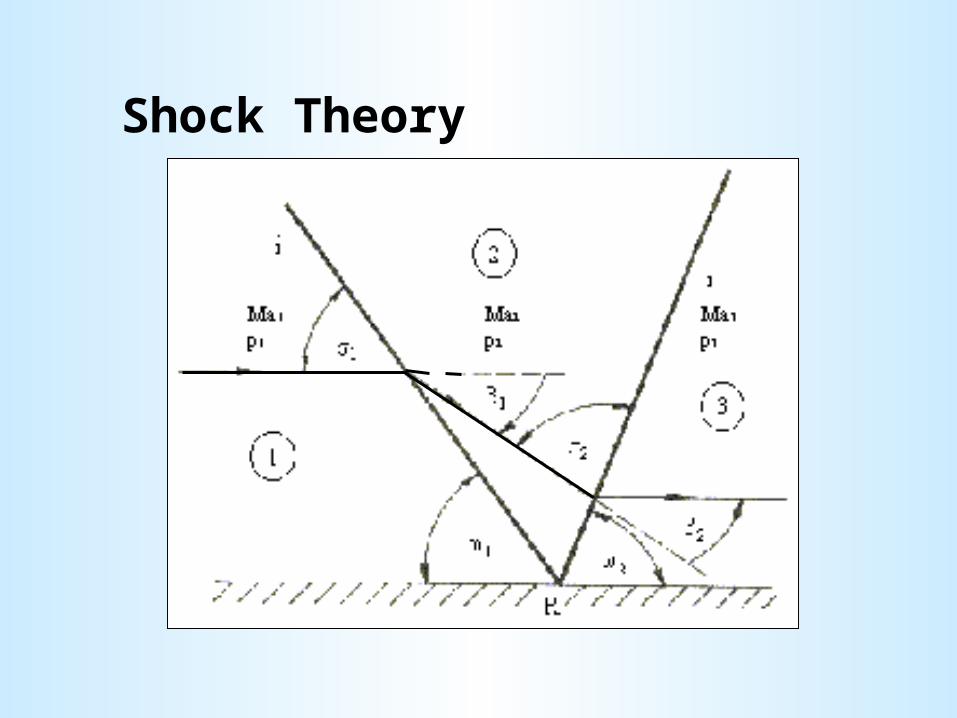
Shock Theory
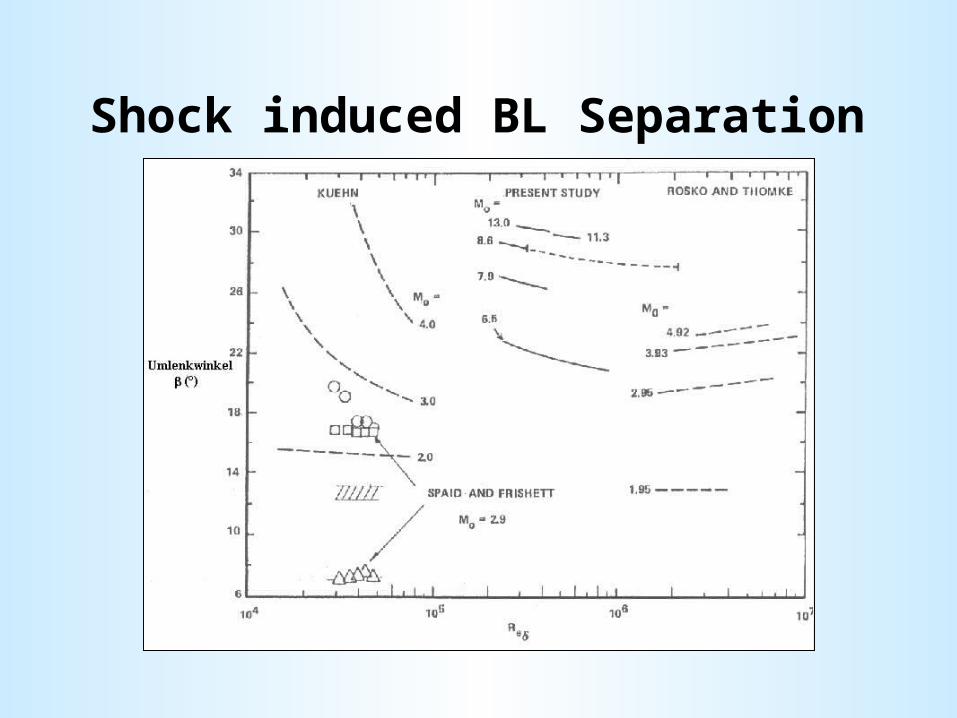
Shock induced BL Separation
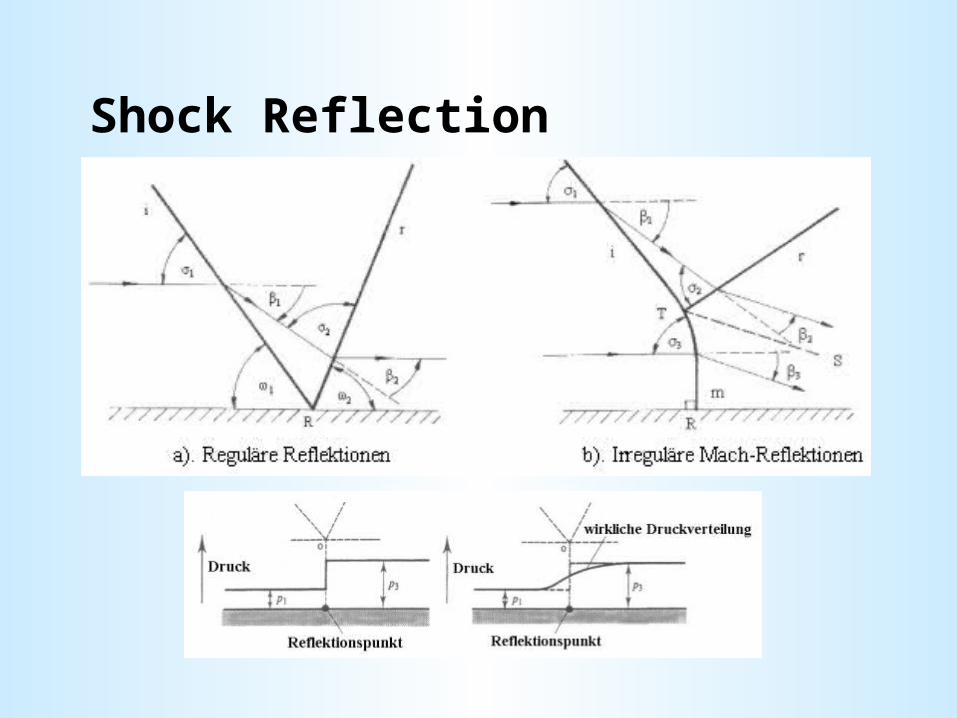
Shock Reflection
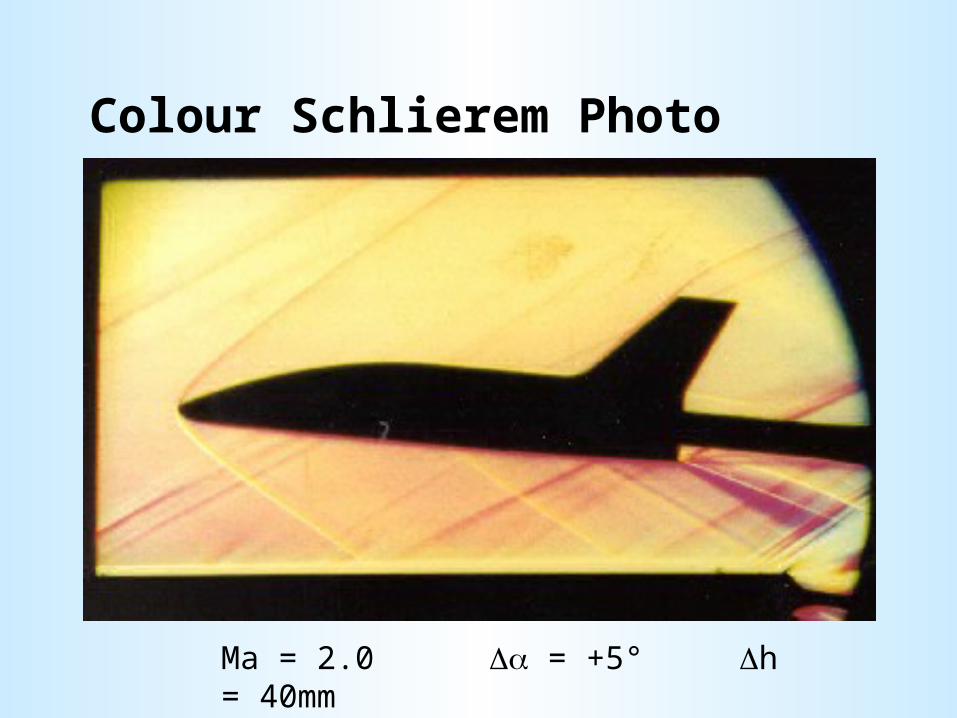
Colour Schlierem Photo
Ma = 2.0 = +5° h = 40mm
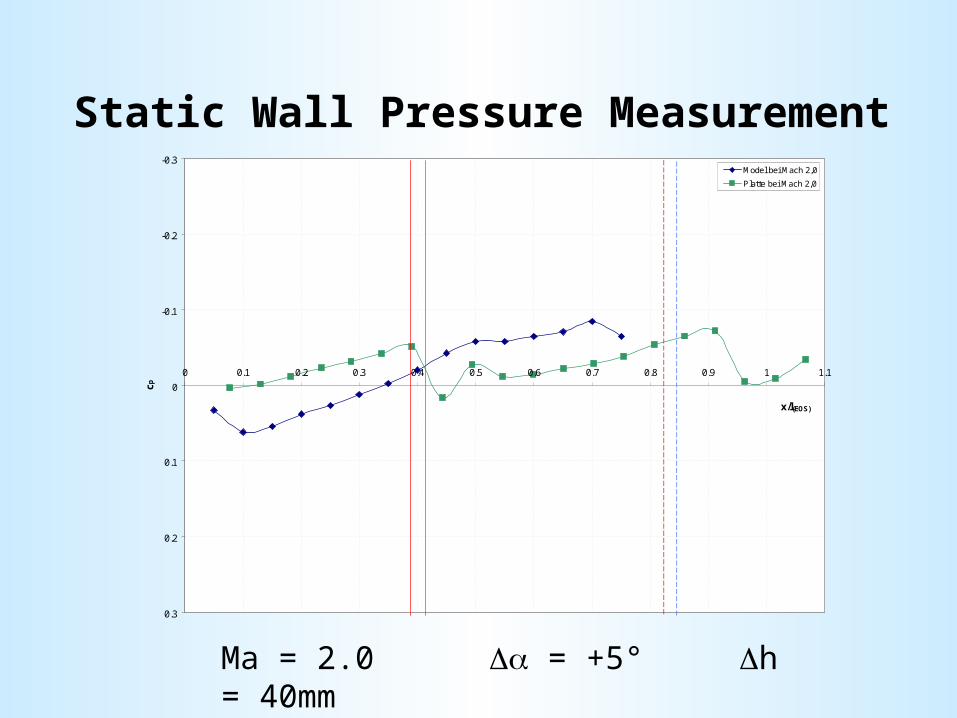
Static Wall Pressure Measurement-0.3
-0.2
-0.1
0
0.1
0.2
0.3
0 0.1 0.2 0.3 0.4 0.5 0.6 0.7 0.8 0.9 1 1.1
x/l(EOS)
cp
Model bei Mach 2,0
Platte bei Mach 2,0
Ma = 2.0 = +5° h = 40mm