Embed Size (px)
Citation preview
Experimental investigation on the dynamic
characteristics and transverse vibration instabilities of
transmission belts
Lionel MANIN a, François BESSON a, Guilhem MICHON b, and
Regis DUFOUR a
aLaMCoS, UMR CNRS 5259, INSA-Lyon
18 rue des Sciences, 69621 Villeurbanne, France
bUniversité de Toulouse,ISAE, DMSM
10 av. Edouard Belin, 31055 Toulouse, France
Experimental investigation on the dynamic
characteristics and transverse vibration instabilities of
transmission belts
Résumé, Abstract
Les courroies de transmission de type poly-v sont utilisées couramment pour l’entrainement des
accessoires des moteurs thermiques automobiles. Leurs caractéristiques dynamiques jouent un
rôle important dans le comportement de la transmission et sont également des entrées de logi-
ciels de simulation. Par ailleurs, les brins de courroies sont sources d’instabilitités non-linéaires de
comportement sous forme de vibrations transverses. Une étude expérimentale est menée sur des
courroies striées pour déterminer leurs caractéristiques de raideur et amortissement longitudi-
nales,la rigidité de flexion, et mettre en évidence ces instabilités. Les méthodes de caractérisation
des courroies sont présentées. Un banc d’essai a été réalisé pour, étudier et visualiser les insta-
bilités transverses d’un brin de courroie excité longitudinalement, établir une carte d’instabilité.
Serpentine belt drives are often used in front end accessory drive of automotive engine. Dy-
namic characteristics of belts play an important role in the behavior of such transmission and are
inputs of simulation software. Moreover, free belt spans exhibit transverse vibration non linear
instabilities. An experimental investigation is conducted on multi-ribbed belts, first for the deter-
mination of longitudinal stiffness and damping, bending rigidity, then to highlight the belt span
transverse instabilities. An experimental set-up has been designed, it enables ,the observation
and analysis of instabilities of belt spans axially excited, the determination of instability chart.
Mots clefs, Key words :
courroies de transmission, raideur, amortissement, mesures, rigidité de flexion, instabilités
transverses.
belt transmission, longitudinal stiffness, damping, experiments, bending rigidity, transverse
instability.
2
1 Introduction
Belts are power transmission components as gears or roller chains. They aim at trans-
mitting power from one rotating shaft to another. Two solutions can be distinguished:
transmission with obstacles (i.e timing belt), transmission with adherence (i.e v-belt, flat
belt, multi-ribbed belt). The work presented here considers multi-ribbed belts but it is
also applicable to the other types of belts.
Multi ribbed (serpentine) belt transmission are often used in the industry machinery to
transmit power. Another field of application concerns the Front End Accessory Drive
(FEAD) of automotive engine, which recently asks for better performances in order to
allow the development of new technological innovations as starter-alternator integration
in the transmission. This type of mechanical system, gives rise to many current techno-
logical challenges and scientific problems, see for example [10,8,5]. Due to serpentine belt
constitution, based on cords and rubber, long belt spans and operating conditions (engine
acyclism, fluctuating torques), the following phenomena occur during FEAD operation:
longitudinal and transverse belt span vibrations, pulley-belt slip. Obviously, longitudi-
nal stiffness and damping characteristics, as transverse rigidity play a major role in the
occurrence of such phenomena. These quantities are also inputs of simulation software.
Belt material characteristics are widely described in [2], properties of the different belt
components are presented and basic static experimentations for characterization are pre-
sented. Transverse belt vibrations related to bending rigidity are thoroughly investi-
gated in [1]. Belt span transverse instabilities result from parametric excitations due to
crankshaft torque pulsations that introduce a pulsating tension in the belt [4]. Moreover,
in the instability zone, the belt exhibits large transverse deflection such as a Duffing
oscillator with parametric excitation. For example such nonlinear oscillations have been
investigated numerically and experimentally by Pellicano et al. [7].
The work presented here, describe experimental methods that aims at determining belt
longitudinal stiffness and damping characteristics and transverse rigidity. Characterization
3
test benches have been designed and measurement process defined. Original measurement
methods have been developed for the different belt characteristics. The experimental inves-
tigation on belt instabilities is limited to a non-moving belt-pulley system parametrically
excited that lead to lateral instabilities, Duffing oscillations and other observed nonlinear
phenomena as described in [12].
2 Damping and dynamic stiffness measurement
The objectives are to determine experimentally the longitudinal stiffness and damping of
a belt span. Two methods are presented: free response and forced response of belt-mass
system.
2.1 Free response of a belt-mass system
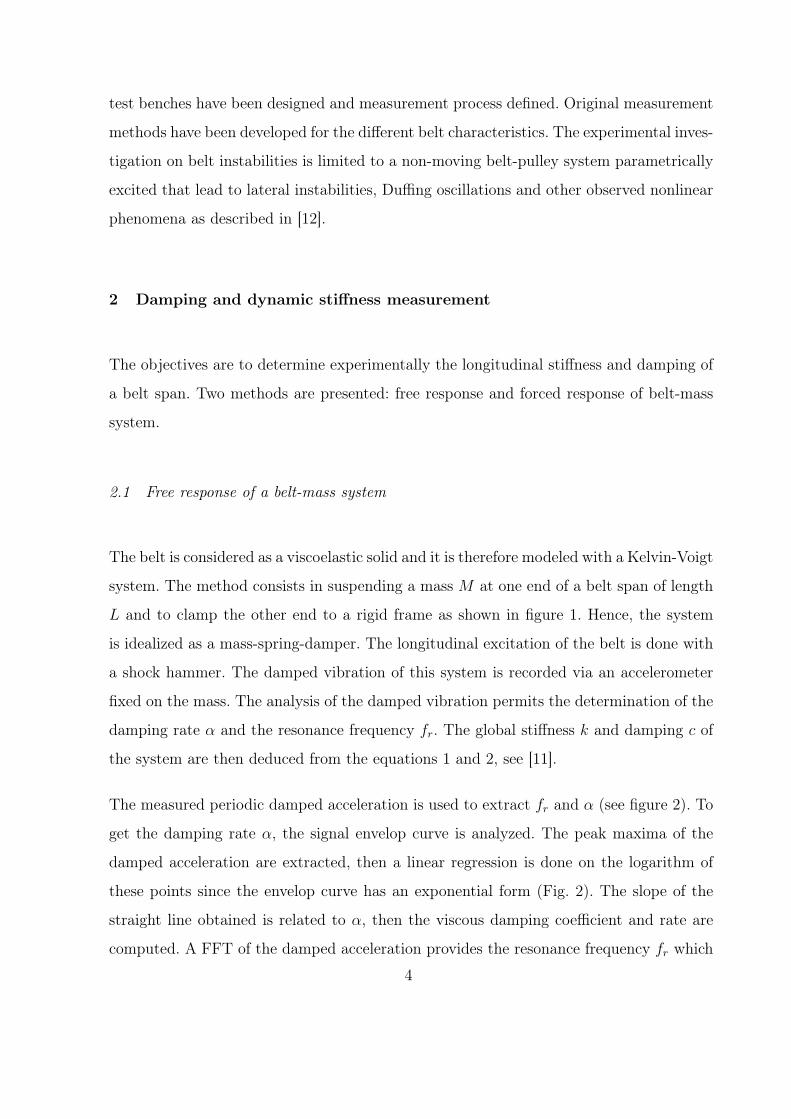
The belt is considered as a viscoelastic solid and it is therefore modeled with a Kelvin-Voigt
system. The method consists in suspending a mass M at one end of a belt span of length
L and to clamp the other end to a rigid frame as shown in figure 1. Hence, the system
is idealized as a mass-spring-damper. The longitudinal excitation of the belt is done with
a shock hammer. The damped vibration of this system is recorded via an accelerometer
fixed on the mass. The analysis of the damped vibration permits the determination of the
damping rate α and the resonance frequency fr. The global stiffness k and damping c of
the system are then deduced from the equations 1 and 2, see [11].
The measured periodic damped acceleration is used to extract fr and α (see figure 2). To
get the damping rate α, the signal envelop curve is analyzed. The peak maxima of the
damped acceleration are extracted, then a linear regression is done on the logarithm of
these points since the envelop curve has an exponential form (Fig. 2). The slope of the
straight line obtained is related to α, then the viscous damping coefficient and rate are
computed. A FFT of the damped acceleration provides the resonance frequency fr which
4
(a) (b)
Fig. 1. Experimental set-up for the belt damping and stiffness identification.
permits the determination of ω.
0 1 2 3−0.4
−0.3
−0.2
−0.1
0
0.1
0.2
0.3
0.4
t (s)
amp
(V)
0 1 2 3−4.5
−4
−3.5
−3
−2.5
−2
−1.5
−1
t (s)
max
ima
(ln)
maximum
Fig. 2. Damped acceleration of the mass m, exponential regression between maxima
Finally, for a given belt span length this measurement method provides the stiffness k and
the viscous damping coefficient c,
k =4π2m
1 − α2fr
2 (1)
c = 4πmfrα (2)
where
5
α =c
2mω(3)
and
w = 2πfr =
√
k
m. (4)
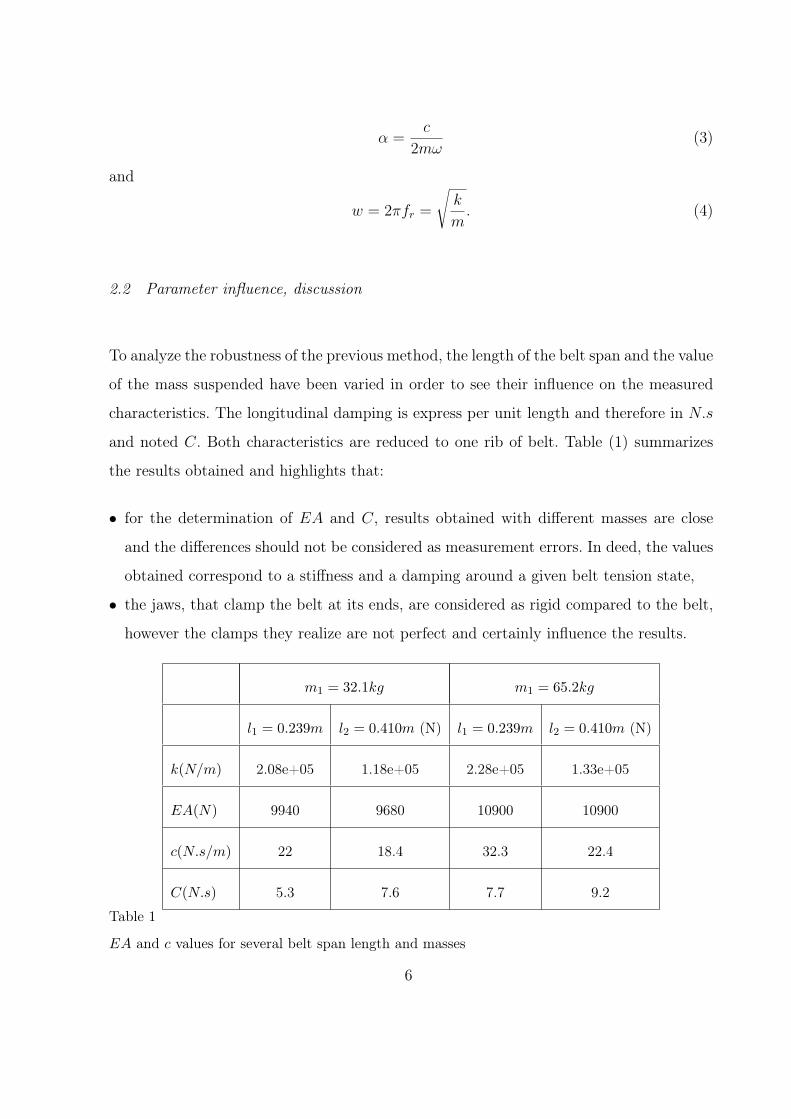
2.2 Parameter influence, discussion
To analyze the robustness of the previous method, the length of the belt span and the value
of the mass suspended have been varied in order to see their influence on the measured
characteristics. The longitudinal damping is express per unit length and therefore in N.s
and noted C. Both characteristics are reduced to one rib of belt. Table (1) summarizes
the results obtained and highlights that:
• for the determination of EA and C, results obtained with different masses are close
and the differences should not be considered as measurement errors. In deed, the values
obtained correspond to a stiffness and a damping around a given belt tension state,
• the jaws, that clamp the belt at its ends, are considered as rigid compared to the belt,
however the clamps they realize are not perfect and certainly influence the results.
m1 = 32.1kg m1 = 65.2kg
l1 = 0.239m l2 = 0.410m (N) l1 = 0.239m l2 = 0.410m (N)
k(N/m) 2.08e+05 1.18e+05 2.28e+05 1.33e+05
EA(N) 9940 9680 10900 10900
c(N.s/m) 22 18.4 32.3 22.4
C(N.s) 5.3 7.6 7.7 9.2
Table 1
EA and c values for several belt span length and masses
6

2.3 Forced response of a belt-mass system
A similar method to that described in the previous section is used. An electro dynamic
shaker applies an alternating force on the mass (figure 3(a)). The analysis of load and ac-
celeration signals permits determining the resonance frequency fr and the viscous damping
rate α. As in section 2.1 the stiffness k and the viscous damping coefficient c of the belt
span tested are deduced. In addition, the belt tension and elongation are recorded with a
load sensor located at the clamping and an optical laser sensor that points on the mass.
It enables measuring load - elongation loop of a belt span.
(a) (b)
Fig. 3. Force excited belt span apparatus.
8 9 10 11 12 13 14 150
0.2
0.4
0.6
0.8
1
1.2
1.4
f (Hz)
X/F
(a)
6 6.5 7 7.5 8 8.5 90
0.2
0.4
0.6
0.8
1
1.2
1.4
1.6
1.8
f (Hz)
X/F
(b)
Fig. 4. Forced response for a standard belt (a) and a stretchy (b).
As in section 2.1 fr is deduced. The viscous damping rate is obtained from the −3dB
7

bandwidth method that consists in determining the bandwidth ∆Ω at the resonance
amplitude divided by√
2.
Then,
∆Ω
ω=
∆f
f= 2α (5)
and c is calculated from
c = 2mαω (6)
The analysis of both free and forced motions enables the determination of longitudinal
dynamic characteristics of a belt span. Table 2 gives the results obtained with the two
methods and for two types of belt: standard and stretchy. For each type of belt, small
differences are observed for stiffness and damping between the two methods. The free
motion method is easier to realize, however the forced motion method appears more
robust since a frequency sweep is performed. As expected, the stretchy belt is less stiff
than the standard belt but damping characteristics are close.
standard belt stretchy belt
m=65.2 kg and l=0.44m m=65.2 kg and l=0.41m
forced motion free motion forced motion free motion
α 0.0105 0.0121 0.0229 0.0190
fr(Hz) 11.36 11.1 7.2 7.2
EA(N/rib) 24360 23390 10940 10910
c(N.s/rib) 7.1 8.1 11.1 9.2
Table 2
Comparison of methods for determining longitudinal characteristics
8
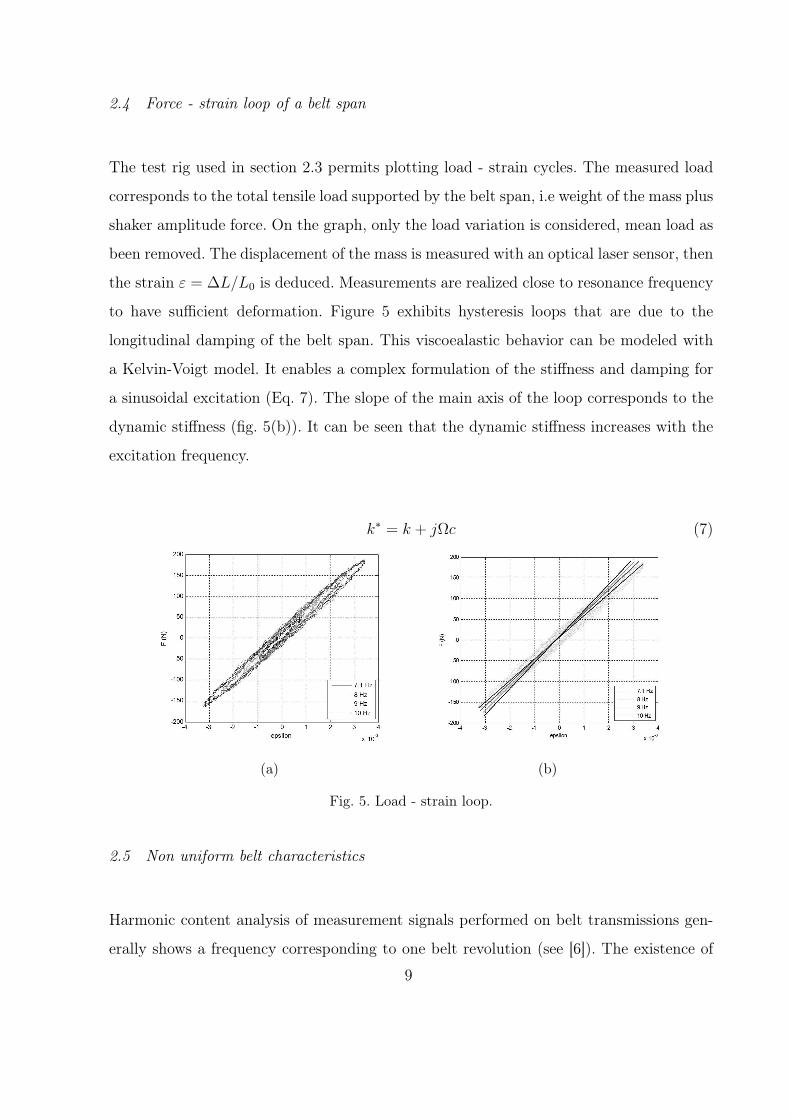
2.4 Force - strain loop of a belt span
The test rig used in section 2.3 permits plotting load - strain cycles. The measured load
corresponds to the total tensile load supported by the belt span, i.e weight of the mass plus
shaker amplitude force. On the graph, only the load variation is considered, mean load as
been removed. The displacement of the mass is measured with an optical laser sensor, then
the strain ε = ∆L/L0 is deduced. Measurements are realized close to resonance frequency
to have sufficient deformation. Figure 5 exhibits hysteresis loops that are due to the
longitudinal damping of the belt span. This viscoealastic behavior can be modeled with
a Kelvin-Voigt model. It enables a complex formulation of the stiffness and damping for
a sinusoidal excitation (Eq. 7). The slope of the main axis of the loop corresponds to the
dynamic stiffness (fig. 5(b)). It can be seen that the dynamic stiffness increases with the
excitation frequency.
k∗ = k + jΩc (7)
(a) (b)
Fig. 5. Load - strain loop.
2.5 Non uniform belt characteristics
Harmonic content analysis of measurement signals performed on belt transmissions gen-
erally shows a frequency corresponding to one belt revolution (see [6]). The existence of
9

this modulation is due to the non perfectness of the belt and demonstrates that belt char-
acteristics are non-uniform along the belt length. In order to check this non-uniformity, a
belt has been cut in ten equal parts. Each part has been tested to determine longitudinal
rigidity modulus k and damping C as described previously in section 2.1, see Fig. 1.
Longitudinal stiffness and damping coefficients of belt samples, normed by the maximum
measured values, are plotted versus belt sample number in Fig. 6. Non negligible variation
is observed for C while local stiffness and therefore EA is almost constant.
1 2 3 4 5 6 7 8 9 100.7
0.75
0.8
0.85
0.9
0.95
1
Belt sample number
k/km
ax
(a)
1 2 3 4 5 6 7 8 9 100.7
0.75
0.8
0.85
0.9
0.95
1
Belt sample number
C/C
max
(b)
Fig. 6. Dimensionless Stiffness (a) and Damping coefficient (b) evolution along belt length.
This irregularity, probably due to the manufacturing process (printing, cord winding,
cutting), generates transmission error fluctuations at the belt revolution frequency.
3 Bending stiffness - Transverse vibrations
3.1 Analytical transverse vibration modeling
The belt span considered is modeled as the pre-stressed beam isostatically supported at
its ends as shown in figure 7. The resonance frequencies for transverse vibrations of the
belt span are given by, see [1]:
fn
2 =T0
m· (
n
2L)2 +
EI
m· (
n2
2L2)2 (8)
10
where, L is the belt span length, EI is the bending rigidity of the belt span, m is the mass
per unit length, and T0 is the belt tension. fn is the nth resonance frequency of the belt
span. Equation 8 shows that the square of the resonance frequency is a linear function of
the belt tension. The experimental determination of this function enables the calculation
of EI from Eq. 8.
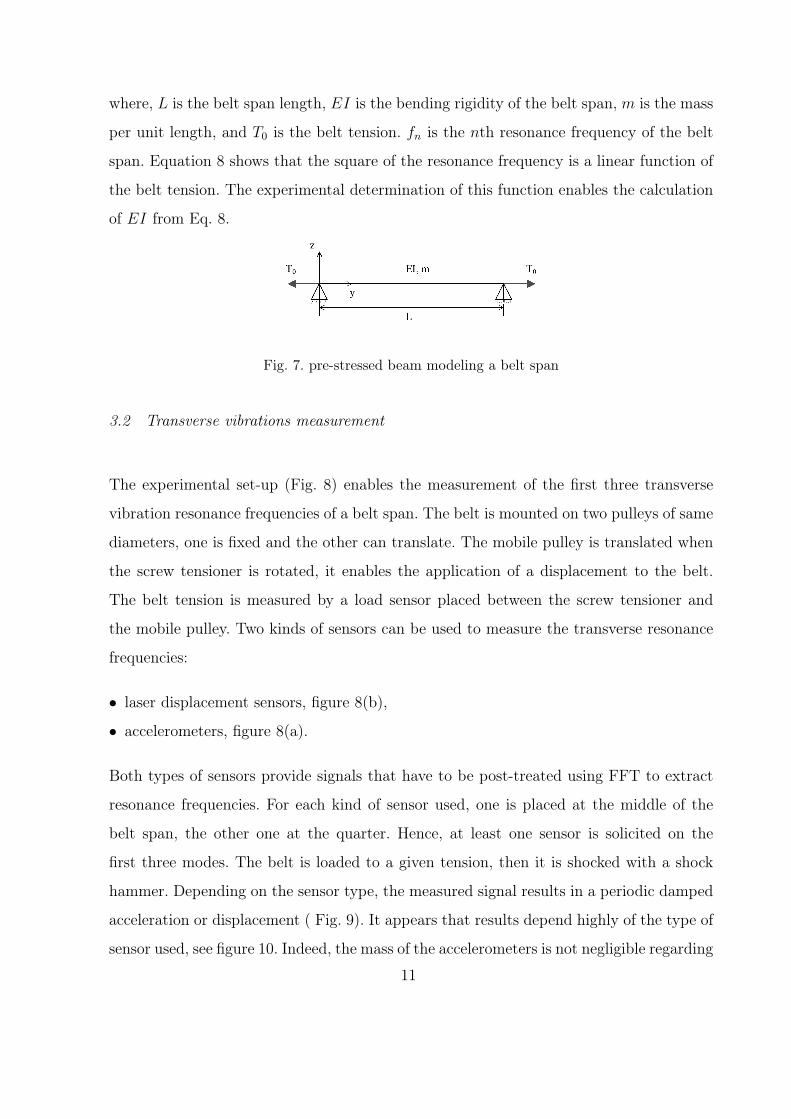
Fig. 7. pre-stressed beam modeling a belt span
3.2 Transverse vibrations measurement
The experimental set-up (Fig. 8) enables the measurement of the first three transverse
vibration resonance frequencies of a belt span. The belt is mounted on two pulleys of same
diameters, one is fixed and the other can translate. The mobile pulley is translated when
the screw tensioner is rotated, it enables the application of a displacement to the belt.
The belt tension is measured by a load sensor placed between the screw tensioner and
the mobile pulley. Two kinds of sensors can be used to measure the transverse resonance
frequencies:
• laser displacement sensors, figure 8(b),
• accelerometers, figure 8(a).
Both types of sensors provide signals that have to be post-treated using FFT to extract
resonance frequencies. For each kind of sensor used, one is placed at the middle of the
belt span, the other one at the quarter. Hence, at least one sensor is solicited on the
first three modes. The belt is loaded to a given tension, then it is shocked with a shock
hammer. Depending on the sensor type, the measured signal results in a periodic damped
acceleration or displacement ( Fig. 9). It appears that results depend highly of the type of
sensor used, see figure 10. Indeed, the mass of the accelerometers is not negligible regarding
11
(a) (b)
Fig. 8. Static loading for belt transverse stiffness measurement, accelerometers (a) and lasers (b).
the belt inertia and it modifies its dynamic behavior. Therefore it as to be taken into
account not as in [3]. If accelerometers are used, in order to get reliable measurement,
their masses have to be included in the model (FEM for example) and it makes the
measurement process much more complicated. On the contrary, laser displacement sensors
do not influence the result.
0 0.5 1 1.5−10
−8
−6
−4
−2
0
2
4
6
8
time (s)
Am
p (V
)
(a)
0 100 200 300 400 500 6000
10
20
30
40
50
60
70
80
f (Hz)
FF
T
1/41/2
(b)
Fig. 9. Damped transverse belt vibration (a) and frequency spectrum of laser signal located at
1/4 and 1/2 of belt length (b).
Results obtained for the two tested belts are summarized in table 3. It appears that the
bending rigidity is very small for both types of belt. Depending on the observed transverse
vibration mode, the deduced value of EI changes. Finally, the estimation of the transverse
resonance frequency of a belt span can be done with sufficient accuracy using the simplified
form of Eq.8 by neglecting EI which is a string model. This is illustrated in figure 10 where
the straight lines represent the squares of the first three transverse vibration frequencies
computed from Eq. 9. However, one must keep in mind that as mentioned in [5] the
bending rigidity plays an important role in the boundary conditions pulley/belt at the
12
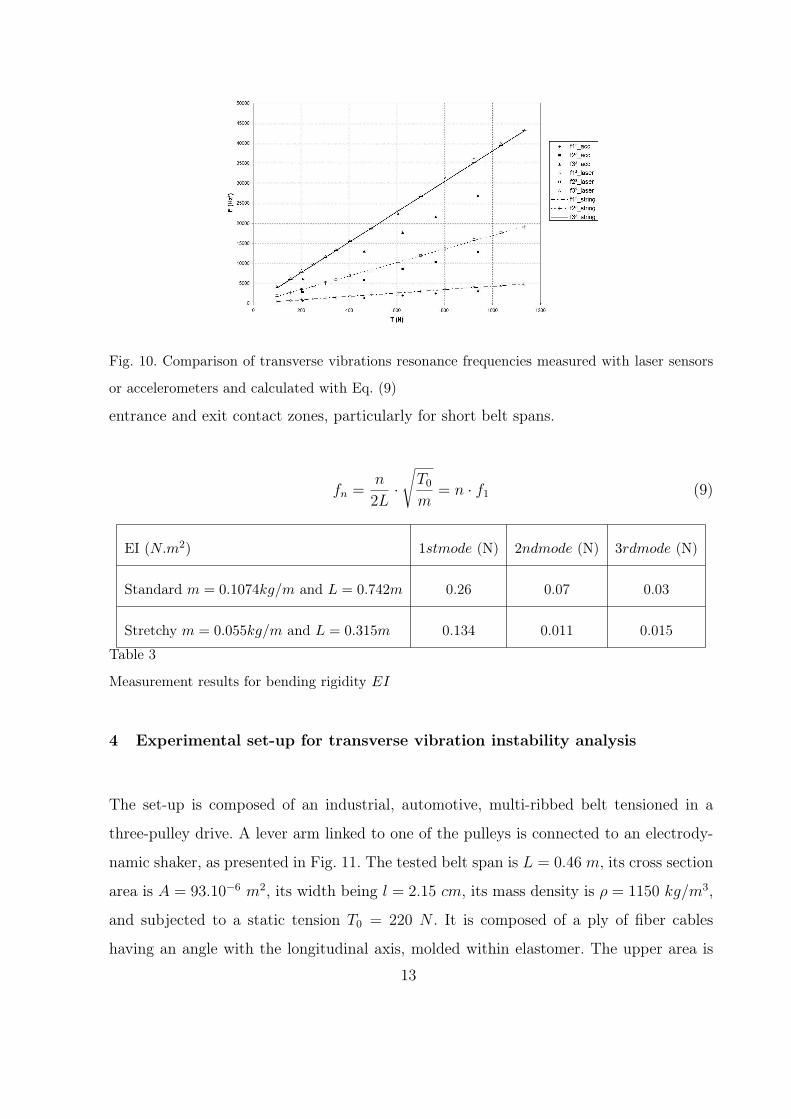
Fig. 10. Comparison of transverse vibrations resonance frequencies measured with laser sensors
or accelerometers and calculated with Eq. (9)
entrance and exit contact zones, particularly for short belt spans.
fn =n
2L·√
T0
m= n · f1 (9)
EI (N.m2) 1stmode (N) 2ndmode (N) 3rdmode (N)
Standard m = 0.1074kg/m and L = 0.742m 0.26 0.07 0.03
Stretchy m = 0.055kg/m and L = 0.315m 0.134 0.011 0.015
Table 3
Measurement results for bending rigidity EI
4 Experimental set-up for transverse vibration instability analysis
The set-up is composed of an industrial, automotive, multi-ribbed belt tensioned in a
three-pulley drive. A lever arm linked to one of the pulleys is connected to an electrody-
namic shaker, as presented in Fig. 11. The tested belt span is L = 0.46 m, its cross section
area is A = 93.10−6 m2, its width being l = 2.15 cm, its mass density is ρ = 1150 kg/m3,
and subjected to a static tension T0 = 220 N . It is composed of a ply of fiber cables
having an angle with the longitudinal axis, molded within elastomer. The upper area is
13
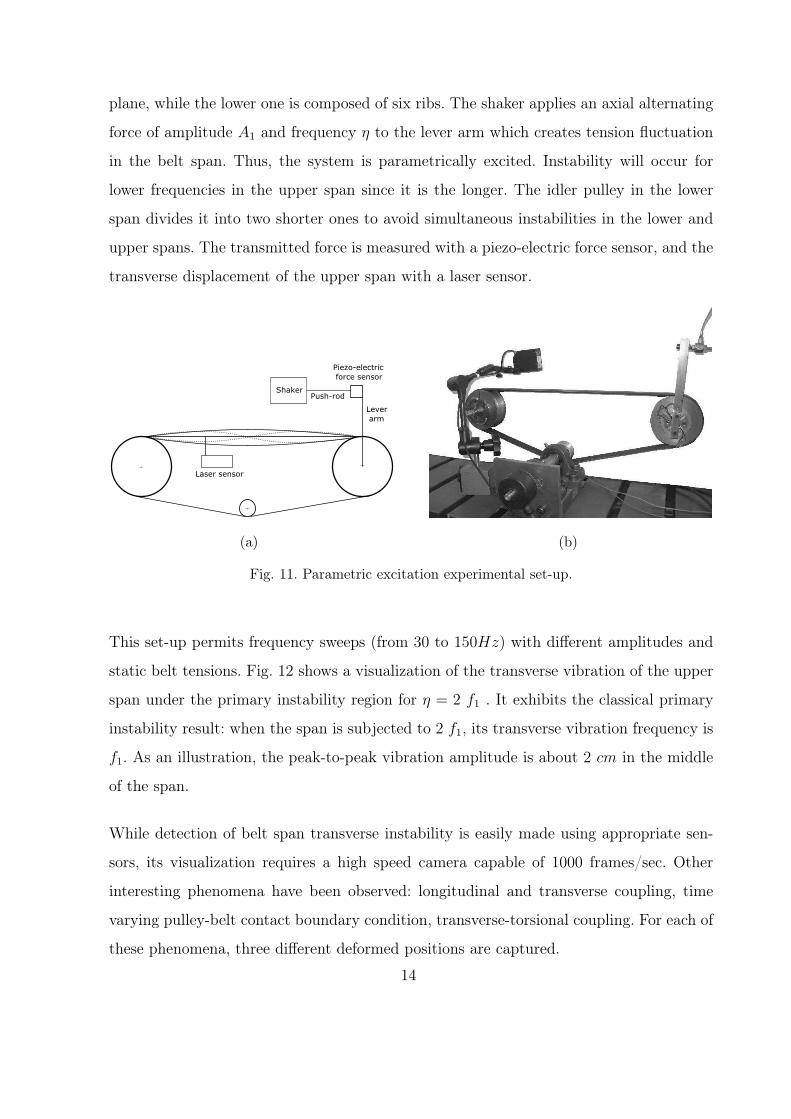
plane, while the lower one is composed of six ribs. The shaker applies an axial alternating
force of amplitude A1 and frequency η to the lever arm which creates tension fluctuation
in the belt span. Thus, the system is parametrically excited. Instability will occur for
lower frequencies in the upper span since it is the longer. The idler pulley in the lower
span divides it into two shorter ones to avoid simultaneous instabilities in the lower and
upper spans. The transmitted force is measured with a piezo-electric force sensor, and the
transverse displacement of the upper span with a laser sensor.
(a) (b)
Fig. 11. Parametric excitation experimental set-up.
This set-up permits frequency sweeps (from 30 to 150Hz) with different amplitudes and
static belt tensions. Fig. 12 shows a visualization of the transverse vibration of the upper
span under the primary instability region for η = 2 f1 . It exhibits the classical primary
instability result: when the span is subjected to 2 f1, its transverse vibration frequency is
f1. As an illustration, the peak-to-peak vibration amplitude is about 2 cm in the middle
of the span.
While detection of belt span transverse instability is easily made using appropriate sen-
sors, its visualization requires a high speed camera capable of 1000 frames/sec. Other
interesting phenomena have been observed: longitudinal and transverse coupling, time
varying pulley-belt contact boundary condition, transverse-torsional coupling. For each of
these phenomena, three different deformed positions are captured.
14
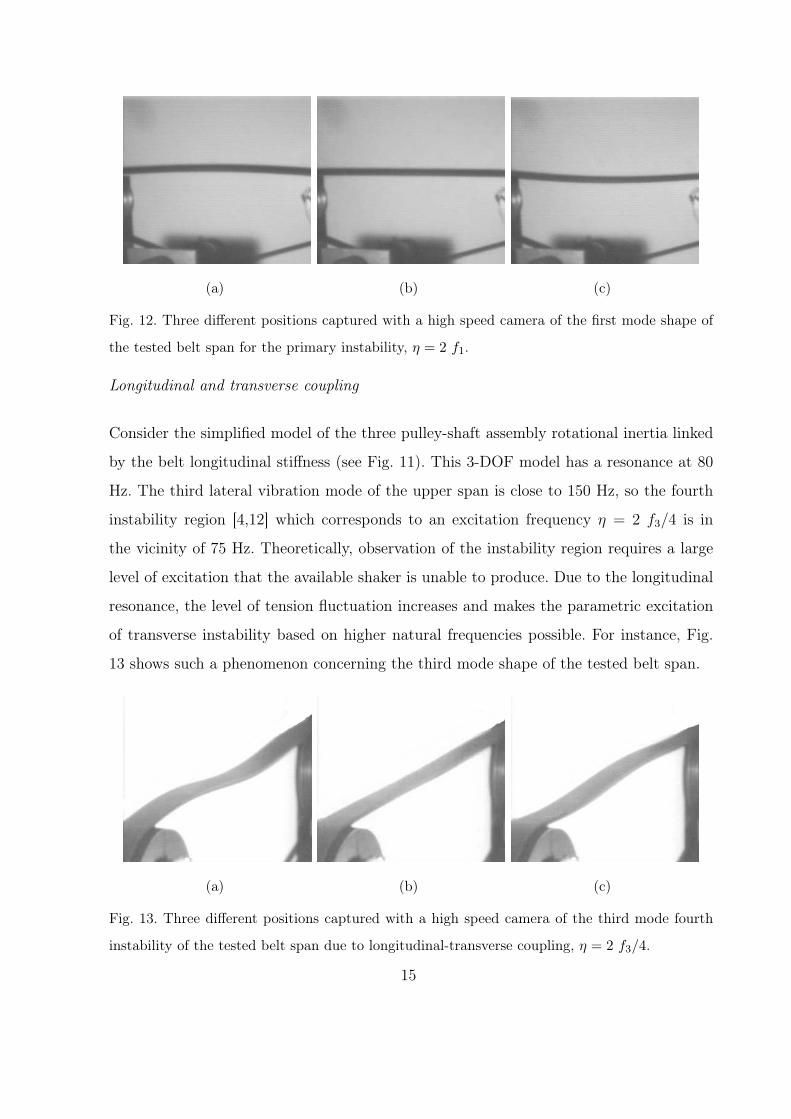
(a) (b) (c)
Fig. 12. Three different positions captured with a high speed camera of the first mode shape of
the tested belt span for the primary instability, η = 2 f1.
Longitudinal and transverse coupling
Consider the simplified model of the three pulley-shaft assembly rotational inertia linked
by the belt longitudinal stiffness (see Fig. 11). This 3-DOF model has a resonance at 80
Hz. The third lateral vibration mode of the upper span is close to 150 Hz, so the fourth
instability region [4,12] which corresponds to an excitation frequency η = 2 f3/4 is in
the vicinity of 75 Hz. Theoretically, observation of the instability region requires a large
level of excitation that the available shaker is unable to produce. Due to the longitudinal
resonance, the level of tension fluctuation increases and makes the parametric excitation
of transverse instability based on higher natural frequencies possible. For instance, Fig.
13 shows such a phenomenon concerning the third mode shape of the tested belt span.
(a) (b) (c)
Fig. 13. Three different positions captured with a high speed camera of the third mode fourth
instability of the tested belt span due to longitudinal-transverse coupling, η = 2 f3/4.
15

Boundary condition
The multi-ribbed belt is wrapped around pulleys. While typically approximated as simply
supported, the boundary condition is more complex, and uncertainty of the contact point
condition makes definition of the boundary condition difficult. When it laterally vibrates,
the length of the span is a function of time and varies approximately ±1 cm as shown on
Fig. 14 where the pulley diameter is 10 cm and the span length is 46 cm.
(a) (b) (c)
Fig. 14. Three different positions captured with a high speed camera of a belt end showing the
boundary condition evolution.
Transverse-Torsional coupling
When the belt span is subjected to parametric tension fluctuations, large amplitudes of
the first torsional mode are observed and captured, see Fig. 15. This is mostly due to the
coupling between torsional and longitudinal modes initiated by the presence of the angle
of fiber ply. Theoretical investigation of this coupling can be found in [13,14].
Discussion on the observed phenomena
The three previous phenomena are mainly due to either longitudinal-transverse or longitudinal-
torsion couplings. They can be source of noise pollution, wear, efficiency loss and belt
failures such as: fatigue, leaving the pulley ribs, belt/pulley slippage.
16
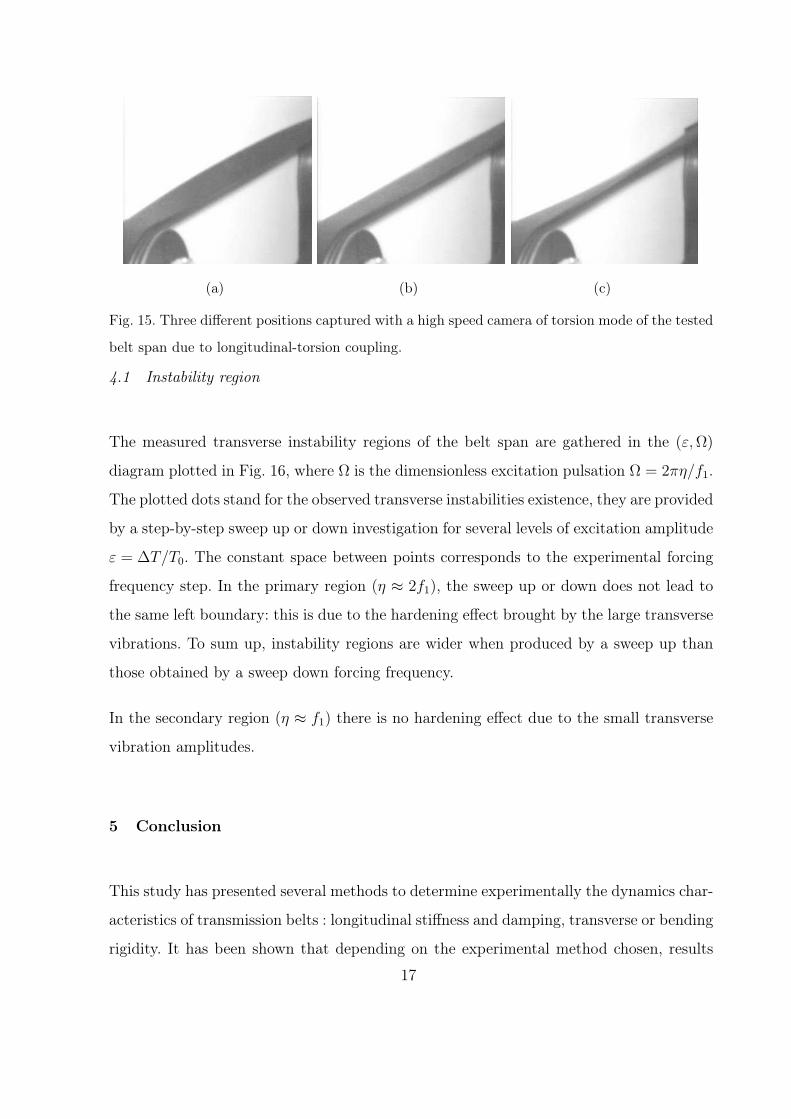
(a) (b) (c)
Fig. 15. Three different positions captured with a high speed camera of torsion mode of the tested
belt span due to longitudinal-torsion coupling.
4.1 Instability region
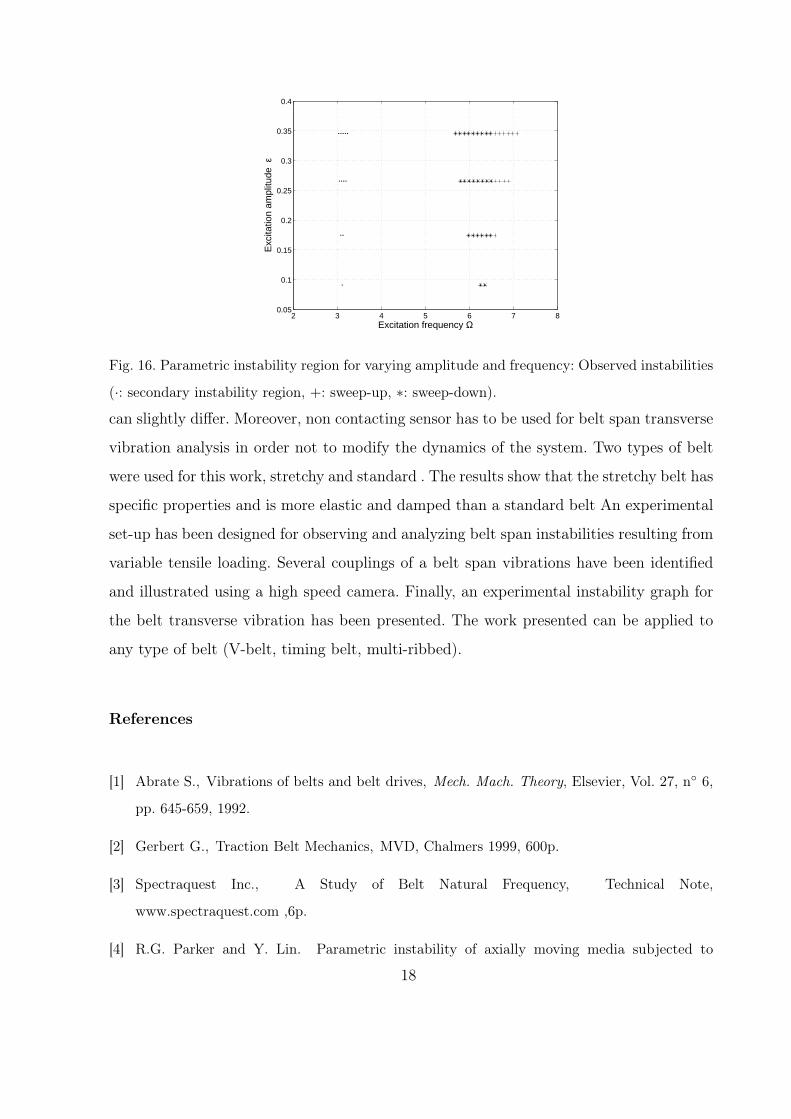
The measured transverse instability regions of the belt span are gathered in the (ε, Ω)
diagram plotted in Fig. 16, where Ω is the dimensionless excitation pulsation Ω = 2πη/f1.
The plotted dots stand for the observed transverse instabilities existence, they are provided
by a step-by-step sweep up or down investigation for several levels of excitation amplitude
ε = ∆T/T0. The constant space between points corresponds to the experimental forcing
frequency step. In the primary region (η ≈ 2f1), the sweep up or down does not lead to
the same left boundary: this is due to the hardening effect brought by the large transverse
vibrations. To sum up, instability regions are wider when produced by a sweep up than
those obtained by a sweep down forcing frequency.
In the secondary region (η ≈ f1) there is no hardening effect due to the small transverse
vibration amplitudes.
5 Conclusion
This study has presented several methods to determine experimentally the dynamics char-
acteristics of transmission belts : longitudinal stiffness and damping, transverse or bending
rigidity. It has been shown that depending on the experimental method chosen, results
17
2 3 4 5 6 7 80.05
0.1
0.15
0.2
0.25
0.3
0.35
0.4
Excitation frequency Ω
Exc
itatio
n am
plitu
de ε
Fig. 16. Parametric instability region for varying amplitude and frequency: Observed instabilities
(·: secondary instability region, +: sweep-up, ∗: sweep-down).
can slightly differ. Moreover, non contacting sensor has to be used for belt span transverse
vibration analysis in order not to modify the dynamics of the system. Two types of belt
were used for this work, stretchy and standard . The results show that the stretchy belt has
specific properties and is more elastic and damped than a standard belt An experimental
set-up has been designed for observing and analyzing belt span instabilities resulting from
variable tensile loading. Several couplings of a belt span vibrations have been identified
and illustrated using a high speed camera. Finally, an experimental instability graph for
the belt transverse vibration has been presented. The work presented can be applied to
any type of belt (V-belt, timing belt, multi-ribbed).
References
[1] Abrate S., Vibrations of belts and belt drives, Mech. Mach. Theory, Elsevier, Vol. 27, n 6,
pp. 645-659, 1992.
[2] Gerbert G., Traction Belt Mechanics, MVD, Chalmers 1999, 600p.
[3] Spectraquest Inc., A Study of Belt Natural Frequency, Technical Note,
www.spectraquest.com ,6p.
[4] R.G. Parker and Y. Lin. Parametric instability of axially moving media subjected to
18
multifrequency tension and speed fluctuation. ASME Journal of Applied Mechanics, 68:49–
57, 2001.
[5] Kong L., Parker R., G. Coupled belt-pulley vibration in serpentine drives with belt bending
stiffness, Journal of Applied Mechanics ,Vol. 71, pp. 109-119, 2004.
[6] Manin, L., Michon, G., Remond, D. From transmission error measurement to Pulley-Belt
slip determination in serpentine belt drives: influence of tensioner and belt characteristics,
12th IFToMM World Congress, Besançon, June 18-21, 2007.
[7] F. Pellicano, G. Catellani, and A. Fregolent. Parametric instability of belts: theory and
experiments. Computers and Structures, 82:81–91, 2004.
[8] Leamy, M.J. and Wasfy, T.M. Transient and Steady-State Dynamic Finite Element Modeling
of Belt-Drives ASME Journal of Dynamics Systems, Measurement, and Control, vol. 124,
2002, pp. 575-581.
[9] Kraver, T.C., Fan G.W. and Shah J.J., Complex Modal Analysis of a flat Belt Pulley System
With Belt Damping and Coulomb-Damped Tensioner, ASME Journal of Mechanical Design,
vol.118, 1996 , pp. 306-311.
[10] Kwon, Y.I. and Ih, J.-G., Vibrational Power Flow in the Moving Belt Passing Through a
Tensioner, Journal of Sound and Vibration, vol. 229, 2000, pp.329-353.
[11] Lalanne, M., Berthier P., Der Hagopian J., Mechanical Vibrations for engineers, Ed. J.
Wiley, 1984, 264p., ISBN0471901970
[12] Michon, G., Manin, L., Parker, G., R., Dufour, R., Duffing Oscillator With Parametric
Excitation: Analytical and Experimental Investigation on a Belt-Pulley System, Journal of
Computational Non linear Dynamics ,Vol. 3, 2008, doi:10.1115/1.2908160.
[13] K. Orloske, M.J. Leamy, and R.G. Parker. Flexural-torsion buckling of misaligned axially
moving beam. I. Three-dimensional modeling, equilibria, and bifurcations. International
Journal of Solids and Structures, 43:4297–4322, 2006.
[14] K. Orloske and R.G. Parker. Flexural-torsion buckling of misaligned axially moving beam.
II.Vibration and stability analysis. International Journal of Solids and Structures, 43:4323–
4341, 2006.
19


![An Experimental Investigation on the Characteristics …...An Experimental Investigation on the Characteristics of Plastics in Concrete *Praveen S [1], [1] P.G Scholar, Department](https://img.pdfslide.us/doc/110x75/5e9efcf2617a9d00f50851e2/an-experimental-investigation-on-the-characteristics-an-experimental-investigation.jpg)