Embed Size (px)
Citation preview

The Seventh International Colloquium on Bluff Body Aerodynamics and Applications (BBAA7) Shanghai, China; September 2-6, 2012
Experimental investigation on aerodynamic characteristics of various triangular-section high-rise buildings
Akihito Yoshidaa, Bandi Eswara Kumarb, Yukio Tamurac, Yong Chul Kim d, Q. Yange
a Tokyo Polytechnic University, Atsugi, Kanagawa, Japan, [email protected]
b Tokyo Polytechnic University, Atsugi, Kanagawa, Japan, [email protected] c Tokyo Polytechnic University, Atsugi, Kanagawa, Japan, [email protected] d Tokyo Polytechnic University, Atsugi, Kanagawa, Japan, [email protected]
e Beijing Jiaotong university, Beijing, China, [email protected]
ABSTRACT: Tall buildings are particularly prone to dynamic excitations such as those from natural disasters like strong winds and earthquakes, and this has become an especially important design issue with manhattanization. One way to minimize wind-induced vibrations of tall build-ings is to focus more on their shapes in the design stage. This paper investigates variations in along-wind and crosswind overturning moment coefficients, power spectral densities, and trajec-tories of various wind force coefficients.
KEYWORDS: Overturning moment coefficients, trajectories, power spectral densities 1 INTRODUCTION Helical models of square cross-section have shown good performance based on both safety and habitability criteria (Tamura et.al., 2010). The effects of building plan shape on aerodynamic forces and displacement response have been studied for super-high-rise buildings with square and triangular cross-sections with corner modifications (Hayashida et.al., 1990). Aerodynamic modification of building shape, such as by changing the cross-section with height through taper-ing, alters the flow pattern around tall buildings, which can reduce wind-induced excitations (Kim et.al., 2002). Many researchers have tested wind pressures on buildings with irregular plans (Amin et.al., 2008), buildings with different rectangular cross-sections (Lin et al., 2005), tapered building models with taper ratios of 5% and 10%, and building models with set-back at mid-height (Kim et.al., 2010). However, there have been very few studies on the aerodynamic charac-teristics of triangular-cross-section tall buildings with various configurations. The objective of this study was to investigate the aerodynamic characteristics for various triangular section mod-els.
2 EXPERIMENTAL SETUP Wind tunnel tests were conducted in a boundary layer wind tunnel at the Wind Engineering Re-search Center, Tokyo Polytechnic University, Japan. The wind tunnel test section was 19m long with a cross-section 2.2m wide by 1.8m high. Equilateral triangle models with a side dimension of 0.076m and a height of 0.4m were used. All the models had the same volume, and Straight Triangle, Corner cut, Clover, 60oHelical, 180oHelical and 360oHelical models were tested to identify their aerodynamic characteristics. These models are shown in Figure 1. The experiments were conducted for an urban (power law exponent, =0.27) flow. A length scale of 1/1000 and a
849

time scale of 1/167 were assumed. The Reynolds number was about 9.6 × 10⁴. The coordinate system adopted for the calculations is shown in Figure 2.
Figure 1. Schematic diagram of models. Figure 2. Coordinate system.
3 RESULTS AND DISCUSSIONS
3.1 Mean overturning moment coefficients Overturning moment (OTM) coefficients in the along-wind and crosswind directions were calcu-lated using the velocity pressure qH at model height, width B and height H. Figure 3 shows the variation of mean along-wind OTM coefficient ( MDC ) and mean crosswind OTM coefficient (
MLC ) with wind direction ( ). MDC values decrease and MLC values increase as helical angle increases. The MDC and MLC values of the Corner cut model follow the same trend as the Straight Triangle model. The maximum and minimum values of MDC for all the models are 0.64 and 0.3 for the Straight Triangle and Corner cut models. The maximum and minimum val-ues of MLC are 0.45 and -0.45 for the Straight Triangle model. For the 360o Helical model, the
MLC values are around 0.05~0.1 for all wind directions. The MLC and MDC values (around 0.1 and 0.4) for all the wind directions are almost constant for the 360oHelical model, as can be seen in Figure 3(b). For the Straight Triangle model, the minimum MDC occurred at 60o wind direc-tion and the curve is -shaped. Torsional moment coefficients are not discussed here in detail as these values were very small compared to the along-wind and crosswind force coefficients. They are almost 0 for the Straight Triangle, Corner cut and Clover models. The variation of mean drag and mean lift force coefficients were 1.2 and 0 for the Straight Triangle model at 0o wind direction, which is similar to the results of Kanda and Choi (1992).
Straight Triangle Corner cut Clover 60oHelical 180oHelical 360oHelical
850

The Seventh International Colloquium on Bluff Body Aerodynamics and Applications (BBAA7) Shanghai, China; September 2-6, 2012
(a) Mean along-wind OTM coefficient (b) Mean crosswind OTM coefficient Figure 3. Mean OTM coefficients.
3.2 Fluctuating OTM coefficients Figure 4 shows the variation of fluctuating along-wind OTM coefficient (C MD) and fluctuating crosswind OTM coefficient (C ML) with wind direction ( ). For the 360oHelical model, the C MD values are almost 30% larger than the C ML values. The C MD and C ML values decrease as helical angle increases for the Straight Triangle model and the Helical models. The maximum and min-imum values of C MD are 0.12 and 0.05 for the Straight Triangle model. The maximum and min-imum values of C ML are 0.12 and 0.04 for the Straight Triangle and 360oHelical models. The maximum values of C MD and C ML are the same for the Straight Triangle model. The C MD and C ML values vary almost constantly for all wind directions for the 360oHelical model.
(a) Fluctuating along-wind OTM coefficient (b) Fluctuating crosswind OTM coefficient Figure 4. Fluctuating OTM coefficients.
0 30 60 90 1200
0.2
0.4
0.6
0.8
1
Wind Direction ( )
CM
D
Straight TriangleCorner cutClover60oHelical180oHelical360oHelical
0 30 60 90 120-1
-0.5
0
0.5
1
Wind Direction ( )
CM
L
0 30 60 90 1200
0.1
0.2
Wind Direction ( )
C' M
D
Straight TriangleCorner cutClover60oHelical180oHelical360oHelical
0 30 60 90 1200
0.1
0.2
Wind Direction ( )
C' M
L
851

3.3 Maximum fluctuating OTM coefficients Maximum fluctuating OTM coefficients in the along-wind and crosswind directions have been identified for all wind directions, as shown in Figure 5. The abscissa shows the various models. As it can be seen from Figure 5, the fluctuating OTM coefficients reduce as the helical angle in-creases in both the along-wind and crosswind directions. But in the along-wind direction, the maximum fluctuating OTM coefficient is almost the same as that for the Straight Triangle mod-el. In the crosswind direction, the Clover model shows a slightly higher value than the Corner cut model.
Figure 5. Maximum fluctuating OTM coefficients in along-wind and crosswind directions.
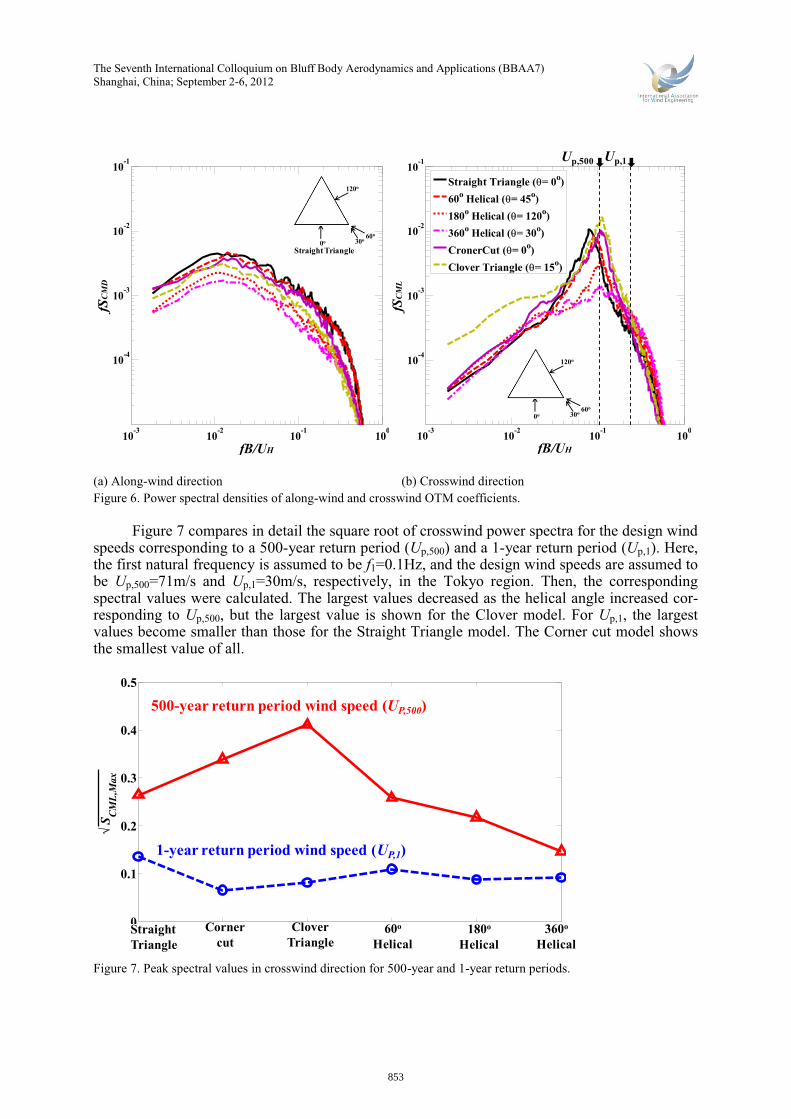
3.4 Power spectral density for along-wind and crosswind OTM coefficients Figure 6(a) shows the along-wind power spectra, fSCMD, for the wind directions corresponding to those where the maximum peak occurred for the crosswind spectra. Higher maximum peaks oc-curred for the Straight Triangle model than for all the other models. The 360oHelical model shows a smaller peak than the other models. Figure 6(b) shows the crosswind power spectra, fSCML, for the wind directions at which the maximum peak occurred. The maximum peaks oc-curred for crosswind spectra at =0o, 0o, 15o 45o, 120o and 30o for the Straight Triangle, Corner cut, Clover, 60oHelical, 180oHelical and 360oHelical models. A sharp peak of crosswind spec-trum is observed for the Straight Triangle, Corner cut and Clover models, but the maximum peak is observed for the Clover model. The sharp peak is reduced drastically for the Helical models as the helical angle increases, indicating that the shedding vortices are more disturbed than in the normal condition. As the helical angle increases, the peak shifts to higher reduced frequency ranges, and also the band width of the spectrum increases. But for the Corner cut and Clover models, the peak appears sharp and shifts towards slightly higher reduced frequency ranges than the Straight Triangle model.
1 2 3 4 5 60.05
0.1
0.15
Max
. flu
ctua
ting
OT
M c
oeffi
cien
ts
StraightTriangle
60o
Helical180o
Helical360o
HelicalCorner
cutClover
Along-wind ( MD)
Crosswind ( ML)
852
The Seventh International Colloquium on Bluff Body Aerodynamics and Applications (BBAA7) Shanghai, China; September 2-6, 2012
(a) Along-wind direction (b) Crosswind direction Figure 6. Power spectral densities of along-wind and crosswind OTM coefficients. Figure 7 compares in detail the square root of crosswind power spectra for the design wind speeds corresponding to a 500-year return period (Up,500) and a 1-year return period (Up,1). Here, the first natural frequency is assumed to be f1=0.1Hz, and the design wind speeds are assumed to be Up,500=71m/s and Up,1=30m/s, respectively, in the Tokyo region. Then, the corresponding spectral values were calculated. The largest values decreased as the helical angle increased cor-responding to Up,500, but the largest value is shown for the Clover model. For Up,1, the largest values become smaller than those for the Straight Triangle model. The Corner cut model shows the smallest value of all.
Figure 7. Peak spectral values in crosswind direction for 500-year and 1-year return periods.
0
0.1
0.2
0.3
0.4
0.5
SCM
L,M
ax
StraightTriangle
60o
Helical180o
Helical360o
HelicalCorner
cutClover
Triangle
500-year return period wind speed (UP,500)
1-year return period wind speed (UP,1)
10-3 10-2 10-1 100
10-4
10-3
10-2
10-1
fB/UH
fSC
MD
0o 30o 60o
Straight Triangle
120o
10-3 10-2 10-1 100
10-4
10-3
10-2
10-1
fB/UH
fSC
ML
Straight Triangle ( = 0o)60o Helical ( = 45o)180o Helical ( = 120o)360o Helical ( = 30o)CronerCut ( = 0o)Clover Triangle ( = 15o)
0o 30o 60o
120o
Up,500 Up,1
853
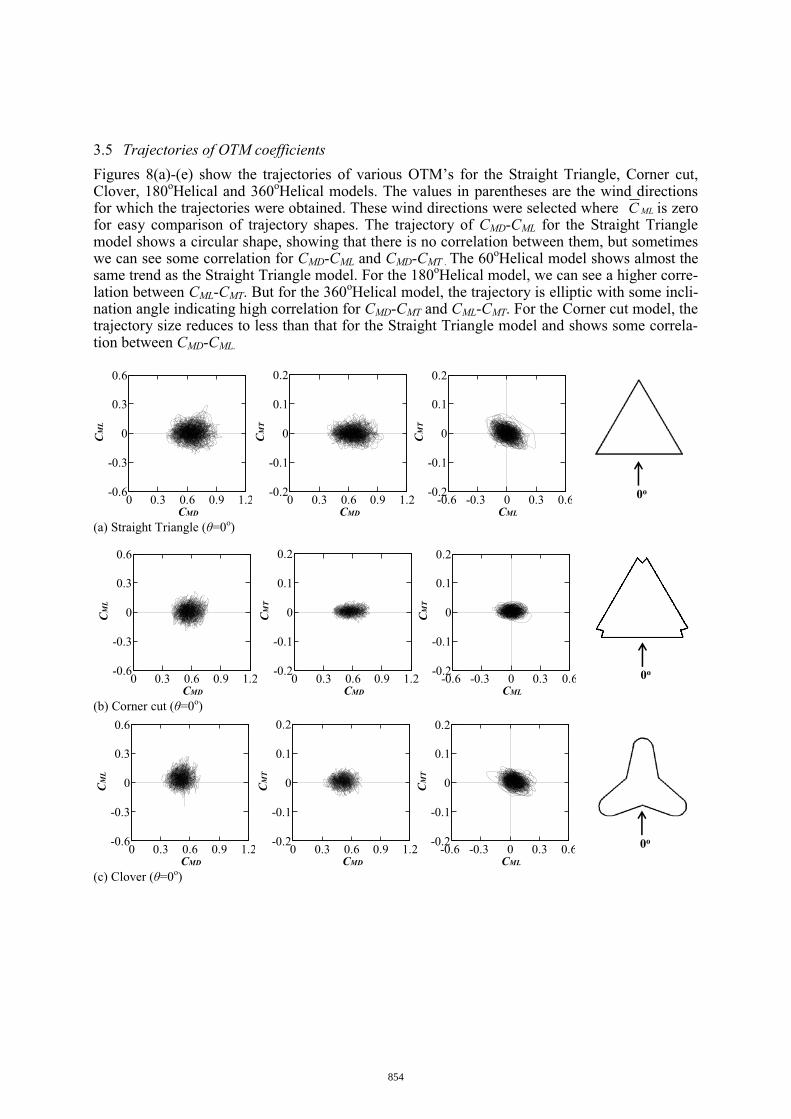
3.5 Trajectories of OTM coefficients Figures 8(a)-(e) show cut, Clover, 180oHelical and 360oHelical models. The values in parentheses are the wind directions for which the trajectories were obtained. These wind directions were selected where MLC is zero for easy comparison of trajectory shapes. The trajectory of CMD-CML for the Straight Triangle model shows a circular shape, showing that there is no correlation between them, but sometimes we can see some correlation for CMD-CML and CMD-CMT . The 60oHelical model shows almost the same trend as the Straight Triangle model. For the 180oHelical model, we can see a higher corre-lation between CML-CMT. But for the 360oHelical model, the trajectory is elliptic with some incli-nation angle indicating high correlation for CMD-CMT and CML-CMT. For the Corner cut model, the trajectory size reduces to less than that for the Straight Triangle model and shows some correla-tion between CMD-CML.
(a) Straight Triangle ( =0o)
(b) Corner cut ( =0o)
(c) Clover ( =0o)
0 0.3 0.6 0.9 1.2-0.6
-0.3
0
0.3
0.6
CMD
CM
L
0 0.3 0.6 0.9 1.2-0.2
-0.1
0
0.1
0.2
CMD
CM
T
-0.6 -0.3 0 0.3 0.6-0.2
-0.1
0
0.1
0.2
CML
CM
T
0o
0o0 0.3 0.6 0.9 1.2-0.6
-0.3
0
0.3
0.6
CMD
CM
L
0 0.3 0.6 0.9 1.2-0.2
-0.1
0
0.1
0.2
CMD
CM
T
-0.6 -0.3 0 0.3 0.6-0.2
-0.1
0
0.1
0.2
CML
CM
T
0o0 0.3 0.6 0.9 1.2-0.6
-0.3
0
0.3
0.6
CMD
CM
L
0 0.3 0.6 0.9 1.2-0.2
-0.1
0
0.1
0.2
CMD
CM
T
-0.6 -0.3 0 0.3 0.6-0.2
-0.1
0
0.1
0.2
CML
CM
T
854

The Seventh International Colloquium on Bluff Body Aerodynamics and Applications (BBAA7) Shanghai, China; September 2-6, 2012
(d)180oHelical ( =20o)
(f)360oHelical ( =60o) Figure 8. Trajectories of various wind force coefficients.
4 CONCLUSIONS
The aerodynamic characteristics of triangle section tall buildings with various configurations were investigated under urban flow conditions. The 360oHelical model showed lower values of C ML than all the other models. But, the Corner cut model showed a lower value than the Straight Triangle model in the crosswind direction. The maximum peak of the CML power spectra de-creased as the helical angle increased, but the peak frequency shifted towards the higher reduced frequency ranges as the helical angle increased. The Clover model showed a larger peak than all the other models. The smallest crosswind spectral peak was shown for the 360oHelical model and the Corner cut model corresponding to Up,500 and Up,1. The 360oHelical model showed high-er correlations for CMD-CMT and CML-CMT.
5 ACKNOWLEDGEMENTS
This study was funded by the Strategic Japanese-Chinese Technology (S&T) for Environmental Conservation and Construction of a Society with Less En-vironmental Burden" (NSFC-JST) entitled "New Strategies for Wind Disaster Risk Reduction of Wind Sensitive Infrastructures" and Global Center of Excellence (Global COE), which is grate-fully acknowledged.
0 0.3 0.6 0.9 1.2-0.6
-0.3
0
0.3
0.6
CMD
CM
L
0 0.3 0.6 0.9 1.2-0.2
-0.1
0
0.1
0.2
CMD
CM
T
-0.6 -0.3 0 0.3 0.6-0.2
-0.1
0
0.1
0.2
CML
CM
T
20o
0 0.3 0.6 0.9 1.2-0.6
-0.3
0
0.3
0.6
CMD
CM
L
0 0.3 0.6 0.9 1.2-0.2
-0.1
0
0.1
0.2
CMD
CM
T
-0.6 -0.3 0 0.3 0.6-0.2
-0.1
0
0.1
0.2
CML
CM
T
65o
855

6 REFERENCES
1 J-A., Amin, A-.K.,Ahuja, 2008, Experimental study of wind pressures on irregular plan shape buildings, BBAA VI, 20-24.
2 J., Kanda, H.,Choi, 1992, Correlating Dynamic Wind Force Components on 3-D cylinders, Journal of Wind En-gineering and Industrial Aerodynamics 41-44, 785-796.
3 N., Lin, C., Letchford, Y., Tamura, B., Liang, O., Nakamura, 2005, Characteristics of wind forces acting on tall buildings, Journal of Wind Engineering and Industrial Aerodynamics 93, 217-242.
4 Y.C., Kim, J., Kanda, 2010, Characteristics of aerodynamic force and pressures on square plan buildings with height variations, Journal of Wind Engineering and Industrial Aerodynamics 98, 449-465.
5 Y.M., Kim, Ki-Pyo You, 2002, Dynamic responses of a tapered tall building to wind loads, Journal of Wind En-gineering and Industrial Aerodynamics 90, 1771-1782.
6 Y.Tamura et al (2010), Aerodynamic characteristics of tall building models with various unconventional confi-gurations, Proceedings of the 2010 Structures Congress.
856