Embed Size (px)
Citation preview

Imperial Journal of Interdisciplinary Research (IJIR)
Vol-3, Issue-9, 2017
ISSN: 2454-1362, http://www.onlinejournal.in
Imperial Journal of Interdisciplinary Research (IJIR) Page 1127
Experimental Investigation of Use of
Microsilica in Self Compacting Concrete
Mr. Rajvardhan M. Bhosale1 & Mrs. Shruti Wadalkar
2
1M.E. Construction & Management (Appeared), Department of Civil Engineering, Dr. D. Y.
Patil Institute of Technology Pimpri, Pune, India. 2
Assistant Professor, Department of Civil Engineering, Dr. D. Y. Patil Institute of
Technology, Pimpri, Pune, India.
Abstract— Self compacting concrete construction
and placing becomes faster and easier it eliminates
the need for vibration and reducing the noise
pollution; which consumes both time and labor. This
research is described in detail and presents
laboratory observation. Microsilica is used as a 10%
replacement of cement by weight. Various test were
conducted on microsilica, fly ash, cement,
superplasticizer, fine aggregate & coarse aggregate,
to determine specific gravity, bulk density, fineness
modulus of aggregate, concrete mix proportion
design using this parameter. For conventional
concrete water cement ratio of 0.4 and for
microsilica concrete is increased water contain
about 20liter/m3. Water demand increases in
proportion to the amount of microsilica added.
Mixing the concrete and various test are conducted
on fresh concrete i.e. Slump flow, V- Funnel, L-Box,
U-Box and result are obtained. Using this concrete
cube specimen are cast for testing different hardened
properties of concrete. i.e. 3 Days, 7 Days, 14 Days,
28 Days Compressive strength of concrete.
In this study the experimental investigation for M20
grade using addition of microsilica and different
percentage of fly ash has been done. The resultant
concrete can be used for building
substructures/superstructures where economical
mixes are required with lower strength.
Keywords- Self compacting concrete, Microsilica,
fly ash.;
1. INTRODUCTION
Self compacting concrete is firstly developed in
Japan in 1980; Self compacting concrete is a fluid
mixture suitable for placing in structures with
congested reinforcement without vibration. Self
compacting concrete development must make sure a
good poise between deformability and constancy
also, compatibility is affected by the characteristics
of materials and the mix proportions, self compacting
concrete is a concrete that exhibits high
deformability while maintaining resistance to
segregation.
Microsilica is a very fine pozzolanic material,
composed of amorphous silica or ferrosilican
produced by electric arc furnaces as a byproduct of
the production of elemental silicon or ferrosilicon.
When microsilica used in the concrete, it behaves as a
cementitious materials. The small microsilica particles
fill space between the cement past matrix and
aggregate particles. Microsilica also combines with
calcium hydroxide to form additional calcium
hydroxide through the pozzolonic reaction. Both are
these reaction results in a denser, and less permeable
materials. Microsilica is specifically used for Self-
compacting concrete (SCC) is a flowing concrete
mixture. The highly fluid nature of SCC makes it
suitable for placing in difficult condition & in
selections with congested reinforcement. Use of SCC
can help in hearing related damages on construction
site that are forced by vibration of concrete, another
advantages of SCC is that the time required to place
large section in consider ability reduced. It is recently
used at Mumbai for Bandra-Warli sea Link
Bridge.Microsilica as a fine pozzoanic material
produced as byproduct In production of elemental or
ferrosilicon,its used to increase concrete
properties,specially used for SCC for more
workability and high strength.As generally SCC has
been used for higher grade or higher strength
requirements the past work was majority focused on
SCC designs of higher grade using admixtures and
elements like silica fumes and fly ash.
1.1 BACKGROUND AND SCOPE OF WORK
The aim of the experimental program is to
compare the properties of Self-compacting concrete
(M20) made with and without silica fume and fly ash
at different percentage, used as supplementary
cementing material.
The M-20 Mix has been designed as SCC with
different percentage of replacement of cement by
microsilica and fly ash.The basic tests carried out on
concrete samples are- L box,U –box ,V –funnel test,to
investigate the properties of self compacting concrete
such as workability, viscosity,flow time etc and
results are compared with IS requirement of

Imperial Journal of Interdisciplinary Research (IJIR)
Vol-3, Issue-9, 2017
ISSN: 2454-1362, http://www.onlinejournal.in
Imperial Journal of Interdisciplinary Research (IJIR) Page 1128
SCC.Finally the cubes of designed mix has been
casted for different samples and compressive strength
of same is find out.Finally the results are tabulated in
format and compared with standard requirements as
per IS
1.2 OBJECTIVES
1. The main objective of this work is study and
experimental investigation of SCC for
finding out suitability of use of SCC in low
grade concrete.
2. To study the behavior of SCC mix design
at lower grade by replacing cement content
with cementitious materials such as
Microsilica and Fly ash at different
percentage.
3. Experimental investigation to check
suitability of SCC in low grade (M20)
Concrete
1.3 NEED OF PROJECT
As generally SCC has been used for higher grade or
higher strength requirements the past work was
majority focused on SCC designs of higher grade
using admixtures and elements like silica fumes and
fly ash. In this study experiments are carried out for
lower grade self compacting concrete with addition
of micro silica and fly ash in order to reduce costing
of SCC and same can be used for economical
construction at sub structure and super structures of
buildings.
1.4 ADVANTAGES AND LIMITATIONS
1.4.1 ADVANTAGES
SCC offers many advantages for the precast, pre-
stressed concrete industry and for cast-insitu
construction:
i. Low noise-level in the plants and
construction sites.
ii. Eliminated problems associated with
vibration.
iii. Less labour involved.
iv. Faster construction.
v. Improved quality and durability.
vi. Higher strength.
1.4.2 LIMITATIONS
i. Although the use of SCC has many
technical, social, and overall economical
advantages, its supply cost is two to three
times higher than that of normal concrete
depending upon the composition of the
mixture and quality control of concrete
producer. Such a high premium has
somehow limited SCC application to
general construction. SCC is specified only
to areas where it is most needed. These
include places where access to
conventional vibration is difficult, or
where there are congested reinforcements.
ii. The major difficulty which was faced in
development of SCC was on account of
contradictory factors that the concrete
should be fully flow able but without
bleeding or segregation. It is required that
the cement mortar of the SCC should have
higher viscosity to ensure flow ability while
maintaining non-sedimentation of bigger
aggregates..
2. LITERATURE REVIEW
The research work concerning to the various
application and methods used for testing of the Self-
compacting Concrete made by various cementitious
materials and admixtures and compressive review of
the work carried out by various researchers in the field
of Self-compacting Concrete is studied.
Shaik Khadar Jilani and Vanakuri Sainath (2017)- A Study On Self Compacting Concrete Made
With Partial Replacement Of Fine Aggergate With
Robo Sand And Ggbs As Admixture - Based on the
results obtained from the experiments
conducted the following conclusions are
drawn.
Robo sand is a suitable replacement for fine
aggregate in concrete
The optimum strength is obtained for 30% GGBS
and 100% Robo sand Compaction. But this
combination failed in workability point of view.
With Respective both strength and
workability,optimum mix is concluded as 30%
GGBS and 50%Robo sand Replacement
The optimum strength is obtained for 30% GGBS
and 100% Robo sand Compaction. But this
combination failed in workability point of view.
With Respective both strength and
workability,optimum mix is concluded as 30%
GGBS and 50% Robo sand Replacement.
Payal Painuly,Itika Uniyal (2016) - Making
concrete structure without compaction has been done
in the past. Like placement of concrete underwater
by the use of termie without compaction.
Inaccessible areas were concreted using such
techniques. The production of such mixes often used
expensive admixtures and very large quantity of
Cement. But such concrete was generally of lower
strength and difficult to obtain. This lead to the

Imperial Journal of Interdisciplinary Research (IJIR)
Vol-3, Issue-9, 2017
ISSN: 2454-1362, http://www.onlinejournal.in
Imperial Journal of Interdisciplinary Research (IJIR) Page 1129
development of Self Compacting Concrete (SCC)
The workability properties of SCC such as filling
ability, passing ability and segregation resistance are
evaluated using workability tests such as slump flow,
V-funnel and L-Box tests.
To increase the stability of fresh concrete
(cohesiveness) using increased amount o
f fine materials in the mixes. To development of self-
compacting concrete with reduced segregation
potential. The systematic experimental approach
showed that partial replacement of coarse and fine
aggregate with finer materials could produce self-
compacting concrete with low segregation potential
as assessed by the V-Funnel
test.The amount of aggregates, binders and mixing
water, as well as type and dosage of super plasticizer
to be used are the major factors influencing the
properties of SCC. Slump flow,V-funnel, L-flow, U-
box and compressive strength tests were carried out
to examine the performance of SCC. If we add the
mineral admixture replacement for we can have a
better workable concrete. It has been verified, by
using the slump flow, T50 cm slump flow J-ring test,
L-box test and U-tube tests, that self-compacting
concrete (SCC) achieved consistency and self-
compatibility under its own weight, without any
external vibration or compaction. SCC with mineral
admixture exhibited satisfactory results in
workability, because of small particle size and more
surface area
2.1 PROPERTIES FRESH SCC
2.1.1 Workability
EFNARC (2002), Investigated that the SCC
flows alone under its dead weight up to leveling, airs
out and consolidates itself thereby without any entry of
additional compaction energy and without a nameable
segregation. Due to the high content of powder, SCC
may show more plastic shrinkage or creep than
ordinary concrete mixes. These aspects should
therefore be considered during designing and
specifying SCC. Current knowledge of these
aspects is limited and this is an area requiring further
research.
A concrete mix can only be classified as Self-
compacting Concrete if the requirements for all three
characteristics are fulfilled.
Filling Ability: Ability of to fill a formwork
completely under its own weight.
Passing Ability: Ability to overcome
obstacles under its own weight without
hindrance. Obstacles are e.g. reinforcement
and small openings etc.
Segregation Resistance: Homogeneous
composition of concrete during and after the
process of transport and placing. They were
further elaborated as:
Table 2.1: List of test methods for workability
properties of SCC (EFNARC, 2002)
Sr.
No.
Method Property
1. Slump-flow by Abrams
cone
Filling ability
2. T50cm slump flow Filling ability
3. J-ring Passing ability
4. V-funnel Filling ability
5. V-funnel at T5minutes Segregation
resistance
6. L-box Passing ability
7. U-box Passing ability
8. Fill-box Passing ability
9. GTM screen stability test Segregation
resistance
10. Oriment Filling ability
For the initial mix design of SCC all three
workability parameters need to be assessed to
ensure that all aspects are fulfilled. These
requirements are to be fulfilled at the time of
placing. Likely changes in workability during
transport should be taken into account in
production. Typical acceptance criteria for Self-
compacting Concrete with a maximum aggregate
size up to 20 mm are shown in Table.
Table : 2.2 Acceptance criteria for Self-compacting
Concrete (EFNARC, 2002)
Sr.
No.
Method Unit Typical range of values
Minimum Maximum
1. Slump flow
by Abrams
cone
mm 650 800
2. T50cm slump
flow
Sec 2 5
3. J-ring Mm 0 10
4. V-funnel Sec 8 12
5. V-funnel at
T5minutes
Sec 0 +3
6. L-box (h2/h1) 0.8 1.0
7. U-box (h2-
h1)mm
0 30
8. Fill-box % 90 100
9. GTM screen
stability test
% 0 15
10. Orimet sec 0 5
If a certain test result is out of range it can
have different causes. The possible cause can be
found with more certainty by checking the value to

Imperial Journal of Interdisciplinary Research (IJIR)
Vol-3, Issue-9, 2017
ISSN: 2454-1362, http://www.onlinejournal.in
Imperial Journal of Interdisciplinary Research (IJIR) Page 1130
other test methods and subjectively checking the
workability characteristics. In this way the best
possible action for solving a problem can be found.
Table and Table provide a list of possible actions and
the effect that usually occurs in concrete. It is
obvious that the effect depends upon the size of
the action and on the actual workability and
composition of the concrete mix. Every action can
have both positive and negative effect on the different
concrete characteristics.
If the test results between different batches or loads
vary considerably, the cause can be the variation of:
Cement characteristics
Addition characteristics
Grading of aggregates
Moisture content of aggregates,
Temperature
2.1.2 TEST METHOD FOR FRESH SCC
2.1.2.1 SLUMP FLOW TEST (Ferraris, 1999), The basic equipment used is the
same as for the conventional Slump test. The test
method differs from the conventional one by the fact
that the concrete sample placed into the mould is not
ridded and when the slump cone is removed the
sample collapses. The diameter of the spread of the
sample is measured, i.e. a horizontal distance is
determined as opposed to the vertical distance in the
conventional Slump test. The Slump Flow test can give an Indication as to the
consistency, filling ability and workability of SCC.
The SCC is assumed of having a good filling ability
and consistency if the diameter of the spread reaches
values between 650mm to 800mm.
2.1.2.2 V-FUNNEL TEST
(Ferraris, 1999), Viscosity of the self-compacting
concrete is obtained by using a V-funnel maximum
aggregate diameter is 20 mm. The time for the amount
of concrete to flow through the orifice is being
measured. If the concrete starts moving through the
orifice, it means that the stress is higher than the yield
stress; therefore, this test measures a value that is
related to the viscosity. If the concrete does not
move, it shows that the yield stress is greater than the
weight of the volume used. An equivalent test using
smaller funnels is used for cement paste as an
empirical test to determine the effect of chemical
admixtures on the flow of cement pastes. Figure has
certain dimensions, in order for a given amount of
concrete to pass through an orifice. The amount of
concrete needed is 12 litters.
2.1.2.3 L-BOX TEST
(Ferraris, 1999), The L-box test evaluates the passing
ability of SCC in a confined space. The L-box is
composed of a vertical arm and a horizontal arm as
shown in Fig. The concrete flows from the vertical
arm, through reinforcing bars and into the horizontal
arm of the box.
Once the test is completed, the ratio of the heights of
the concrete at the two ends of the box, called the
blocking ratio (BR), is used to evaluate the passing
ability with obstructions as BR = H2/H1
If the SCC has perfect fresh properties, the blocking
ratio is then equal to 1. Conversely, the blocking ratio
is equal to zero. If the concrete is too stiff or
segregated. Blocking ratio is useful for SCC
applications involving complex shapes, and
congested reinforcement.
2.1.2.4 U-BOX TEST
(Ferraris, 1999), The many testing methods used for
evaluating self-compactability, the U-type test
proposed by the Taisei group is the most appropriate,
due to the small amount of concrete used, compared
to others. In this test, the degree of compact ability
can be indicated by the height that the concrete
reaches after flowing through obstacles. Concrete
with the filling height of over 300 mm can be judged as
self-compacting. Some companies consider the
concrete self-compacting if the filling height is more
than 85% of the maximum height possible.
2.2 HARDENED CONCRETE TEST
2.2.1 COMPRESSIVE STRENGTH
High strength concrete with a cube compressive
strength around 100MPa can be easily achieved by
incorporating microsilica with suitable water
reducing agent and suitable aggregates. With
constant W/C ratio, compressive strength of
microsilica concrete is normally higher than
conventional concrete. Researches indicate that the
shape of W/C to strength curve of microsilica
concrete is similar to conventional concrete but
shifted to a higher level. Optimum dosage of silica
depends on many factors including type of water
reducing agent and type of cement. It can be
determined using trial mixes and, 10% of SF by
weight of cement is a good starting point.
3 EXPERIMENTAL PROGRAMME
3.1 GENERAL
The aim of the experimental program is
to compare the properties of Self-compacting
concrete made with and without silica fume and fly
ash, used as supplementary cementing material.
The basic tests carried out on concrete samples
are discussed in this chapter, followed by a brief
description about mix deign and curing procedure
adopted. At the end, the various tests conducted on
the specimens are discussed.
Imperial Journal of Interdisciplinary Research (IJIR)
Vol-3, Issue-9, 2017
ISSN: 2454-1362, http://www.onlinejournal.in
Imperial Journal of Interdisciplinary Research (IJIR) Page 1131
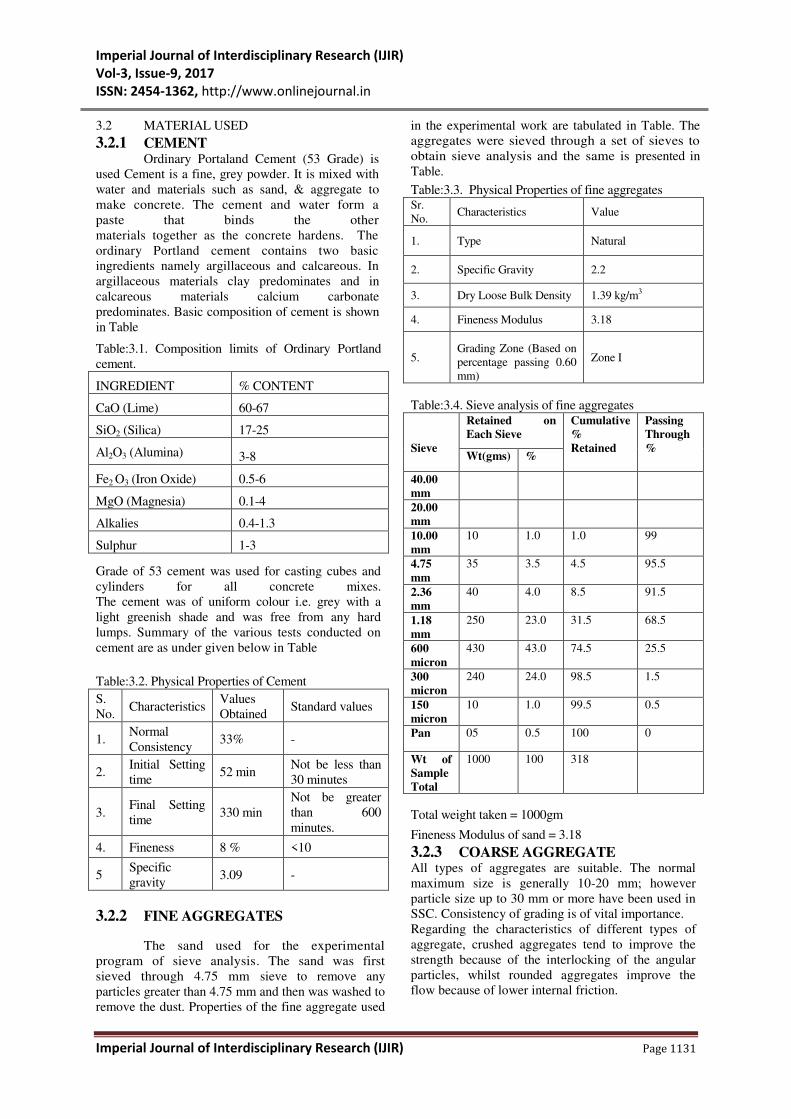
3.2 MATERIAL USED
3.2.1 CEMENT Ordinary Portaland Cement (53 Grade) is
used Cement is a fine, grey powder. It is mixed with
water and materials such as sand, & aggregate to
make concrete. The cement and water form a
paste that binds the other
materials together as the concrete hardens. The
ordinary Portland cement contains two basic
ingredients namely argillaceous and calcareous. In
argillaceous materials clay predominates and in
calcareous materials calcium carbonate
predominates. Basic composition of cement is shown
in Table
Table:3.1. Composition limits of Ordinary Portland
cement.
INGREDIENT % CONTENT
CaO (Lime) 60-67
SiO2 (Silica) 17-25
Al2O3 (Alumina) 3-8
Fe2 O3 (Iron Oxide) 0.5-6
MgO (Magnesia) 0.1-4
Alkalies 0.4-1.3
Sulphur 1-3
Grade of 53 cement was used for casting cubes and
cylinders for all concrete mixes.
The cement was of uniform colour i.e. grey with a
light greenish shade and was free from any hard
lumps. Summary of the various tests conducted on
cement are as under given below in Table
Table:3.2. Physical Properties of Cement
S.
No. Characteristics
Values
Obtained Standard values
1. Normal
Consistency 33% -
2. Initial Setting
time 52 min
Not be less than
30 minutes
3. Final Setting
time 330 min
Not be greater
than 600
minutes.
4. Fineness 8 % <10
5 Specific
gravity 3.09 -
3.2.2 FINE AGGREGATES
The sand used for the experimental
program of sieve analysis. The sand was first
sieved through 4.75 mm sieve to remove any
particles greater than 4.75 mm and then was washed to
remove the dust. Properties of the fine aggregate used
in the experimental work are tabulated in Table. The
aggregates were sieved through a set of sieves to
obtain sieve analysis and the same is presented in
Table.
Table:3.3. Physical Properties of fine aggregates Sr.
No. Characteristics Value
1. Type Natural
2. Specific Gravity 2.2
3. Dry Loose Bulk Density 1.39 kg/m3
4. Fineness Modulus 3.18
5. Grading Zone (Based on
percentage passing 0.60
mm)
Zone I
Table:3.4. Sieve analysis of fine aggregates
Sieve
Retained on
Each Sieve
Cumulative
%
Retained
Passing
Through
% Wt(gms) %
40.00
mm
20.00
mm
10.00
mm
10 1.0 1.0 99
4.75
mm
35 3.5 4.5 95.5
2.36
mm
40 4.0 8.5 91.5
1.18
mm
250 23.0 31.5 68.5
600
micron
430 43.0 74.5 25.5
300
micron
240 24.0 98.5 1.5
150
micron
10 1.0 99.5 0.5
Pan 05 0.5 100 0
Wt of
Sample
Total
1000 100 318
Total weight taken = 1000gm
Fineness Modulus of sand = 3.18
3.2.3 COARSE AGGREGATE All types of aggregates are suitable. The normal
maximum size is generally 10-20 mm; however
particle size up to 30 mm or more have been used in
SSC. Consistency of grading is of vital importance.
Regarding the characteristics of different types of
aggregate, crushed aggregates tend to improve the
strength because of the interlocking of the angular
particles, whilst rounded aggregates improve the
flow because of lower internal friction.

Imperial Journal of Interdisciplinary Research (IJIR)
Vol-3, Issue-9, 2017
ISSN: 2454-1362, http://www.onlinejournal.in
Imperial Journal of Interdisciplinary Research (IJIR) Page 1132
Table:3.5. Physical Properties of Coarse Aggregates
(20 mm)
Sr.
No
Characteristics Value
1. Type Natural
2. Specific Gravity 2.58
3. Dry Loose Bulk
Density
1.45Kg/Lit
4. Fineness Modulus 6.1
Table:3.6. Sieve Analysis of Coarse Aggregates
(20mm)
Sieve
Retained on Each
Sieve
Cumul
ative
%
Retaine
d
Passi
ng
Thro
ugh
%
Wt(gm
s)
%
40.00 mm
20.00 mm 155 15.5 15.5 84.5
10.00 mm 790 79.0 94.5 5.5
4.75 mm 55 5.5 100 0
2.36 mm
1.18 mm
600 micron
300 micron
150 micron
Pan
Wt of Sample
Total
1000 100 110
Total weight taken = 1000gm
3.2.4 Water Generally, water that is suitable for drinking is
satisfactory for use in concrete. Water from lakes
and streams that contain marine life also usually is
suitable. When water is obtained from sources
mentioned above, no sampling is necessary. When it
is suspected that water may contain sewage, mine
water, or wastes from industrial plants or canneries, it
should not be used in concrete unless tests indicate
that it is satisfactory. Water from such sources should
be avoided since the quality of the water could change
due to low water or by intermittent tap water is used
for casting.
3.2.5 SUPPLEMENTARY CEMENT
MATERIALS
3.2.5.1 MICROSILICA Microsilica’s effectiveness as a pozzolonic
and filler depends largely on its composition and
particle size which in turn depend on the design of
the furnace and the composition of the raw materials
with which the furnace is charged. Dosages of
microsilica used in concrete have typically been in
the range of 10 percent by weight of cement. Used as
an microsilica can improve the properties of both
fresh and hardened concrete. Used as a partial
replacement for cement, microsilica can substitute
for energy-consuming cement without sacrifice of
quality.
Addition of silica fume enhanced the
resistance of cement mortar to chemical attack of
acid and sulphates resistance of silica fume cement
pastes to sulphate attack was comparable to sulphate
resisting cement. This has been attributed to fine
pore structure and reduction of lime content of silica
fume concrete. The ability of silica fume to hold
alkalis was found responsible for reducing alkali
silica expansion reaction.
Table: 3.7. Physical Properties of Microsilica
Sr.
No. Physical Properties Test Result
1. Particle Shape Spherical
2. Colour White Grey
3. Specific Gravity 2.5
4. Particle Size 0.1Micron
5. Specific Surface Area 20 m3/g
6. Dry Bulk Loose
Density
400-700 gm/ lit
Table:3.8. Chemical composition of Microsilica
Constituents Percent
SiO2 90-96
Al2O3 0.5-0.8
MgO 0.5-1.5
Fe2O3 0.2-0.8
CaO 0.1-0.5
Na2O 0.2-0.7
K2O 0.4-1.0
C 0.5-1.4
S 0.1-0.4
3.2.5.2 FLY ASH Fly ash is finely divided residue resulting
from the combustion of powdered coal and
transported by the fuel gases and collected by
electrostatic precipitator. In conclusion it may be
said that although fly ash is an industrial waste, it is
use in concrete significantly improve the long term
strength and durability and reduce heat of hydration.
In other words good fly ash will be an indispensable
mineral admixture for Self compacting concrete and
high performance concrete. It increase the
workability of concrete which permits fuller
compaction fly ash also maintain pH of concrete by
consumption of calcium hydroxide in some amount
which will be liberated by amount hydration and
avoided the corrosion of steel in concrete.

Imperial Journal of Interdisciplinary Research (IJIR)
Vol-3, Issue-9, 2017
ISSN: 2454-1362, http://www.onlinejournal.in
Imperial Journal of Interdisciplinary Research (IJIR) Page 1133
ASTM broadly classify Fly Ash into two classes
Class F Fly ash: Fly ash normally produced
from burning anthracite or bituminous coal
falls in this category. This class of fly ash
exhibits pozzolanic property but rarely if
any, self-hardening property.
Class C Fly ash: Fly ash normally produced
from lignite or sub- bituminous coal is the
only material included in this category. This
class of fly ash has both pozzolanic and
varying degree of self cementitious
properties. (Most class C fly ashes contain
more than 15 % CaO. But some class C fly
ashes may contain as little as 10 % CaO.
Class F Fly Ash obtain from Dahanu
Table:3.9. Physical Properties of Class F Fly Ash
Sr.No. Physical Properties Test Result
1 Colour Grey (Blackish)
2 Specific Gravity 2.13
Table:3.10. Chemical Properties of Class F Fly Ash
Sr. No Constituents Percent by
Weight
1 Loss on ignition 4.17
2 Silica (SiO2) 58.55
3 Iron Oxide (Fe2O3) 3.44
4 Alumina (Al2O3) 28.20
5 Calcium Oxide (CaO) 2.23
6 Magnesium Oxide (MgO) 0.32
7 Total Sulphur (SO3) 0.07
8 Insoluble residue -
9 Alkalies a) Sodium Oxide
(Na2O)
b) Potassium
Oxide (K2O)
0.58
1.26
3.2.5.3 ADMIXTURE
Superplasticizers are an essential component of SCC
to provide necessary workability. Superplasticizer has
been primarily developed for application in self
compacting concrete, ready mix concrete and precast
concrete industries where the highest durability and
performance is required. Field of Application / Used
It is higher range of super plasticizer and work as a
“Hyperplasticizer” It is intended of application where
high range is required and it is developed for:-
1) Self compacting concrete
2) Concrete with highest water reducer (upto
40%)
3) Concrete requiring long workability
retention
4) Precast concrete / Pumped concrete
Table :3.11. Physical Properties of super
plasticizer
Sr.No. Physical
Properties
Test Results
1 Name AC-VISCOCRETE-P
2 Colour Brown free flowing
liquid
3 Relative density 1.22
4 PH 7 To 8
5 Chloride content Nill
3.3 MIX DESIGN (FOR M20)
1 Concrete Specification
Strength: Characteristic Compressive Strength
(Fck)= 20N/mm2
Workability: = Medium
(Table:3.12. Workability (IS: 456 2000))
Durability: Exposure Condition = Mild
(Table:3.13. Environmental Exposure Condition (IS:
456 2000))
2. Materials Properties a) Fine Aggregates
Zone =Zone 1
Table:3.14. Grading limit for fine aggregate (IS:
383-1970)
IS
Sieve
Equivalent
BS Sieve
Zone-
1
Zone-
2
Zone-
3
Zone-
4
10-mm 3/8-in 100 100 100 100
4.75-
mm
3/16-in 90-
100
90-
100
90-
100
95-
100
2.36-
mm
No. 7 60-95 75-
100
85-
100
95-
100
1,18-
mm
No. 14 30-70 55-90 75-
100
90-
100
600-
micron
N0. 25 15-34 35-59 60-79 80-
100
300-
micron
No, 52 5-20 8-30 12-40 15-50
150-
micron
No. 100 0-10 0-10 0-10 0-15
Specific Gravity =2.18
Dry Loose Bulk Density (DLBD)
=1.29Kg/lit
b) Coarse Aggregates
Specific Gravity =2.48
Dry Loose Bulk Density (DLBD)
=1.40Kg/lit
Maximum Aggregate Size = 20mm
c) Cement
Type of Cement (Fm) =OPC 53 Grade
Standard Deviation (s) =20.1Kg/cm3
Characteristic Strength of cement (Fc)=49.58N/mm2
(Fc = Fm – 1.65 s)
Cement Grade = Grade “D”
Table:3.15. 28 – Day Strength of Cement tested
according to (IS : 4031-1968)

Imperial Journal of Interdisciplinary Research (IJIR)
Vol-3, Issue-9, 2017
ISSN: 2454-1362, http://www.onlinejournal.in
Imperial Journal of Interdisciplinary Research (IJIR) Page 1134
28 – Day Strength of Cement tested according to
IS : 4031-1968 A 31.9 – 36.8 N/mm
2 E 51.5
– 56.4 N/mm2
B 36.8 – 41.7 N/mm2 F 56.4 –
61.3 N/mm2
C 41.7 – 46.6 N/mm2
G* 61.3
– 66.2 N/mm2
D 46.6 – 51.5 N/mm2
2 Maximum W/C ratio =0.5
(Table:3.16. Maximum water-cement ratio (IS:456
2000))
3 Minimum Cement Content
=290Kg/m3
4 Slump – in mm
=75mm.
5 Slump – Degree in workability
=Medium
6 Target Strength
Standard Deviation‘s =5N/mm2
Value of ‘t’ =1.65
(Table:3.17. Assumed Standard Deviation (IS: 456
2000)
Table:3.18. Value of “t” (IS: 10262-1982)
Acceptance proportion
of low result
“t”
1 in 5 0,84
1 in 10 1.28
1 in 15 1.50
1 in 20 1,65
1 in 40 1,96
1 in 100 2.33
Target Mean Strength Fm =28.25 N/mm2
(Fm = Fck + t x s)
(Relation between free water/cement ratio and
concrete strength at 28 days for different Cement
curves (IS: 10262-1982)) 8. Water - Cement ratio [W/C] (from Graph) =0.48
9. Final W/C =0.48
C FA CA Water
1 2.20 2.5 0.48
Table:3.19. Mix Proportion
Mix
ture
Ce
me
nt
(Kg
/m3)
SF
(Kg
/m3)
FA
(Kg
/m3)
San
d
(Kg
/m3)
CA
(Kg
/m3)
W
ate
r
SP
(Kg
/m3)
CC 410 915 990 19
4
SC 369 41 915 990 21
C-1 4
SC
C-A
287 41 82 915 990 21
4
6.5
SC
C-B
246 41 123 915 990 21
4
6.5
SC
C-C
205 41 164 915 990 21
4
6.5
Table: mix proportion for 1 cubic meter of
concrete.
Where,
CC= Conventional Concrete
SCC-1= Self Compacting Concrete with 10%
Microsilica.
SCC-A= Self Compacting Concrete wite 10%
Microsilica,
20% Fly Ash, & 2.4% Superplasticizer.
SCC-B= Self Compacting Concrete wite 10%
Microsilica,
30% Fly Ash, & 2.4% Superplasticizer
SCC-C= Self Compacting Concrete wite 10%
Microsilica,
40% Fly Ash, & 2.4% Superplasticizer
SF= Silica Fume or Microsilica.
FA= Fly Ash.
CA= Coarse Aggregate.
SP= Superplasticizer.
3.4 TEST CONDUCTED
3.4.1 FRESH CONCRETE TESTS.
SCC differs from conventional concrete in
that its fresh properties are vital in determining
whether or not it can be placed satisfactorily.
It is important to appreciate that none of the test
methods for SCC has yet been standardized, and the
tests described are not yet perfected or definitive.
The methods presented here are descriptions rather
than fully detailed procedures. They are mainly ad-
hoc methods, which have been devised specifically
for SCC.
3.4.1.1 SLUMP FLOW TEST
Introduction
The slump flow is used to assess the horizontal
free flow of SCC in the absence of obstructions.
It was first developed in Japan for use in
assessment of underwater concrete. The test method
is based on the test method for determining the
slump. The diameter of the concrete circle is a
measure for the filling ability of the concrete.
Assessment of test
This is a simple, rapid test procedure, though two
people are needed if the T50 time is to be measured.
It can be used on site, though the size of the base
plate is somewhat unwieldy and level ground is
essential. It is the most commonly used test, and
gives a good assessment of filling ability. It gives

Imperial Journal of Interdisciplinary Research (IJIR)
Vol-3, Issue-9, 2017
ISSN: 2454-1362, http://www.onlinejournal.in
Imperial Journal of Interdisciplinary Research (IJIR) Page 1135
no indication of the ability of the concrete to
pass between reinforcement without blocking, but
may give some indication of resistance to
segregation. It can be argued that the completely
free flow, unrestrained by any boundaries, is
not representative of what happens in practice in
concrete construction, but the test can be
profitably be used to assess the consistency of
supply of ready-mixed concrete to a site from load
to load.
Equipment
The apparatus is shown in Fig.
Mould in the shape of a truncated cone with
the internal dimensions 200 mm diameter at
the base, 100 mm diameter at the top and a
height of 300 mm.
Base plate of a stiff non absorbing material,
at least 700mm square, marked with a circle
marking the central location for the slump
cone, and a further concentric circle of
500mm diameter.
Trowel
Scoop
Measuring Tape
Procedure
About 6 liter of concrete is needed to
perform the test, sampled normally.
Moisten the base plate and inside of slump
cone, Place base plate on level stable ground
and the slump cone centrally on the base plate
and hold down firmly.
Fill the cone with the scoop. Do not tamp,
simply strike off the concrete level with the
top of the cone with the trowel.
Remove any surplus concrete from around the
base of the cone.
\Raise the cone vertically and allow the
concrete to flow out freely.
Measure the final diameter of the concrete in
two perpendicular directions.
Calculate the average of the two measured
diameters. (This is the slump flow in mm).
Note any border of mortar or cement paste
without coarse aggregate at the edge of the
pool of concrete.
Interpretation of result
The higher the slump flow (SF) value, the greater its
ability to fill formwork under its own weight. A value
of at least 650mm is required for SCC. There is no
generally accepted advice on what are reasonable
tolerances about a specified value, though ±
50mm, as with the related flow Table test, might be
appropriate.
3.4.1.2 V-FUNNEL TEST
Introduction
The equipment consists of a V-shaped funnel,
shown in Fig. The described V-funnel test is used to
determine the filling ability (flowability) of the
concrete with a maximum aggregate size of 20mm.
The funnel is filled with about 12 liters of concrete
and the time taken for it to flow through the
apparatus measured.
Assessment of test
Though the test is designed to measure
flowability, the result is affected by concrete
properties other than flow. The inverted cone shape
will cause any liability of the concrete to block to be
reflected in the result - if, for example, there is too
much coarse aggregate. High flow time can also be
associated with low deformability due to a high
paste viscosity, and with high inter-particle friction.
While the apparatus is simple, the effect of the angle
of the funnel and the wall effect on the flow of
concrete are not clear.
Equipment
V-funnel
Bucket ( ±12 liter )
Trowel
Scoop
Stopwatch
Procedure for flow time
About 12 liter of concrete is needed to
perform the test, sampled normally.
Set the V-funnel on firm ground.
Moisten the inside surfaces of the funnel.
Keep the trap door open to allow any surplus
water to drain.
Close the trap door and place a bucket
underneath.
Fill the apparatus completely with concrete
without compacting or tamping, simply
strike off the concrete level with the top with
the trowel.
Open within 10 sec after filling the trap
door and allow the concrete to flow out

Imperial Journal of Interdisciplinary Research (IJIR)
Vol-3, Issue-9, 2017
ISSN: 2454-1362, http://www.onlinejournal.in
Imperial Journal of Interdisciplinary Research (IJIR) Page 1136
under gravity.
Start the stopwatch when the trap door is
opened, and record the time for the
discharge to complete (the flow time).
This is taken to be when light is seen
from above through the funnel.
Interpretation of result
This test measures the ease of flow of the
concrete; shorter flow times indicate greater
flowability. For SCC a flow time of 8 to 12 seconds
is considered appropriate.
3.4.1.3 L-BOX TEST
Introduction
This test is based on a Japanese design for underwater
concrete. The test assesses the flow of the concrete,
and also the extent to which it is subject to blocking
by reinforcement. The apparatus is shown in Fig.
The apparatus consists of a rectangular-section box in
the shape of an ‗L‘, with a vertical and horizontal
section, separated by a moveable gate, in front of
which vertical lengths of reinforcement bar are
fitted. The vertical section is filled with concrete,
and then the gate lifted to let the concrete flow into
the horizontal section. When the flow has stopped,
the height of the concrete at the end of the horizontal
section is expressed as a proportion of that remaining
in the vertical section (H2/H1in the diagram). It
indicates the slope of the concrete when at rest. This
is an indication passing ability, or the degree to
which the passage of concrete through the bars is
restricted. The horizontal section of the box can be
marked at 200mm and 400mm from the gate and the
times taken to reach these points measured. These
are known as the T20 and T40 times and are an
indication for the filling ability.
The sections of bar can be of different diameters
and spaced at different intervals: in accordance
with normal reinforcement considerations, 3x the
maximum aggregate size might be appropriate. The bars
can principally be set at any spacing to impose a more
or less severe test of the passing ability of the concrete.
Assessment of test
This is a widely used test, suitable for laboratory, and
perhaps site use. It assesses filling and passing ability
of SCC, and serious lack of stability (segregation)
can be detected visually Segregation may also be
detected by subsequently sawing and inspecting
sections of the concrete in the horizontal section.
Unfortunately there is no agreement on materials,
dimensions, or reinforcing bar arrangement, so it is
difficult to compare test results. There is no evidence
of what effect the wall of the apparatus and the
consequent wall effect‘ might have on the concrete
flow, but this arrangement does, to some extent,
replicate what happens to concrete on site when it is
confined within formwork. Two operators are required
if times are measured, and a degree of operator error
is inevitable.
Equipment
L box of a stiff non absorbing material see
Fig
Trowel
Scoop
Stopwatch
Procedure
About 14 liter of concrete is needed to
perform the test, sampled normally.
Set the apparatus level on firm ground,
ensure that the sliding gate can open freely
and then close it.
Moisten the inside surfaces of the apparatus,
remove any surplus water.
Fill the vertical section of the apparatus with
the concrete sample.
Leave it to stand for 1 minute.
Lift the sliding gate and allow the concrete to
flow out into the horizontal section.
Simultaneously, start the stopwatch and
record the times taken for the concrete to
reach the 200 and 400 mm marks.
When the concrete stops flowing, the distances
H1 and H2are measured.
Calculate H2/H1, the blocking ratio.
The whole test has to be performed within 5
minutes.
Interpretation of result
If the concrete flows as freely as water, at rest it will
be horizontal, so H2/H1 = 1. Therefore the nearer this
test value, the ‗blocking ratio‘, is to unity, the better
the flow of the concrete. The European Union research
team suggested a minimum acceptable value of 0.8.
T20 and T40 times an give some indication of ease
of flow, but no suitable values have been generally
agreed. Obvious blocking of coarse aggregate behind
the reinforcing bars can be detected visually.
3.4.1.4 U- BOX TEST
Introduction
The test was developed by the Technology
Research Centre of the Taisei Corporation in Japan.
Sometimes the apparatus is called a U-Box test. The
test is used to measure the filling ability of self-
compacting concrete. The apparatus consists of a
vessel that is divided by a middle wall into two
compartments, shown by R1 and R2 in Fig. An
opening with a sliding gate is fitted between the
two sections. Reinforcing bars with nominal
diameters of 13 mm are installed at the gate with
centre-to-centre spacing of 50 mm. This creates a
clear spacing of 35 mm between the bars. The left

Imperial Journal of Interdisciplinary Research (IJIR)
Vol-3, Issue-9, 2017
ISSN: 2454-1362, http://www.onlinejournal.in
Imperial Journal of Interdisciplinary Research (IJIR) Page 1137
hand section is filled with about 20 liter of
concrete then the gate lifted and concrete flows
upwards into the other section. The height of the
concrete in both sections is measured.
Assessment of test
This is a simple test to conduct, but the equipment
may be difficult to construct. It provides a good direct
assessment of filling ability, this is literally what the
concrete has to do, modified by an unmeasured
requirement for passing ability. The 35mm gap
between the sections of reinforcement may be
considered too close. The question remains open of
what filling height less than 30 cm. is still acceptable.
Equipment
U box of a stiff non absorbing material see
Fig
Trowel
Scoop
Stopwatch
Procedure
About 20 liter of concrete is needed to
perform the test, sampled normally.
Set the apparatus level on firm ground,
ensure that the sliding gate can open freely
and then close it.
Moisten the inside surfaces of the apparatus,
remove any surplus water. Fill the one
compartment of the apparatus with the
concrete sample. Leave it to stand for 1
minute.
Lift the sliding gate and allow the concrete to
flow out into the other compartment.
After the concrete has come to rest,
measure the height of the concrete in the
compartment that has been filled, in two
places and calculate the mean (H1). Measure
also the height in the other compartment
(H2)
Calculate H1 - H2, the filling height.
The whole test has to be performed within 5
minutes
Interpretation of result
If the concrete flows as freely as water, at rest it will be
horizontal, so H1 - H2 = 0. Therefore the nearer this
test value, the ‗filling height‘, is to zero, the better the
flow and passing ability of the concrete.
3.4.2 HARDNESS CONCRETE TEST
3.4.2.1 CASTING OF CUBE
At a time 12 cubes were cast in the
laboratory of size 15 cm x l5 cm x 15 cm. The
casting of cubes was done as follows.
First of all the moulds used for casting
purpose were oiled from inside so that the concrete
will not stick to the surface. Then nuts and bolts were
checked, whether well tightened or not. Immediately
after mixing the concrete was field in mould. This
concrete as SCC compaction was not required. Like
this 12 moulds cubes were filled
3.4.2.2 CURING OF CUBE The prepared cubes are kept as such as a temperature
27°±2°C in an atmosphere of at least 90% relative
humidity for 24 hrs. From the time of addition of
water to dry ingredients. At the end of this period
concrete cubes are taken out of mould for curing
purpose. The method of curing by pounding in this
method after taking out cubes from the mould they
are immediately submerged in clean and fresh water
for curing and kept for specific period till they are
taken out for testing purpose.
3.4.2.3 COMPRESSIVE STRENGTH
Objective: Determination of compressive strength of
concrete.
Apparatus: Testing Machine: The testing machine
may be of any reliable type of sufficient capacity for
the tests and capable of applying the load at the
specified rate. The permissible error shall not be
greater than 2 percent of the maximum load. The
testing machine shall be equipped with two steel
bearing platens with hardened faces. One of the
platens shall be fitted with a ball seating in the form
the portion of the sphere, the centre of which
coincides with the central point of the face of the
platen. The other compression platen shall be plain
rigid bearing block. The bearing faces of both platens
shall be at least as larger as, and preferably larger than
the normal size of the specimen to which the load is
applied.
Age at test: Tests shall be made at recognized ages of
the test specimens, the most usual being 3, 7, 14 & 28
days. The ages shall be calculated from the time of the
addition of water of the dry ingredients.
Number of Specimens: At least three specimens,
preferably from different batches, shall be made for
testing at each selected age of 3, 7, 14, 28 days.
Procedure: Specimens stored in water shall be tested
immediately on removal from the water and while
they are still in the wet condition. Surface water
and grit shall be wiped off the specimens and any
projecting find removed specimens when received
dry shall be kept in water for 24 hours before they
are taken for testing. The dimensions of the
specimens to the nearest 0.2mm and their weight
shall be noted before testing. Placing the specimen
in the testing machine the bearing surface of the
testing machine shall be wiped clean and any loose
sand or other material removed from the surface of
the specimen, which are to be in contact with the
compression platens. In the case of cubes, the

Imperial Journal of Interdisciplinary Research (IJIR)
Vol-3, Issue-9, 2017
ISSN: 2454-1362, http://www.onlinejournal.in
Imperial Journal of Interdisciplinary Research (IJIR) Page 1138
specimen shall be placed in the
machine in such a manner that the load shall be
applied to opposite sides of the cubes as cast, that is,
not to the top and bottom. The axis of the specimen
shall be carefully aligned with the centre of thrust of
the spherically seated platen. No packing shall be
used between the faces of the test specimen and steel
platen of the testing machine. As the spherically
seated block is brought to bear on the specimen, the
movable portion shall be rotated gently by hand so
that uniform seating may be obtained. Until the
resistance of the specimen to the increasing load
breaks down and any unusual features in the type
of failure shall be noted.
Calculation: The measured compressive strength
of the specimen shall be calculated by dividing
the maximum load applied to the specimen during
the test by the cross sectional area, calculated from
the mean dimensions of the section and shall be
expressed to the nearest Kg/cm2. Average of three
values shall be taken for calculation
3.5 RESULTS AND DISCUSSIONS
4.1 GENERAL
In this experimental programs studied on
the conventional concrete & with replacement of
fly ash and Microsilica with cement in self-
compacting concrete are discussed. The
parameters such as Compressive strength and
comparisons between the various mixes are
represented.
4.2 FRESH CONCRETE TEST In order to study the effect on fresh concrete
properties when Microsilica and Fly Ash is added
into the concrete as cement replacement, the SCC
containing different proportion of microsilica and fly
ash were tested for Slump flow, V- Funnel, L-Box,
U-Box.
The result of fresh properties of Self compacting
microsilica and fly ash concrete are included in
table. Table shows the properties such as Slump
flow, V- Funnel, L-Box, U-Box. In terms of slump
flow, all SCC exhibited satisfactory slump flows in
rang of 550-800 mm, which is an indication of a
good deformability.
Table: 4.1. Fresh concrete properties
Mixture Slump
Cone
(mm)
Slump
Flow
(mm)
V-
Funnel
(sec)
L-Box
(H1/H2)
U-
Box
(H1-
H2)
CC 95
SCC-1 160 550 14 0.67 55
SCC-A 660 & 12 0.83 30
690
SCC-B 700 &
700
11 0.89 10
SCC-C 720 &
690
11 0.96 5
As per EFNARC, Time ranging for V-Funnel from 6
to 12 seconds is considered adequate for a SCC. The
V-funnel flow times were in the range of 4-10
seconds. Test results of this investigation indicated
that all SCC mixes meet the requirements of
allowable flow time. Maximum size of coarse
aggregate was kept as 20 mm in order to avoid
blocking effect in the L-box. The gap between re-
bars in L-box test was 35 mm. The L-box ratio
H2/H1 for the mixes was above 0.8 which is as per
EFNARC standards. U-box difference in height
of concrete in two compartments was in the range
of 5-40 mm. All the Fresh properties of concrete
values were in good agreement to that of the values
given by European guidelines.
Fig:4.1. Slump flow test at various mixes
Fig Fig: 4.2. V-Funnel test at various mixes

Imperial Journal of Interdisciplinary Research (IJIR)
Vol-3, Issue-9, 2017
ISSN: 2454-1362, http://www.onlinejournal.in
Imperial Journal of Interdisciplinary Research (IJIR) Page 1139
3.1: Fig: 4.3. L-Box test at various mixes
Fig: 4.4. U-Box test at various mixes
4.3 HARDENED CONCRETE TEST
In order to study the effect on compressive
strength when microsilica and fly ash is added into
self compacting concrete as cement replacement, the
cube containing different proportion of microsilica
and fly ash are prepared and kept for curing for 3,
7,14 and 28 days. The test are conducted on
compressive testing machine of capacity 2000 KN.
Table: 4.2. CC= Conventional Concrete
Compressive strength of cubes
Mix Curing
Period
Number
Of Cube
Compressive
strength(MPa)
Average
Compressive
strength(MPa)
M20 3 Days 1 12.21
2 9.8 10.25
3 8.72
7 Days 1 16.13
2 13.08 13.95
3 12.64
14 Days 1 19.18
2 17 18.18
3 18.3
28 Days 1 21.36
2 23.54 24.3
3 27.9
Table:4.3. SCC-1= Self Compacting Concrete with
10% Microsilica.
Compressive strength of cubes
Mix Curing
Period
Number
Of Cube
Compressive
strength(MPa)
Average
Compressive
strength(MPa)
M20 3 Days 1 13.95
2 10.9 12.5
3 12.64
7 Days 1 17.44
2 18.3 17.29
3 16.13
14 Days 1 23.54
2 19.18 21.5
3 21.8
28 Days 1 30.52
2 27.9 27.9
3 25.28
Table:4.4. SCC-A= Self Compacting
Concrete with 10% Microsilica,
20% Fly Ash, & 2.4% Superplasticizer.
Compressive strength of cubes
Mix Curing
Period
Number
Of Cube
Compressive
strength(MPa)
Average
Compressive
strength(MPa)
M20 3 Days 1 10.7
2 13.2 12.2
3 12.6
7 Days 1 18.6
2 19.0 18.3
3 17.3
14 Days 1 20.5
2 19.6 20.6
3 21.8
28 Days 1 27.3
2 26.7 27.16
3 27.5
Table: 4.5. SCC-B= Self Compacting
Concrete with 10% Microsilica,
30% Fly Ash, & 2.4% Superplasticizer.

Imperial Journal of Interdisciplinary Research (IJIR)
Vol-3, Issue-9, 2017
ISSN: 2454-1362, http://www.onlinejournal.in
Imperial Journal of Interdisciplinary Research (IJIR) Page 1140
Compressive strength of cubes
Mi
x
Curi
ng
Perio
d
Numb
er Of
Cube
Compressiv
e
strength(M
Pa)
Average
Compressiv
e
strength(M
Pa)
M2
0
3
Days 1 11.9
2 12.6 11.6
3 10.3
7
Days 1 16.1
2 18.5 17.1
3 16.7
14
Days 1 20.1
2 18.2 19.43
3 20.0
28
Days 1 25.7
2 26.6 26.06
3 25.9
Table: 4.6. SCC-C= Self Compacting Concrete with
10% Microsilica, 40% Fly Ash, &
2.4% Superplasticizer
Compressive strength of cubes
Mix Curing
Period
Number
Of
Cube
Compressive
strength(MPa)
Average
Compressive
strength(MPa)
M20 3 Days 1 9.3
2 10.5 10.3
3 11.2
7 Days 1 13.2
2 14.6 14.1
3 14.4
14
Days 1 16.5
2 18.7 17.7
3 17.8
28
Days 1 21.9
2 22.5 22.2
3 22.2
Fig: 4.5. Compressive strength of SCC mixes at
various ages
Where,
CC= Conventional Concrete
SCC-1= Self Compacting Concrete with 10%
Microsilica.
SCC-A= Self Compacting Concrete wite 10%
Microsilica,
20% Fly Ash, & 2.4% Superplasticizer.
SCC-B= Self Compacting Concrete wite 10%
Microsilica,
30% Fly Ash, & 2.4% Superplasticizer
SCC-C= Self Compacting Concrete wite 10%
Microsilica,
40% Fly Ash, & 2.4% Superplasticizer
3.6 CONCLUSION CONCLUSION On the basis of experimentation work carried out, the
following conclusions are drawn:
1. As per the observed workability and high
flow ability of SCC, it can be used in highly
congested reinforcement structure as
compare to conventional concrete.
2. 10% replacement of microsilica for cement
makes a good strength of concrete.
3. The compressive strength for design mixes
3 Days, 7 Days, 14 Days, 28 Days are
obtained 11.6MPa, 17.1MPa, 19.4MPa,
24.3MPa respectively using 10% of
Microsilica and 30% 0f Fly Ash for 53
grade of cement.
4. Compressive strength of conventional
concrete is obtained nearly equal to the
compressive strength of Self Compacting
Concrete using 10% Microsilica, 30% fly
ash and 2.4% super plasticizer.
5. SCC with 10% of Microsilica & 30% of Fly
Ash replacement the fresh properties &

Imperial Journal of Interdisciplinary Research (IJIR)
Vol-3, Issue-9, 2017
ISSN: 2454-1362, http://www.onlinejournal.in
Imperial Journal of Interdisciplinary Research (IJIR) Page 1141
compressive strength were good, after
increase the % of Fly Ash above 30% the
compressive strength of a concrete is
decrease.
6. On a basis of total cost, including the labors
charges, formwork and making good
finished surfaces, SCC can be more
advantageous.
7. Fly ash is very cheap, it can be used
successfully in place of cement, it gives
good results at very low content.
8. At this water/cement ratio, the Slump flow
test, V-funnel test, L-Box test, U-Box test
results were found to be satisfactory.
3.7 References
1. Friede Bernd - “Microsilica
Charecterization Of An Unique
Additive” , Sao Paulo, Brazil. October
15 - 18, 2006.
2. Md Safiuddin, S. N. Raman and
M.F.M. Zain - “Effect of Different
Curing Methods of the Properties of
Microsilica Concrete”, Australian
Journal of Basic andApplied Sciences,
1(2): 87-95, 2007.
3. Paramita Mondal, Surendra P. Shah,
Laurence D. Marks, and Juan J. Gaitero
- “Comparative Study of the Effects of
Microsilica and Nanosilica in
Concrete”, Transportation Research
Board of the National Academies,
Washington,2010, pp.6–9.
4. EFNARC, (2002). Specifications and
Guidelines for Self-Compacting
Concrete, EFNARC, UK
(www.efnarc.org), pp. 1-32.
5. IS: 456-2000