Embed Size (px)
Citation preview
III International Conference on Particle-based Methods – Fundamentals and Applications PARTICLES 2013
M. Bischoff, E. Oñate, D.R.J. Owen, E. Ramm & P. Wriggers (Eds)
EXPERIMENTAL INVESTIGATION OF FLOW AND SEGREGATION BEHAVIOUR OF BULK SOLIDS IN SILOS UNDER HIGH GRAVITY
CONDITIONS
J. MATHEWS1, V.P.R.KASINA2, M.COMBARROS3, W. WU1, J. F. CHEN5, A. KWADE3, H. SCHNEIDER4, J. Y. OOI2
1Institute for Geotechnical Engineering, The University of Natural Resources and Life Sciences
Feistmantelstrasse 4, 1180 Vienna, Austria e-mail: [email protected]
2Institute for Infrastructure and Environment
The University of Edinburgh Kings Buildings, Mayfield Road, EH9 3JL Edinburgh, United Kingdom
e-mail: [email protected]
3Institut für Partikeltechnik (iPAT) Technische Universität Braunschweig
Volkmaroder Str. 5,38104 Braunschweig, Germany e-mail: [email protected]
4ProcessTechnology
Zeppelin SystemsGmbH LeutholdStr. 108, 88045 Friedrichshafen, Germany
e-mail: [email protected]
5School of Planning, Architecture and Civil Engineering Queen’s University Belfast
Belfast, BT9 5AG, UK e-mail: [email protected]
Key words: Silo Centrifuge, Scaling effects, flow and segregation behaviour, PIV.
Abstract: Many researchers have investigated the flow and segregation behaviour in model scale experimental silos at normal gravity conditions. However it is known that the stresses experienced by the bulk solid in industrial silos are high when compared to model silos. Therefore it is important to understand the effect of stress level on flow and segregation behaviour and establish the scaling laws governing this behaviour. The objective of this paper is to understand the effect of gravity on the flow and segregation behaviour of bulk solids in a silo centrifuge model. The materials used were two mixtures composed of Polyamide and glass beads. The discharge of two bi-disperse bulk solids in a silo centrifuge model were recorded under accelerations ranging from 1g to 15g. The velocity distribution during discharge was evaluated using Particle Image Velocimetry (PIV) techniques and the concentration distribution of large and small particles were obtained by imaging processing techniques. The flow and segregation behaviour at high gravities were then quantified and compared with the empirical equations available in the literature.
1. INTRODUCTION
In this paper the effect of gravity on the mass flow rate, flow pattern and segregation during discharge of a silo is investigated. Understanding the effect of stress level on the flow and segregation behaviour of material is important because the stresses experienced in experimental silos are smaller than those experienced in industrial silos. The strength and
J. Mathews, V. P. R. Kasina, M. Combarros, W. Wu, J. F. Chen, A. Kwade, H. Schneider, J. Y. Ooi
flow properties of the bulk material are related to the forces between the grains which result from self-weight, normal contact forces and tangential forces, all of which are directly or indirectly proportional to the magnitude of the gravity.
Few experiments can be found in the literature investigating the discharge of cohesionless media from silos in increased gravities. Beverloo et al. (1961) [1] developed a correlation for discharge rate through an orifice which is given by (1).
∗ . (1)
where C is a discharge coefficient, is bulk density, ∗ is the gravity, D is the orifice diameter, d is the mean particle diameter and k depends on the shape of the solids. A C value of 0.58 for a circular orifice is widely accepted and k ranges from 1-1.5 for spherical particles and is slightly greater for non-spherical particles. Equation (1) suggests the discharge rate is proportional to the square root of g.
The velocity profiles in the silo are determined using image analysis through the front transparent acrylic wall and the velocity fields are investigated using Particle Image Velocimetry (PIV). PIV is a widely used technique to measure velocity profiles in one and multiphase flows as shown by White (2003), Ostendorf (2005) and Goldschmidt (2003) [2, 3, 4].
Segregation of bulk solids is a widely observed phenomenon during silo discharge. It occurs due to differences between each phase including size, density and surface roughness. Percolation and velocity gradients are two primary segregation mechanisms. Percolation is commonly observed during the filling of silos. Filtering can also occur and is the downward movement of fine particles during discharge. This mechanism is discussed in [5]. Velocity gradients that develop during discharge create segregation effects. Continuum models can be used to describe the different mechanisms that take place. The momentum and species distribution equations can be solved and the indices that describe the segregation are obtained from the solution of these equations [6].
Statistical approaches are also available to evaluate the mixing indices that quantifies the segregation [7]. The following Lacey index is widely used [8]:
/ (2)
where is the variance of the unmixed state, is the variance of the sample and is the variance of a randomly mixed state. The index takes the values from 0 to 1, being 0 a completely segregated state and 1 a randomly mixed state.
It is clear that segregation is affected by flow patterns developed during discharge which is affected by the stress state of the bulk solid. A silo centrifuge can be used to investigate the effect of stress level on flow. Molerus and Schoeneborn [1977] carried out experiments with silo centrifuge models investigating the critical outlet dimension. Scaling errors in silo centrifuge models were examined by Nielsen and Askegaard [1977], flow profiles and wall pressures were investigated by Craig and Wright [1981] and using stroboscopes and by Großstück (2005) using sensors [9,10,11,12]. Lepert et al. [1989] developed scaling laws and material substitution techniques [13]. It is evident that silo centrifuge models can be used as a tool for silo design and research. Recent advances in computing and digital imaging technology now provide opportunity for improved investigations with silo centrifuge models.
J. Mathews, V. P. R. Kasina, M. Combarros, W. Wu, J. F. Chen, A. Kwade, H. Schneider, J. Y. Ooi
2. METHODOLOGY
2.1 Experimental setup
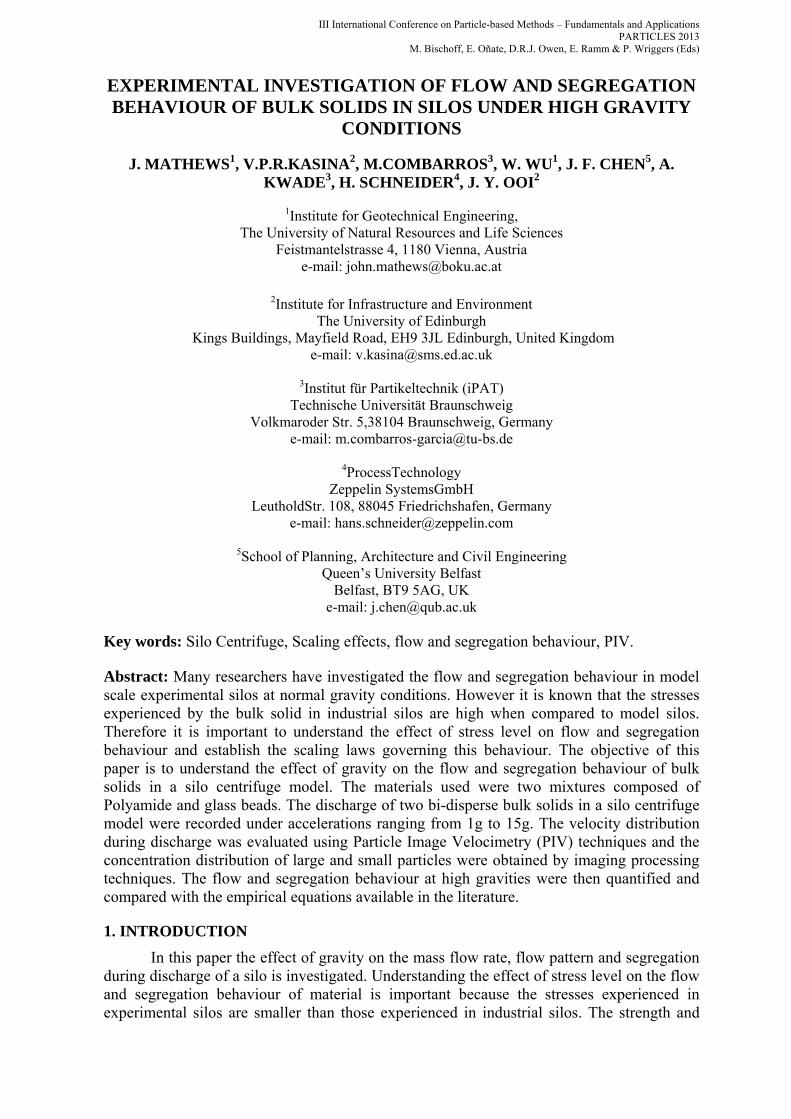
Tests were conducted using a silo centrifuge model designed for use in the geotechnical beam centrifuge at the IGT, University of Natural Resources and Life Sciences (BOKU), Vienna. (Figure 1). Table 1 shows key data about the centrifuge.
The key components of the centrifuge are shown in Figure 1 (a). The model baskets are attached horizontally to the either end of the rotating beam and they swing to align in the plane of rotation. The desired centrifugal acceleration can be achieved by adjusting the rotational speed. Because the local gravity is proportional to the distance from the axis of rotation, a gravity gradient will exist across the height of the silo. All gravities specified in these experiments are for the silo outlet, which has a radius of rotation of 1.075m. In these experiments a maximum gravity of 15g was reached, however the model has been tested up to 60g.
The model silo shown in Figure 1 (b) is a quasi-two- dimensional planar design. It has dimensions of internal width 15cm, thickness 10cm, outlet diameter 3cm and height from outlet to top of heap 29cm. The model silo can be configured either as a silo with flat bottom or a silo with 30 degree hopper (measured from the vertical).
Table 1. Technical specifications of IGT Beam Centrifuge (TRIO-TECH, 1988)
Property Value Diameter of centrifuge [m] 3.0 Radius of swinging basket axis [m] 1.085 Motor 15HP DC Radial Acceleration [g] 0 – 200 Rotation per minute [1/min] 0 – 400 Maximum load capacity [G-kg] 10,000 Maximum model mass [kg] 90 Maximum model dimensions WxDxH [mm] 540 x 560 x 560
The experimental procedure is as follows: The silo is filled at 1g using a funnel. The heap formed is symmetric about the centre of the silo. The silo centrifuge model is then accelerated to the required angular velocity and discharge is initiated by opening the silo outlet.
Figure 1. a.) Schematic sketch of Trio-Tech 1231 Geotechnical Centrifuge. b.) Model silo dimensions (mm)
J. Mathews, V. P. R. Kasina, M. Combarros, W. Wu, J. F. Chen, A. Kwade, H. Schneider, J. Y. Ooi
2.2 Instrumentation
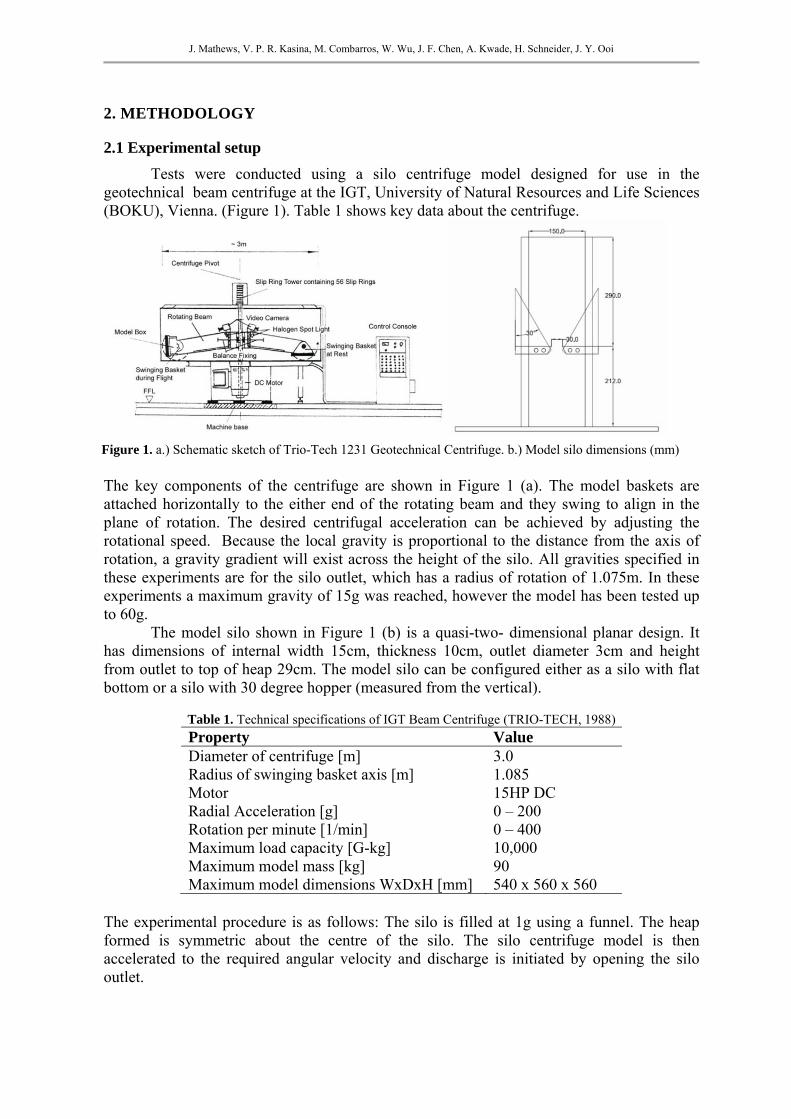
A high speed camera records the movement of material behind the front acrylic wall and two load cells below the collection box are used to measure the force exerted by material that has discharged from the silo. During discharge the force reported by the load cells increases at a rate proportional to the mass flow rate from the silo. The force gradient is converted to mass flow rate by considering the average gravity magnitude experienced by the material loading the load cells.
A Casio Exilim EX-ZR15 compact camera with a resolution of 512px × 384px and a frame rate of 232fps is used. A typical frame is seen in Figure 2. The movie recorded by the camera is split into frames and analysed using two methods; Free Surface Detection (FSD) and Particle Image Velocimetry (PIV). The image data is calibrated by placing a stopwatch in the frame so that the frame rate can be calculated. The image space coordinates is converted to object space by using the accurately defined makers on the front surface.
The videos are analysed by the Free Surface Detection method and Particle Image Velocimetry. Free Surface Detection is an image analysis technique that finds the top surface of the stored material in each frame. By considering the change in position between each frame and assuming two dimensional flow the rate of volume change is calculated. Particle Image Velocimetry (PIV) is used to investigate the flow field of the material during discharge. The open source PIV software PIVLab was used for the analysis.
2.3 Materials
Two material types are used. They are chosen for their relevance to industrial application, the particle size distribution and their colour (for the image analysis). A bi-disperse mixture of Polyamide and a bi-disperse mixture of glass beads is used. Table 2 shows their properties.
Table 2. Material properties
Property Glass Beads Polyamide Particle diameter d1, d2 [mm] 3.15 ±0.1, 1.45 ±0.1 0.8, 1.5 Average particle diameter d50 [mm] 2.3 1.375 Specific Weight ρs [g/cm3] 2.750 1.1 Bulk density ρb [g/cm3] 1.52 0.65 Void ratio e [-] 0.809 0.692 Friction angle [°] 22 25
3. RESULTS
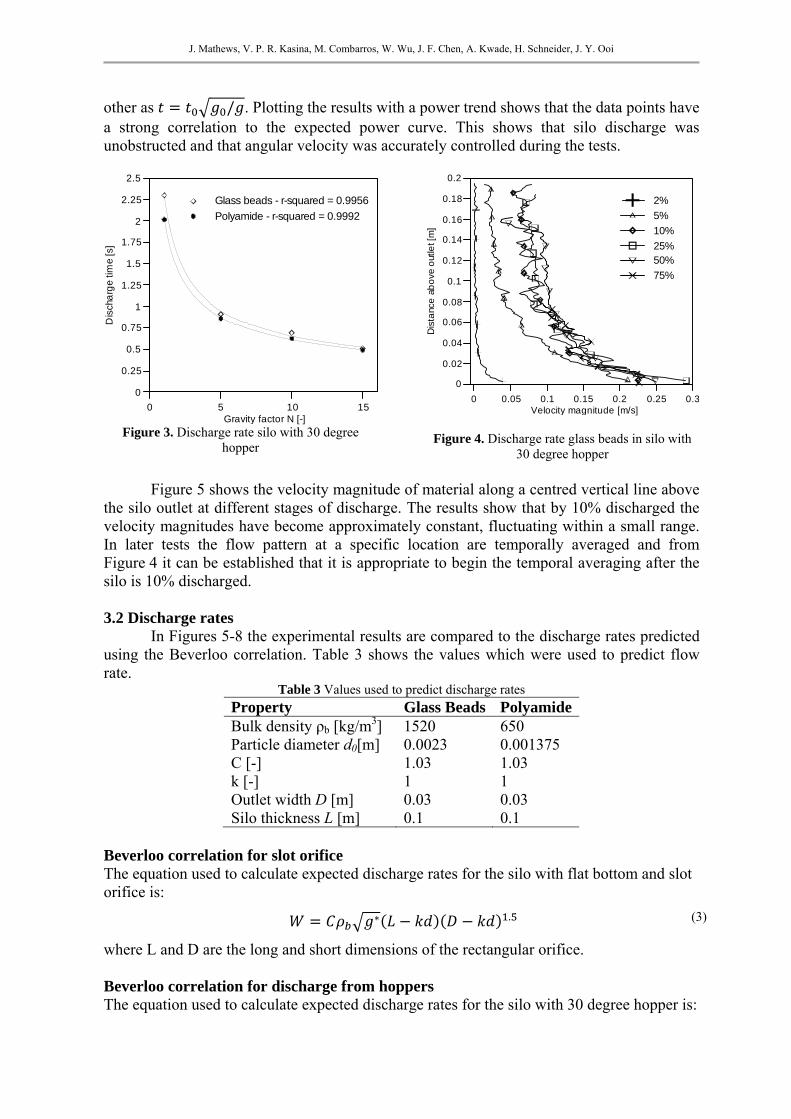
3.1 Discharge times The average time taken to discharge the silo with 30 degree hopper is shown in
Figure 3. It is calculated from a set of 3 tests at each gravity condition and with each material. Discharge time is plotted against factor of gravity N. According to the free fall arch theory of silo discharge the discharge times at different gravities should be related to each
Figure 2 Frame of movie taken during 10g discharge
Figure 2. Typical frame from experiment
J. Mathews, V. P. R. Kasina, M. Combarros, W. Wu, J. F. Chen, A. Kwade, H. Schneider, J. Y. Ooi
other as / . Plotting the results with a power trend shows that the data points have a strong correlation to the expected power curve. This shows that silo discharge was unobstructed and that angular velocity was accurately controlled during the tests.
0 5 10 15Gravity factor N [-]
0
0.5
1
1.5
2
2.5
0.25
0.75
1.25
1.75
2.25
Dis
cha
rge
tim
e [s
]
Glass beads - r-squared = 0.9956
Polyamide - r-squared = 0.9992
Figure 3. Discharge rate silo with 30 degree
hopper
0 0.1 0.2 0.30.05 0.15 0.25Velocity magnitude [m/s]
0
0.04
0.08
0.12
0.16
0.2
0.02
0.06
0.1
0.14
0.18
Dis
tanc
e a
bo
ve o
utle
t [m
]
2%
5%
10%
25%50%
75%
Figure 4. Discharge rate glass beads in silo with 30 degree hopper
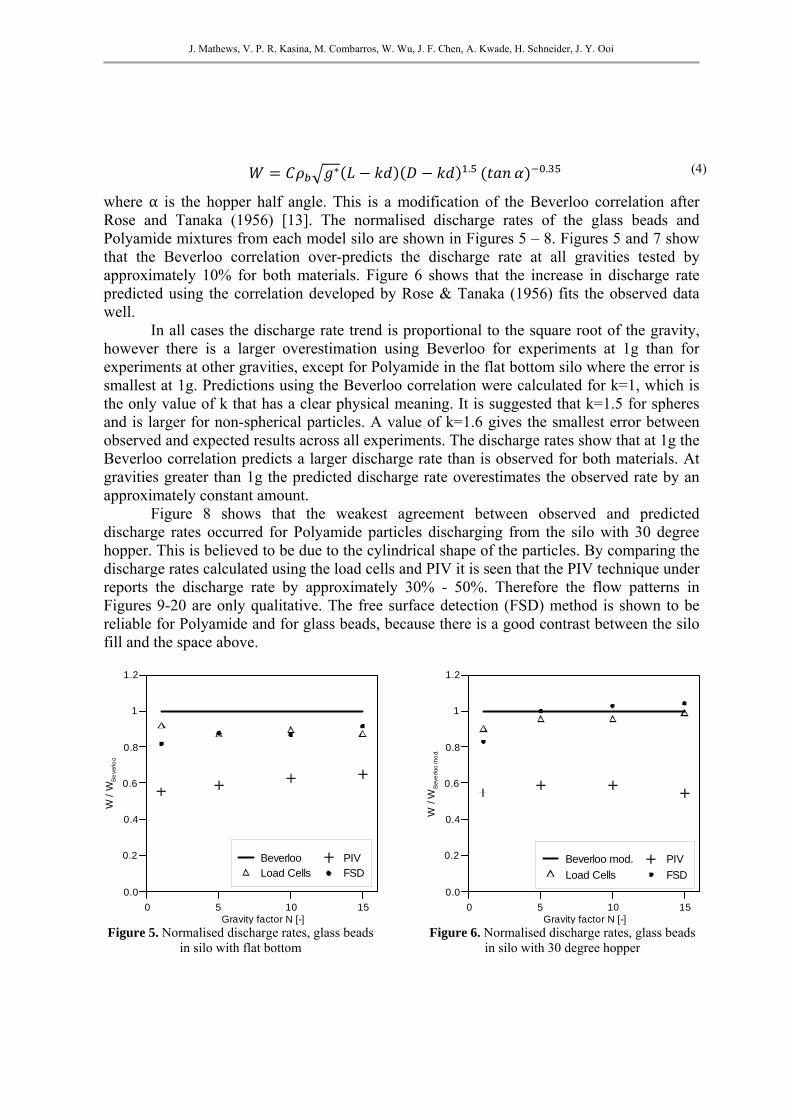
Figure 5 shows the velocity magnitude of material along a centred vertical line above the silo outlet at different stages of discharge. The results show that by 10% discharged the velocity magnitudes have become approximately constant, fluctuating within a small range. In later tests the flow pattern at a specific location are temporally averaged and from Figure 4 it can be established that it is appropriate to begin the temporal averaging after the silo is 10% discharged. 3.2 Discharge rates
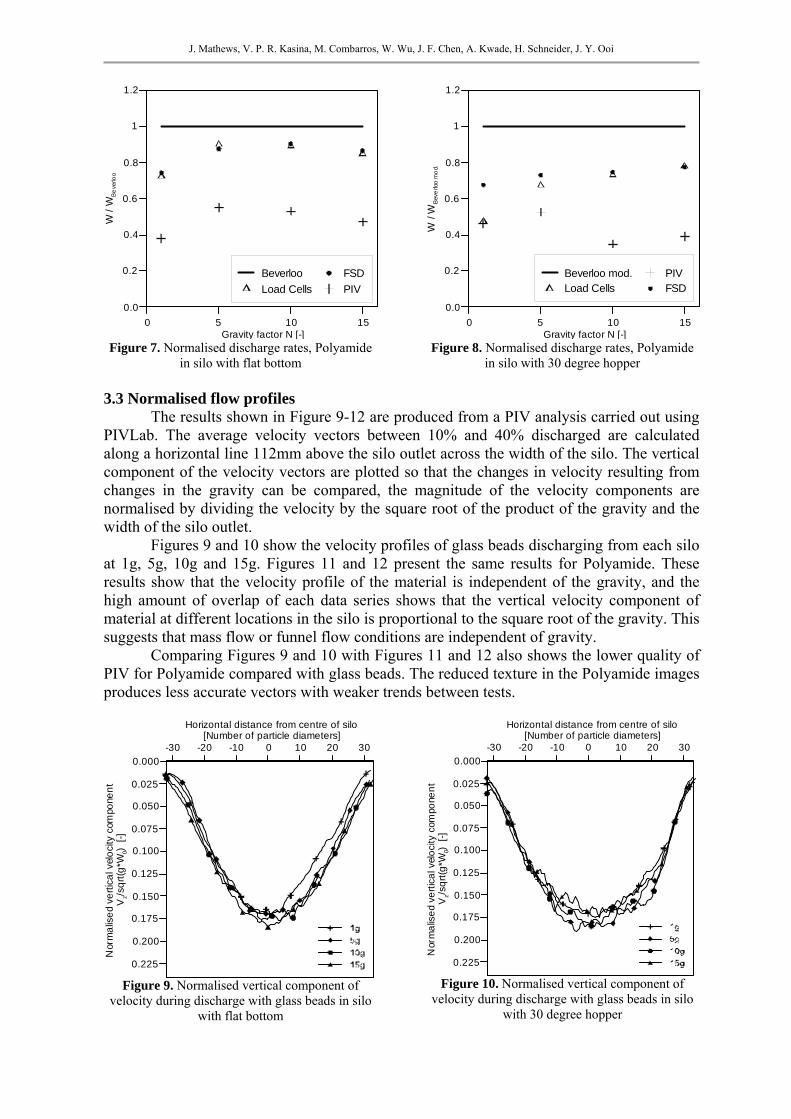
In Figures 5-8 the experimental results are compared to the discharge rates predicted using the Beverloo correlation. Table 3 shows the values which were used to predict flow rate.
Table 3 Values used to predict discharge rates
Property Glass Beads Polyamide Bulk density ρb [kg/m3] 1520 650 Particle diameter d0[m] 0.0023 0.001375 C [-] 1.03 1.03 k [-] 1 1 Outlet width D [m] 0.03 0.03 Silo thickness L [m] 0.1 0.1
Beverloo correlation for slot orifice The equation used to calculate expected discharge rates for the silo with flat bottom and slot orifice is:
∗ . (3)
where L and D are the long and short dimensions of the rectangular orifice. Beverloo correlation for discharge from hoppers The equation used to calculate expected discharge rates for the silo with 30 degree hopper is:
J. Mathews, V. P. R. Kasina, M. Combarros, W. Wu, J. F. Chen, A. Kwade, H. Schneider, J. Y. Ooi
∗ . . (4)
where α is the hopper half angle. This is a modification of the Beverloo correlation after Rose and Tanaka (1956) [13]. The normalised discharge rates of the glass beads and Polyamide mixtures from each model silo are shown in Figures 5 – 8. Figures 5 and 7 show that the Beverloo correlation over-predicts the discharge rate at all gravities tested by approximately 10% for both materials. Figure 6 shows that the increase in discharge rate predicted using the correlation developed by Rose & Tanaka (1956) fits the observed data well.
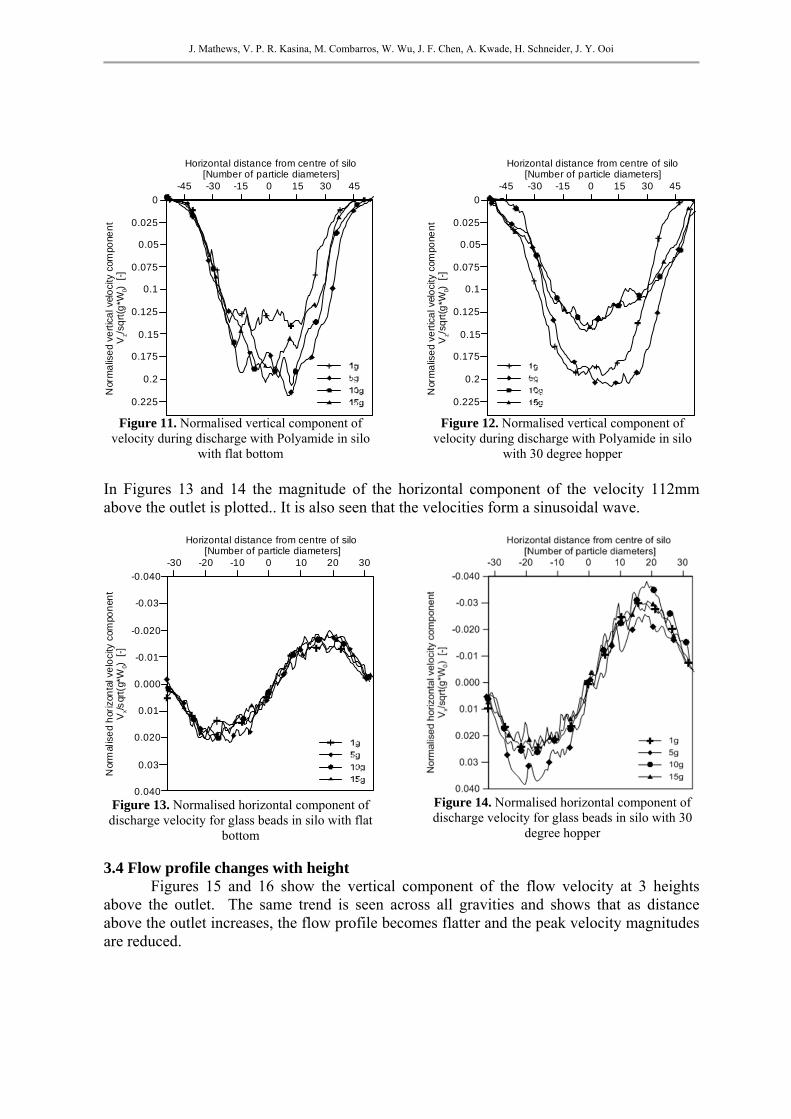
In all cases the discharge rate trend is proportional to the square root of the gravity, however there is a larger overestimation using Beverloo for experiments at 1g than for experiments at other gravities, except for Polyamide in the flat bottom silo where the error is smallest at 1g. Predictions using the Beverloo correlation were calculated for k=1, which is the only value of k that has a clear physical meaning. It is suggested that k=1.5 for spheres and is larger for non-spherical particles. A value of k=1.6 gives the smallest error between observed and expected results across all experiments. The discharge rates show that at 1g the Beverloo correlation predicts a larger discharge rate than is observed for both materials. At gravities greater than 1g the predicted discharge rate overestimates the observed rate by an approximately constant amount.
Figure 8 shows that the weakest agreement between observed and predicted discharge rates occurred for Polyamide particles discharging from the silo with 30 degree hopper. This is believed to be due to the cylindrical shape of the particles. By comparing the discharge rates calculated using the load cells and PIV it is seen that the PIV technique under reports the discharge rate by approximately 30% - 50%. Therefore the flow patterns in Figures 9-20 are only qualitative. The free surface detection (FSD) method is shown to be reliable for Polyamide and for glass beads, because there is a good contrast between the silo fill and the space above.
0 5 10 15Gravity factor N [-]
0.0
0.4
0.8
1.2
0.2
0.6
1
W /
WB
eve
rloo
BeverlooLoad Cells
PIVFSD
Figure 5. Normalised discharge rates, glass beads
in silo with flat bottom
0 5 10 15Gravity factor N [-]
0.0
0.4
0.8
1.2
0.2
0.6
1
W /
WB
eve
rloo
mo
d.
Beverloo mod.
Load Cells
PIV
FSD
Figure 6. Normalised discharge rates, glass beads
in silo with 30 degree hopper
J. Mathews, V. P. R. Kasina, M. Combarros, W. Wu, J. F. Chen, A. Kwade, H. Schneider, J. Y. Ooi
0 5 10 15Gravity factor N [-]
0.0
0.4
0.8
1.2
0.2
0.6
1
W /
WB
eve
rloo
Beverloo
Load Cells
FSD
PIV
Figure 7. Normalised discharge rates, Polyamide
in silo with flat bottom
0 5 10 15Gravity factor N [-]
0.0
0.4
0.8
1.2
0.2
0.6
1
W /
WB
eve
rloo
mo
d.
Beverloo mod.Load Cells
PIVFSD
Figure 8. Normalised discharge rates, Polyamide
in silo with 30 degree hopper
3.3 Normalised flow profiles The results shown in Figure 9-12 are produced from a PIV analysis carried out using
PIVLab. The average velocity vectors between 10% and 40% discharged are calculated along a horizontal line 112mm above the silo outlet across the width of the silo. The vertical component of the velocity vectors are plotted so that the changes in velocity resulting from changes in the gravity can be compared, the magnitude of the velocity components are normalised by dividing the velocity by the square root of the product of the gravity and the width of the silo outlet.
Figures 9 and 10 show the velocity profiles of glass beads discharging from each silo at 1g, 5g, 10g and 15g. Figures 11 and 12 present the same results for Polyamide. These results show that the velocity profile of the material is independent of the gravity, and the high amount of overlap of each data series shows that the vertical velocity component of material at different locations in the silo is proportional to the square root of the gravity. This suggests that mass flow or funnel flow conditions are independent of gravity.
Comparing Figures 9 and 10 with Figures 11 and 12 also shows the lower quality of PIV for Polyamide compared with glass beads. The reduced texture in the Polyamide images produces less accurate vectors with weaker trends between tests.
-30 -20 -10 0 10 20 30
Horizontal distance from centre of silo [Number of particle diameters]
0.200
0.150
0.100
0.050
0.000
0.225
0.175
0.125
0.075
0.025
Nor
ma
lise
d ve
rtic
al v
elo
city
com
pone
nt
Vz/
sqrt
(g*W
0) [
-]
Figure 9. Normalised vertical component of
velocity during discharge with glass beads in silo with flat bottom
-30 -20 -10 0 10 20 30
Horizontal distance from centre of silo [Number of particle diameters]
0.200
0.150
0.100
0.050
0.000
0.225
0.175
0.125
0.075
0.025
Nor
ma
lise
d ve
rtic
al v
elo
city
com
pone
nt
Vz/
sqrt
(g*W
0) [
-]
Figure 10. Normalised vertical component of
velocity during discharge with glass beads in silo with 30 degree hopper
J. Mathews, V. P. R. Kasina, M. Combarros, W. Wu, J. F. Chen, A. Kwade, H. Schneider, J. Y. Ooi
-45 -30 -15 0 15 30 45
Horizontal distance from centre of silo [Number of particle diameters]
0.2
0.15
0.1
0.05
0
0.225
0.175
0.125
0.075
0.025
Nor
ma
lise
d ve
rtic
al v
elo
city
com
pone
nt
Vz/
sqrt
(g*W
0) [
-]
Figure 11. Normalised vertical component of
velocity during discharge with Polyamide in silo with flat bottom
-45 -30 -15 0 15 30 45
Horizontal distance from centre of silo [Number of particle diameters]
0.2
0.15
0.1
0.05
0
0.225
0.175
0.125
0.075
0.025
Nor
ma
lise
d ve
rtic
al v
elo
city
com
pone
nt
Vz/
sqrt
(g*W
0) [
-]
Figure 12. Normalised vertical component of
velocity during discharge with Polyamide in silo with 30 degree hopper
In Figures 13 and 14 the magnitude of the horizontal component of the velocity 112mm above the outlet is plotted.. It is also seen that the velocities form a sinusoidal wave.
-30 -20 -10 0 10 20 30
Horizontal distance from centre of silo [Number of particle diameters]
0.040
0.020
0.000
-0.020
-0.040
0.03
0.01
-0.01
-0.03
Nor
mal
ise
d h
oriz
onta
l ve
loci
ty c
ompo
nen
tV
x/sqr
t(g*
W0)
[-
]
Figure 13. Normalised horizontal component of
discharge velocity for glass beads in silo with flat bottom
Figure 14. Normalised horizontal component of discharge velocity for glass beads in silo with 30
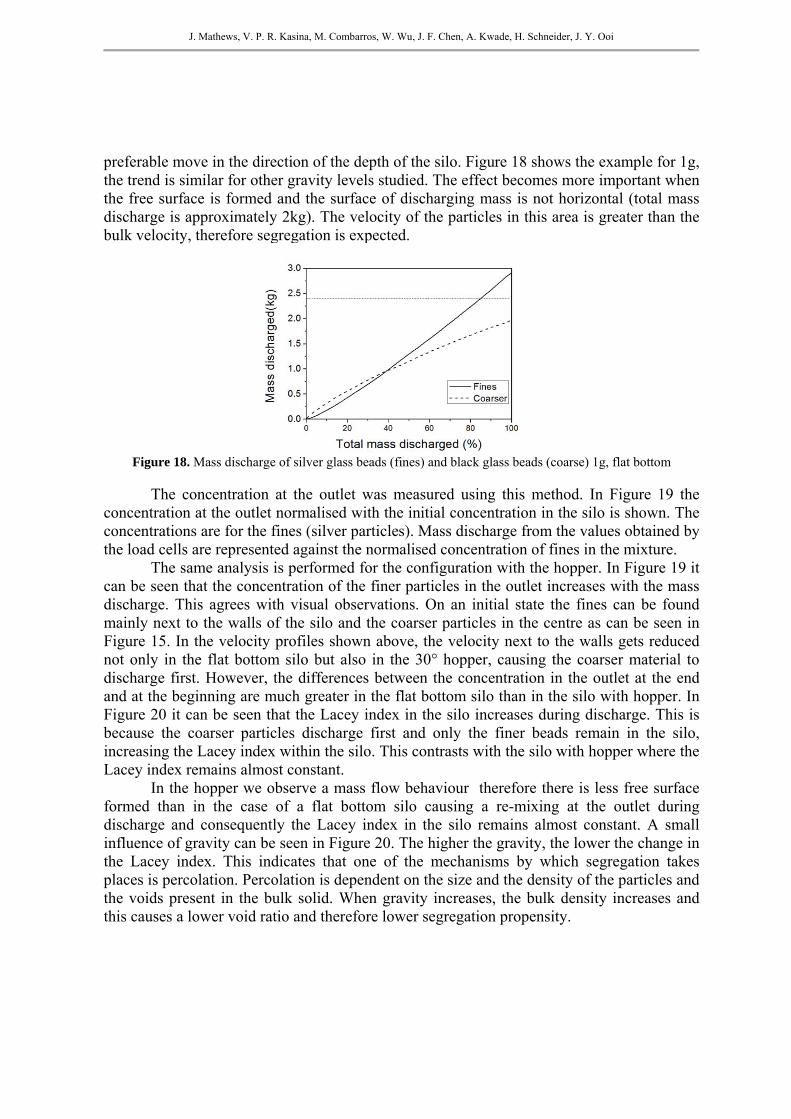
degree hopper 3.4 Flow profile changes with height
Figures 15 and 16 show the vertical component of the flow velocity at 3 heights above the outlet. The same trend is seen across all gravities and shows that as distance above the outlet increases, the flow profile becomes flatter and the peak velocity magnitudes are reduced.
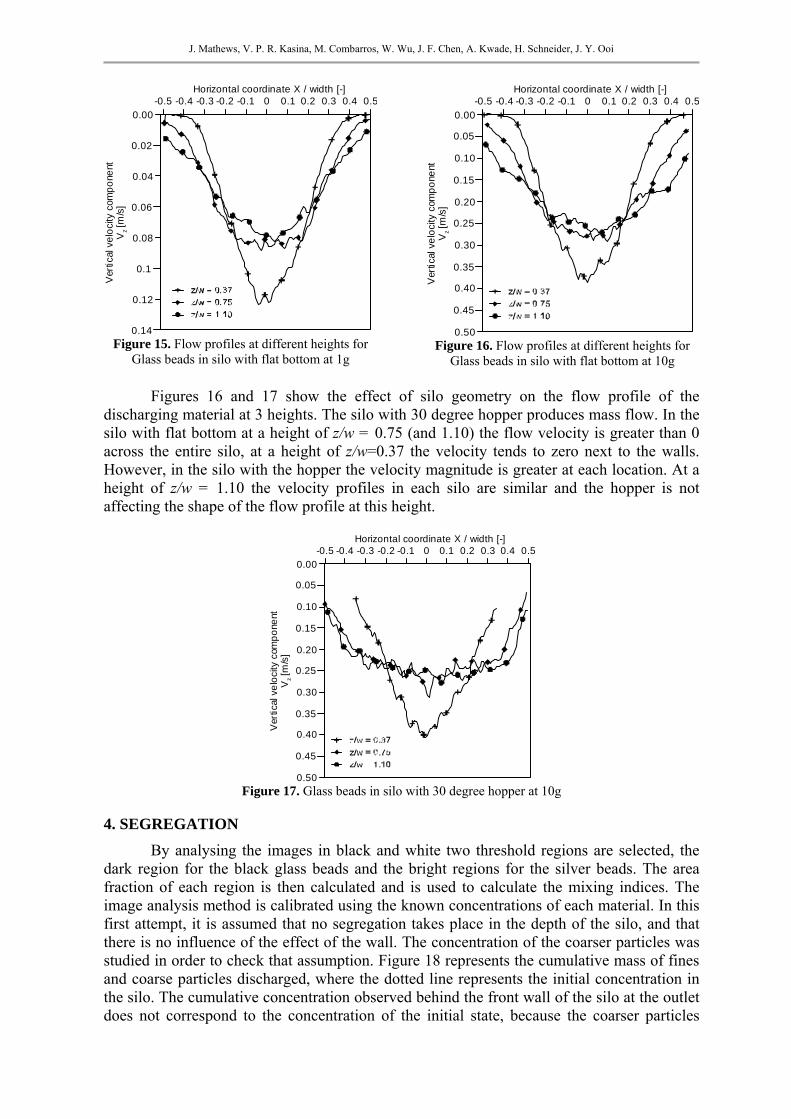
J. Mathews, V. P. R. Kasina, M. Combarros, W. Wu, J. F. Chen, A. Kwade, H. Schneider, J. Y. Ooi
-0.5 -0.4 -0.3 -0.2 -0.1 0 0.1 0.2 0.3 0.4 0.5Horizontal coordinate X / width [-]
0.12
0.08
0.04
0.00
0.14
0.1
0.06
0.02
Ver
tical
ve
loci
ty c
omp
one
ntV
z [m
/s]
Figure 15. Flow profiles at different heights for
Glass beads in silo with flat bottom at 1g
-0.5 -0.4 -0.3 -0.2 -0.1 0 0.1 0.2 0.3 0.4 0.5Horizontal coordinate X / width [-]
0.50
0.40
0.30
0.20
0.10
0.00
0.45
0.35
0.25
0.15
0.05
Ver
tical
ve
loci
ty c
omp
one
ntV
z [m
/s]
Figure 16. Flow profiles at different heights for
Glass beads in silo with flat bottom at 10g
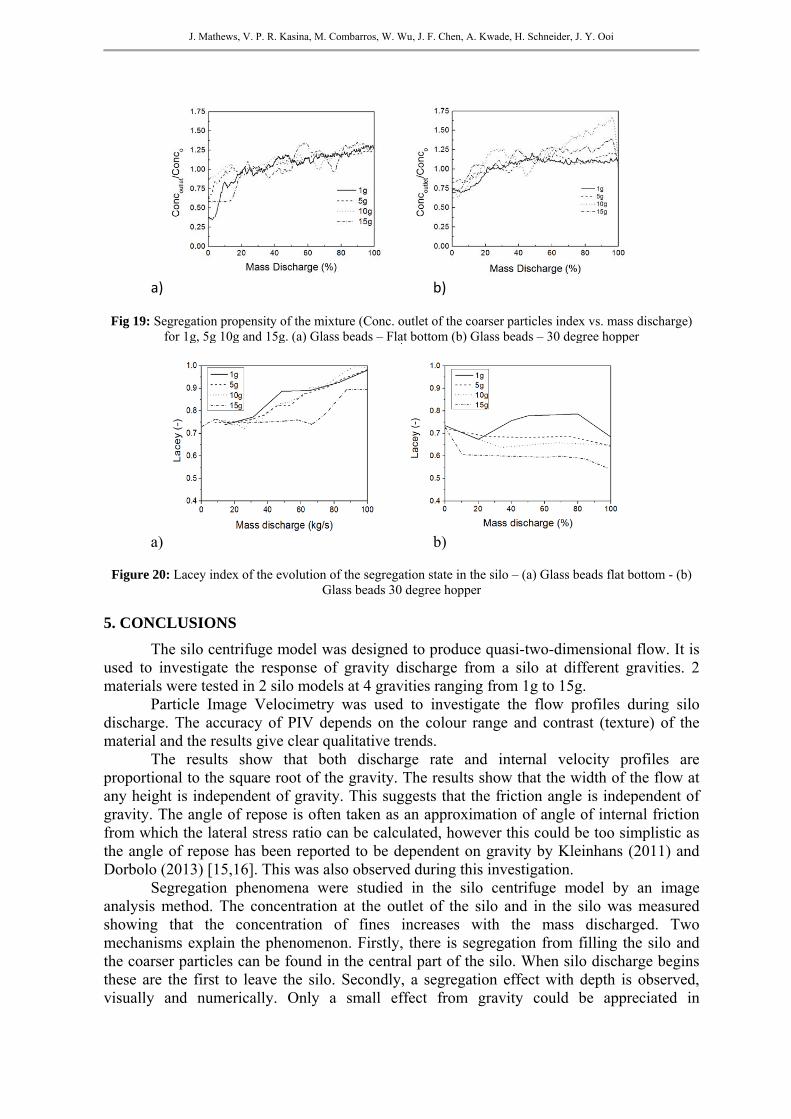
Figures 16 and 17 show the effect of silo geometry on the flow profile of the discharging material at 3 heights. The silo with 30 degree hopper produces mass flow. In the silo with flat bottom at a height of z/w = 0.75 (and 1.10) the flow velocity is greater than 0 across the entire silo, at a height of z/w=0.37 the velocity tends to zero next to the walls. However, in the silo with the hopper the velocity magnitude is greater at each location. At a height of z/w = 1.10 the velocity profiles in each silo are similar and the hopper is not affecting the shape of the flow profile at this height.
-0.5 -0.4 -0.3 -0.2 -0.1 0 0.1 0.2 0.3 0.4 0.5Horizontal coordinate X / width [-]
0.50
0.40
0.30
0.20
0.10
0.00
0.45
0.35
0.25
0.15
0.05
Ver
tical
ve
loci
ty c
omp
one
ntV
z [m
/s]
Figure 17. Glass beads in silo with 30 degree hopper at 10g
4. SEGREGATION
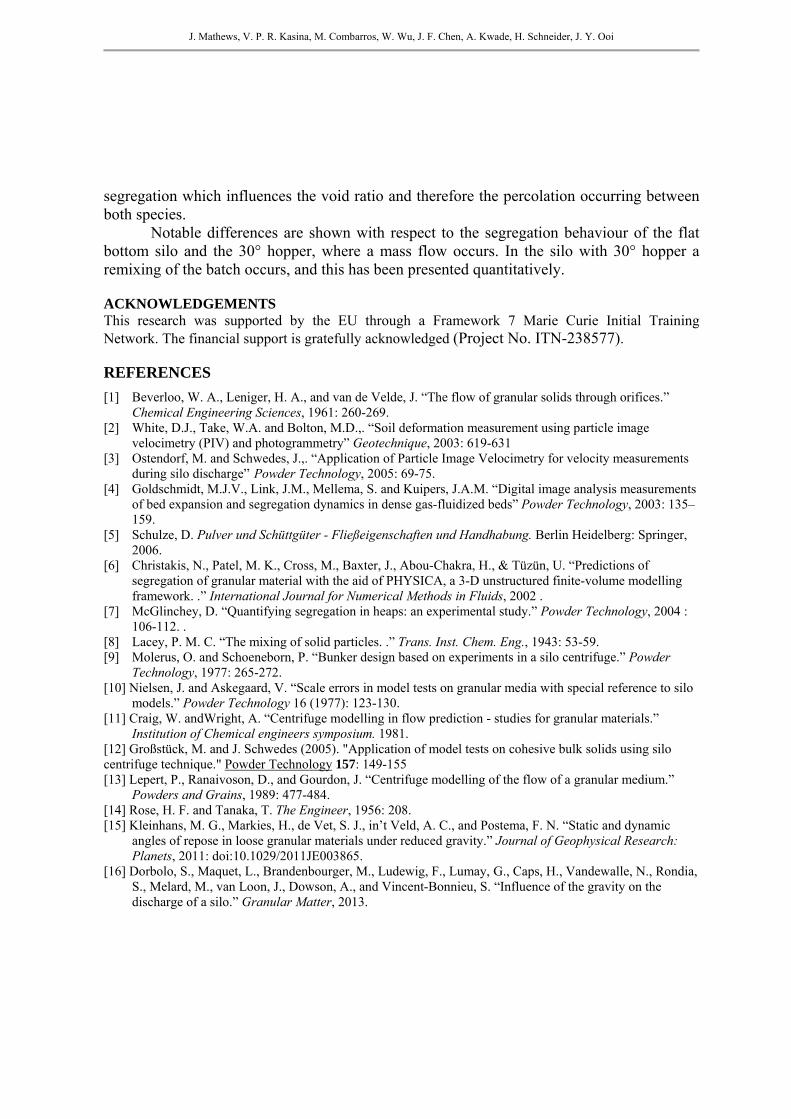
By analysing the images in black and white two threshold regions are selected, the dark region for the black glass beads and the bright regions for the silver beads. The area fraction of each region is then calculated and is used to calculate the mixing indices. The image analysis method is calibrated using the known concentrations of each material. In this first attempt, it is assumed that no segregation takes place in the depth of the silo, and that there is no influence of the effect of the wall. The concentration of the coarser particles was studied in order to check that assumption. Figure 18 represents the cumulative mass of fines and coarse particles discharged, where the dotted line represents the initial concentration in the silo. The cumulative concentration observed behind the front wall of the silo at the outlet does not correspond to the concentration of the initial state, because the coarser particles
J. Mathews, V. P. R. Kasina, M. Combarros, W. Wu, J. F. Chen, A. Kwade, H. Schneider, J. Y. Ooi
preferable move in the direction of the depth of the silo. Figure 18 shows the example for 1g, the trend is similar for other gravity levels studied. The effect becomes more important when the free surface is formed and the surface of discharging mass is not horizontal (total mass discharge is approximately 2kg). The velocity of the particles in this area is greater than the bulk velocity, therefore segregation is expected.
Figure 18. Mass discharge of silver glass beads (fines) and black glass beads (coarse) 1g, flat bottom
The concentration at the outlet was measured using this method. In Figure 19 the
concentration at the outlet normalised with the initial concentration in the silo is shown. The concentrations are for the fines (silver particles). Mass discharge from the values obtained by the load cells are represented against the normalised concentration of fines in the mixture.
The same analysis is performed for the configuration with the hopper. In Figure 19 it can be seen that the concentration of the finer particles in the outlet increases with the mass discharge. This agrees with visual observations. On an initial state the fines can be found mainly next to the walls of the silo and the coarser particles in the centre as can be seen in Figure 15. In the velocity profiles shown above, the velocity next to the walls gets reduced not only in the flat bottom silo but also in the 30° hopper, causing the coarser material to discharge first. However, the differences between the concentration in the outlet at the end and at the beginning are much greater in the flat bottom silo than in the silo with hopper. In Figure 20 it can be seen that the Lacey index in the silo increases during discharge. This is because the coarser particles discharge first and only the finer beads remain in the silo, increasing the Lacey index within the silo. This contrasts with the silo with hopper where the Lacey index remains almost constant.
In the hopper we observe a mass flow behaviour therefore there is less free surface formed than in the case of a flat bottom silo causing a re-mixing at the outlet during discharge and consequently the Lacey index in the silo remains almost constant. A small influence of gravity can be seen in Figure 20. The higher the gravity, the lower the change in the Lacey index. This indicates that one of the mechanisms by which segregation takes places is percolation. Percolation is dependent on the size and the density of the particles and the voids present in the bulk solid. When gravity increases, the bulk density increases and this causes a lower void ratio and therefore lower segregation propensity.
J. Mathews, V. P. R. Kasina, M. Combarros, W. Wu, J. F. Chen, A. Kwade, H. Schneider, J. Y. Ooi
a) b)
Fig 19: Segregation propensity of the mixture (Conc. outlet of the coarser particles index vs. mass discharge) for 1g, 5g 10g and 15g. (a) Glass beads – Flat bottom (b) Glass beads – 30 degree hopper
a) b)
Figure 20: Lacey index of the evolution of the segregation state in the silo – (a) Glass beads flat bottom - (b) Glass beads 30 degree hopper
5. CONCLUSIONS
The silo centrifuge model was designed to produce quasi-two-dimensional flow. It is used to investigate the response of gravity discharge from a silo at different gravities. 2 materials were tested in 2 silo models at 4 gravities ranging from 1g to 15g.
Particle Image Velocimetry was used to investigate the flow profiles during silo discharge. The accuracy of PIV depends on the colour range and contrast (texture) of the material and the results give clear qualitative trends.
The results show that both discharge rate and internal velocity profiles are proportional to the square root of the gravity. The results show that the width of the flow at any height is independent of gravity. This suggests that the friction angle is independent of gravity. The angle of repose is often taken as an approximation of angle of internal friction from which the lateral stress ratio can be calculated, however this could be too simplistic as the angle of repose has been reported to be dependent on gravity by Kleinhans (2011) and Dorbolo (2013) [15,16]. This was also observed during this investigation.
Segregation phenomena were studied in the silo centrifuge model by an image analysis method. The concentration at the outlet of the silo and in the silo was measured showing that the concentration of fines increases with the mass discharged. Two mechanisms explain the phenomenon. Firstly, there is segregation from filling the silo and the coarser particles can be found in the central part of the silo. When silo discharge begins these are the first to leave the silo. Secondly, a segregation effect with depth is observed, visually and numerically. Only a small effect from gravity could be appreciated in
J. Mathews, V. P. R. Kasina, M. Combarros, W. Wu, J. F. Chen, A. Kwade, H. Schneider, J. Y. Ooi
segregation which influences the void ratio and therefore the percolation occurring between both species.
Notable differences are shown with respect to the segregation behaviour of the flat bottom silo and the 30° hopper, where a mass flow occurs. In the silo with 30° hopper a remixing of the batch occurs, and this has been presented quantitatively. ACKNOWLEDGEMENTS This research was supported by the EU through a Framework 7 Marie Curie Initial Training Network. The financial support is gratefully acknowledged (Project No. ITN-238577).
REFERENCES
[1] Beverloo, W. A., Leniger, H. A., and van de Velde, J. “The flow of granular solids through orifices.” Chemical Engineering Sciences, 1961: 260-269.
[2] White, D.J., Take, W.A. and Bolton, M.D.,. “Soil deformation measurement using particle image velocimetry (PIV) and photogrammetry” Geotechnique, 2003: 619-631
[3] Ostendorf, M. and Schwedes, J.,. “Application of Particle Image Velocimetry for velocity measurements during silo discharge” Powder Technology, 2005: 69-75.
[4] Goldschmidt, M.J.V., Link, J.M., Mellema, S. and Kuipers, J.A.M. “Digital image analysis measurements of bed expansion and segregation dynamics in dense gas-fluidized beds” Powder Technology, 2003: 135–159.
[5] Schulze, D. Pulver und Schüttgüter - Fließeigenschaften und Handhabung. Berlin Heidelberg: Springer, 2006.
[6] Christakis, N., Patel, M. K., Cross, M., Baxter, J., Abou-Chakra, H., & Tüzün, U. “Predictions of segregation of granular material with the aid of PHYSICA, a 3-D unstructured finite-volume modelling framework. .” International Journal for Numerical Methods in Fluids, 2002 .
[7] McGlinchey, D. “Quantifying segregation in heaps: an experimental study.” Powder Technology, 2004 : 106-112. .
[8] Lacey, P. M. C. “The mixing of solid particles. .” Trans. Inst. Chem. Eng., 1943: 53-59. [9] Molerus, O. and Schoeneborn, P. “Bunker design based on experiments in a silo centrifuge.” Powder
Technology, 1977: 265-272. [10] Nielsen, J. and Askegaard, V. “Scale errors in model tests on granular media with special reference to silo
models.” Powder Technology 16 (1977): 123-130. [11] Craig, W. andWright, A. “Centrifuge modelling in flow prediction - studies for granular materials.”
Institution of Chemical engineers symposium. 1981. [12] Großstück, M. and J. Schwedes (2005). "Application of model tests on cohesive bulk solids using silo centrifuge technique." Powder Technology 157: 149-155 [13] Lepert, P., Ranaivoson, D., and Gourdon, J. “Centrifuge modelling of the flow of a granular medium.”
Powders and Grains, 1989: 477-484. [14] Rose, H. F. and Tanaka, T. The Engineer, 1956: 208. [15] Kleinhans, M. G., Markies, H., de Vet, S. J., in’t Veld, A. C., and Postema, F. N. “Static and dynamic
angles of repose in loose granular materials under reduced gravity.” Journal of Geophysical Research: Planets, 2011: doi:10.1029/2011JE003865.
[16] Dorbolo, S., Maquet, L., Brandenbourger, M., Ludewig, F., Lumay, G., Caps, H., Vandewalle, N., Rondia, S., Melard, M., van Loon, J., Dowson, A., and Vincent-Bonnieu, S. “Influence of the gravity on the discharge of a silo.” Granular Matter, 2013.