Embed Size (px)
Citation preview

RESEARCH PAPER
Experimental investigation into the convective heat transferand system-level effects of Al2O3-propanol nanofluid
Andrew D. Sommers Æ Kirk L. Yerkes
Received: 11 March 2009 / Accepted: 4 May 2009
� Springer Science+Business Media B.V. 2009
Abstract It has been speculated that the application
of nanofluids in real systems could lead to smaller,
more compact heat exchangers and reductions in
material cost. However, few studies have been
conducted which have carefully measured the
thermo-physical properties and thermal performance
of these fluids as well as examine the system-level
effects of using these fluids in traditional cooling
systems. In this study, dilute suspensions of 10 nm
aluminum oxide nanoparticles in propanol (0.5, 1,
and 3 wt%) were investigated. Changes in density,
specific heat, and thermal conductivity with particle
concentration were measured and found to be linear,
whereas changes in viscosity were nonlinear and
increased sharply with particle loading. Nanofluid
heat transfer performance data were generally com-
mensurate with that measured for the baseline. For
the 1 wt% concentration, a small but significant
enhancement in the heat transfer coefficient was
recorded for 1800 \ Re \ 2800, which is attributed
to an earlier transition to turbulent flow. In the case of
high particle loading (i.e. 3 wt%), the thermal
performance was observed to deteriorate with respect
to the baseline case. Discoloration of the fluid was
also observed after being cycled at high flow rates
and increased temperature.
Keywords Nanofluids � Aluminum oxide �Propanol � Nanoparticles � Convective heat transfer �Colloids
Introduction
The rapid proliferation of nanoparticle research over
the last few years stems from the early discoveries of
Choi (1995) and others who found that the seeding of
a base fluid with small concentrations of nanoparti-
cles results in an increase in the thermal conductivity
of the base fluid. However, despite this recent
proliferation of nanofluid research over the last few
years and its potential for heat transfer enhancement,
our current understanding of how nanofluids impact
system components such as pumps, turbines, and heat
exchangers is still currently quite limited. In fact,
very little nanofluid research has been conducted in
traditional heat transfer cooling systems such as those
involved in the thermal management of terrestrial,
naval, and aircraft propulsion and power systems.
Moreover, there is still some disagreement in the
A. D. Sommers (&)
Department of Mechanical and Manufacturing
Engineering, Miami University, 56 Engineering Building,
Oxford, OH 45056, USA
e-mail: [email protected]
K. L. Yerkes
Propulsion Directorate, Air Force Research Laboratory
AFRL/RZP, Bldg 18A, 1950 Fifth Street, Wright-
Patterson AFB, Dayton, OH 45433-7251, USA
e-mail: [email protected]
123
J Nanopart Res
DOI 10.1007/s11051-009-9657-3
technical community regarding the methods that have
been used to measure the thermal conductivity of
nanofluids. Thus, a systematic, system-level investi-
gation of the potential of nanofluids as well as a more
complete understanding of their thermal-hydraulic
performance is still needed.
Small concentrations of nanoparticles dispersed in
liquids can substantially increase the thermal con-
ductivity of the base fluids (Choi et al. 2001; Das
et al. 2003; Ding et al. 2006; He et al. 2007). For
various combinations of nanoparticle and liquids, the
thermal conductivity enhancements are often far
beyond the predictions of classical models for
larger-sized particle suspensions, and a number of
theoretical models have been proposed in the liter-
ature in an attempt to explain the heat conduction
mechanisms associated with nanoparticles in liquids
(Wang and Mujumdar 2007). The large enhancement
of thermal conductivity has also motivated many
researchers to explore the potential benefits of
nanoparticle-liquid mixtures (nanofluids) in heat
transfer applications during the past decade (Trisaksri
and Wongwises 2007; Wen and Ding 2004). Most
experimental investigations of nanofluids for single-
phase laminar pipe flows have found that the
convective heat transfer coefficient increases with
higher particle concentrations (He et al. 2007; Heris
et al. 2007; Lee and Mudawar 2007; Pak and Cho
1998). The enhancement of laminar-flow forced
convection was more pronounced at the entrance
region (Heris et al. 2007; Pak and Cho 1998).
Similarly, increased convective heat transfer coeffi-
cients were found for turbulent flows (Koo and
Kleinstreuer 2004; Xuan and Li 2003; Nguyen et al.
2007; Yang et al. 2005). The convective heat transfer
enhancement by nanoparticles for laminar and tur-
bulent flows tends to increase with Reynolds number,
and the magnitude is generally beyond that of thermal
conductivity, with at least one exception (Prasher
et al. 2006).
Among other properties of nanofluids, the viscos-
ity increases significantly with increasing nanoparti-
cle concentration. However, certain studies have
suggested an insignificant pressure drop penalty for
pipe flows for both laminar and turbulent flows (Koo
and Kleinstreuer 2004; Xuan and Li 2003; Nguyen
et al. 2007). In contrast, a recent experiment with a
micro-channel heat sink has resulted in a notable
increase in pressure drop with an increasing
concentration of alumina nanoparticles, while the
friction factor was nearly unaffected (Pak and Cho
1998). Rheological studies of nanofluids found both
Newtonian behaviors (Ding et al. 2006; Putra et al.
2003) and shear-thinning behaviors (He et al. 2007;
Koo and Kleinstreuer 2004; Xuan and Li 2003).
Despite these early promising results, little work has
been conducted to assess the effects of nanoparticles
on system components such as pumps, flowmeters,
gages, and valves. Recent studies, however, have also
suggested that by accounting for linear particle
aggregation, most of the thermal conductivity
enhancement data reported in the data can be
explained by classic medium theories for composite
materials. These studies also point out that the
particle loading needed to achieve this affect also
increases the viscosity, which renders its merits for
flow-based cooling questionable (Keblinski et al.
2008; Ghandi 2007). A critical review of recent
research in the area of nanofluid convective heat
transfer states both this promise and concern (Wang
and Mujumdar 2007).
Despite this wealth of nanofluid research and the
potential for heat transfer enhancement, our current
understanding of how nanofluids impact system
components and affect overall system performance
is still quite limited. More specifically, the long-term
chemical and mechanical effects of nanoparticle
additives on flow lines, pumps, and heat exchangers
are still largely unknown, and the claims of anom-
alous thermo-physical property enhancement are not
completely unexplained. If nanofluids are to be
applied to real systems, these outstanding issues must
be properly addressed.
The objective of this study was to provide a better
understanding of the effects of nanoparticles on
system level thermal performance and system com-
ponents and to provide demonstrative evidence of
either the benefits or the detriments derived from
seeding a heat transfer fluid with nanoparticles.
Thermo-physical properties were measured, and
convective heat transfer characteristics determined
for dilute concentrations of a Al2O3/propanol nano-
fluid in a counter flow, single-pass convective loop.
The impact of this nanofluid on the overall system
thermal performance and components was assessed.
In this study, nanoparticle concentrations of 0.5, 1.0,
and 3.0 wt% were examined. Collected data were
compared against well-known correlations found in
J Nanopart Res
123

the literature, and multiple methods of measurement
were used to improve the overall accuracy of the
measured fluid properties.
Experimental method
Flow loop construction
The convective heat transfer experiments were con-
ducted in a single-pass, counter flow loop consisting
of four major sections: thermal conditioning, flow
conditioning, test section, and reservoir as shown in
Fig. 1. The nanofluid flowed through a 3/4-inch ID
copper pipe. The test section consisted of an 18-inch
long copper block heated by hot water. Heat rates of
50, 100, 150, 200, and 250 W were supplied to the
copper block by varying the temperature of the water.
Turbulators were used to ensure that the water was
well mixed, and copper thermal grease was used to
ensure that there was good thermal contact between
the pipe and the block. The average energy balance
between the test fluid and the water loop was 7.9%.
The temperature of the propanol at the inlet of the
test section was maintained at 30 �C using a Lytron
liquid-to-liquid brazed plate heat exchanger where
water was used as the secondary cooling fluid. A 39-
inch long entrance region was used to condition the
flow and ensure fully developed conditions in the test
section. Both turbulent and laminar flow conditions
were explored. A 1-L accumulator was used to allow
for the expansion and contraction of the working
fluid. The total charge of the system was approxi-
mately 2.5 L.
Type-T thermocouple probes calibrated against an
AFRL-traceable high-precision platinum RTD were
used to measure the inlet and outlet temperatures of
the propanol and water in the test section, and six
type-T thermocouples attached to the copper pipe
with thermal paste were used to measure the wall
surface temperature as shown in Fig. 2. Flow turbu-
lators and 90� elbows were used to ensure that the
outlet fluid was well mixed prior to measurement.
The uncertainty in the measured temperature differ-
ence used to calculate the convective coefficient was
±0.05 �C with 95% confidence. An OMEGA
PX2300 low-differential pressure transducer with an
uncertainty of ±0.0625 psid was used to measure the
pressure drop across the test section. The volumetric
flow rate of the fluid was varied from 0.5 to 2.5 GPM
and measured using an oval gear, positive displace-
ment flowmeter (OMEGA) with an uncertainty of
±0.5% of the reading. Once thermal equilibrium was
Fig. 1 Photograph of the experimental test loop and
schematic
Fig. 2 Schematic of the test section and surface-mounted
thermocouples
J Nanopart Res
123
established, heat transfer data were acquired for a
period of 2 min and averaged.
Nanofluid properties
The nanofluid under investigation in this study was
Al2O3/propanol. The nanofluid was purchased from
NanoAmor� in a pre-mix form containing 20 wt%
aluminum oxide nanoparticles (gamma phase) with
an average particle size of 10 ± 5 nm. A proprietary
surfactant (\1 wt%) was used to improve dispersion
of the particles. Nanofluid weight concentrations of
0.5% and 1.0% were then prepared by dilution of the
pre-mix fluid with 99.95% pure propanol (reagent
grade). Propanol was chosen as the base fluid for a
couple of reasons. First, propanol has a low thermal
conductivity (i.e., kpropanol, 30 �C = 0.14 W/mK)
comparable to that of PAO which is used in military
applications for engine lubrication and cooling.
Therefore, similar enhancements might be expected
for the two fluids. It was also hypothesized that if a
thermal enhancement existed, it would be more
pronounced in propanol than in more traditional
working fluids which possess higher thermal conduc-
tivity [i.e., water, ethylene glycol (EG), etc.]. Second,
because propanol has a rather low boiling point (i.e.,
Tboil & 82 �C), two-phase heat transfer experiments
were planned if the single-phase heat transfer data
warranted continued investigation.
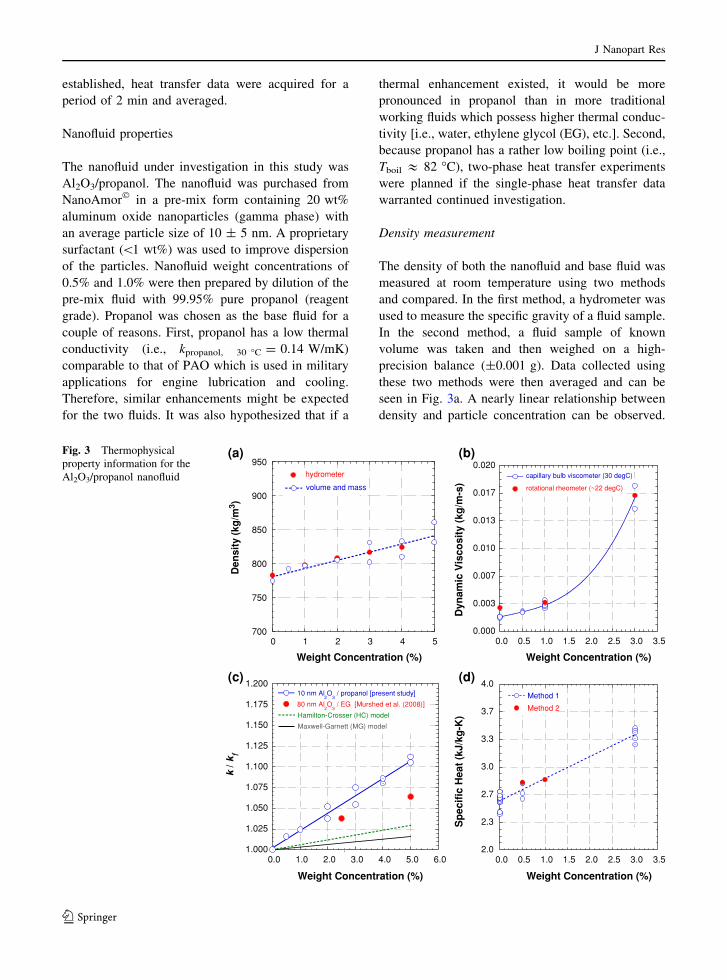
Density measurement
The density of both the nanofluid and base fluid was
measured at room temperature using two methods
and compared. In the first method, a hydrometer was
used to measure the specific gravity of a fluid sample.
In the second method, a fluid sample of known
volume was taken and then weighed on a high-
precision balance (±0.001 g). Data collected using
these two methods were then averaged and can be
seen in Fig. 3a. A nearly linear relationship between
density and particle concentration can be observed.
700
750
800
850
900
950hydrometer
volume and mass
Den
sity
(kg
/m3 )
Weight Concentration (%)
0.000
0.003
0.007
0.010
0.013
0.017
0.020capillary bulb viscometer (30 degC)
rotational rheometer (~22 degC)
Weight Concentration (%)
Dyn
amic
Vis
cosi
ty (
kg/m
-s)
1.000
1.025
1.050
1.075
1.100
1.125
1.150
1.175
1.20010 nm Al
2O
3 / propanol [present study]
Maxwell-Garnett (MG) model
80 nm Al2O
3 / EG [Murshed et al. (2008)]
Hamilton-Crosser (HC) model
k / k
f
Weight Concentration (%)
2.0
2.3
2.7
3.0
3.3
3.7
4.0
0 1 2 3 4 5 0.0 0.5 1.0 1.5 2.0 2.5 3.0 3.5
0.0 1.0 2.0 3.0 4.0 5.0 6.0 0.0 0.5 1.0 1.5 2.0 2.5 3.0 3.5
Method 1
Method 2
Weight Concentration (%)
Sp
ecif
ic H
eat
(kJ/
kg-K
)
.
(a)
(d)(c)
(b)Fig. 3 Thermophysical
property information for the
Al2O3/propanol nanofluid
J Nanopart Res
123
Good agreement (\1.8%) was observed between the
two methods for nanofluid concentrations B4 wt%.
At higher concentrations of nanoparticles, however, it
was observed that measurements taken using the
hydrometer became increasingly less accurate.
Viscosity measurement
The measurement of viscosity proved to be the most
difficult and most elusive so two different techniques
were employed. First, a capillary bulb viscometer was
used which proved to be accurate for low particle
loading. It could also be used in conjunction with an
isothermal bath and thus could be used to measure the
kinematic viscosity of the fluid at 30 �C. Second, an
Anton Paar RheolabQC rheometer was used, which
could only measure the viscosity at room tempera-
ture, but had the advantage of being less sensitive to
the nanoparticle concentration. Unlike the other
thermo-physical properties, viscosity exhibited non-
linear behavior with concentration with the viscosity
increasing sharply for concentrations [1.0 wt%.
These data can be seen in Fig. 3b. A non-Newtonian
shear-thinning behavior was observed for the
nanofluid.
Thermal conductivity measurement
The thermal conductivity k was measured at room
temperature (i.e., 22 �C) using the transient hot-wire
method. Using this method, the thermal conductivity
for propanol was found to be 0.17 W/mK which is
slightly higher than the value generally accepted for
propanol at room temperature. The difference is
attributed to uncertainties in the measurement tech-
nique and the fact that the propanol used in this
measurement was only 99.9% pure. The observed
percent enhancement in thermal conductivity—for
example, 10% for a 5 wt% concentration—was linear
with concentration and was comparable to what has
been reported by others in the literature for alumina
nanoparticles in base fluids such as EG and engine oil
(Murshed et al. 2008). These measured k values were
slightly higher than Murshed et al. (2008), but this
can be attributed to the smaller particle size and lower
base fluid thermal conductivity. (The thermal con-
ductivity of propanol is approximately two times
lower than the thermal conductivity of EG.) Overall,
the thermal conductivity enhancement due to the
Al2O3 nanoparticles, however, was relatively small
due primarily to the low-fluid temperatures investi-
gated in this study.
These data were also compared to two traditional k
models for composites: the Hamilton–Crosser (HC)
model for dilute suspensions of spherical particles
and the Maxwell-Garnett (MG) model for composite
systems where the matrix thermal conductivity is
much smaller than the particle thermal conductivity.
Both models were observed to under predict the
measured thermal conductivity data (see Fig. 3c).
The HC model is given by
k
km
¼ 1þ3/ kp � km
� �
kp þ 2km � / kp � km
� �; ð1Þ
where km is the matrix thermal conductivity, kp is the
particle thermal conductivity, and / is the volume
fraction (Hamilton and Crosser 1962). Although the
HC model has been successfully applied to large
particle composite systems, the model does have its
limitations. For example, in the limit where kp [[ km
and for low /, Eq. 1 predicts that k/km should be
three times the volume fraction irrespective of
particle geometry and size. The MG model, which
accounts for particle size and interfacial thermal
resistance, is given by
k
km
¼ 1þ 2að Þ þ 2/ 1� að Þ1þ 2að Þ � / 1� að Þ ; ð2aÞ
where a ¼ 2Rbkm=d ð2bÞ
and Rb is the Kapitza resistance and d is the particle
diameter (Prasher 2005; Prakash and Giannelis 2007).
(The MG model predictions shown in Fig. 3c assume
an average particle size of 10 nm and a Kapitza
resistance of 0.8 9 10-8 K m2 W-1 which is repre-
sentative of Al2O3 in water.) In considering Eq. 2, it
is interesting to note that the interfacial resistance of
nano-sized particles should be more significant than
for micron-sized particles which would tend to
decrease k/km, not increase it. Thus, the inclusion of
interfacial effects is insufficient for explaining the
enhancements in thermal conductivity that were
observed here and have been reported elsewhere in
the literature (Choi et al. 2001; Das et al. 2003; Ding
et al. 2006; He et al. 2007). These observations,
which have led researchers to suggest other physical
mechanisms such as micro-convection due to Brown-
ian diffusion, have also raised questions regarding the
J Nanopart Res
123
applicability of the hot-wire technique for nanofluid
thermal conductivity measurement. It should be
pointed out, however, that both of these models
(i.e., Hamilton–Crosser and Maxwell-Garnett) are
based in effective medium theory that assumes well-
dispersed particles in a fluid matrix. If particle
aggregates are formed in the fluid resulting in particle
chains or clusters, the predicted thermal conductivity
would be significantly higher as was observed.
Specific heat measurement
The measurement of specific heat was performed
using multiple methods to reduce the uncertainty
associated with its determination. In the first method,
an energy balance was performed around the brazed
plate heat exchanger such that
cpnf ¼_mH2OcpH2ODTH2O
_mnfDTnf
; ð3Þ
where _mH2O refers to the mass flow rate of the water
stream, _mnf is the mass flow rate of the nanofluid,
DTH2O is the water-side temperature difference
between the inlet and outlet, DTnf is the nanofluid-
side temperature difference between the inlet and
outlet, and cp;H2O is the heat capacity of the water.
This method, however, assumed perfect heat transfer
between the two streams and as a result often under-
predicted the specific heat of the nanofluid by 5–7%.
In the second technique, the specific heat value of the
nanofluid was adjusted until the average energy
balance for all tests matched the average energy
balance determined during baseline testing (n = 34).
The specific heat value calculated using this method
was found to be a bit higher and more consistent with
expectations. These data are plotted in Fig. 3d.
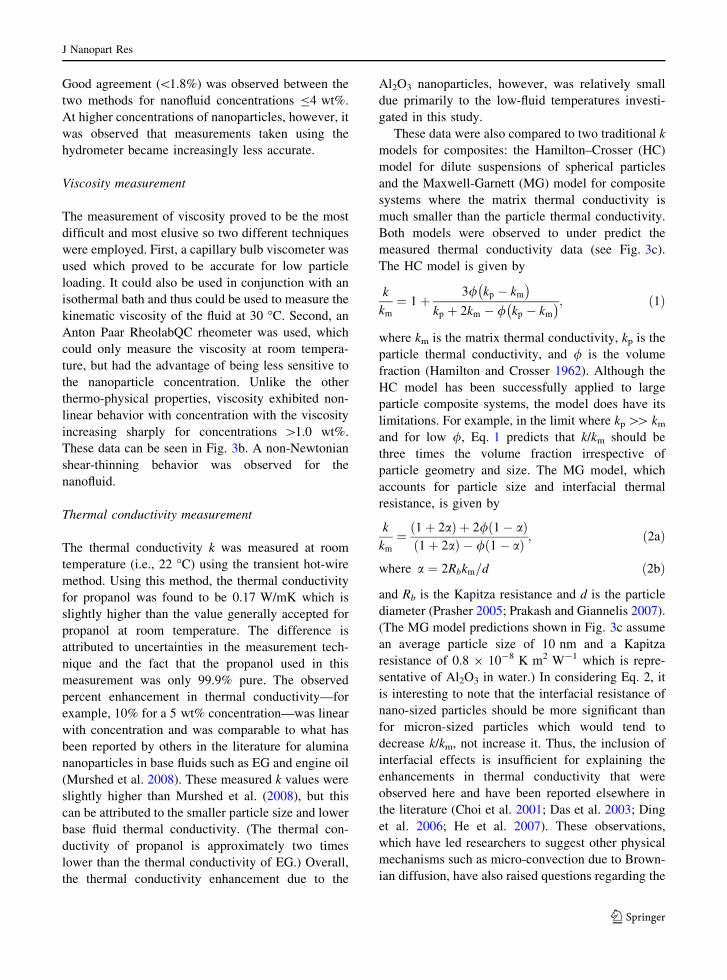
Nephelometric turbidity measurement
The quality of the nanofluid dispersion was also
monitored using a Micro100 turbidimeter from HF
Scientific� with a tungsten filament light source. For
these tests, a cuvette of the 3 wt% Al2O3/propanol
nanofluid was inserted into the test chamber and then
left undisturbed. The nephelometric turbidity units
(NTUs) were recorded and found to be unchanged
over the period of performed testing—a time period
exceeding 30 days (see Fig. 4). A blank cuvette was
indexed prior to monitoring and found to possess a
value of 3.85 NTUs which is small compared to the
measured turbidity of the nanofluid. During the
monitoring period, the turbidity was observed to
increase slightly but may be due to the settling of
alumina nanoparticles from above into the test region
increasing the relative opacity of the fluid. It should
be noted, however, that this increase in turbidity lies
just outside of the experimental uncertainty. Slightly
more rapid settling was observed for the 1 wt%
Al2O3/nanofluid nanofluid as compared to the 3 wt%
nanofluid which may be due to lower concentrations
of the proprietary surfactant. Regardless, these find-
ings suggest that this nanoparticle dispersion is rather
stable, and relatively little to no settling of the
alumina nanoparticles would be expected during
testing in the flow loop. The uncertainty in these
measurements was ±2% of the reading or 14 NTUs.
300
400
500
600
700
800
900
1000
0 5 10 15 20 25 30
3 wt% Al2O3/propanol
Nep
hel
om
etri
c T
urb
idit
y U
nit
s (N
TU
s)
Time Elapsed (days)
(a) (b)Fig. 4 a Turbidity
measurements performed
on the 3 wt% nanofluid
suggest very gradual
particle settling. b Images
of the 1 and 3 wt%
nanofluid approximately 2�weeks after preparation
confirm these data although
some settling can be
observed
J Nanopart Res
123
Data reduction procedure
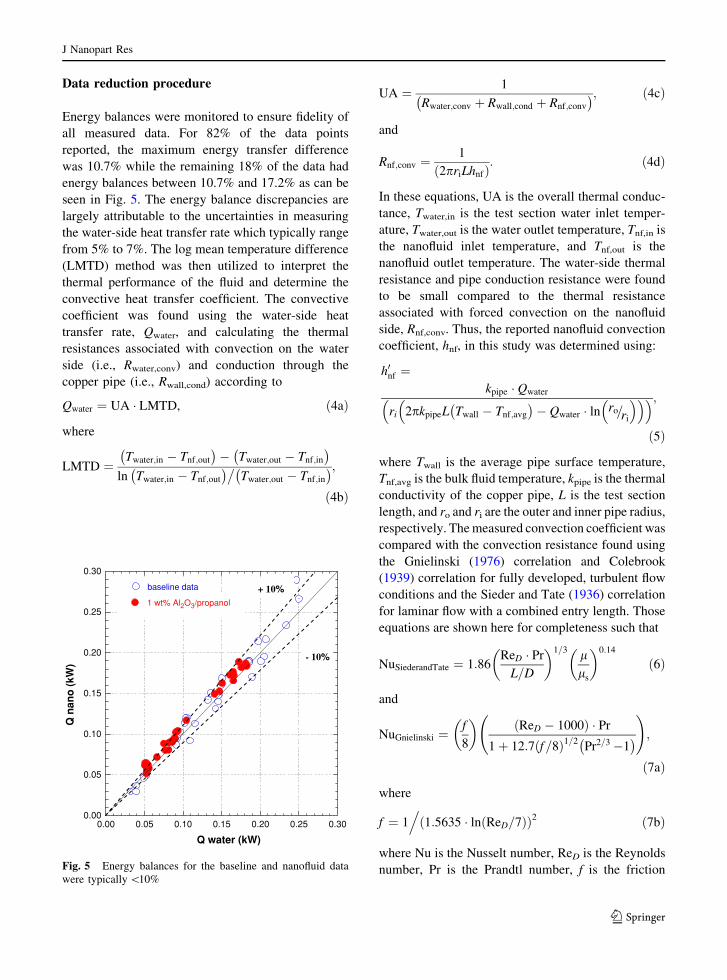
Energy balances were monitored to ensure fidelity of
all measured data. For 82% of the data points
reported, the maximum energy transfer difference
was 10.7% while the remaining 18% of the data had
energy balances between 10.7% and 17.2% as can be
seen in Fig. 5. The energy balance discrepancies are
largely attributable to the uncertainties in measuring
the water-side heat transfer rate which typically range
from 5% to 7%. The log mean temperature difference
(LMTD) method was then utilized to interpret the
thermal performance of the fluid and determine the
convective heat transfer coefficient. The convective
coefficient was found using the water-side heat
transfer rate, Qwater, and calculating the thermal
resistances associated with convection on the water
side (i.e., Rwater,conv) and conduction through the
copper pipe (i.e., Rwall,cond) according to
Qwater ¼ UA � LMTD, ð4aÞ
where
LMTD ¼Twater;in � Tnf;out
� �� Twater;out � Tnf;in
� �
ln Twater;in � Tnf;out
� ��Twater;out � Tnf;in
� �;
ð4bÞ
UA ¼ 1
Rwater;conv þ Rwall;cond þ Rnf;conv
� �; ð4cÞ
and
Rnf;conv ¼1
2priLhnfð Þ: ð4dÞ
In these equations, UA is the overall thermal conduc-
tance, Twater,in is the test section water inlet temper-
ature, Twater,out is the water outlet temperature, Tnf,in is
the nanofluid inlet temperature, and Tnf,out is the
nanofluid outlet temperature. The water-side thermal
resistance and pipe conduction resistance were found
to be small compared to the thermal resistance
associated with forced convection on the nanofluid
side, Rnf,conv. Thus, the reported nanofluid convection
coefficient, hnf, in this study was determined using:
h0nf ¼kpipe � Qwater
ri 2pkpipeL Twall � Tnf;avg
� �� Qwater � ln ro=ri
� �� �� �;
ð5Þ
where Twall is the average pipe surface temperature,
Tnf,avg is the bulk fluid temperature, kpipe is the thermal
conductivity of the copper pipe, L is the test section
length, and ro and ri are the outer and inner pipe radius,
respectively. The measured convection coefficient was
compared with the convection resistance found using
the Gnielinski (1976) correlation and Colebrook
(1939) correlation for fully developed, turbulent flow
conditions and the Sieder and Tate (1936) correlation
for laminar flow with a combined entry length. Those
equations are shown here for completeness such that
NuSiederandTate ¼ 1:86ReD � Pr
L=D
� �1=3 lls
� �0:14
ð6Þ
and
NuGnielinski ¼f
8
� �ReD � 1000ð Þ � Pr
1þ 12:7 f=8ð Þ1=2Pr2=3�1� �
!
;
ð7aÞ
where
f ¼ 1.
1:5635 � ln ReD=7ð Þð Þ2 ð7bÞ
where Nu is the Nusselt number, ReD is the Reynolds
number, Pr is the Prandtl number, f is the friction
0.00
0.05
0.10
0.15
0.20
0.25
0.30
0.00 0.05 0.10 0.15 0.20 0.25 0.30
baseline data
1 wt% Al2O3/propanol
Q n
ano
(kW
)
Q water (kW)
+ 10%
- 10%
Fig. 5 Energy balances for the baseline and nanofluid data
were typically \10%
J Nanopart Res
123

factor, l is the fluid viscosity, and ls is the fluid
viscosity evaluated at the wall surface temperature.
Results and discussion
The thermal hydraulic performance of the 2-propanol
base fluid was measured before and after the addition
of the Al2O3 nanoparticles. Tests were performed for
nanoparticle concentrations of 0.5, 1.0, and 3.0 wt%.
All tests were performed for an inlet temperature of
30 �C unless otherwise noted. In order to assess the
pressure drop penalty associated with the addition of
the 10 nm Al2O3 nanoparticles, the nanofluid was
tested over a wide range of volumetric flow rates.
The results in Fig. 6 reveal a pressure penalty
associated with the nanofluid even under low particle
loading conditions (i.e. 1 wt% or 0.2 vol%) that
varies between 400% for ReD = 1000 and 600% for
ReD = 2000. The additional pressure drop (i.e., 0.2–
1.0 psi) generated by the increase in fluid viscosity
over this range of Reynolds numbers was significant.
However, it should be noted that the incremental
pumping power needed to overcome this deficit
would be less than approximately 1.1 W when using
the 1 wt% Al2O3/propanol nanofluid. When plotted
versus volumetric flow rate, the pressure drop penalty
is observed to be more pronounced at low flow rates.
This is attributed to the rheology of the nanofluid—
specifically its shear-thinning behavior. Thus, at
higher flow rates and therefore higher rates of fluid
shearing strain, the increase in the viscous shear
stress is diminished and the overall pressure drop
penalty decreases.
The heat transfer rate was then normalized by the
difference between the fluid inlet temperature and the
test section surface temperature and plotted versus
the Reynolds number is shown in Fig. 7. These data
which do not explicitly reveal the effect that the fluid
properties have on the overall thermal performance
show a heat transfer augmentation for the 1 wt%
nanofluid. In order to investigate the mechanism
behind this enhancement, the normalized heat trans-
fer was then plotted versus the fluid thermal conduc-
tivity ratio as shown in Fig. 8. These data suggest that
the observed augmentation in heat transfer was the
result of the enhanced thermophysical properties of
0.05
0.10
0.15
0.20
0.25
0 1000 2000 3000 4000 5000 6000
baseline data
1 wt% Al2O3/propanol
ReD
Ts
- T
in /
Qin
(K
/W)
Fig. 7 Normalized heat transfer rate versus Reynolds number
for the 1 wt% Al2O3/propanol nanofluid
0.0
0.20
0.40
0.60
0.80
1.0
1.2
1.4
1.6
baseline data
1% Al2O
3/propanol
Pre
ssu
re D
rop
(p
sid
)
ReD
0.0
0.50
1.0
1.5
2.0
0 1000 2000 3000 4000 5000 6000 0.0 0.5 1.0 1.5 2.0 2.5 3.0
baseline data
1% Al2O
3/propanol
Pre
ssu
re D
rop
(p
sid
)
Volumetric Flow Rate (gpm)
Fig. 6 Pressure drop data
for the 1 wt% Al2O3/
propanol nanofluid
J Nanopart Res
123

the Al2O3/propanol nanofluid and not some other
mechanism such as Brownian motion-induced nano-
convection, liquid layering, or other interfacial
effects. For example, in Fig. 7 for ReD = 2000, the
normalized heat transfer ratio, Ts � Tinletð Þ=Q;
decreases from *0.16 to 0.12 K W-1 between the
baseline and 1 wt% Al2O3/propanol nanofluid. In
Fig. 8, for ReD also equal to 2000, the normalized
heat transfer rate decreases by the same amount
between the baseline and 1 wt% case. Thus, the
change in heat transfer was due almost exclusively to
the increase in the fluid thermal conductivity.
Perhaps, more importantly, these plots which show
system thermal performance do not require the use of
Brownian diffusion to explain thermal-fluid behavior.
Next, the effect of the Al2O3 nanoparticles on the
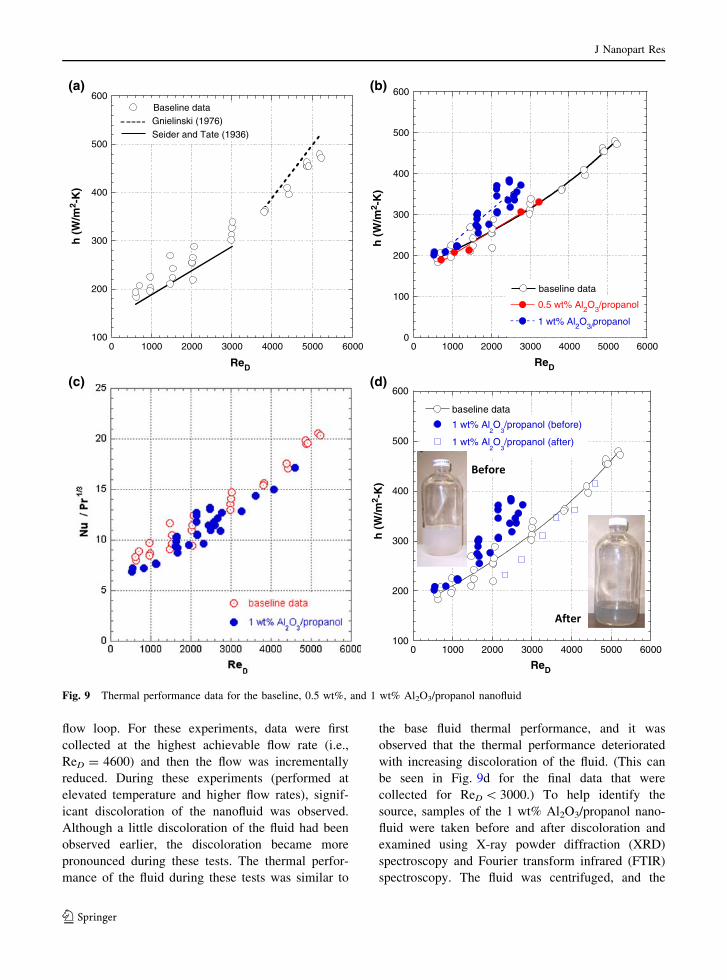
convective heat transfer coefficient was explored.
The baseline (i.e., pure propanol) convective heat
transfer coefficient data were observed to agree well
with the Gnielinski (1976) correlation for fully-
developed turbulent flow and the Sieder and Tate
(1936) correlation for a combined entry length,
laminar flow as shown in Fig. 9a. The close agree-
ment of these data with published correlations further
corroborates the integrity of the data and the low
observed energy balance differences between the test
fluid stream and the hot water stream in Fig. 5. For
the 0.5 wt% Al2O3/propanol nanofluid over the range
of testable Reynolds numbers 500 \ ReD \ 3400,
there was no measurable difference in the thermal
behavior of the fluid versus the pure propanol (see
Fig. 9b). (Note: Because of the increase in fluid
viscosity with the addition of the nanoparticles, it was
difficult to achieve ReD [ 3500 without changing the
experimental setup of the flow loop.)
For the 1.0 wt% Al2O3/propanol nanofluid, there
was also no measurable difference in the convective
heat transfer coefficient of the fluid for ReD \ 2000.
For 2000 \ ReD \ 3000, a small but significant
enhancement of *15–20% was observed. The
uncertainty in these calculated values of the heat
transfer coefficient was typically \8.2% with the
maximum uncertainty not exceeding 16%. This
enhancement was repeatable and was later observed
again using a new sample of 1 wt% Al2O3/propanol
nanofluid. Two different mechanisms have been
proposed to explain this enhancement. First, it is
believed that the addition of the nanoparticles may
have actually served to precipitate an earlier transi-
tion from laminar to turbulent flow which would
mean higher Nusselt numbers. Thus, the transition
region might exhibit slightly improved heat transfer
as compared to the baseline fluid, but this enhance-
ment would only be expected to occur within a very
narrow region of Reynolds numbers. Once the base
fluid transitioned to turbulent flow, similar heat
transfer performance would be expected. A second
mechanism which might explain this small observed
enhancement lies with the rheology of the fluid.
Because the nanofluid is shear-thinning and the shear
rate is highest near the wall, better fluid flow
performance should be realized near the wall. Thus,
the non-uniform distribution of the viscosity field
across the tube cross-section (and/or the possibility of
a reduced boundary layer) might also explain this
enhancement. However, when the heat transfer data
were non-dimensionalized as Nu/Pr1/3 and plotted
versus Reynolds number as shown in Fig. 9c, no
enhancement was manifest. Thus, the ability of this
nanofluid to enhance convective heat transfer remains
dubious.
Studying the thermal performance of the nanofluid
at high mass flow rates was difficult due to the
increase in fluid viscosity and the limitations imposed
by the pump. However, a limited quantity data were
collected by increasing the fluid inlet temperature to
50 �C to reduce the apparent viscosity of the fluid and
removing the brazed plate heat exchanger from the
0.05
0.10
0.15
0.20
0.25
0.30
0.00 0.01 0.02 0.03 0.04
Re = 1000
Re = 1500
Re = 2000
Re = 3000
Ts
- T
in /
Qin
(K
/W)
(k nf - k base) / k base
Fig. 8 Normalized heat transfer rate versus fluid thermal
conductivity ratio
J Nanopart Res
123
flow loop. For these experiments, data were first
collected at the highest achievable flow rate (i.e.,
ReD = 4600) and then the flow was incrementally
reduced. During these experiments (performed at
elevated temperature and higher flow rates), signif-
icant discoloration of the nanofluid was observed.
Although a little discoloration of the fluid had been
observed earlier, the discoloration became more
pronounced during these tests. The thermal perfor-
mance of the fluid during these tests was similar to
the base fluid thermal performance, and it was
observed that the thermal performance deteriorated
with increasing discoloration of the fluid. (This can
be seen in Fig. 9d for the final data that were
collected for ReD \ 3000.) To help identify the
source, samples of the 1 wt% Al2O3/propanol nano-
fluid were taken before and after discoloration and
examined using X-ray powder diffraction (XRD)
spectroscopy and Fourier transform infrared (FTIR)
spectroscopy. The fluid was centrifuged, and the
100
200
300
400
500
600
0 1000 2000 3000 4000 5000 6000
Baseline data
Gnielinski
h entry v2
Gnielinski (1976)
h (
W/m
2 -K
)
Seider and Tate (1936)
0
100
200
300
400
500
600
0 1000 2000 3000 4000 5000 6000
baseline data
h theor
h entry v2
0.5 wt% Al2O3/propanol
1 wt% Al2O3/propanol
100
200
300
400
500
600
0 1000 2000 3000 4000 5000 6000
baseline data
h theor
h entry1 wt% Al
2O
3/propanol (before)
1 wt% Al2O
3/propanol (after)
ReD
ReDReDh
(W
/m2 -
K)
h (
W/m
2 -K
)
(a) (b)
(d)(c)
Fig. 9 Thermal performance data for the baseline, 0.5 wt%, and 1 wt% Al2O3/propanol nanofluid
J Nanopart Res
123
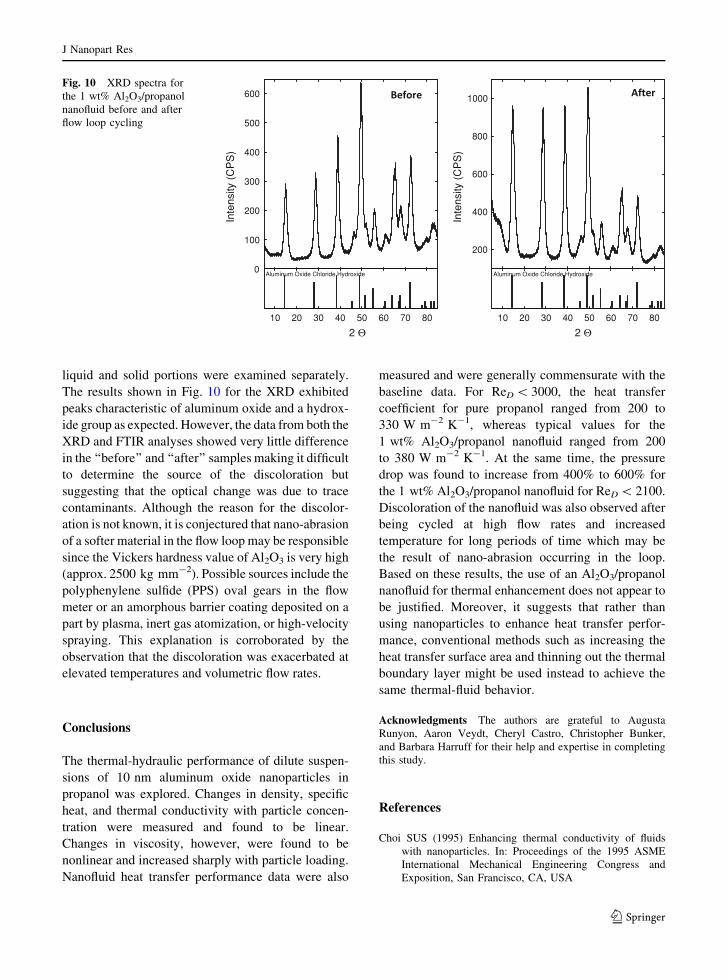
liquid and solid portions were examined separately.
The results shown in Fig. 10 for the XRD exhibited
peaks characteristic of aluminum oxide and a hydrox-
ide group as expected. However, the data from both the
XRD and FTIR analyses showed very little difference
in the ‘‘before’’ and ‘‘after’’ samples making it difficult
to determine the source of the discoloration but
suggesting that the optical change was due to trace
contaminants. Although the reason for the discolor-
ation is not known, it is conjectured that nano-abrasion
of a softer material in the flow loop may be responsible
since the Vickers hardness value of Al2O3 is very high
(approx. 2500 kg mm-2). Possible sources include the
polyphenylene sulfide (PPS) oval gears in the flow
meter or an amorphous barrier coating deposited on a
part by plasma, inert gas atomization, or high-velocity
spraying. This explanation is corroborated by the
observation that the discoloration was exacerbated at
elevated temperatures and volumetric flow rates.
Conclusions
The thermal-hydraulic performance of dilute suspen-
sions of 10 nm aluminum oxide nanoparticles in
propanol was explored. Changes in density, specific
heat, and thermal conductivity with particle concen-
tration were measured and found to be linear.
Changes in viscosity, however, were found to be
nonlinear and increased sharply with particle loading.
Nanofluid heat transfer performance data were also
measured and were generally commensurate with the
baseline data. For ReD \ 3000, the heat transfer
coefficient for pure propanol ranged from 200 to
330 W m-2 K-1, whereas typical values for the
1 wt% Al2O3/propanol nanofluid ranged from 200
to 380 W m-2 K-1. At the same time, the pressure
drop was found to increase from 400% to 600% for
the 1 wt% Al2O3/propanol nanofluid for ReD \ 2100.
Discoloration of the nanofluid was also observed after
being cycled at high flow rates and increased
temperature for long periods of time which may be
the result of nano-abrasion occurring in the loop.
Based on these results, the use of an Al2O3/propanol
nanofluid for thermal enhancement does not appear to
be justified. Moreover, it suggests that rather than
using nanoparticles to enhance heat transfer perfor-
mance, conventional methods such as increasing the
heat transfer surface area and thinning out the thermal
boundary layer might be used instead to achieve the
same thermal-fluid behavior.
Acknowledgments The authors are grateful to Augusta
Runyon, Aaron Veydt, Cheryl Castro, Christopher Bunker,
and Barbara Harruff for their help and expertise in completing
this study.
References
Choi SUS (1995) Enhancing thermal conductivity of fluids
with nanoparticles. In: Proceedings of the 1995 ASME
International Mechanical Engineering Congress and
Exposition, San Francisco, CA, USA
X Data
10 20 30 40 50 60 70 80
Inte
nsity
(C
PS
)
0
100
200
300
400
500
600
2 Θ
Aluminum Oxide Chloride Hydroxide
Inte
nsity
(C
PS
)
200
400
600
800
1000
2 Θ10 20 30 40 50 60 70 80 10 20 30 40 50 60 70 80
Aluminum Oxide Chloride Hydroxide
Fig. 10 XRD spectra for
the 1 wt% Al2O3/propanol
nanofluid before and after
flow loop cycling
J Nanopart Res
123
Choi SUS, Zhang ZG, Yu W, Lockwood FE, Grulke EA (2001)
Anomalous thermal conductivity enhancement in nano-
tube suspensions. Appl Phys Lett 79:2252–2254. doi:
10.1063/1.1408272
Colebrook CF (1939) Turbulent flow in pipes with particular
reference to the transition region between the smooth and
rough pipe laws. J Inst Civil Eng 11:133–156
Das SK, Putra N, Roetzel W (2003) Pool boiling characteristics
of nano-fluids. Int J Heat Mass Transfer 46:851–862. doi:
10.1016/S0017-9310(02)00348-4
Ding Y, Alias H, Wen D, Williams RA (2006) Heat transfer of
aqueous suspensions of carbon nanotubes (CNT nanofl-
uids). Int J Heat Mass Transfer 49:240–250. doi:10.1016/
j.ijheatmasstransfer.2005.07.009
Ghandi KS (2007) Thermal properties of nanofluids: contro-
versy in the making? Curr Sci 92:717–718
Gnielinski V (1976) New equations for heat and mass transfer
in turbulent pipe and channel flow. Int Chem Eng 16:359–
368
Hamilton RL, Crosser OK (1962) Thermal conductivity of
heterogeneous two-component systems. Ind Eng Chem
Fundam 1:187–191. doi:10.1021/i160003a005
He Y, Jin Y, Chen H, Ding Y, Cang D, Lu H (2007) Heat
transfer and flow behavior of aqueous suspensions of TiO2
nanoparticles (nanofluids) flowing upward through a ver-
tical pipe. Int J Heat Mass Transfer 50:2272–2281. doi:
10.1016/j.ijheatmasstransfer.2006.10.024
Heris SZ, Esfahany MN, Etemad SGh (2007) Experimental
investigation of convective heat transfer of Al2O3/water
nanofluid in circular tube. Int J Heat Fluid Flow 28:203–
210. doi:10.1016/j.ijheatfluidflow.2006.05.001
Keblinski P, Prasher R, Eapen J (2008) Thermal conductance
of nanofluids: is the controversy over? J Nanopart Res
10:1–9. doi:10.1007/s11051-007-9352-1
Koo J, Kleinstreuer C (2004) A new thermal conductivity
model for nanofluids. J Nanopart Res 6:577–588. doi:
10.1007/s11051-004-3170-5
Lee J, Mudawar I (2007) Assessment of the effectiveness of
nanofluids for single-phase and two-phase heat transfer in
micro-channels. Int J Heat Mass Transfer 50:452–463.
doi:10.1016/j.ijheatmasstransfer.2006.08.001
Murshed SMS, Leong KC, Yang C (2008) Investigations of
thermal conductivity and viscosity of nanofluids. Int J
Therm Sci 47:560–568. doi:10.1016/j.ijthermalsci.2007.
05.004
Nguyen CT, Roy G, Gauthier C, Galanis N (2007) Heat
transfer enhancement using Al2O3-water nanofluid for an
electronic liquid cooling system. Appl Therm Eng
27:1501–1506. doi:10.1016/j.applthermaleng.2006.09.028
Pak BC, Cho YI (1998) Hydrodynamic and heat transfer study
of dispersed fluids with submicron metallic oxide parti-
cles. Exp Heat Transf 11:151–170. doi:10.1080/08916159
808946559
Prakash M, Giannelis EP (2007) Mechanism of heat transport
in nanofluids. J Comput Aided Mater Des 14:109–117
Prasher R (2005) Thermal conductivity of nanoscale colloidal
solutions (nanofluids). Phys Rev Lett 94:025901. doi:
10.1103/PhysRevLett.94.025901
Prasher R, Song D, Wang J, Phelan P (2006) Measurements of
nanofluid viscosity and its implications for thermal appli-
cations. Appl Phys Lett 89:133108. doi:10.1063/1.2356113
Putra N, Roetzel W, Das SK (2003) Natural convection of
nano-fluids. Heat Mass Transf 39:775–784. doi:10.1007/
s00231-002-0382-z
Sieder EN, Tate GE (1936) Heat transfer and pressure drop of
liquids in tubes. Ind Eng Chem 28:1429–1436
Trisaksri V, Wongwises S (2007) Critical review of heat
transfer characteristics of nanofluids. Renew Sustain
Energy Rev 11:512–523. doi:10.1016/j.rser.2005.01.010
Wang X-Q, Mujumdar AS (2007) Heat transfer characteristics
of nanofluids: a review. Int J Therm Sci 46:1–19. doi:
10.1016/j.ijthermalsci.2006.06.010
Wen D, Ding Y (2004) Experimental investigation into convective
heat transfer of nanofluids at the entrance region under
laminar flow conditions. Int J Heat Mass Transfer 47:5181–
5188. doi:10.1016/j.ijheatmasstransfer.2004.07.012
Xuan Y, Li Q (2003) Investigation on convective heat transfer
and flow features on nanofluids. J Heat Transfer 125:151–
155. doi:10.1115/1.1532008
Yang Y, Zhang ZG, Grulke EA, Anderson WB, Wu G (2005)
Heat transfer properties of nanoparticle-in-fluid disper-
sions (nanofluids) in laminar flow. Int J Heat Mass
Transfer 48:1107–1116. doi:10.1016/j.ijheatmasstransfer.
2004.09.038
J Nanopart Res
123