Embed Size (px)
Citation preview
Chemical Engmeerrng Science. Vol. 48, No. 18, pp. 3293-3305, 1993. cM%25G9/93 $6.00 + 0.00 Printed in Great Britain. 0 1993 Pergamon Press Lrd
EXPERIMENTAL FLUID DISPERSION MEASUREMENTS IN PERIODIC BAFFLED TUBE ARRAYS
M. R. MACKLEY Department of Chemical Engineering, Cambridge University, Pembroke Street, Cambridge CB2 3RA,
U.K.
and
X. NI Department of Chemical Engineering, School of Science and Technology, Teesside University,
Middlesbrough, Cleveland TSl 3BA, U.K.
(First received 12 April 1992; accepted in revised form 8 January 1993)
Abstract-We report experimental flow pattern and associated residence time distribution measurements for multipass and multitube arrays where periodic baffles and fluid oscillation may be present. The observations show that controlled mixing and well-defined residence time distributions can be obtained for both the engineering configurations tested. In addition, a single parameter axial dispersion coefficient is determined and it is shown that disuersion using oscillatory flow in baffled tubes can be less than axial dispersion for a turbulent net flow. -
INTRODUCTION
Efficient fluid mixing within chemical engineering devices is an important ingredient required for pro- cess engineering units, and dominates considerations in relation to heat, mass transfer and product uni- formity. In the 1960s pioneering work within the nuclear industry showed that fluid oscilIation in sieve plate columns could produce effective two-phase mix- ing of immiscible liquids and the columns were suc- cessfully used for enhanced solvent extraction (see, for example, Longsdail and Thornton, 1957; Long, 1967; Lo and Baird, 1987). In the 1970s Bellhouse et al. (1973) demonstrated the utility of fluid oscillation in furrowed channels for enhanced membrane transfer and Sobey et al. (1980) successfully numerically pre- dicated flow patterns in this geometry. It has been demonstrated that, by combining oscillation with periodically spaced baffles in a tube, vigorous eddy mixing can be achieved between baffles, leading to excellent mixing (Brunold et al., 1989) where events at the wall are similar to events at the centre of the tube. As a consequence of this, a sharp (or near plug flow) residence time distribution (RTD) can be achieved at moderately low Reynolds numbers in a single-tube device operated either horizontally (Dickens et al.,
1989) or vertically (Mackley and Ni, 1991). The im- plication from these results suggests that the fluid mechanics generated by this means could be extended to different tube array arrangements, and in this paper we present our experimental findings on flow patterns, RTD and fluid dispersion measurements in a multi- pass apparatus and flow patterns and RTD measure- ments in a multitube configuration. These configura- tions are of potential importance in terms of design for continuous reactors and other process units.
Modelling of the fluid mechanics associated with oscillatory flow in baffled tubes has been carried out
by Sobey (1980), Howes (1988) and Howes et al. (1991). The oscillatory Reynolds number, Re,, that these simulations can be reliably taken to is of order 3OG400. This paper is concerned with fluid mixing and RTDs where the values of Re, is well above this limit and consequently comparison with numerical predications would be dubious. However, the experi- mental conditions described in this paper are in the range of potential commercial operation of the device where very effective mixing and RTD characteristics are obtained.
This paper investigates a range of fluid mechanical regimes. Firstly, as a basis for comparison with usual configurations, data are obtained for both laminar and turbulent flows when no baffles and oscillations are present. Secondly, the introduction of baffles with a net flow only covers the static mixer regime and these again are examined at modest and high Reynolds number. Finally, the regime where both baffles and fully reversing flows are present is exam- ined, and in this case the net flow Reynolds number is generally kept below that of the oscillatory flow Reynolds number.
THE FLUID MECHANICS
The fluid mechanics within a baffled tube is con- trolled by the geometrical configuration of the baffles and two dimensionless groups, the oscillatory Reynolds number, Re,, and the Strouhal number, St, defined as below, respectively:
DwX, Re, = v
D St = -
4nX,
(1)
(2)
3293
3294 M. R. MACKLEY and X. NI
where w is the angular frequency of oscillation (rad/s) and X, the centre to peak amplitude of oscillation (m), D the tube diameter (m) and v the kinematic viscosity (m2/s). If there is an additional net flow along the tube, a net flow Reynolds number, Re,, is also relevant, given as
Re, = E v
where U is the superficial net flow velocity through the tube (m/s).
EXPERIMENTAL FACILITIES AND PROCEDURE
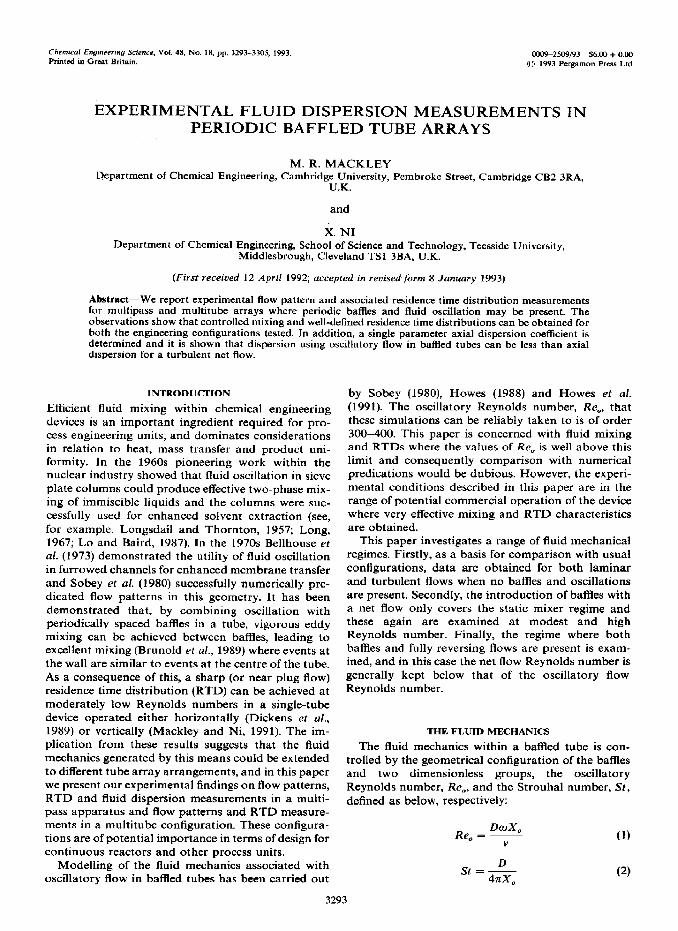
The multipass apparatus is shown schematically in Fig. 1. The device consists of five 25 mm I.D., 1.0 m long Perspex tubes. These tubes are operated vertic- ally and connected by four commercially available plastic bends having a central radius of curvature 160mm. The straight sections and bends form a single-flow path of about 6.3 m in total length. The objective of using this configuration was to simulate a long RTD process unit and explore the effect of bends. When present, there are 27 baffles in each straight section of the tube and eight baffles in each 180” bend. The baflles are spaced three tube radii apart within each straight section and are also approximately in these positions around the bends. This baffle spacing
was optimized by Brunoid et al. (1989) from inter- pretation of flow visualisation photographs to be the optimal baffle spacing for effective mixing over a broad range of amplitudes. The baffles were made from copper and supported by two 2 mm diameter longitudinal rods. The baffles were designed to give a “push fit” seal when positioned in the tubes. They occupied 34% of the tube cross-sectional area. The process fluid entered at the bottom of the far right tube shown in Fig. 1 and the exit port was taken from the top of the far left tube. The net flow was provided by an adjustable liquid pump from LOWARA. The flow rates were monitored by a digital flow meter and recorded simultaneously by a IBM computer. Fluid oscillation was achieved by means of a pneumatic cylinder from BOSCH at the flow entry. A non-return valve was also incorporated in the flow inlet in order to minimize propagation of fluid oscillation upstream of the inlet fluid. A frequency range of 0.5-9 Hz could be obtained by an oscillation drive-control unit. Dif- ferent amplitudes of the oscillation were controlled by using different lengths of stoppers placed on the shaft of the pneumatic piston. The motion of the piston oscillation is essentially a square wave pulse and the displacements of the movement were measured by a Sangamo linear transducer and recorded by a com- puter.
I I I I II I
Fluid inlet
Oscillations
Fig. 1. The multipass apparatus.
Experimental fluid dispersion measurements 3295
Point conductivity probes manufactured by the Cambridge Environment Research Consultants were positioned at five locations, as shown in Fig. 1. Tracer experiments could be carried out by injecting a known amount of NaCl at the entry port and then following the time evolution of the trace at the respective probe positions. The signals from these probes are fed into a conductivity meter unit, where the data are converted into voltage signals. Those voltage signals together with the signals from the displacement transducer and from the flow meter are connected to a CED1401 module, ,which is a peripheral, capable of generating and receiving wave forms, digital and timing signals, under control of a computer. Data from the CED1401 module can be then filed onto a disc or plotted.
Experimental procedure Flow visualisations and tracer measurements stud-
ies were carried out in a similar way to that described in Mackley and Ni (1991). When baffles were not present, the tracer profiles particularly in the multi- tube experiments were found to be very sensitive to the injection conditions. When baffles and oscillations were present tracer profiles were not very sensitive to injection conditions and reproducible results could be readily achieved. Typically 20 ml of 60 g/l NaCl was injected over a period of 3 s. In all cases the process fluid was water at room temperature.
RESULTS
Experiments in multipass rig
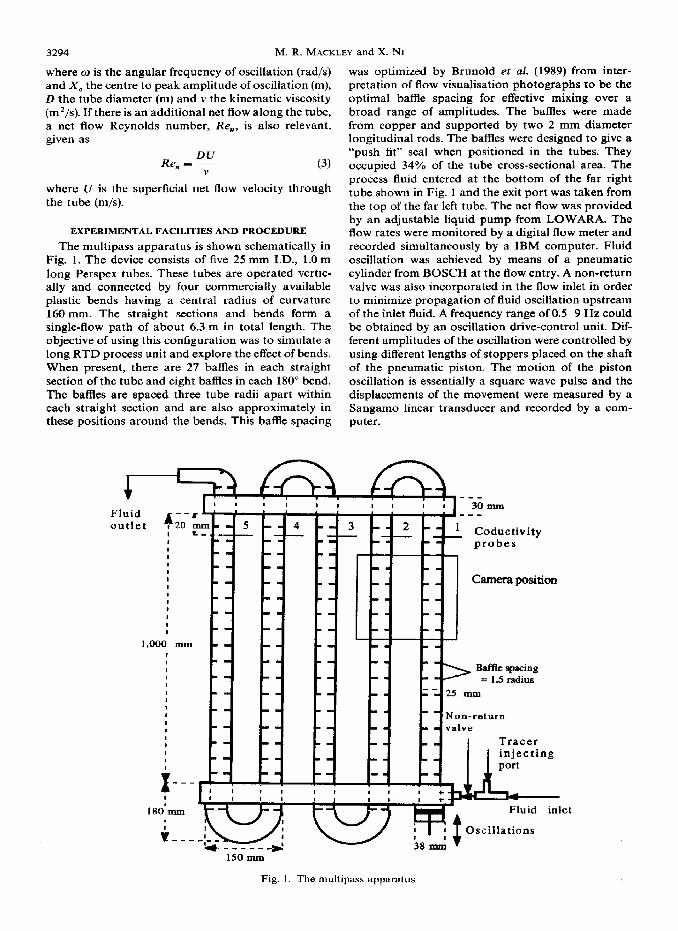
Fig. 2. Flow profile for laminar flow in a multipass rig. Tracer = polyethylene mixed in 60 g/l N&I. bulk fluid = water. -N& b&es. Re, = 212, Rii = 0, Sr = 0. Tube
diameter = 25 mm, net flow: up in the right tube, then down in the left tube.
We present flow visualization photographs for the multipass apparatus. The solution containing poly- ethylene particles (20 ml) was injected into the entry port and after a time delay visualisation of the par- ticles was made at certain positions within the appar- atus.
Visualizations, no baffles. The position of the camera is shown in Fig. 1 for the multipass rig. The photographs were taken when the tracer particles could be seen in both the first riser tube (right-hand side) and the first downcomer tube (left-hand side). In the case shown in Fig. 2 this occurred 3 min after injection. The photograph shows that as expected for the laminar fluid motion the streak lines are domi- nantly axial. However, from the length of the particle streaks it would appear that the velocities in the downcomer were higher than the riser. This effect is due to the radial velocity profile within the tube and the photograph was taken when the nose of the particle front was in the downcomer. The particles on the left-hand tube were the faster moving central ones whilst the particles on the right-hand side were the slower moving ones that were initially positioned near the outer radii of the tube. The photograph clearly illustrates the difficulties in dispersion associated with the laminar flow.
lation without the presence of baffles and Re, = 2324 and St = 0.5. The situation is similar to that shown in Fig. 2 and the axial motion dominates. Again low velocity particles are seen near the wall on the right- hand tube and high-velocity particles on the left-hand side.
Figure 4 shows the situation for a net flow of Re, = 2121 where we believe the flow to be turbulent.
This Reynolds number was the highest we could achieve with our experimental equipment, and the entry and bends in the system appear to ensure that we have passed the laminar turbulent transition. In this picture the delay time of about 15 s for photo- graphing after injection was considerably reduced to the previous case. The photograph shows the high concentration of central particles passing down the left tube and the lower concentration of particles that are left near the walls on the right-hand side. The flow trajectories appear to be dominantly axial although some radial motion can be seen in the photographs. The photograph again shows that even with a turbu- lent Row, the slow-moving particles reside near the wall of the tube after the bulk of the particle have passed through.
Figure 3 shows the situation where a laminar net Visualizations, with bafles. Figure 5 shows the ini- flow of Re, = 212 is applied together with fluid oscil- tial effect of the introduction of baffles with a low net
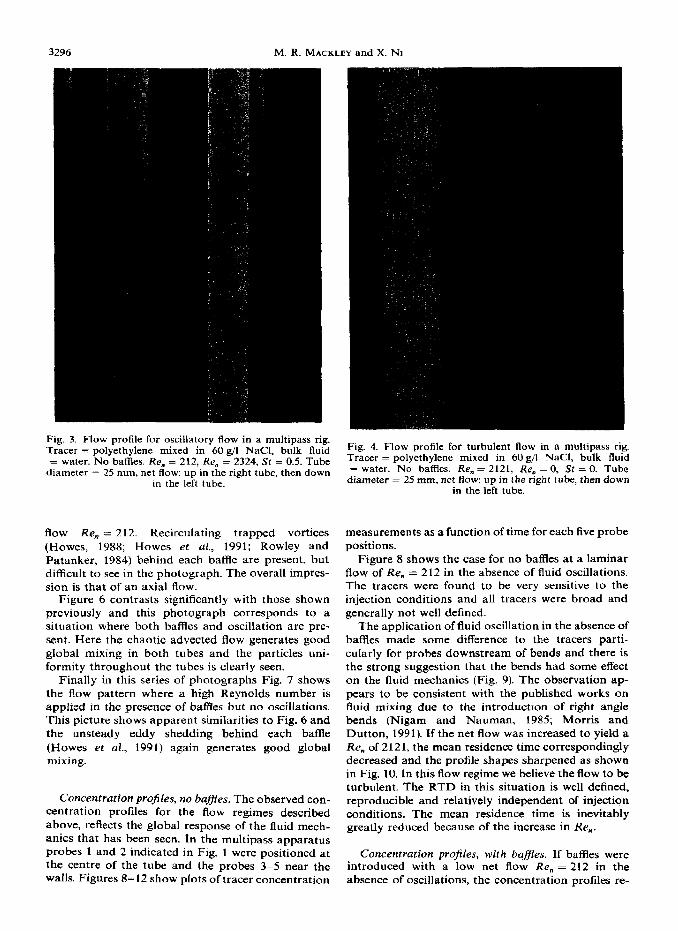
3296 M. R. MACKLEY and X. NI
Fig. 3. Flow profile for oscillatory flow in a multipass rig. Tracer = polyethylene mixed in 60 g/l NaCI. bulk fluid = water. No baffles. Re, = 212, ReO = 2324, St = 0.5. Tube
diameter = 25 mm, net flow: up in the right tube, then down in the left tube.
flow Re, = 212. Recirculating trapped vortices (Howes, 198X; Howes et al., 1991; Rowley and Patanker, 1984) behind each baffle are present, but difficult to see in the photograph. The overall impres- sion is that of an axial flow.
Figure 6 contrasts significantly with those shown previously and this photograph corresponds to a situation where both baffles and oscillation are pre- sent. Here the chaotic advected flow generates good global mixing in both tubes and the particles uni- formity throughout the tubes is clearly seen.
Finally in this series of photographs Fig. 7 shows the flow pattern where a high Reynolds number is applied in the presence of bafiies but no oscillations. This picture shows apparent similarities to Fig. 6 and the unsteady eddy shedding behind each baffle (Howes et al., 1991) again generates good global mixing.
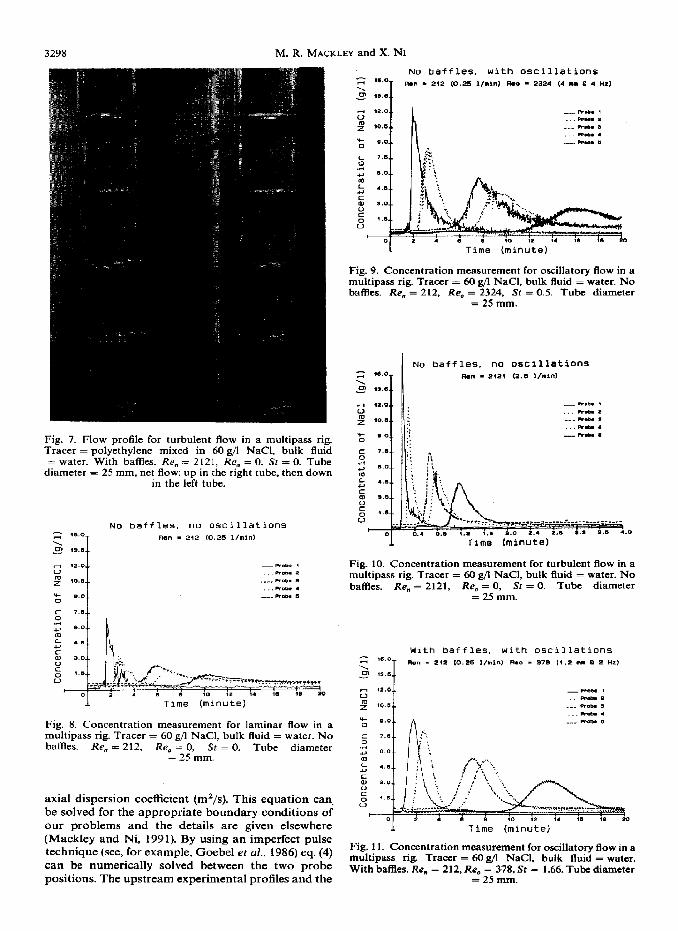
Concentration profiles, m bugles. The observed con- centration profiles for the flow regimes described above, reflects the global response of the fluid mech- anics that has been seen. In the multipass apparatus probes 1 and 2 indicated in Fig. 1 were positioned at the centre of the tube and the probes 3-5 near the walls. Figures 8-12 show plots of tracer concentration
Fig. 4. Flow profile for turbulent flow in a multipass rig. Tracer = Dolvethvlene mixed in 60 a/l NaCI, bulk fluid = water. -Nd b&es. Re, = 2121, Re, = 0, St = 0. Tube
diameter = 25 mm, net flow: up in the right tube, then down in the left tube.
measurements as a function of time for each five probe positions.
Figure 8 shows the case for no baffles at a laminar flow of Rem = 212 in the absence of fluid oscillations. The tracers were found to be very sensitive to the injection conditions and all tracers were broad and generally not well defined.
The application of fluid oscillation in the absence of baffles made some difference to the tracers parti- cularly for probes downstream of bends and there is the strong suggestion that the bends had some effect on the fluid mechanics (Fig. 9). The observation ap- pears to be consistent with the published works on fluid mixing due to the introduction of right angle bends (Nigam and Nauman, 1985; Morris and Dutton, 1991). If the net flow was increased to yield a Re, of 2121, the mean residence time correspondingly decreased and the profile shapes sharpened as shown in Fig. 10. In this flow regime we believe the flow to be turbulent. The RTD in this situation is well defined, reproducible and relatively independent of injection conditions. The mean residence time is inevitably greatly reduced because of the increase in Re,.
Concentration profiles, with baffles. If baffles were introduced with a low net flow Re, = 212 in the absence of oscillations, the concentration profiles re-
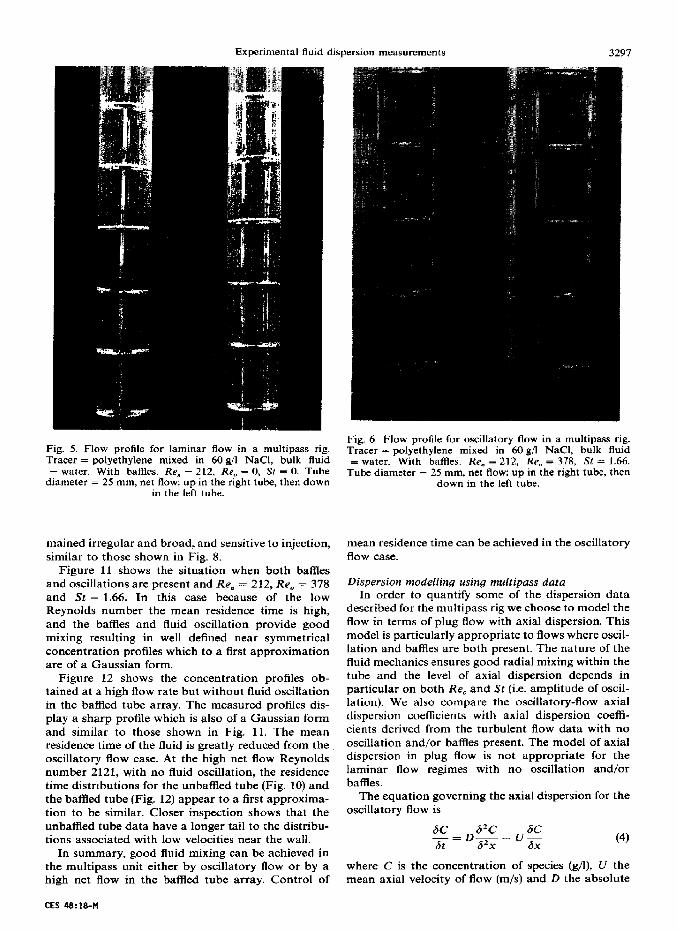
Experimental fluid dispersion measurements 3297
Fig. 5. Flow profile for laminar flow in a multipass rig. Tracer = polyethylene mixed in 60 g/i NaC1, bulk fluid = water. With baffles. Re, = 212, Rep = 0, $I = 0. Tube
diameter = 25 mm, net Row: up in the right tube, then down in the left tube.
mained irregular and broad, and sensitive to injection, similar to those shown in Fig. 8.
Figure 11 shows the situation when both baffles and oscillations are present and Re,, = 212, Re, = 378 and St = 1.66. In this case because of the low Reynolds number the mean residence time is high, and the baffles and fluid oscillation provide good mixing resulting in well defined near symmetrical concentration profiles which to a first approximation are of a Gaussian form.
Figure 12 shows the concentration profiles ob- tained at a high flow rate but without fluid oscillation in the baffled tube array. The measured profiles dis- play a sharp profile which is also of a Gaussian form and similar to those shown in Fig. 11. The mean residence time of the fluid is greatly reduced from the oscillatory flow case. At the high net flow Reynolds number 2121, with no fluid oscillation, the residence time distributions for the unbaffled tube (Fig. 10) and the baffled tube (Fig. 12) appear to a first approxima- tion to be similar. Closer inspection shows that the unbaffled tube data have a longer tail to the distribu- tions associated with low velocities near the wall.
In summary, good fluid mixing can be achieved in the multipass unit either by oscillatory flow or by a high net flow in the baffled tube array. Control of
Fig. 6. Flow profile for oscillatory flow in a multipass rig. Tracer = polyethylene mixed in 60 g/l NaCl, bulk fluid = water. With baffles. Re, = 212, Re, = 378, St = 1.66.
Tube diameter = 25 mm, net flow: up in the right tube, then down in the left tube.
mean residence time can be achieved in the oscillatory flow case.
Dispersion modelling using multipass data In order to quantify some of the dispersion data
described for the multipass rig we choose to model the flow in terms of plug flow with axial dispersion. This model is particularly appropriate to flows where oscil- lation and baffles are both present. The nature of the fluid mechanics ensures good radial mixing within the tube and the level of axial dispersion depends in particular on both Re, and St (i.e. amplitude of oscil- lation). We also compare the oscillatory-flow axial dispersion coefficients with axial dispersion coeffi- cients derived from the turbulent flow data with no oscillation and/or baffles present. The model of axial dispersion in plug flow is not appropriate for the laminar flow regimes with no oscillation and/or baffles.
The equation governing the axial dispersion for the oscillatory flow is
(4)
where C is the concentration of species (g/l), U the mean axial velocity of flow (m/s) and D the absolute
CES 48:18-M
3298 M. R. MACKLEY and X. Nt
Fig. 7. Flow profile for turbulent flow in a multipass rig. Tracer = polyethylene mixed in 60 g/l NaCl, bulk fluid = water. With baffles. Ren = 2121, Re* = 0, St = 0. Tube
diameter = 25 mm, net flow: up in the right tube, then down in the left tube.
_PIOD. ,
..-Pm*. *
..“.RoD* B
ArrL.. .
.___ Pm.b. s
1 Time (minute)
Fig. 8. Concentration measurement for laminar flow in a multipass rig. Tracer = 60 g/l NaCl, bulk fluid = water. No baffles. Re, = 212, Re, = 0, Sr = 0. Tube diameter
= 25 mm.
axial dispersion coefficient (m2/s). This equation can, be solved for the appropriate boundary conditions of our problems and the details are given elsewhere (Mackley and Ni, 1991). By using an imperfect pulse technique (see, for example, Goebel et al., 1986) eq. (4) can be numerically solved between the two probe positions. The upstream experimental profiles and the
No baffles, with oscillations Ren - 21.2 (0.25 l/lmlrL) RLI - 2324 (4 111 8 4 HZ)
Time (minute)
Fig. 9. Concentration measurement for oscillatory flow in a multipass rig. Tracer = 60 g/l NaCl, bulk fluid = water. No baffles. Re,, = 212, Re, = 2324. St = 0.5. Tube diameter
= 25 mm.
Fig. 10. Concentration measurement for turbulent flow in a multipass rig. Tracer = 60 g/l NaCl, bulk fluid = water. No baffles. Re, = 2121, Re, = 0, St = 0. Tube diameter
= 25 mm.
With Baffles. with oscillations - 212 W25 I,lnUO R.0 - 378 ft.2 I&l 5 2 HZ)
Fig. 11. Concentration measurement for oscillatory flow in a multipass rig. Tracer = 60 g/l NaCl, bulk fluid : With baffles. Re, = 212, Re, = 378, St = 1.66. Tube diameter
= 25 mm.
= water.
Experimental fluid dispersion measurements 3299
With baffles, no oscillations
Ron - 2121 12.5 l/mid
.o 1 Time (minute)
Fig. 12. Concentration measurement for turbulent flow in a multipass rig. Tracer = 60 g/l NaCI, bulk fluid = water. With baffles. Re. = 2121, Re, = 0, St = 0. Tube diameter
= 25 mm.
model are used together to predict the downstream probe profile and the numerical program iterates to determine a best fit value for both the mean axial velocity U and the dispersion coefficient D.
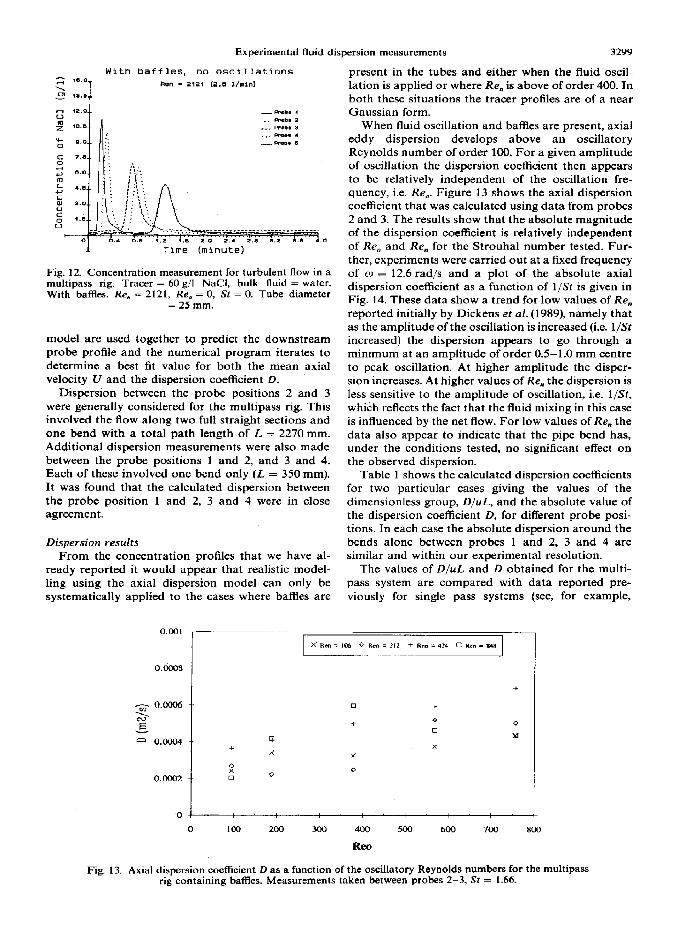
Dispersion between the probe positions 2 and 3 were generally considered for the multipass rig. This involved the flow along two full straight sections and one bend with a total path length of L = 2270 mm. Additional dispersion measurements were also made between the probe positions 1 and 2, and 3 and 4. Each of these involved one bend only (L = 350 mm). It was found that the calculated dispersion between the probe position 1 and 2, 3 and 4 were in close agreement.
Dispersion results From the concentration profiles that we have al-
ready reported it would appear that realistic model- ling using the axial dispersion model can only be systematically applied to the cases where baffles are
present in the tubes and either when the fluid oscil- lation is applied or where Re, is above of order 400. In both these situations the tracer profiles are of a near Gaussian form.
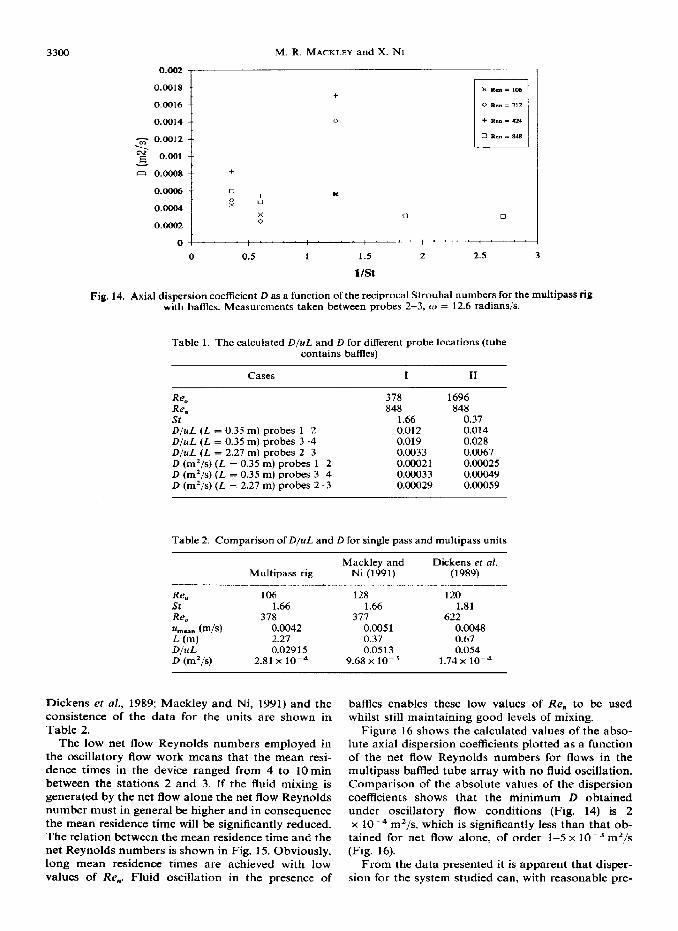
When fluid oscillation and baffles are present, axial eddy dispersion develops above an oscillatory Reynolds number of order 100. For a given amplitude of oscillation the dispersion coefficient then appears to be relatively independent of the oscillation fre- quency, i.e. Re,. Figure 13 shows the axial dispersion coefficient that was calculated using data from probes 2 and 3. The results show that the absolute magnitude of the dispersion coefficient is relatively independent of Re, and Re, for the Strouhal number tested. Fur- ther, experiments were carried out at a fixed frequency of w = 12.6 rad/s and a plot of the absolute axial dispersion coefficient as a function of l/St is given in Fig. 14. These data show a trend for low values of Re, reported initially by Dickens et al. (1989), namely that as the amplitude of the oscillation is increased (i.e. l/St increased) the dispersion appears to go through a minimum at an amplitude of order 0.5-1.0 mm centre to peak oscillation. At higher amplitude the disper- sion increases. At higher values of Re, the dispersion is less sensitive to the amplitude of oscillation, i.e. l/St, which reflects the fact that the fluid mixing in this case is influenced by the net flow. For low values of Re, the data also appear to indicate that the pipe bend has, under the conditions tested, no significant effect on the observed dispersion.
Table 1 shows the calculated dispersion coefficients for two particular cases giving the values of the dimensionless group, D/uL, and the absolute value of the dispersion coefficient D, for different probe posi- tions. In each case the absolute dispersion around the bends alone between probes 1 and 2, 3 and 4 are similar and within our experimental resolution.
The values of D/u15 and D obtained for the multi- pass system are compared with data reported pre- viously for single pass systems (see, for example,
0
0 100 200 300 400 SC4 600 700 8
ReO
0
Fig. 13. Axial dispersion coefficient D as a function of the oscillatory Reynolds numbers for the multipass rig containing baffles. Measurements taken between probes 2-3, St = 1.66.
3300 M. It. MACKLEY and X. Nr
0.002 7
0.0018 +
0.0016
0.0014 -- 0
2 0.0012
-2 .E 0.001 c! 0.0008 t +
Fig. 14. Axial dispersion coefficient D as a function ofthe reciprocal Strouhal numbers for the multipass rig with baAles. Measurements taken between probes 2-3, w = 12.6 radians/s.
Table 1. The calculated D/uL and D for different probe locations (tube contains baffles)
Cases I II
ReC7 Re, St D/uL (L = 0.35 m) probes l-2 D/uL (L = 0.35 m) probes 3-4 D/uL (L = 2.27 m) probes 2-3 D (m’/s) (L = 0.35 m) probes l-2 D (ml/s) (L = 0.35 m) probes 3-4 D (m’/s) (L = 2.27 m) probes 2-3
378 1696 848 848
1.66 0.37 0.012 0.014 0.019 0.028 0.0033 0.0067 o.ooo21 O.COO25 0.00033 o.cQO49 0.00029 o.ooo59
Table 2. Comparison of D/uL and D for single pass and multipass units
Multipass rig
Re. 106 128 120 St 1.66 1.66 1.81 R% 378 377 622 u,,,, (m/s) 0.0042 O.cml 0.0048 L (m) 2.27 0.37 0.67 D/uL 0.02915 0.0513 0.054
D Cm'/4 2.81x lo--’ 9.68 x lo-’ 1.74 x 10-d
Mackley and Ni (1991)
Dickens er al. (1989)
Dickens et al., 1989; Mackley and Ni, 1991) and the consistence of the data for the units are shown in Table 2.
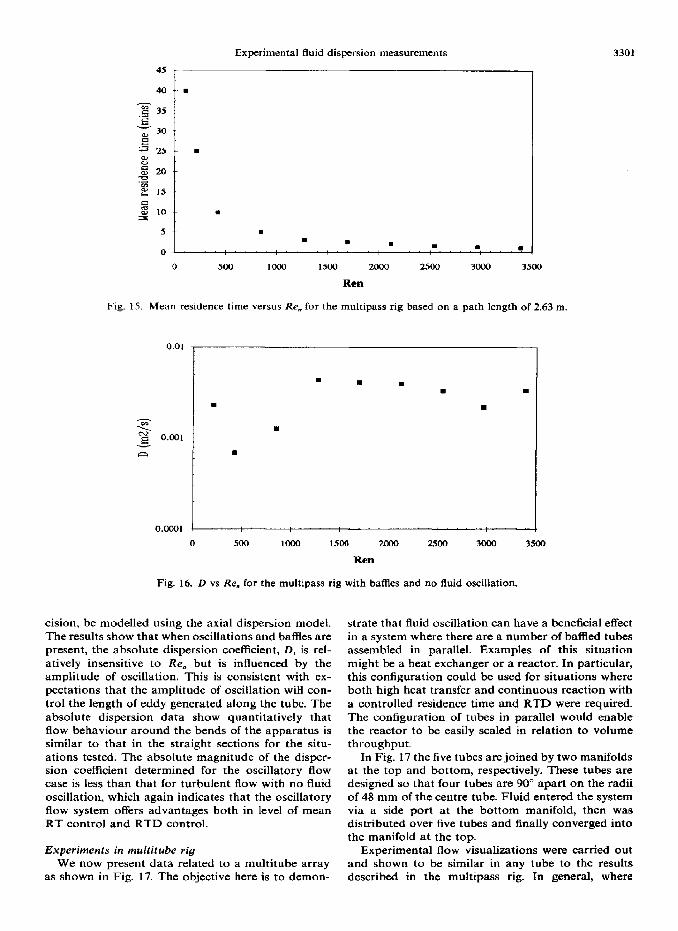
The low net flow Reynolds numbers employed in the oscillatory flow work means that the mean resi- dence times in the device ranged from 4 to 10 min between the stations 2 and 3. If the fluid mixing is generated by the net flow alone the net flow Reynolds number must in general be higher and in consequence the mean residence time will be significantly reduced. The relation between the mean residence time and the net Reynolds numbers is shown in Fig. 15. Obviously, long mean residence times are achieved with low values of Re,. Fluid oscillation in the presence of
baffles enables these low values of Re, to be used whilst still maintaining good levels of mixing.
Figure 16 shows the calculated values of the abso- lute axial dispersion coefficients plotted as a function of the net flow Reynolds numbers for flows in the multipass baffled tube array with no fluid oscillation. Comparison of the absolute values of the dispersion coefficients shows that the minimum D obtained under oscillatory flow conditions (Fig. 14) is 2 x 10m4 m’/s, which is significantly less than that ob-
tained for net flow alone, of order 1-5 x lo-’ m’/s (Fig. 16).
From the data presented it is apparent that disper- sion for the system studied can, with reasonable pre-
Experimental fluid dispersion measurements 3301
. . L . . .
0 ““I”“I”“!““I”“:““)“. @
0 500 loo0 1500 zoccl 2500 3cal 3.500
Ren
Fig. 15. Mean residence time versus Re, for the multipass rig based on a path length of 2.63 m.
.
O.ocol ! : :
0 500 1000
I 15ch3 2OM 2500 3ooo 3500
Rem
Fig. 16. D vs Re,, for the multipass rig with baffles and no fluid oscillation.
cision, be modelled using the axial dispersion model. The results show that when oscillations and baffles are present, the absolute dispersion coefficient, D, is rel- atively insensitive to Re, but is influenced by the amplitude of oscillation. This is consistent with ex- pectations that the amplitude of oscillation wiH con- trol the length of eddy generated along the tube. The absolute dispersion data show quantitatively that flow behaviour around the bends of the apparatus is similar to that in the straight sections for the situ- ations tested. The absolute magnitude of the disper- sion coefficient determined for the oscillatory flow case is less than that for turbulent flow with no fluid oscillation, which again indicates that the oscillatory flow system offers advantages both in level of mean RT control and RTD control.
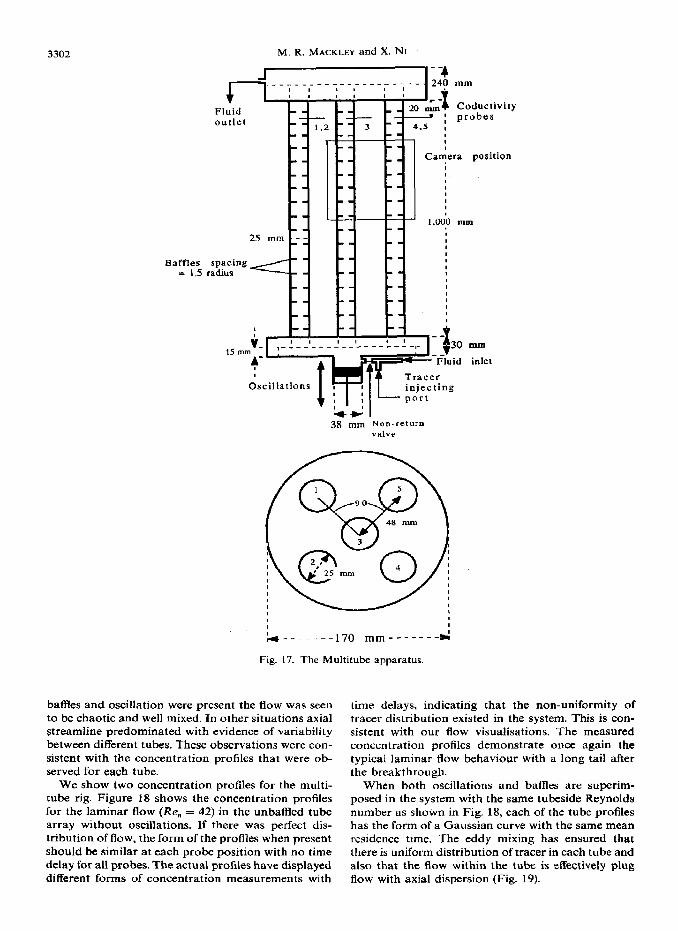
Experiments in multitube rig We now present data related to a multitube array
as shown in Fig. 17. The objective here is to demon-
strate that fluid oscillation can have a beneficial effect in a system where there are a number of baffled tubes assembled in parallel. Examples of this situation might be a heat exchanger or a reactor. In particular, this configuration could be used for situations where both high heat transfer and continuous reaction with a controlled residence time and RTD were required. The configuration of tubes in parallel would enable the reactor to be easily scaled in relation to volume throughput.
In Fig. 17 the five tubes are joined by two manifolds at the top and bottom, respectively. These tubes are designed so that four tubes are 90” apart on the radii of 48 mm of the centre tube. Fluid entered the system via a side port at the bottom manifold, then was distributed over five tubes and finally converged into the manifold at the top.
Experimental flow visualizations were carried out and shown to be similar in any tube to the results described in the multipass rig. In general, where
3302 M. R. MACKLEY and X. NI
_- 4
+ .___________________-_. 240 mm
I I I I I I
Fluid _ _ 20 &I- T Coductivity outlet ’ prohas --
1.2
--
3
--
4,5
; I
PT
25 mm --
Baffles spacing = 1.5 radius
-4
I Car& position
Ji I 1.000 mm
15 i_
:mm
4-
38 r,,,n Non-return VdW
Fig. 17. The Multitube apparatus.
baffles and oscillation were present the flow was seen to be chaotic and well mixed. In other situations axial streamline predominated with evidence of variability between different tubes. These observations were con- sistent with the concentration profiles that were ob- served for each tube.
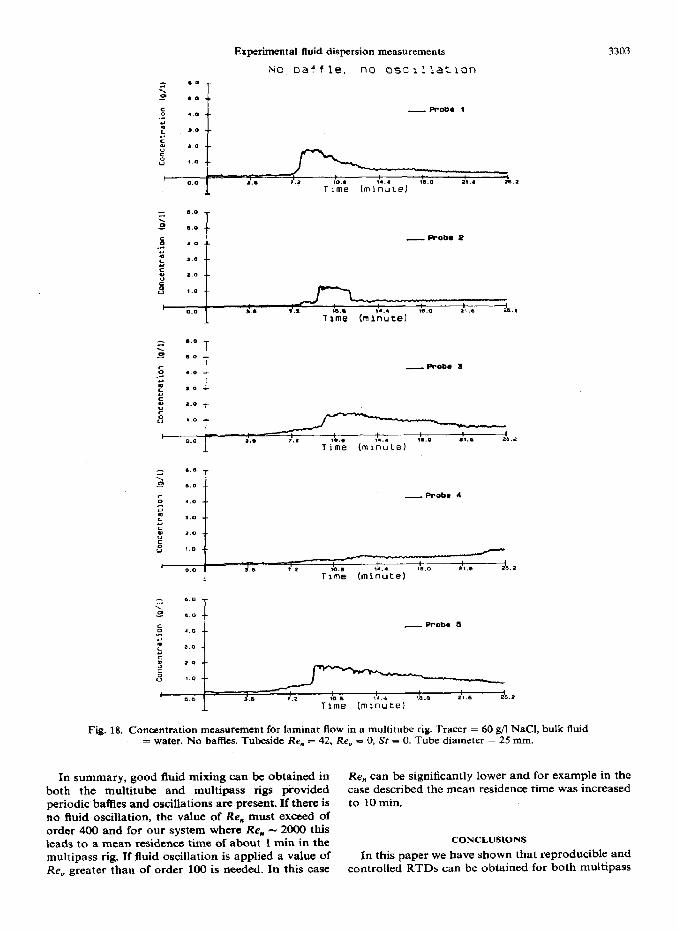
We show two concentration profiles for the multi- tube rig. Figure 18 shows the concentration profiles for the laminar flow (Re, = 42) in the unbathed tube array without oscillations. If there was perfect dis- tribution of flow, the form of the profiles when present should be similar at each probe position with no time delay for all probes. The actual profiles have displayed different forms of concentration measurements with
time delays, indicating that the non-uniformity of tracer distribution existed in the system. This is con- sistent with our flow visualisations. The measured concentration profiles demonstrate once again the typical laminar flow behaviour with a long tail after the breakthrough.
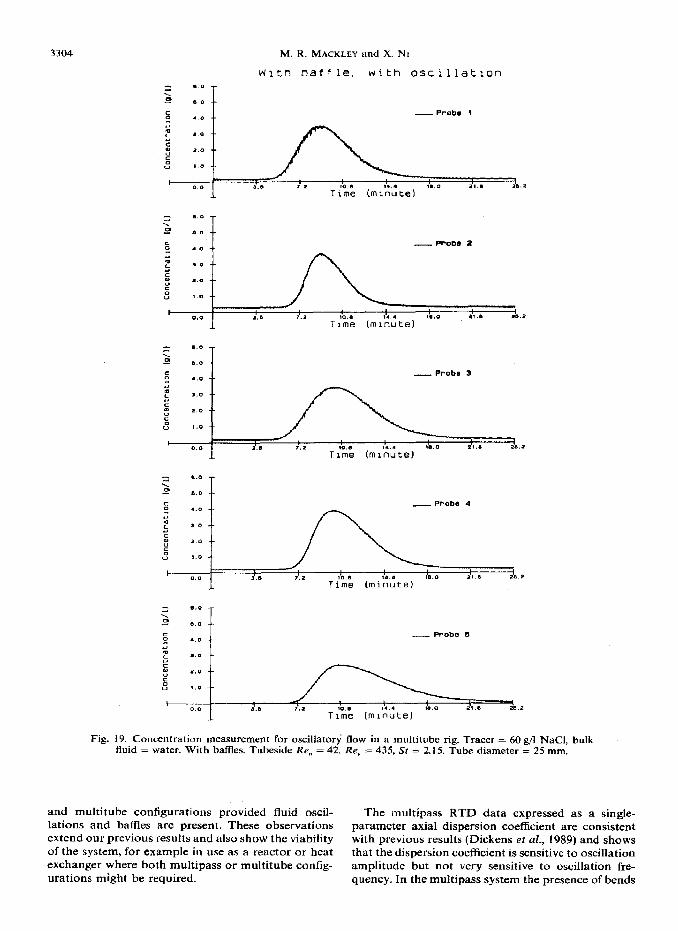
When both oscillations and baffles are superim- posed in the system with the same tubeside Reynolds number as shown in Fig. 18, each of the tube profiles has the form of a Gaussian curve with the same mean residence time. The eddy mixing has ensured that there is uniform distribution of tracer in each tube and also that the flow within the tube is effectively plug flow with axial dispersion (Fig. 19).
Experimental fluid dispersion measurements
No oaifle, no oscrlla:lon
? .O _
z? &O-- 5 - PrOD* 1 .o-- .a
: ,a--
E 20 _- s 8 l.3..
I 4 0.0 1.. 1.1 10.. I... “.a ‘I” 2s 2
Time (mInuteI
i-8
Time (minute)
Fig. 18. Concentration measurement for laminar flow in a multitube rig. Tracer = 60 g/l NaCI, bulk fluid = water. No baffles. Tubeside Re. = 42, Re, = 0, St = 0. Tube diameter = 25 mm.
3303
In summary, good fluid mixing can be obtained in Re,, can be significantly lower and for example in the
both the multitube and multipass rigs provided case described the mean residence time was increased periodic baffles and oscillations are present. If there is to 10 min. no fluid oscillation, the value of Re, must exceed of order 400 and for our system where Re, - 2000 this leads to a mean residence time of about 1 min in the CONCLUSIONS
multipass rig. If fluid oscillation is applied a value of In this paper we have shown that reproducible and Re, greater than of order 100 is needed. In this case controlled RTDs can be obtained for both multipass
3304 M. R. MACKLEY and X. NI
b4ltn aaffle. k41tn osclllatlon = .O
4 so
s .o - Pratlm 1
Time (minute)
Fig. 19. Concentration measurement for oscillatory flow in a multitube rig. Tracer = 60 g/l NaCI, bulk fluid = water. With baffles. Tubeside Re, = 42, Reo = 435, St = 2.15. Tube diameter = 25 nun.
and multitube configurations provided fluid oscil- The multipass RTD data expressed as a single- lations and baffles are present. These observations parameter axial dispersion coefficient are consistent extend our previous results and also show the viability with previous results (Dickens et al., 1989) and shows of the system, for example in use as a reactor or heat that the dispersion coefficient is sensitive to oscillation exchanger where both multipass or multitube config- amplitude but not very sensitive to oscillation fre- urations might be required. quency. In the multipass system the presence of bends
Experimental fluid dispersion measurements 3305
Table 3. Absolute dispersion in turbulent flow
Rc, D (m’/s)
No oscillation, No oscillation, with baffles no baffles
2121 2121 0.00395 0.00355
in the tube does not have a great effect when oscil- lations and baffles are present. The multitube RTD data shows the important result that the RTDs in each tube are very similar and there is no phase shift between each tube.
We also compared dispersion, using oscillation flow and baffles, with that obtained by running the tube with a turbulent net flow. Table 3 shows that when the net flow Reynolds number is high the presence of baffles makes little difference to the dispersion. Wow- ever, the absolute value of dispersion in a turbulent net flow can be considerably higher than that using oscillatory flow with baffles at a lower net flow Reynolds number. These results show that, for a given residence time requirement, a narrower RTD can be achieved using oscillatory flow and baffles over a turbulent net flow.
From the results reported here we have confidence that scale-up in terms of mean residence time can be achieved by using a multipass system of pipes. Mean residence times of between 30 s and several hours could be envisaged. In addition if scale-up in terms of volumetric flow is required the multitube configura- tion is equally viable; here both residence time and heat transfer control may well offer genuine strategic advantage over other tubular configurations.
The flow visualization experiments in particular also show that fluid oscillation in baffled tubes is an effective way of keeping particles in suspension and well mixed. The particles used for the visualization were 100-150 pm polyethylene reactor powder. These particles are nearly neutrally buoyant having a dens- ity of 960 kg/m3. In both the multitube and multipass configurations we observed that when baffles and oscillation were present the particles chaotically mixed and did not accumulate in any particular sec- tion of either rigs. Experiments with particles of greater densities and settling velocities of order 10 mm/s could also be kept in suspension and these results clearly show that the configuration described here could be used for example as continuous li- quid/solid reactors, where efficient mixing, heat trans- fer and residence time control are required.
Acknowledgment-We wish to thank SERC for their finan- cial support of this project.
NOTATION
C concentration of species, g/l D axial dispersion coefficient, m2/s
L D fk Re, St t u
distance between probes, m tube diameter, m the net Reynolds number the oscillatory Reynolds number the Strouhal number time variable, s superficial net flow velocity through a tube, m/s centre to peak amplitude of oscillation, m
Greek letters
v kinematic viscosity, m2/s w angular frequency of oscillation, radians/s
REFERENCES
Bellhouse. B. J.. Bellhouse. F. H.. Curl. C. M.. MacMillan. T. I., Gunnin& A. J., Spratt, E. H., MacMurray, S. B. and Nelems, J. M., 1973, A high efficiency membrane oxy- genator and pulsatile pumping system and its application to animal trials. Trans. Amer. Sot. artif: internal Organs 19, 12-79.
Brunold, C. R., Hunns, J. C. B.. Mackley, M. R. and Thomp- son, J. W., 1989, Experimental observations on flow pat- terns and energy losses for oscillatory flow in ducts con- taining sharp edges. Chem. Engng Sci. 44, 1227-1244.
Dickens, A. W., Mackley, M. R. and Williams, H. R., 1989, Experimental residence time distribution measurements for unsteady flow in baffled tubes. Chem. Engng Sci. 44, 1471-1479.
Goebel. J. C.. Booii. K. and Fortuin. J. M. H., 1986, Axial dispersion in siniie-phase flow in pulsed packed columns. Chem. Engng Sci. 41, 3197-3203.
Howes, T., 1988, On the dispersion of unsteady flow in baffled tubes. Ph.D. thesis.
Howes, T. and Mackley, M. R., 1990, Experimental axial dispersion for oscillatory flow through a baffled tube. Chem. Engng Sci. 45, 1349-1358.
Howes, T., Mackley, M. R. and Roberts, E. P. L., 1991, The simulation of chaotic mixing and dispersion for periodic flows in baffled channels. Chem. Enang Sci. 46.166991677.
Lo, T. C. and Baird, M. H. I., 1987,-Solvent extraction. Encyclopedia Sci. Tech. 13, 72-96.
Lo&J. T.. 1967. Enaineerintr for Nuclear Fuel Processing, _, I I
pp. 544-563. Gordon and &each, London. LongSdad, D. H. and Thornton, J. D., 1957, Liquid-liquid
extraction. Trans. lnstn Chem. Engrs 35, 331-542. Mackley, M. R., 1991, Process innovation using oscillatory
flow within baffled tubes. Trans. Instn Chem. Engrs 69, Part A, 197-199.
Mackley, M. R. and Ni, X., 1991, Mixing and dispersion in a baffled tube for steady laminar and pulsatile flow. Chem. Engng Sci. 46, 313993151.
Mackley, M. R., Tweedle, G. M. and Wyatt, I. D., 1990, Experimental heat transfer measurements for pulsatile flow in baffled tubes. Chem. Engng Sci. 45, 1237-1242.
Morris, M. J. and Dutton, J. C., 1991, An experimental investieation of butterflv valve wrformance downstream of an e?bow. Trans. AS&fE 113,‘81-85.
Niaam, K. D. P. and Nauman. E. B., 1985, Residence time distnbutions of power law fluids in motionless mixers. Con. J. them. Engng 63, 519-521.
Sobey, I. J., 1980, On flow through furrowed channels, Part I. Calculated flow patterns, .I. Fluid Mech. 96, l-26.