Embed Size (px)
Citation preview
Experimental Dynamic Substructuring of a Catalytic Converter System using the
Transmission Simulator Method
Matthew S. Allen, Associate Professor
Department of Engineering Physics University of Wisconsin-Madison
535 Engineering Research Building 1500 Engineering Drive
Madison, WI 53706 [email protected]
Daniel Roettgen
Department of Engineering Physics University of Wisconsin-Madison
534 Engineering Research Building 1500 Engineering Drive
Madison, WI 53706 [email protected]
ABSTRACT
This paper contains an example of experimental substructuring using the transmission simulator method on an assembly of automotive catalytic converters. These structures could be challenging to model with finite elements because of uncertainties in the material properties of the catalytic converts and the joint between ceramic catalysts and metal housings. This system is of interest because it has a production joint that has been found to exhibit nonlinearity and linear modeling presented here will be a precursor to modeling the nonlinearity in the joint. The substructure being used is a single catalytic converter attached to a steel plate. A modal test was performed in order to obtain a model of the substructure. The substructure model was developed using elastic modes and rigid body modes that were analytically constructed from measured rigid body mass properties and extracted FRF test data. This substructure is replicated about the connection axis and coupled to itself to generate a model of the full system; this assumes that each catalytic converter is identical. The steel plate was attached to the substructure to serve as the transmission simulator, and thus was subtracted from the final assembly. The substructuring predictions from were then compared to a truth model which was derived from a modal test of a fully assembled system.
Keywords: Experiment; MCFS; Dynamic Substructuring; Transmission Simulator; Exhaust System
1. Introduction With the complexity of real world systems, it can be difficult to model the details of each part of the system and to properly account for connections between each part. Sometimes parts of the model are unknown, and sometimes they are too complicated the accurately model with reasonable effort. These situations lend themselves to dynamic substructuring. Dynamic substructuring allows for the pieces of a system analyzed, or measured, individually and then to be added together to determine the dynamic response of the full system. This paper contains a detailed example of dynamic substructuring on an assembly of off the shelf catalytic converters. The goal of this exercise is to provide an example of dynamic substructuring on a real world system using the transmission simulator method. This provides insight into the feasibility and limitations of this method in a real industrial setting, where finite element analysis models are not easily constructed. To complete this task multiple experiments were performed. The first is a modal test on a single catalytic converter attached to a steel plate which acts as a transmission simulator. The second is a pair of catalytic converters attached directly with use of a factory gasket seal.
The transmission simulator method was developed in the past decade to address issues when dealing with difficult to simulate the boundary conditions at the joint between subcomponents of a larger system. To simulate theses boundary conditions the transmission simulator acts to mass load and exercise these joint between subcomponents. This has been found to greatly increase the accuracy of dynamic substructuring over a more classical free-free modes approach. Additional details about the transmission simulator method including more examples can be found in [1, 2, 3].

2. Test Objective and Methods The objective of this exercise is to generate a full system model for a pair of catalytic converters, picture in Figure 1, using the transmission simulator method. This mimics the problem of more practical interest, where substructuring would be used to develop a model for the upper part of the exhaust system including the engine and these two up-stream catalytic converters, including the compliance and nonlinear stiffness and damping of this full assembly. However, the engine was not available and so we simply seek to predict the response of the assembly shown below. These substructuring predictions will be compared to a “truth model” comprised of data from testing of the fully assembled system. The catalytic converters are connected by four bolts through the upper flanges of the system. From previous work [4], the frequency range of interest was defined as below 300 Hz and therefore frequencies up to 600 Hz were considered in the subcomponent models. After completing the modal testing the natural frequencies and damping ratios were extracted using the Algorithm of Mode Isolation (AMI) [5].
Fig. 1: Assembled Catalytic Converter System
Tests were performed on two different structures: a subcomponent test was performed using just one catalytic converted attached to a transmission simulator, and a full assembly “truth” test was performed on the pair of converters shown in Figure 1. A global coordinate scheme was used for both tests is also shown in Figure 1 with the z direction pointing into the figure.
2.1 Subcomponent Test The subcomponent consisted of the left hand catalytic converter from Figure 1 and a steel plate used as the transmission simulator. The catalytic converter was instrumented with four pairs of uniaxial accelerometers. Each pair consisted of one accelerometer aligned with the global x- direction and one aligned with the global z direction. The transmission simulator was instrumented with two tri-axial accelerometers as well was two pairs of uniaxial accelerometers. Figure 2 shows the experimental set up for the substructure with the global z direction out of the page. Small metallic blocks were used to align the accelerometers into the global xyz coordinate system. A stick model showing the measured node locations is shown in Figure 3.

Fig. 2: Subcomponent: Single Catalytic Converter and Transmission Simulator
Fig. 3: Subcomponent Stick Model
The substructure was suspended using bungee cords to simulate free-free conditions as seen in Figure 2. From [6] it is desired to have the largest rigid body mode to be at least ten times smaller than the first elastic mode in order to minimize error in the experiment. The lowest elastic mode occurred at 230 Hz and this system’s rigid body modes were below 10 Hz so this condition was easily met.
The mass properties for the converter were obtained from the mass properties lab at Sandia National Labs and are presented in Table 1. These mass properties were determined assuming products of inertia were negligible and that the global coordinate system could be considered the principal coordinate system. Rigid body mode shapes were calculated using the moments of inertia and center of gravity of the catalytic converter as well as the transmission simulator. The origin for these

center of gravity measurements is taken from point A in the global coordinate system as labeled in for Figure 2. The parallel axis theorem was used to combine these measured mass properties for the catalytic converter with the analytical mass properties for the transmission simulator. The transmission simulator mass properties were calculated using the mass of the part along with it's physical dimensions.
Table 1: Mass Properties for Subcomponent System
Catalytic Converter
TransmissionSimulator
Full Subsystem
Mass [kg] 3.517 5.615 9.127 cgx [m] 0.004 0.035 0.023 cgy [m] 0.147 0.032 0.076 cgz [m] 0.074 -0.011 0.013
Ixx [kg m2] 0.03325 0.05525 0.12096 Iyy [kg m2] 0.00036 0.00491 0.04058 Izz [kg m2] 0.01313 0.00453 0.11935
At low frequency the FRFs of a structure tend to a constant value caused by the sum of the rigid body modes, called mass lines. The mass lines generated from the mass properties in Table 1
can be compared to those extracted experimentally. When this was done, the mass lines constructed from the mass properties did not reproduce the mass lines of the experimental system and it was deduced this was due to missing product of inertia terms. In order to mitigate this error only the translational rigid body modes were used from the mass properties in Table 1. An alternative set of rotational rigid body modes were generated based on experimental data as detailed in Appendix A.
The subsystem was excited with a modal impact hammer at several drive points in order to attempt to find the best location to excite each individual mode. Drive points were gathered both on the catalytic converter as well as the transmission simulator. Drive points on the catalytic converter were difficult to complete as it was difficult to hit in line with mounted accelerometers without risking the integrity of the measurement. Ultimately, the drive points on the transmission simulator yielded the best results, due to the difficulty of exciting at an appropriate location and in a precise direction on the catalytic converters.
The analytical rigid body modes were combined with 5 elastic modes extracted from this modal experiment. These modes are shown in Table 2. Drive points were taken at points 101, 102, 103, and 104 in the positive z direction as well as the x and y directions to generate the rotational rigid body modes. Figure 2 shows an FRF that provides a comparison of the truth data and the two ways of calculating the rigid body modes. From inspection it becomes obvious that the incomplete mass properties do no simulate the mass lines and rigid motion of the system very well.
Table 2: List of Modes and Descriptions for Subcomponent Test
Mode Frequency [Hz] Damping Ratio % Description
1 0.00 1.00% x direction translation 2 0.00 1.00% y direction translation 3 0.00 1.00% z direction translation 4 0.00 1.00% rotation about x 5 0.00 1.00% rotation about y 6 0.00 1.00% rotation about z 7 230.49 0.519% 1st Bending
8 246.60 0.069% 2nd Bending
9 316.19 0.432% 3rd Bending 10 540.65 0.034% 1st Torsion 11 560.75 0.054% 4th Bending
0 100 200 300 400 500 60010
-3
10-2
10-1
100
101
Subsystem FRF: H(102.3,101.3)
Frequency [Hz]
Ma
gn
itu
de
Truth Data
Experimental Rigid ModesMass Properties Rigid Modes
Fig. 4: Subcomponent FRF: [Drive Point 102-Z, Response Point 101-Z]
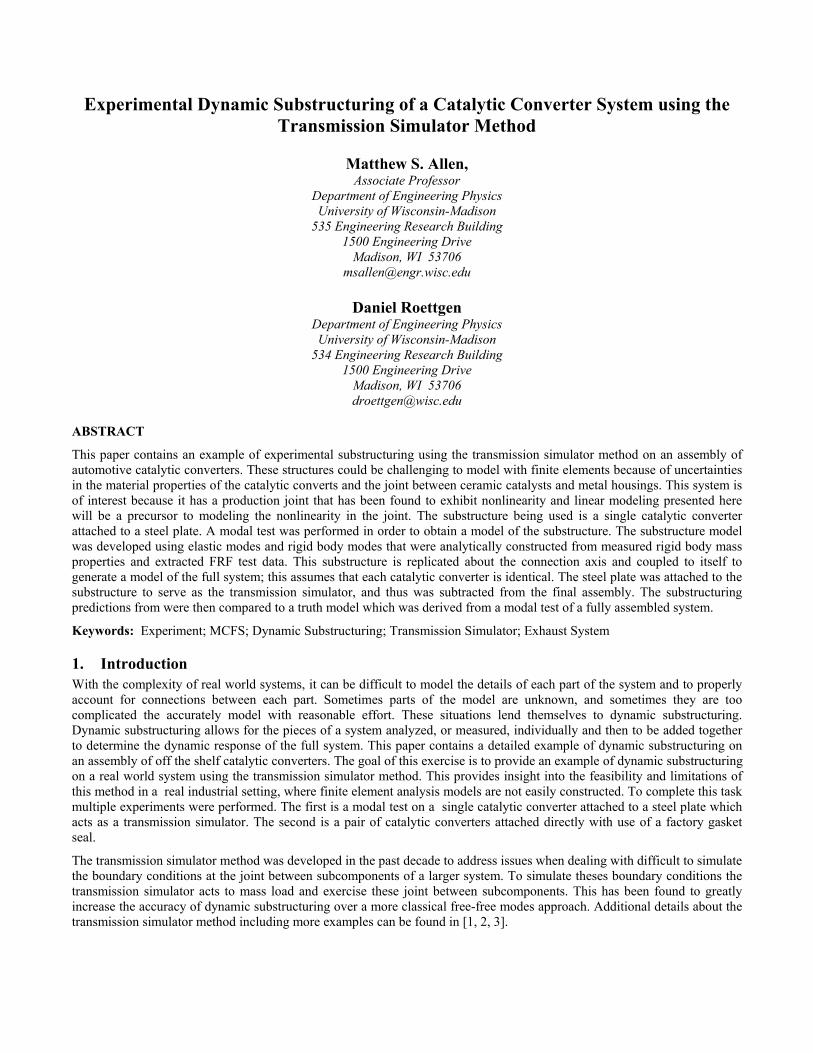
2.2 Truth Test With the subcomponent test complete a full system “truth” test was also conducted to be used as a baseline for the substructuring results. This truth test was completed using two catalytic converters pictured previously in Figure 1. A stick model showing full system truth test node numbering is pictured in Figure 5.
Fig. 5: Full System Stick Model
The full assembly system was excited at point 201 in the z direction, this allowed the structure to be hit in line with the accelerometer where this would have been more difficult at points on the catalytic converters bodies. Nine elastic modes were calculated to be compared with the substructuring predictions.

3. Substructuring Methodology The transmission simulator method was utilized in order to assemble two copies of the experimentally derived model to estimate the modes of the full assembly as shown in Figure 1. The second copy of this subsystem needs to be rotated 180 degrees such that node 101 from the first copy will be constrained to node 102 of the second copy and vice versa. Table 3 contains the constrained degree of freedom pairs.
Table 3: List of Modes and Descriptions for Subsystem Test
Subsystem 1 Degree of Freedom
Subsystem 2 Degree of Freedom
101 [x,y,z] 102 [x-,y,z-] 102 [x,y,z] 101 [x-,y,z-]
103 [z] 104 [z-] 104 [z] 103 [z-]
Note all of these points are located on the transmission simulator. With two copies of the subsystem included in the full assembly model two transmission simulators will need to be removed in order to complete the substructuring. The first elastic natural frequency of the transmission simulator was found to be 840 Hz. This frequency was beyond the bandwidth of interest so the transmission simulator was treated as rigid. A later exercise may be completed to add this mode into the system and see its impact on the substructuring results.
For the following calculations, the subscript A represents the first catalytic converter and transmission simulator pair with B representing the same system rotated 180 degrees. The subscript C represents the fully assembled system and the subscript TS represents the transmission simulator. The modal parameters and represent the natural frequencies and damping ratios of their respective subsystems and represents the associated mode shapes. The physical degrees of freedom are represented by vectors denoted x and the modal degrees of freedom are denoted by vectors q. To begin, the system of equations is written in the standard mass-normalized modal representation of the equations of motion.
2
2
2
0 0 0 0
0 0 0 0
0 0 2 0 0 2 2
TA A A A A A
TB B B B B B
TTS TS TS TS TS TS
I q q F
I q q F
I q q F
(1)
The following constraints between the physical displacements would enforce the connection between the two substructures. This equation only applies to the subset of degrees of freedom which act to connect the transmission simulator between substructures.
00
00
0
A
B
TS
xI I
xI I
x
(2)
The constraint equation can then be rewritten in terms of modal coordinates as seen in Equation .
00
00
0
AA TS
BB TS
TS
q
q
q
(3)
In order to take advantage of the transmission simulator method, the constraints are now pre-multiplied by the pseudo-inverse of the transmission simulator mode shapes partitioned to the constraint degrees of freedom. This has the effect of constraining the estimated modal degrees of freedom of the TS to their projection on the A and B subcomponents.
0
000
000
AA TSTS
BB TSTS
TS
q
q
q
(4)
The rest of the steps are exactly as outlined in [1, 7]. The result is an estimate of modes of the assembly: C , C and C .

4. Substructuring Results The substructuring predictions will now be compared to the full assembly truth test briefly discussed previously in this paper. Comparisons of the frequencies, damping ratios are contained in Table 4. The Modal Assurance Criterion (MAC) between the “truth test’ and the substructure predictions was also calculated and is contained in Table 4.
Table 4: Substructuring Results
Truth Test Substructuring Prediction
Mode Frequency
[Hz] Damping Ratio [%]
Frequency [Hz]
Damping Ratio [%]
Frequency % Error
Damping Ratio %
Error MAC Description
7 117.62 0.48% 131.2 0.19% 11.55% -59.45% .9850 Bending 8 235.05 0.43% 203.34 0.44% -13.49% 2.56% .6701 Torsion 9 245.18 0.12% 246.84 0.08% 0.68% -36.53% .4061 Torsion
10 251.78 0.24% 250.37 0.11% -0.56% -52.90% .7930 Torsion 11 466.99 0.53% 410.14 0.56% -12.17% 6.13% .5811 Bending 12 510.56 0.85% 542.34 0.04% 6.22% -95.05% .7751 Bending 13 540.65 0.07% 542.59 0.04% 0.36% -44.79% .0089 Torsion 14 546.14 0.18% 561.21 0.06% 2.76% -66.19% .0014 Bending
By inspection of Table 4, some trends can be identified. The first two elastic modes are more than 10% off in frequency. Despite this the frequencies compare very well for some of the elastic modes (modes 9, 10 and 13). Damping proved harder to predict with errors as high as 95%. The damping of the system was very light so small changes in damping ratio correspond to large changes in percent difference. The modal damping estimated in the truth or subcomponent tests varied up 15% (e.g. a 10 % difference in could correspond to damping ratios of 0.010 and 0.011) from one drive point to another. With such variation, larger errors in the damping predictions were expected. It was very difficult to get a good driving point on the subsystem which led to difficulty choosing one measurement over another.
Mode shapes were also correlated through MAC values and FRF reconstruction. A plot of the MAC values for the truth test shapes and substructured shapes is shown in Figure 6. MAC values for the three rigid body translation modes correlated as expected. This verifies that the substructuring script is working since it is merely assembling the rigid body translation modes, and the rigid body modes that are predicted for the assembly are simply a sum of the mass properties of the two catalytic converters. The rotational modes did not correlate as well as the translational modes, but this was also expected as the mass properties used to generate full assembly rigid body modes were those mentioned earlier shown to have substantial error when comparing mass lines at the subcomponent level. Modes 7, 8, 10, and 12 also matched reasonably well but the MAC values for Modes 9, 11, 13 and 14 were poor. The sensor set used was also limited so it proves difficult to distinguish all modes with such a small sensor set.
1 2 3 4 5 6 7 8 9 10 11 12 13 14
1
2
3
4
5
6
7
8
9
10
11
12
13
14
"Truth" Test Modes
Su
bs
tru
ctu
rin
g P
red
icti
on
Mo
de
s
Plot of MAC Matrix
0
0.1
0.2
0.3
0.4
0.5
0.6
0.7
0.8
0.9
1
Fig. 6: Subsystem Full System Measurement Degrees of Freedom

In addition to MAC correlation, Mode shapes for the truth and substructured shapes were also visually compared. They are illustrated in the YZ and XZ planes in Figure 7. In these modes shape plots the solid blue and red lines show the substructuring prediction representing the A and B catalytic converters respectively. The black and green lines show truth test mode shapes for the A and B catalytic converts respectively. The dashed lines show the undeformed shapes.
In Figure 7 the best match between the substructured and truth test modes appears in Mode 7 which matches well with the calculated MAC values. For some of the more borderline MAC values, such as those in modes 8 and 10, visual comparison of the mode shapes matched better than the MAC values would imply. For some the substructure seems to not have captured these mode shapes well (Modes 9, 13, and 14). These modes are predominantly torsional system modes and modes near the highest used sub-system frequency.
Fig. 7: Elastic Mode Shapes (Red/Blue – Substructured Catalytic Converters, Green/Black – Truth Experiment, Dashed – Undeformed Shape)

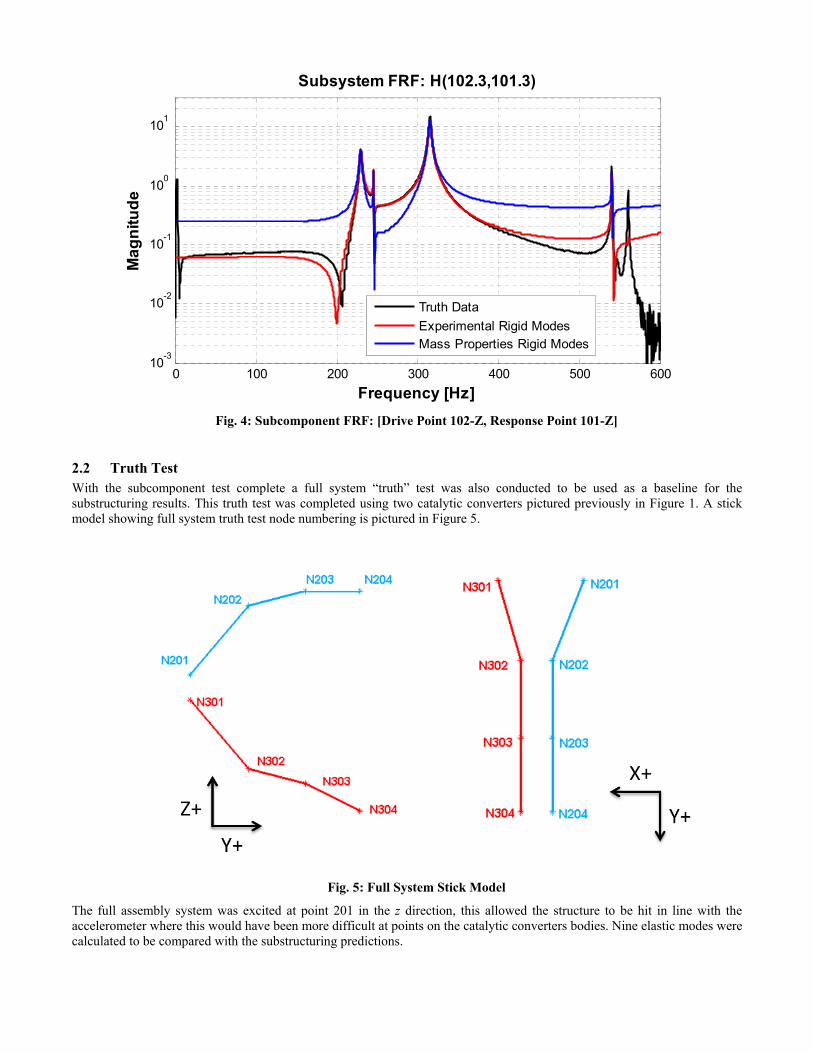
Often the purpose for performing substructuring is to estimate the response levels or strains at key points of interest. This was explored by reconstructing the FRFs at a few points and comparing them to the experimental test data. Three examples of reconstructed FRFs are shown in Figures 8 and 9.
Figure 8 shows the drive point FRF for a strike and a measurement at location 201 in the z direction. Comparing this model to the measured truth data several more assessments can be made of the substructuring results. First, the mass lines match those of the experimental data fairly well. This indicates that the rigid body modes that were experimentally extracted from the single systems seem do predict those of the full assembly.
The prediction of the response for the elastic modes does not match the experimental data very well, but there is good qualitative agreement. The substructured mode shapes correctly assess the small response level for first elastic mode at the drive point as seen in Figures 8. In contrast, a large response is correctly identified at point 203 as seen in Figures 9. Both FRF plots show that the substructured model struggles to pick up the third elastic mode verifying the dissimilar mode shapes from Figure 7 and the low MAC value for this modes. The predictions based on the substructuring results did not reconstruct the truth data perfectly, but one should bear in mind that on the first few iterations a finite element model would probably not provide a better prediction of the response, especially considering all of the uncertainties associated with the material properties of the ceramic catalysts and the compliance of the joints in the system. Furthermore, the authors do not believe that these results represent the best that could be achieved with substructuring. The possible sources of error are discussed in the next section.
50 100 150 200 250 300 350 400 450 500 55010
-3
10-2
10-1
100
101
g ( , )
Frequency [Hz]
Ma
gn
itu
de
Truth Data
Substructuring Prediction
Fig. 8: FRF Reconstruction: Driving Point 201Z, Response Point 201Z
50 100 150 200 250 300 350 400 450 500 55010
-4
10-3
10-2
10-1
100
101
g ( , )
Frequency [Hz]
Ma
gn
itu
de
Truth Data
Substructuring Prediction
Fig. 9: FRF Reconstruction: Driving Point 201Z, Response Point 203Z
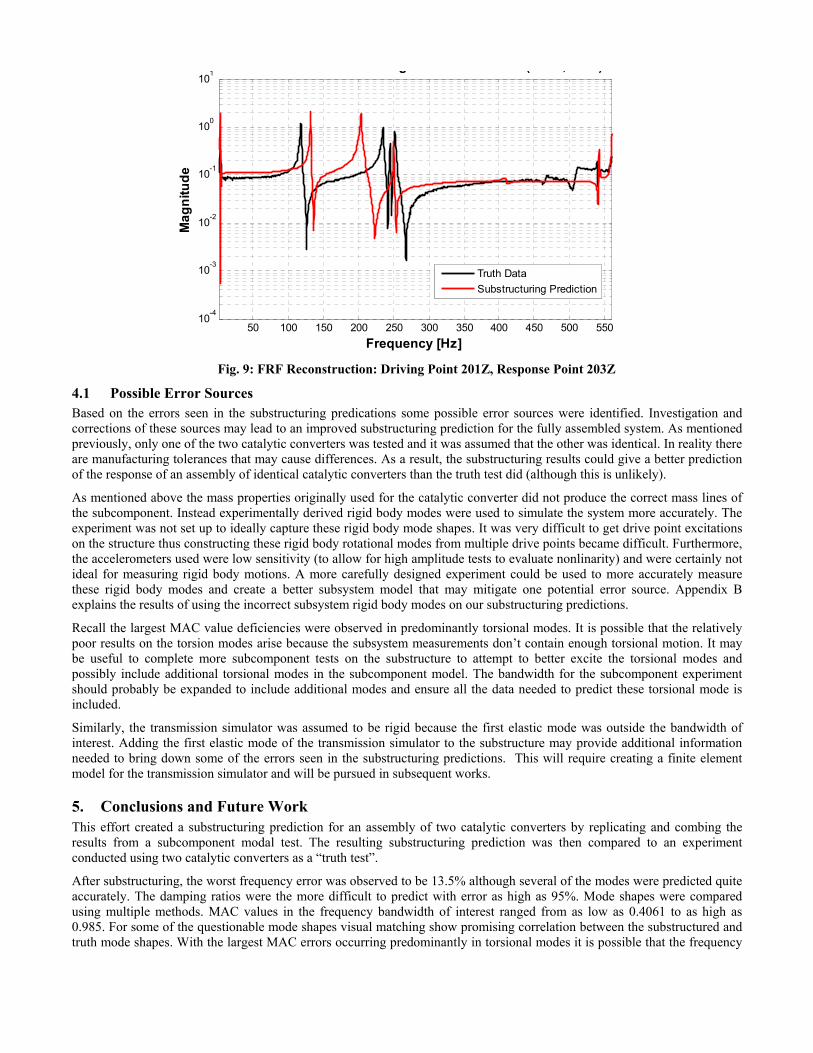
4.1 Possible Error Sources Based on the errors seen in the substructuring predications some possible error sources were identified. Investigation and corrections of these sources may lead to an improved substructuring prediction for the fully assembled system. As mentioned previously, only one of the two catalytic converters was tested and it was assumed that the other was identical. In reality there are manufacturing tolerances that may cause differences. As a result, the substructuring results could give a better prediction of the response of an assembly of identical catalytic converters than the truth test did (although this is unlikely).
As mentioned above the mass properties originally used for the catalytic converter did not produce the correct mass lines of the subcomponent. Instead experimentally derived rigid body modes were used to simulate the system more accurately. The experiment was not set up to ideally capture these rigid body mode shapes. It was very difficult to get drive point excitations on the structure thus constructing these rigid body rotational modes from multiple drive points became difficult. Furthermore, the accelerometers used were low sensitivity (to allow for high amplitude tests to evaluate nonlinarity) and were certainly not ideal for measuring rigid body motions. A more carefully designed experiment could be used to more accurately measure these rigid body modes and create a better subsystem model that may mitigate one potential error source. Appendix B explains the results of using the incorrect subsystem rigid body modes on our substructuring predictions.
Recall the largest MAC value deficiencies were observed in predominantly torsional modes. It is possible that the relatively poor results on the torsion modes arise because the subsystem measurements don’t contain enough torsional motion. It may be useful to complete more subcomponent tests on the substructure to attempt to better excite the torsional modes and possibly include additional torsional modes in the subcomponent model. The bandwidth for the subcomponent experiment should probably be expanded to include additional modes and ensure all the data needed to predict these torsional mode is included.
Similarly, the transmission simulator was assumed to be rigid because the first elastic mode was outside the bandwidth of interest. Adding the first elastic mode of the transmission simulator to the substructure may provide additional information needed to bring down some of the errors seen in the substructuring predictions. This will require creating a finite element model for the transmission simulator and will be pursued in subsequent works.
5. Conclusions and Future Work This effort created a substructuring prediction for an assembly of two catalytic converters by replicating and combing the results from a subcomponent modal test. The resulting substructuring prediction was then compared to an experiment conducted using two catalytic converters as a “truth test”.
After substructuring, the worst frequency error was observed to be 13.5% although several of the modes were predicted quite accurately. The damping ratios were the more difficult to predict with error as high as 95%. Mode shapes were compared using multiple methods. MAC values in the frequency bandwidth of interest ranged from as low as 0.4061 to as high as 0.985. For some of the questionable mode shapes visual matching show promising correlation between the substructured and truth mode shapes. With the largest MAC errors occurring predominantly in torsional modes it is possible that the frequency
bandwidth was not adequate to describe the motions in the frequency range of interest. It was also observed that it was difficult to obtain good drive point measurements, so while the measurements were clean and could be curve fit easily, it was difficult to extract mode vectors that would correctly reconstruct the FRFs at all of the drive points. These substructuring predictions were not able to replicate the truth test perfectly but provided a qualitatively good estimate for the modes of interest and for the frequency response functions at several points, especially considering the time and effort that would be required to create and update a finite element model of comparable quality.
Acknowledgements
This work was conducted / supported by Sandia National Laboratories. Sandia is a multi-program laboratory operated under Sandia Corporation, a Lockheed Martin Company, for the United States Department of Energy under Contract DE-AC04-94-AL85000.
References
[1] M. S. Allen, R. L. Mayes, and E. J. Bergman, "Experimental Modal Substructuring to Couple and Uncouple Substructures with Flexible Fixtures and Multi-point Connections," Journal of Sound and Vibration, vol. 329, pp. 4891–4906, 2010, http://dx.doi.org/10.1016/j.jsv.2010.06.007.
[2] R. L. Mayes, M. S. Allen, and D. C. Kammer, "Correcting indefinite mass matrices due to substructure uncoupling," Journal of Sound and Vibration, vol. 332, pp. 5856-5866, 2013, http://dx.doi.org/10.1016/j.jsv.2013.05.025.
[3] M. S. Allen, D. C. Kammer, and R. L. Mayes, "Metrics for Diagnosing Negative Mass and Stiffness when Uncoupling Experimental and Analytical Substructures," Journal of Sound and Vibration, vol. 331, pp. 5435–5448, 2012, http://dx.doi.org/10.1016/j.jsv.2012.06.024.
[4] D. R. Roettgen, M. S. Allen, D. Osgood, and S. Gerger, “Feasibility of Describing Joint Nonlinearity In Exhaust Components With Modal Iwan Models,” Proceedings of the ASME 2014 International Design Engineering Technical Conference. Buffalo, New York, 2014.
[5] M. S. Allen and J. H. Ginsberg, "A Global, Single-Input-Multi-Output (SIMO) Implementation of The Algorithm of Mode Isolation and Applications to Analytical and Experimental Data," Mechanical Systems and Signal Processing, vol. 20, pp. 1090–1111, 2006.
[6] T. G. Carne, D. T. Griffith, and M. E. Casias, “Support Conditions for Experimental Modal Analysis.” Sound and Vibration, Vol. 41 (2007), pp. 10-16.
[7] J. H. Ginsberg, Mechanical and Structural Vibrations: Theory and Applications. New York: Wiley, 2001. Appendix A: Alternate Rotational Rigid Body Mode Calculation
The large mismatch in mass lines when using the assumed mass properties, as seen in Figure 4, led to the development of experimental rigid body rotational modes. This appendix details the calculation of these modes. The mass line for an FRF can be calculated as a sum of the six rigid body modes or residues for the FRF. This means the total mass line for an FRF can also be written as a sum of the translational mass lines and the rotational mass lines.
6
1n
n
ML res
(5)
total translation rotationML ML ML (6)
The translational mass lines can be calculated using the mass of the system leaving only three rotational mass lines to be solved for. These mass lines can be calculated as the translational mass lines (calculated analytically from a mass measurement) subtracted from the total mass lines (measured experimentally). This total set of mass lines can come from multiple drive point locations to ensure you excite all rotational rigid body modes and therefore account for all moments and products of inertia.
rotation total translationML ML ML (7)
In order to calculate the rotational rigid body modes an eigen value problem for the rotational mass lines must be solved. The eigen values from this solution should be real and positive. Using the largest eigen values the approximate experimental rigid body modes are then calculated.
1rotation rotationML
(8)
These rigid body modes provided a much better match for the mass lines of the experimental subcomponent.
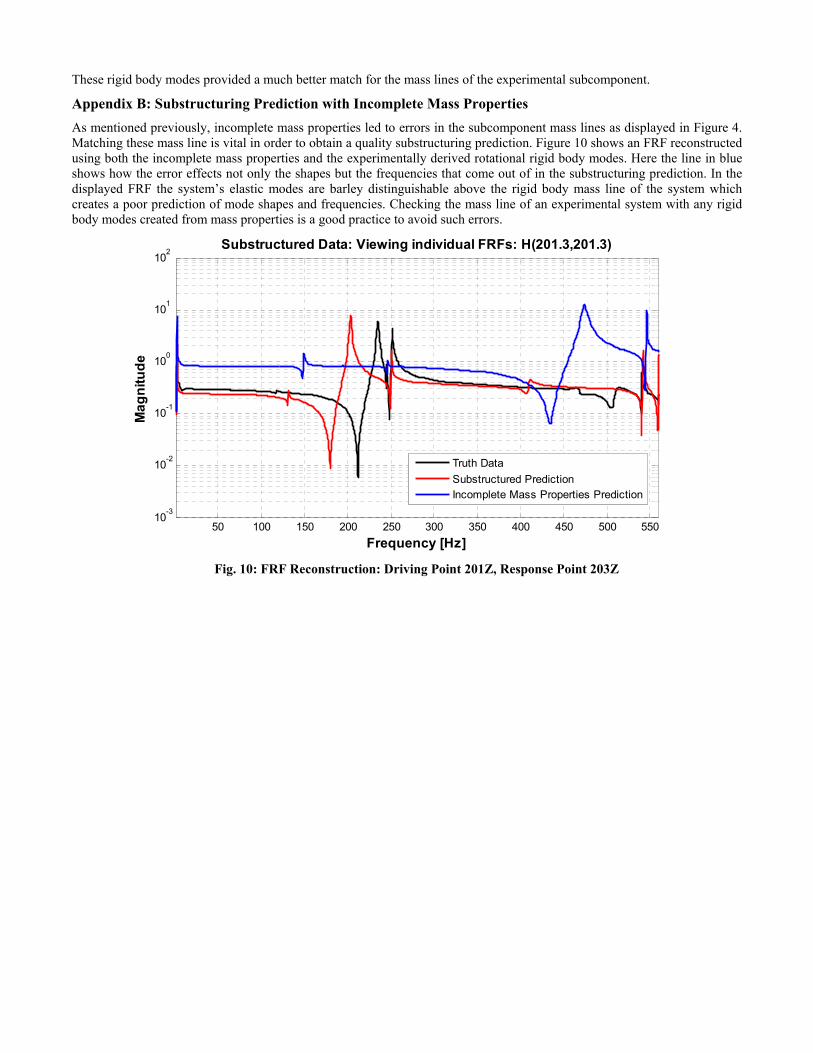
Appendix B: Substructuring Prediction with Incomplete Mass Properties
As mentioned previously, incomplete mass properties led to errors in the subcomponent mass lines as displayed in Figure 4. Matching these mass line is vital in order to obtain a quality substructuring prediction. Figure 10 shows an FRF reconstructed using both the incomplete mass properties and the experimentally derived rotational rigid body modes. Here the line in blue shows how the error effects not only the shapes but the frequencies that come out of in the substructuring prediction. In the displayed FRF the system’s elastic modes are barley distinguishable above the rigid body mass line of the system which creates a poor prediction of mode shapes and frequencies. Checking the mass line of an experimental system with any rigid body modes created from mass properties is a good practice to avoid such errors.
50 100 150 200 250 300 350 400 450 500 55010
-3
10-2
10-1
100
101
102
Substructured Data: Viewing individual FRFs: H(201.3,201.3)
Frequency [Hz]
Ma
gn
itu
de
Truth Data
Substructured PredictionIncomplete Mass Properties Prediction
Fig. 10: FRF Reconstruction: Driving Point 201Z, Response Point 203Z