Embed Size (px)
Citation preview
EXPERIMENTAL DETERMINATION OF STEAM WATER RELATIVE
PERMEABILITY RELATIONS
A REPORT SUBMITTED TO THE DEPARTMENT OF
PETROLEUM ENGINEERING AND COMMITTEE OF GRADUATE
STUDIES OF STANFORD UNIVERSITY
IN PARTIAL FULFILLMENT OF THE REQUIREMENTS FOR THE
DEGREE
OF
MASTER OF SCIENCE
by
Willis J. Ambusso
June 12, 1996
Abstract
A set of relative permeability relations for simultaneous ow of steam and
water in porous media have been derived from experiments conducted under
conditions that eliminate most errors associated with saturation and pressure
measurements. These relations show that the relative permeability for steam
phase in porous media varies linearly with saturation. The liquid phase, how-
ever shows a variation close to that observed by Corey (1954) in water/gas
experiments. This departure from the nitrogen/water behavior indicates that
there are fundamental di�erences between steam/water and nitrogen/water
ows.
The saturations in these experiments were measured by using a high reso-
lution X-ray computer tomography (CT) scanner. In addition the pressure
gradients were obtained from accurate measurements of liquid phase pres-
sure over portions with at saturation pro�les. These two aspects constitute
a major improvement in the experimental method compared to those used
in the past.
Comparison of the saturation pro�les measured by the X-ray CT scanner
during the experiments shows good agreement with those predicted by nu-
merical simulations. To obtain results that are applicable to general ow
of steam and water in porous media similar experiments should be done at
higher temperature and with porous rocks with di�erent wetting character-
istics and porosity distribution.
2
Contents
1 Introduction 3
2 The Concept and Previous Work 7
2.1 The Concept of Relative Permeability : : : : : : : : : : : : : : 7
2.2 Literature Review : : : : : : : : : : : : : : : : : : : : : : : : : 10
3 Numerical Simulation 19
3.1 Relative Permeability Curves : : : : : : : : : : : : : : : : : : 20
3.2 Flow Rates : : : : : : : : : : : : : : : : : : : : : : : : : : : : 30
3.3 Heat Losses : : : : : : : : : : : : : : : : : : : : : : : : : : : : 30
4 Core Holder Design 36
4.1 The Plastic and Epoxy Core Holder : : : : : : : : : : : : : : : 39
4.2 Ceramic End Plates : : : : : : : : : : : : : : : : : : : : : : : : 41
4.3 Final Design : : : : : : : : : : : : : : : : : : : : : : : : : : : : 44
4.4 Mounting the Core : : : : : : : : : : : : : : : : : : : : : : : : 47
5 Experiments and Results 48
5.1 General : : : : : : : : : : : : : : : : : : : : : : : : : : : : : : 48
1
5.2 Experiments : : : : : : : : : : : : : : : : : : : : : : : : : : : : 50
5.3 Analysis : : : : : : : : : : : : : : : : : : : : : : : : : : : : : : 53
5.4 Interpretation of Results : : : : : : : : : : : : : : : : : : : : : 58
6 Conclusion 72
7 References 75
2

Chapter 1
Introduction
Application of Darcy's law to the description of simultaneous ow of two or
more phases of uids in a porous medium requires the use of relative perme-
ability relations (Hassler et al., 1936; Osoba et al., 1951; Corey, 1954; Brooks
and Corey, 1964). In most applications in petroleum engineering such as
those involving the ow of oil and water as in water ooding and oil and gas
as in gas injection, these relations are well known and can be determined
from routine laboratory experiments (Osoba et al., 1951). However, for the
ow of steam and water or for the general case of single component two-phase
ows these relations are not well known. To our knowledge, no single set of
relations among the many that have been reported in the last few decades
are known to be error free (Verma, 1986; Sanchez et al., 1980; Clossman and
Vinegar, 1988). The main di�culties in these experiments, as we show later,
have been due to inaccurate measurements of uid saturations and inappro-
priate assignment of pressure gradients. Other techniques involving analysis
of enthalpy transients from producing geothermal �elds have been used to
3
infer relative permeability relations (Grant, 1977; Sorey et al., 1978; Horne
and Ramey, 1978). However these techniques do not eliminate all the vari-
ables and quite often the in-situ uid saturations and the overall permeability
structure (i.e matrix, fracture) are unknown. These curves are therefore at
best good approximations.
As shown by experiments by Osoba et al. (1951) and Hassler et al. (1936),
laboratory measurements of relative permeability can still have error if cap-
illary end-e�ects are not taken into account. The end-e�ects are known to
cause pressure gradients and by extension saturation gradients resulting in
nonuniform distribution of uids in the core particularly at low ow rates.
Ignoring this e�ect may result in underestimating the relative permeability
of the wetting phase and attributing a permeability value for the non-wetting
phase to a wrong saturation (Verma, 1986). Though this type of error can
be avoided for two-phase two-component ows under isothermal conditions,
all of the experiments meant to determine steam and water relative perme-
ability relations reported in the past have not been able to eliminate these
errors for two main reasons; 1) measurements of uid saturations are not
easy since the phase change with pressure drop along the core implies that
the material balance methods used in isothermal cases are inapplicable, and
2) the changing pressure gradients along the core due to the combined e�ect
of the end-e�ects and changing owing fractions with phase change generally
imply that any average pressure gradient measurement across the core would
be di�erent from the actual gradients at points along the core.
4

In the experiments reported here the errors discussed above have been re-
duced signi�cantly by using X-ray computer tomography (CT) to measure
uid saturations and by using pressure gradients from zones with constant
uid saturations to compute the relative permeability relations. The CT
scanner is an adaptation of the X-ray equipment used conventionally in hos-
pitals for examining internal parts of human body. Through manipulation of
images taken by this equipment it is possible to determine the uid satura-
tions to an accuracy of a few percent and this has been done successfully in
experiments involving other uids in porous media (Johns et al., 1993; Satik
et al., 1995). Another advantage of using the CT scanner is that it enables
the internal structure of the porous material to be examined for variations in
porosity and also the examination of the uid distribution within the core.
It is therefore possible to investigate samples of porous material for homo-
geneity and evaluate ow experiments for uid segregation, channeling e.t.c.
By measuring the pressure of one phase at various points along the core it
is possible to eliminate the errors involved in assigning wrong pressure gra-
dients to the owing components by using only the intervals over which the
saturations are constant for calculating relative permeability. In this work it
was not possible to conduct the experiments under adiabatic conditions as
the CT scanner imposes limits on the kind of materials that can be used thus
e�ectively eliminating the use of guard heaters. However, heat losses were
minimized by using a thick layer of high performance ceramic insulation ma-
terial. In addition heat losses from the core were measured at several points
using heat ux sensors.
5
However a number of issues had to be resolved before the experiments could
be performed. Among many other issues, constructing a core holder that
could be used in the X-ray CT scanner was a challenging task. Using high
density materials in the scanning area is unacceptable since such materials
form artifacts in the images and which lead to errors in saturation measure-
ments. Numerical simulations were carried out to determine the optimum
experimental conditions. This included determining the appropriate core
length, the e�ect of heat losses and the time required for steady state condi-
tions to be reached.
This report therefore begins by looking at the origins and the concept of
relative permeability. Following this our experimental approach is described
together with the conditions that have to be met in order to overcome some
of the errors associated with laboratory measurements. Next the results of
the numerical investigations are presented followed by a chronology of the
design and construction of the core holder. The last two sections then present
the experimental investigations and a discussion of the results.
6
Chapter 2
The Concept and Previous
Work
2.1 The Concept of Relative Permeability
The concept of relative permeability is an attempt to extend Darcy's law for
single phase ow of uid through porous media to account for simultaneous
ow of several phases. In this regime the ow of each phase is governed by
the microscopic pressure gradient of each phase and the fraction of the over-
all permeability that is associated with it. This fraction, normally expressed
as a fraction of the medium's permeability to single phase uid normally the
wetting phase, is called the relative permeability. Since being introduced
by Buckingham in 1907 and used extensively by investigators in the 1930's
relative permeability has been expressed as a function of saturation princi-
pally because it was believed that it depended on the pore volume occupied
by the uids (Hassler et al., 1936). Whereas a great many experiments
7

have shown this to be true, a number of other experiments have shown that
relative permeability depends on several other parameters among them in-
terfacial tension, wetting characteristics and viscosity ratios of the owing
uids (Fulcher et al., 1983; Osoba et al., 1951). Since these parameters are
expected to change with the type of uid, porous media and even with tem-
perature, it should be expected that relative permeability would change for
a given set of materials and experimental conditions.
Relative permeability is a manifestation of microscopic forces and physical
factors governing pore level movement and distribution of uids. Whenever
two or more phases are present within the pore space, their distribution is
governed by the balance of capillary forces between uid components and
the rock, and by the wetting characteristics of the rocks. These two forces
coupled with inertial forces due to pressure gradients combine to determine
how easily each phase moves within the porous material, hence the concept
of relative permeability. Though the physics of pore level processes is well
understood, understanding the problem of multiphase ow based on this is
di�cult since it requires a complete description of the pore structure. For
two-phase single component systems as in steam water ows the problem is
more di�cult because of phase change. This implies that the thermodynamic
state of the uids, in the form of chemical potential, must be taken into ac-
count for a complete description of the ow regime. This is impractical for
most applications.
Relative permeability relations are usually reported as functions showing
8
the variation of the relative permeability as a function of the saturation of
the uid. In addition it is necessary to de�ne residual saturations which nor-
mally indicate the smallest saturation for a given phase to become mobile.
The curves and the residual saturations together de�ne the relative perme-
ability relations. For most cases these relations can be expressed as simple
mathematical functions (Corey, 1954; Brooks and Corey, 1964)
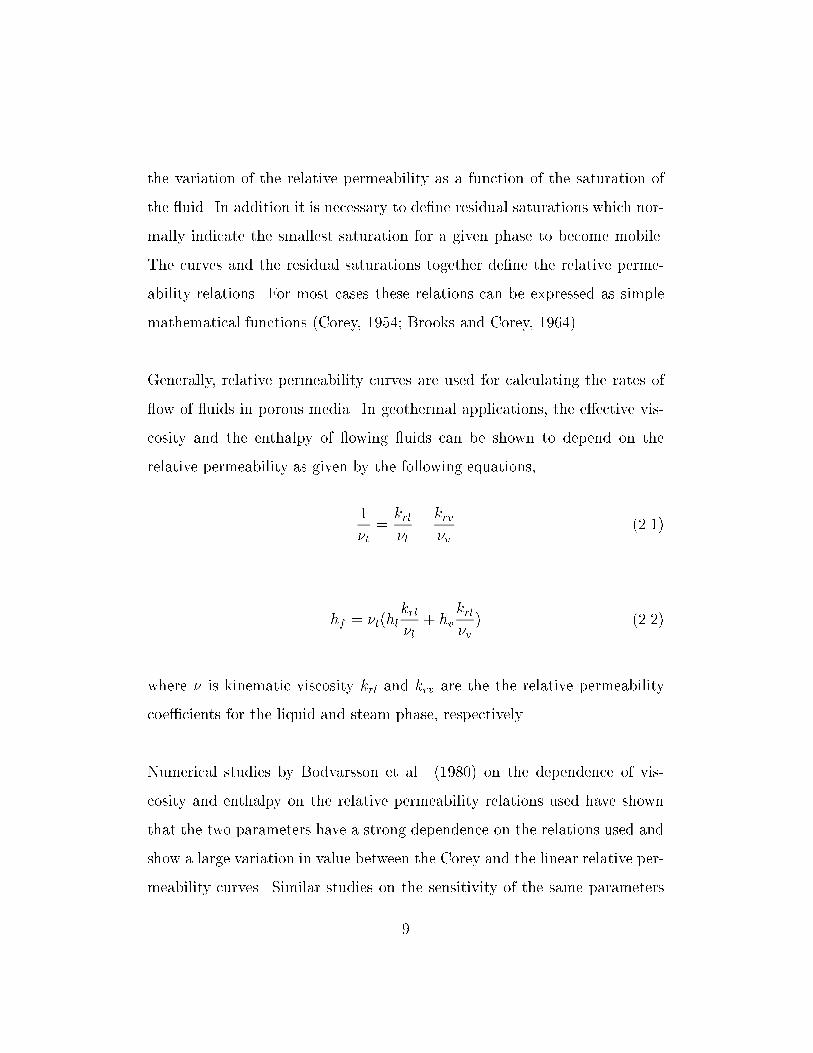
Generally, relative permeability curves are used for calculating the rates of
ow of uids in porous media. In geothermal applications, the e�ective vis-
cosity and the enthalpy of owing uids can be shown to depend on the
relative permeability as given by the following equations,
1
�t=
krl
�l+krv
�v(2.1)
hf = �t(hlkrl
�l+ hv
krl
�v) (2.2)
where � is kinematic viscosity krl and krv are the the relative permeability
coe�cients for the liquid and steam phase, respectively.
Numerical studies by Bodvarsson et al. (1980) on the dependence of vis-
cosity and enthalpy on the relative permeability relations used have shown
that the two parameters have a strong dependence on the relations used and
show a large variation in value between the Corey and the linear relative per-
meability curves. Similar studies on the sensitivity of the same parameters
9
on the value of residual saturations by Reda and Eaton (1980) have shown
that there is an equally strong dependence of e�ective viscosity and enthalpy
on the relative permeability. Thus, the use of correct relative permeability
functions and residual limits is important in the evaluation of parameters
involving the two-phase ow of water and steam.
2.2 Literature Review
Relative permeability relations reported in the past have been from two main
sources, 1) laboratory experiments performed by injecting either single or two
phase uids through small cores or models, and 2) theoretical methods using
either �eld data from well tests or production histories of the wells in pro-
ducing �elds.
Relative permeability relations derived from �eld data have generally been
obtained by matching enthalpy data (Grant, 1977; Sorey et al., 1978; Horne
and Ramey, 1978). In deriving these relations the reservoir is normally
treated as a porous medium. The enthalpy is then determined as a func-
tion of in-situ uid saturations which have to be estimated from the owing
fractions. These models generally su�er from a number of short comings due
to the assumptions used, the �rst of which is the porous medium assumption
on which the equations for solving for enthalpy are based. Most reservoirs
are known from independent data to be extensively fractured and therefore
the enthalpy transient models on which the relations are derived are only
10
approximate. Secondly, these methods calculate the e�ective relative perme-
ability relations from the e�ective viscosity as a function of the enthalpy and
saturations are calculated only indirectly from the enthalpy. This can not
be veri�ed independently. Thirdly, saturation estimates are averaged over
the entire reservoir which may have spatial variation. Finally, scatter in �eld
data require that a large set of data be collected and curve-�tting techniques
be used to obtain a reliable relation from the data. In general these relative
permeability relations are prone to error.
As discussed by Heiba et al. (1983), experiments are the most reliable method
to determine relative permeability. However, laboratory techniques su�er
from limitations imposed by boundary e�ects caused by capillary forces.
Capillarity introduces nonlinear e�ects on the pressure and saturation dis-
tribution of the wetting phase at the core exit. Thus experiments must be
designed carefully to eliminate these e�ects. Osoba et al. (1951) have given
a summary of the methods used to obtain relative permeability for two com-
ponent systems that eliminate or minimize such e�ects and that have been
used successfully in problems of oil and gas. These are reviewed below;
i) Penn State Method
In this method the sample being tested is held between two samples of sim-
ilar material and the two-phase mixture of a given composition is injected
through the set. The test sample and the other two pieces need to be in
capillary contact. The assumption is that the capillary e�ects will be lim-
ited to the two pieces external to the test material and thereby eliminate
11

the end-e�ect. Measurements of pressure and saturation can then be made
on the sample and the relative permeability can be determined. Though
this method has been used successfully in oil-water systems, it requires more
sophisticated equipment to be used for steam water ows where thermal equi-
librium is important. In addition it is not always possible to ensure capillary
continuity which would lead to errors if not recognized during experiments.
ii) Stationary Liquid Method
In this method the liquid phase is held stationary by the use of a very low
pressure gradient across the core. Under very low pressure gradients capillary
forces would dominate the ow of liquid phase and therefore the liquid phase
would be retained within the core. The permeability of the gas phase is then
determined for the given saturation of the liquid phase. By ooding the core
with increasing liquid saturation, a curve can be generated. This method
has never been applied to steam and water as the small gradients are not
easy to generate in practical situations. Furthermore injecting steam into a
two-phase system and expecting it to remain in the gas phase throughout
the period of ow across the core is not feasible.
iii) Single Core Dynamic Method
This is the method most frequently used and involves injecting both phases
simultaneously at a rate high enough to avoid the end-e�ects. The method
is e�ectively the Penn State method with only one core. Unlike the former
method the samples in this case have to be long enough and the ow rate
high enough to avoid the end-e�ects. By changing the proportions of the u-
12
ids being injected a complete relative permeability curve can be generated.
However the two requirements are rarely met and this has lead to signi�cant
errors in results that have been reported in the past (Verma, 1986).
iv) Other Methods
Other methods include the gas drive and Hassler methods. In the �rst gas is
injected into a core completely saturated by wetting phase and measurements
of owing fractions, pressure gradient and wetting phase saturations provide
a relative permeability curve. This has to be done gradually to avoid viscous
�ngering while measurements are taken at each stage. Though applicable to
oil-gas systems this method can not be used for steam and water as isother-
mal thermodynamic conditions are impossible to maintain and phase change
will occur even with small changes in pressure. In the Hassler method, cap-
illary end-e�ects are circumvented by ensuring similar end-e�ects on both
ends of the core. As in the gas drive approach this method is not readily
applicable to steam and water.
Given the di�culties with the other methods, it is not surprising that the
method used by most investigators has been the single core dynamic method
since it allows better experimental control. This was the method selected for
the experiments reported here. However this method does not completely
eliminate the end-e�ects. A review of the previous work shows that most of
them did not completely address the issue of end-e�ects.
Capillary pressure e�ects can be overcome by use of su�ciently long cores or
13
by use of high injection rates (Osoba et al., 1951). Our experience shows that
even conducting experiments at some rates referred to as high in published
literature still leaves substantial end-e�ects. Thus taking pressure gradients
across the core and averaging the saturation over the entire core still leads
to errors in computing relative permeability.
The second most common source of error has been the determination of
saturation. A number of techniques have been reported, yet each can be
shown to have di�culties of some kind when applied to steam-water ow.
One of the earliest attempts to measure relative permeability relations for
single component two-phase ow was reported by Miller (1952). The ex-
periments used propane injected as liquid at the core inlet. Propane was
allowed to ash as it moved across the core thus creating a two-phase ow
with increasing gas fraction as the uid moved further downstream. From
the pressure and temperature measurements along the core and application of
material and energy balance it was possible to determine the owing fractions
at each point and therefore to estimate the relative permeability relations.
Though the results were too general to be applicable to the ow of steam
and water, it is not clear whether capillary end-e�ects were adequately elimi-
nated. Furthermore, the calculated saturation could not be checked by other
independent means.
Among the �rst attempts to measure saturations directly were those reported
by Chen (1978) and Council (1979) using a capacitance probe. In this tech-
14
nique determined the saturation from a calibration based on the relation
between the capacitance and the saturation within the core (Council, 1980).
However the margin over which readings were obtained was small and thus
these studies did not obtain reliable relative permeability relations. Chen et
al. (1979) recommended the use of gamma-ray densitometer for measuring
saturations. Verma(1985) used a gamma-ray densitometer for experiments
using an arti�cial sand pack. Though this was an improvement over the
capacitance probe, the portion of the sample accessed by the densitometer
was small (5%). Problems with overheating of the equipment during the
experiments resulted in only a small part of the relative permeability curve
being investigated and created the impression of high residual saturations.
In addition, uid bypass between the core holder and the sand pack was
suspected to contribute to the larger steam relative permeability obtained in
the experiments.
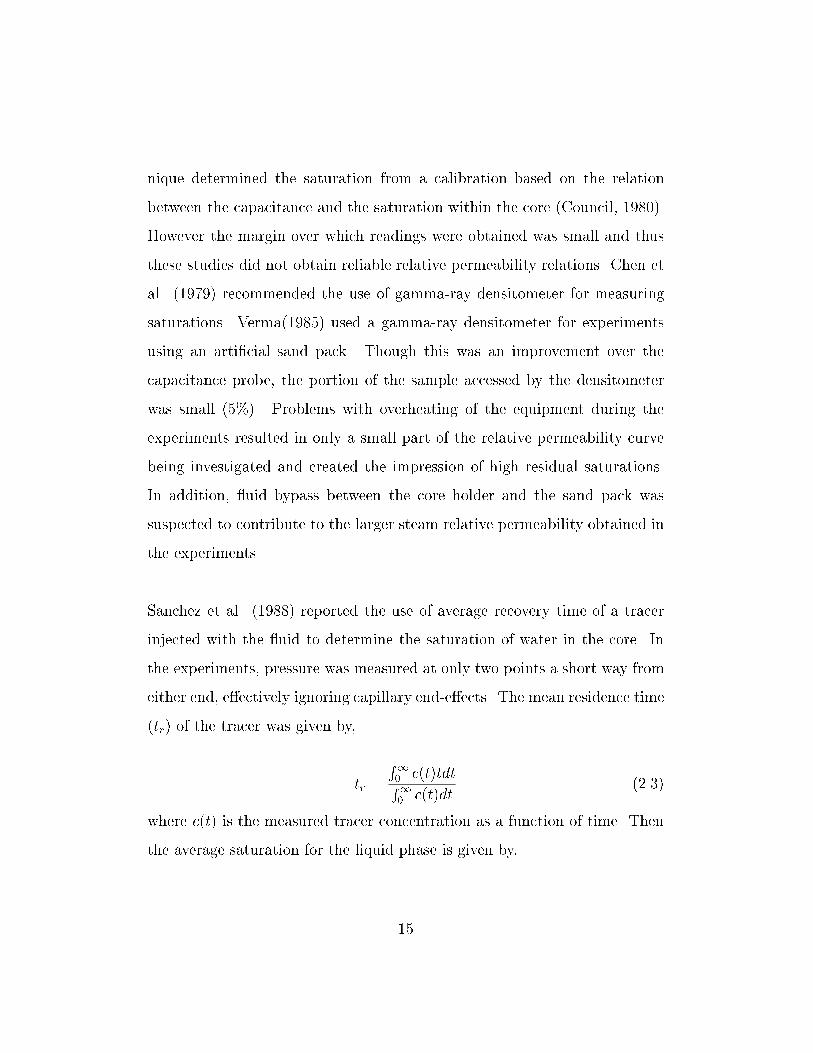
Sanchez et al. (1988) reported the use of average recovery time of a tracer
injected with the uid to determine the saturation of water in the core. In
the experiments, pressure was measured at only two points a short way from
either end, e�ectively ignoring capillary end-e�ects. The mean residence time
(tr) of the tracer was given by,
tr =
R1
0c(t)tdt
R1
0c(t)dt
(2.3)
where c(t) is the measured tracer concentration as a function of time. Then
the average saturation for the liquid phase is given by,
15
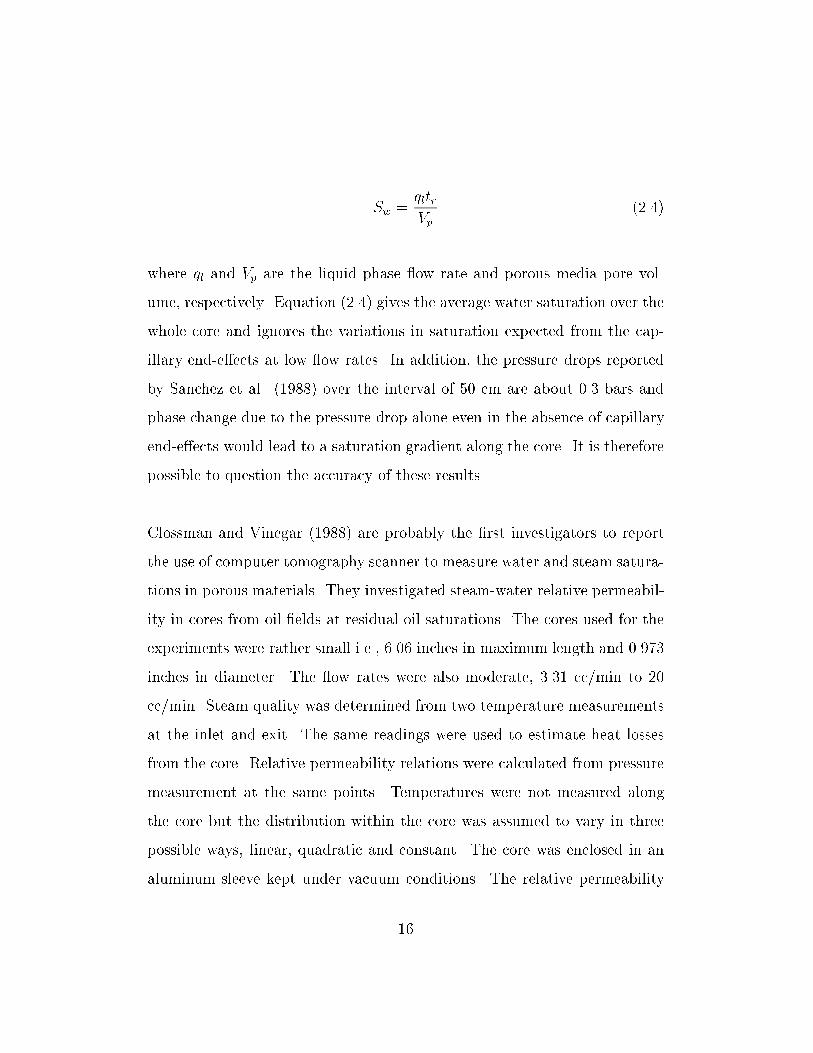
Sw =qltr
Vp(2.4)
where ql and Vp are the liquid phase ow rate and porous media pore vol-
ume, respectively. Equation (2.4) gives the average water saturation over the
whole core and ignores the variations in saturation expected from the cap-
illary end-e�ects at low ow rates. In addition, the pressure drops reported
by Sanchez et al. (1988) over the interval of 50 cm are about 0.3 bars and
phase change due to the pressure drop alone even in the absence of capillary
end-e�ects would lead to a saturation gradient along the core. It is therefore
possible to question the accuracy of these results.
Clossman and Vinegar (1988) are probably the �rst investigators to report
the use of computer tomography scanner to measure water and steam satura-
tions in porous materials. They investigated steam-water relative permeabil-
ity in cores from oil �elds at residual oil saturations. The cores used for the
experiments were rather small i.e., 6.06 inches in maximum length and 0.973
inches in diameter. The ow rates were also moderate, 3.31 cc/min to 20
cc/min. Steam quality was determined from two temperature measurements
at the inlet and exit. The same readings were used to estimate heat losses
from the core. Relative permeability relations were calculated from pressure
measurement at the same points. Temperatures were not measured along
the core but the distribution within the core was assumed to vary in three
possible ways, linear, quadratic and constant. The core was enclosed in an
aluminum sleeve kept under vacuum conditions. The relative permeability
16

values for the steam phase were close to those reported by Brooks and Corey
(1964) but those for the liquid phase were somewhat smaller.
Though it is not clear how much each of the assumptions contributed to
the �nal curves, Clossman and Vinegar (1988) did not investigate the in u-
ence of capillary end-e�ects which were bound to be signi�cant because of
the core lengths and ow rates used. Secondly, it is probably inaccurate to
assume that the temperature within the core would vary in the manner as-
sumed in their calculations. In two-phase systems, temperature and pressure
are coupled by the Clausius-Clapeyron equation and depend on the capillary
end-e�ects, giving rise to temperature variations that are highly nonlinear
and not quadratic. Thus the agreement between results obtained by the au-
thors with those obtained by Corey (1954) is might be mere coincidence.
More recently Piquemal (1994) has reported relative permeability relations
for steam and water using methods similar to those used by Verma (1986).
The porous medium was an unconsolidated material packed in a tube 250 mm
long and with an internal radius of 50 mm. Pressure and temperature were
measured at four points 50 mm apart along the core holder. The injection
rates were from 10�4 to 10�3 kg/s (6.0 to 60.0 gm/min). The experiments
were done at 1800C. Though Piquemal (1994) does not report any errors in
his measurements, it is unlikely that the experiments were able to success-
fully overcome the problems reported by Verma(1986) who used a similar
apparatus. The problems include limitations on saturation measurement by
the gamma-ray densitometer and steam by-pass between the porous medium
17
and the core holder. It is important to notice that the results reported by
Piquemal (1994) are di�erent from those obtained by Verma(1986) who ob-
served enhanced permeability of the steam phase. Piquemal(1994) obtained
results showing that steam-water ows are similar to nitrogen-water.
The foregoing review shows that there is a wide range of results that have
been reported, some of them using similar experimental apparatus. The
main reason for this has been di�culties in saturation measurement and use
of incorrect pressure gradients to compute relative permeability. The inves-
tigations reported here overcame these di�culties by using the X-ray CT
scanner for measuring saturation and by evaluating pressure gradients from
the pressures from zones with constant saturation only. In the remaining sec-
tions of this report we discuss the design and the outcome of the experiments.
18

Chapter 3
Numerical Simulation
This section discusses the theoretical and experimental aspects of this inves-
tigation. Numerical simulations were carried out to determine the optimum
dimensions of the core required to overcome capillary end-e�ects and to eval-
uate the e�ect of injection rates and gas fractions on the results. The e�ects
of heat losses on the temperature, pressure and saturation measurements
were also evaluated. In addition the numerical simulations were used to es-
timate the time required for the experiments to reach state conditions.
The STARS software was used for the numerical investigation. This pro-
gram is a multicomponent thermal simulator speci�cally designed to handle
heavy oil operations such as surfactant ooding, steam injection and in-situ
combustion in single and dual porosity media, and fractured reservoirs. The
simulator has capabilities that enable it to handle individual hydrocarbon
and hydrophilic components in ows that involve exchange of components
between phases. Three main aspects were investigated; the e�ect of the type
19
of relative permeability curves, the e�ect of ow rates and owing fractions
on pressure, temperature and saturation and the e�ect of heat losses on uid
distribution along the core and uid segregation due to the combined e�ects
of gravity and condensation.
Several methods of investigation were used. In all cases the overall dimen-
sions of the models were similar to those used for the experiments i.e, a 2.0
inch diameter and 17.0 inch long core. A permeability of 600 millidarcy was
used and a value of 20% was used for the porosity. The injection and pro-
duction points were �xed at the centers of the end plates. In each case the
parameters of interest were saturation, pressure and temperature.
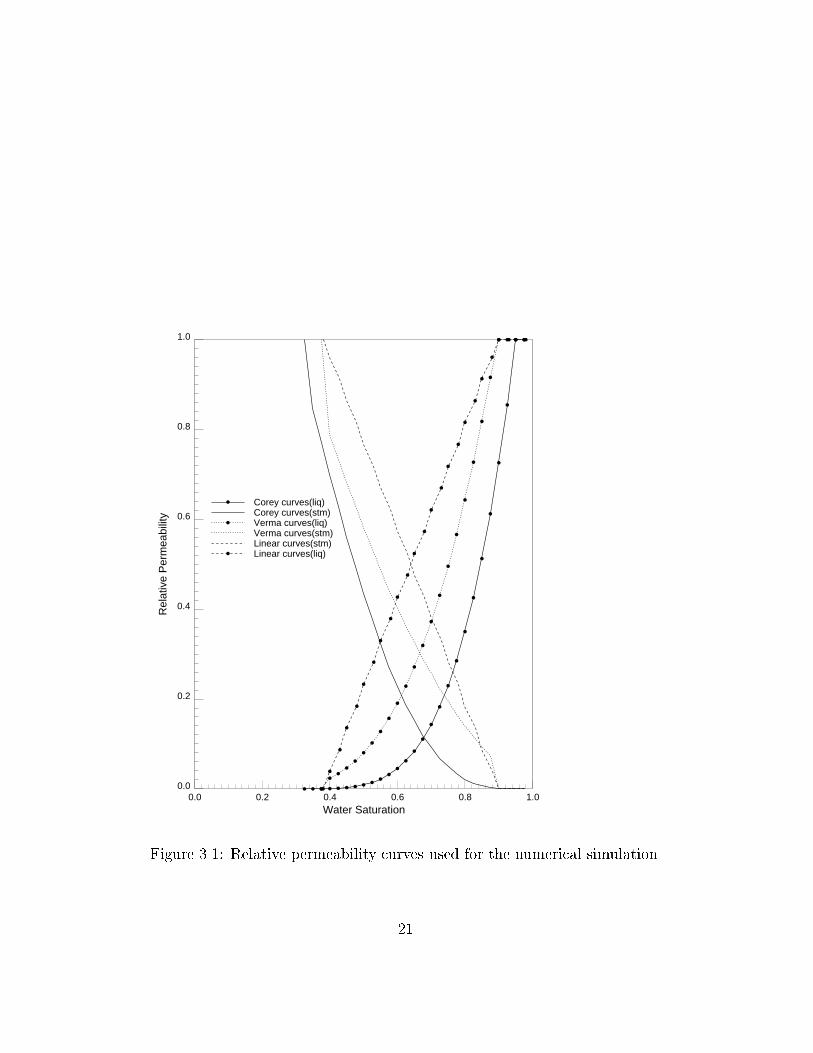
3.1 Relative Permeability Curves
The relative permeability curves used for the simulations were the widely
used Corey (1954) and Linear curves together with those derived by Verma
(1986). The curves reported by Verma(1986) were of particular interest since
these curves represent a more recent measurement and the methods used in
obtaining them were similar to those used here.
Figure 3.1 shows a plot of the three sets of curves. The Verma curves
were originally derived for a smaller range (Verma, 1986). In order to reduce
the number of variables between the curves the irreducible saturations for
the liquid phase from the curves obtained by Verma (1986) were used for all
20
0.0
0.2
0.4
0.6
0.8
1.0
Rel
ativ
e P
erm
eabi
lity
0.0 0.2 0.4 0.6 0.8 1.0Water Saturation
a a a a a a a a aaaa
a
a
a
a
a
a
a
a
a
a
a
a
a
a a
a
aaaa
a
a
a
a
a
a
a
a
a
a
a
a
a
a
a
a
a a a a
a
a
a
a
a
a
a
a
a
a
a
a
a
a
a
a
a
a
a
a
a
a a a a
a
a
a
Corey curves(liq)Corey curves(stm)Verma curves(liq)Verma curves(stm)Linear curves(stm)Linear curves(liq)
Figure 3.1: Relative permeability curves used for the numerical simulation.
21

the curves. The curves are given by the following equations,
krl = S3
e (3.1)
krv = 1:2984� 1:9832Se + 0:7432S2
e (3.2)
where
Se =Sl � Sr
Sm � Sr(3.3)
and Sm and Sr are the immobile saturation for the phases obtained by curve
�tting to be 0.895 and 0.2, respectively. These values were used in computing
the the Corey relative permeability curves which have the form,
krl = (S�l )4 (3.4)
krv = (1� S�l )2(1� (S�l )
2) (3.5)
where
S�l =(Sl � Slr)
(1� Slr � Svr)(3.6)
while Slr and Svr are the residual saturations for the liquid and vapor phases
respectively. The irreducible vapor saturation was set to 0.15 for the Verma
curve while a value of 0.05 was used for the Corey and linear curves.
In order to reproduce the end-e�ects it was necessary to incorporate a cap-
illary pressure in the simulator. These functions are well known for oil and
water under static conditions. It is not known to us whether similar curves
have been determined for steam and water. We therefore used the relations
22
0.0
0.2
0.4
0.6
0.8
1.0
Ste
am S
atur
atio
n
0 5 10 15 20 25 30 35 40 45length (cm)
Verma Relative permeability curvesCorey Relative permeability curvesX Relative permeability curves
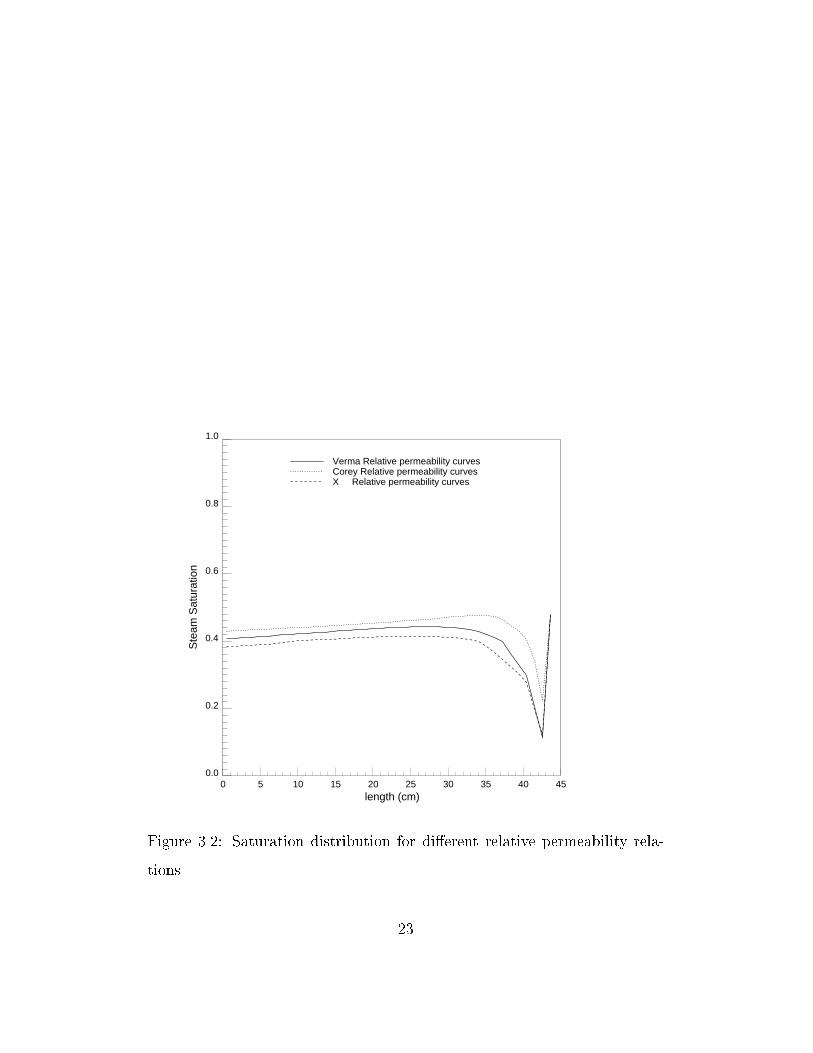
Figure 3.2: Saturation distribution for di�erent relative permeability rela-
tions.
23

for water and nitrogen given in a parametric form �Cln(Sw) (Aziz, 1995),
where C is a constant. To use these relations the core was divided into sev-
eral small blocks. The �rst and the last blocks were assigned zero capillary
pressure. In real situations the capillary pressure may be small but will al-
ways be non-zero in the injection lines.
Figures 3.2 to 3.4 show the results of pressure, temperature and satura-
tion distribution from the simulations. The total injection rate is 14 cc/min
of water and the steam quality is 0.1. In all the cases the ow was mod-
eled as adiabatic. It is clear that the linear relative permeability curves give
lower pressure drops across the core for all injection rates. They also predict
lower steam saturations. This is consistent with the higher mobility pre-
dicted (equal to unity for all saturations) for the combined ow. In all cases
the steam saturation increases marginally towards the production end until
the end-e�ects reverses the trend. This, too, is consistent with the ashing
of water into steam as the pressure declines. In all cases the capillary end-
e�ects are very strongly expressed but decrease in each case with increasing
ow rate. The results also show that it is possible to have a substantial at
saturation pro�le for modest injection rates. These curves show clearly that
the type of relative permeability used have a signi�cant in uence on the re-
sults obtained.
24

0
20
40
60
80
100
120
140
Tem
pera
ture
/Deg
rees
Cel
sius
0 5 10 15 20 25 30 35 40 45length (cm)
Verma Relative permeability curvesCorey Relative permeability curvesX Relative permeability curves
Figure 3.3: Temperature distribution for di�erent relative permeability
curves.
25

0
1
2
3
4
5
Pre
ssur
e/ b
ars
0 5 10 15 20 25 30 35 40 45length (cm)
Verma Relative permeability curvesCorey Relative permeability curvesX Relative permeability curves
Figure 3.4: Pressure distribution for di�erent relative permeability curves.
26
0.0
0.2
0.4
0.6
0.8
1.0
Ste
am S
atur
atio
n
0 5 10 15 20 25 30 35 40 45length (cm)
Injecting 10 cc/miNInjecting 15 cc/miNInjecting 20 cc/miN
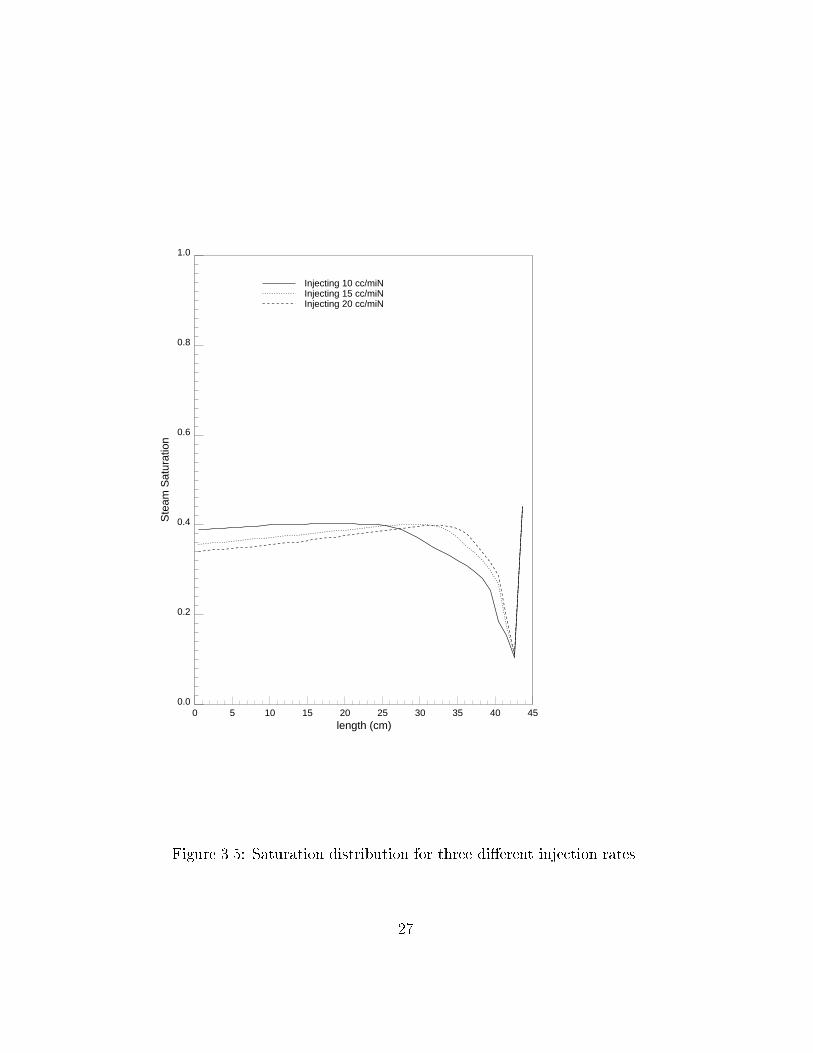
Figure 3.5: Saturation distribution for three di�erent injection rates.
27
0
20
40
60
80
100
120
140
Tem
pera
ture
/Deg
rees
Cel
sius
0 5 10 15 20 25 30 35 40 45length (cm)
injecting 10 cc/mininjecting 15 cc/mininjecting 20 cc/min
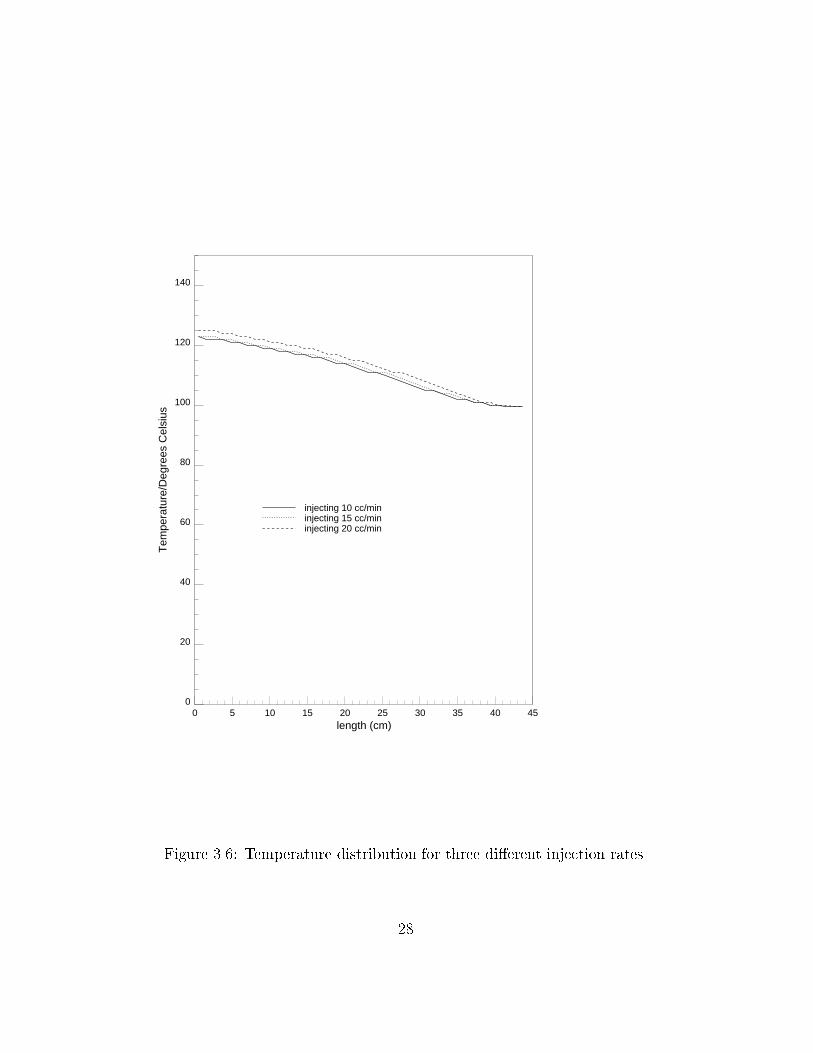
Figure 3.6: Temperature distribution for three di�erent injection rates.
28

0
1
2
3
4
5
Pre
ssur
e/ b
ars
0 5 10 15 20 25 30 35 40 45length (cm)
injecting 10 cc/mininjecting 15 cc/mininjecting 20 cc/min
Figure 3.7: Pressure distribution for three di�erent injection rates.
29

3.2 Flow Rates
The curves obtained by Verma (1986) were used to investigate the e�ect of
ow rate. In each case the steam quality was constant and equal to 0.05. The
rates were 8, 15 and 20 cc/min. Figures 3.5 to 3.7 show the saturation, pres-
sure and temperature distribution for these three ow rates. The signi�cant
factor here is the portion of the curve a�ected by the end-e�ects, which de-
crease as expected as ow rate increases. The pressure and temperature also
rise to higher values. Since the expected pressure range for the experiments
was about 3 bars these results show that the appropriate length for the core
which is not to be a�ected by end-e�ects is about eleven inches. Therefore a
core length of 17 inches was selected for the experiments.
3.3 Heat Losses
To investigate the e�ect of heat loses on uid segregation a three-dimensional
model was used. The core was divided into a 100x3x3 grid in the -x, -y and
-z directions, respectively. Insulation was added around the core as an addi-
tional layer in the -y, and -z directions. The thickness of the insulation was
set to an inch and the porosity and permeability of the insulation were set
to zero. The thermal properties in the simulator were set to those provided
by the manufacturer. The curves obtained by Verma (1986) were used to
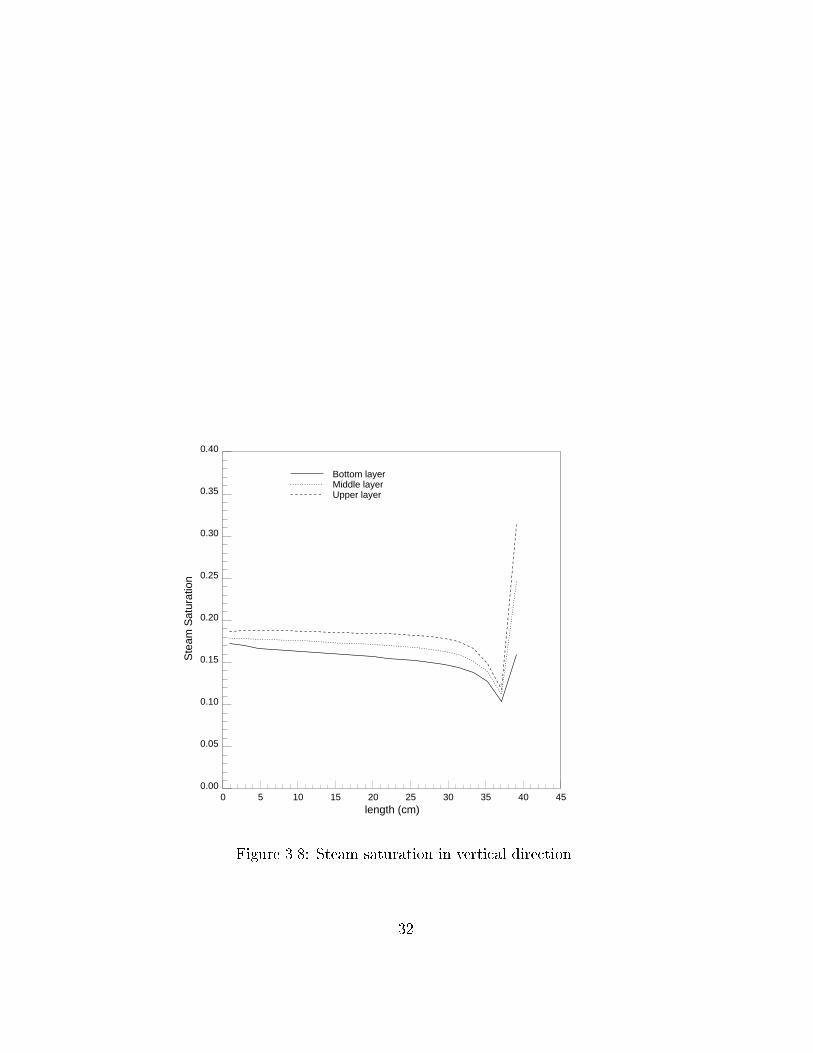
generate results shown in Figures 3.8 to 3.9 for a ow rate of 12 cc/min.
The results are for the middle three layers from the uppermost to the lowest.
As expected, the temperature and pressure are practically the same for all
30

blocks at a given cross-section except at the end blocks where there is non-
axial ow. Saturations vary only marginally in the vertical direction.
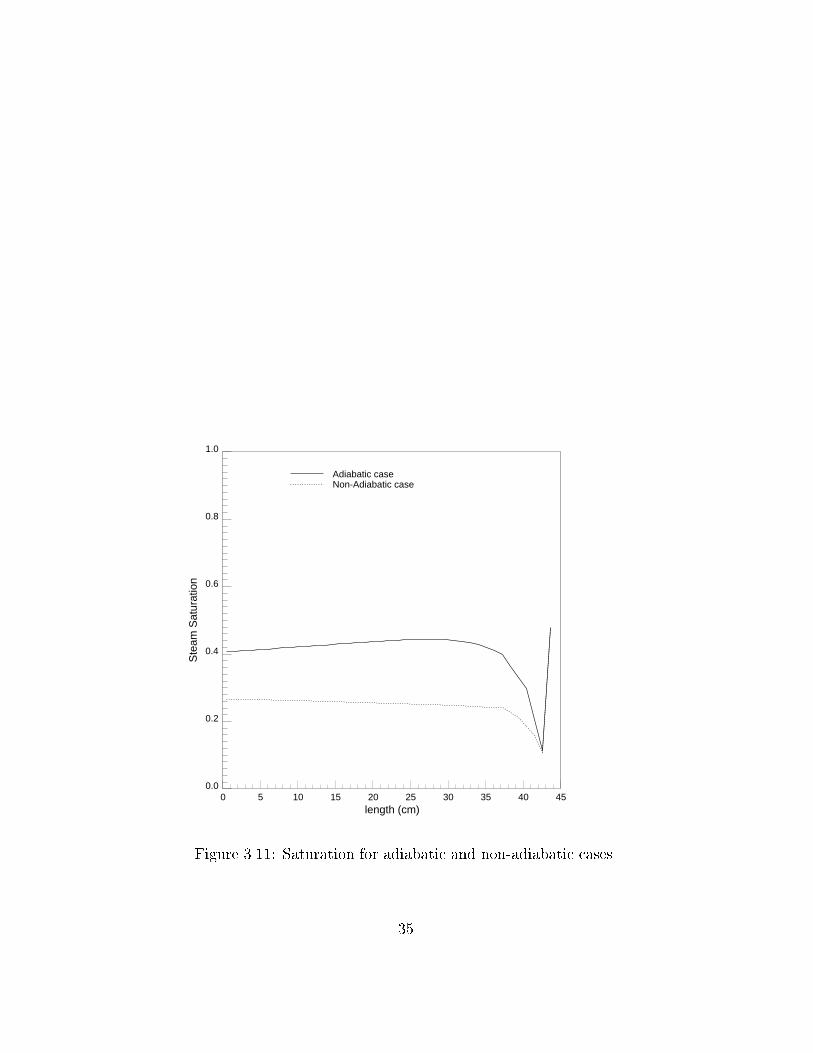
To compare the results to those without heat losses a one-dimensional
model was constructed with the same dimensions. A comparison of results
from these models are shown on Figure 3.11. There still is a at saturation
pro�le over most of the early part of the curve but the end-e�ects are more
strongly expressed and start early for non-adiabatic case. Also, the steam
saturation does not show the marginal increase observed for the adiabatic
cases but is rather simply \ at". This is an important aspect of these re-
sults since only one value of saturation was computed per section, e�ectively
making the experiments one-dimensional. Recognition of this variation in
saturation was an important con�rmation of acceptable results. This indeed
was the case.
These results indicate that heat losses will a�ect the measurements but the
main features will be una�ected. Thus a at saturation pro�le, which is re-
quired to evaluate relative permeability accurately, is still present and is of
su�cient length. However, the owing fractions will need to be determined
from the material and energy balances and the heat losses.
31
0.00
0.05
0.10
0.15
0.20
0.25
0.30
0.35
0.40
Ste
am S
atur
atio
n
0 5 10 15 20 25 30 35 40 45length (cm)
Bottom layerMiddle layerUpper layer
Figure 3.8: Steam saturation in vertical direction.
32

80
85
90
95
100
105
110
115
120
Tem
pera
ture
/Deg
rees
Cel
sius
0 5 10 15 20 25 30 35 40 45length (cm)
Bottom layerMiddle layerUpper layer
Figure 3.9: Temperature in vertical direction.
33

0.8
0.9
1.0
1.1
1.2
1.3
1.4
1.5
1.6
Pre
ssur
e/ba
rs
0 5 10 15 20 25 30 35 40 45length (cm)
Bottom LayerMiddle LayerUpper Layer
Figure 3.10: Pressure in vertical direction.
34
0.0
0.2
0.4
0.6
0.8
1.0
Ste
am S
atur
atio
n
0 5 10 15 20 25 30 35 40 45length (cm)
Adiabatic caseNon-Adiabatic case
Figure 3.11: Saturation for adiabatic and non-adiabatic cases.
35

Chapter 4
Core Holder Design
As discussed in the introduction, saturations were measured by using an X-
ray CT scanner. As a requirement, however, high density materials such as
most metals or large pieces of intermediate density materials like some forms
of plastics should not be placed in the area being scanned since they are
almost opaque to X-rays. This imposed a severe restriction on the types of
materials that could be used for making the core holder. A review of pre-
viously published literature did not reveal a core holder without any major
metal parts that had been used for this type of experiment. Several investi-
gators (e.g. Closmann and Vinegar, 1988) have reported using core holders
made of aluminum materials. They however used X-rays at higher energy
than the X-ray CT scanner equipment used here. This ruled out the use of
similar designs for the experiments. The �rst step therefore was to design
and construct a core holder that could be used in the CT scanner and that
could also withstand high temperature and pressure for extended periods of
time. In addition, the problems associated with minimizing heat losses had
36
to be considered since guard heaters, which have been previously used in
similar experiments, could not be used (Verma, 1986; Sanchez et al., 1988).
Several attempts were made before a successful core holder was ultimately
constructed. This section discusses the steps taken before a working model
was �nally achieved.
By design, the core holder was to have the following properties,
1) It must be transparent to X-rays.
2) It must be able to hold and withstand high temperature and pressure
for an extended period of time.
3) It should be possible to measure representative values of pressure and
temperature during the experiment.
4) It must be perfectly sealing to provide a ow along the core axis ( ow
is in the horizontal direction).
Property 1 implied that the choice of materials was limited to plastics and
epoxies which have low density and produce no artifacts on CT images. Prop-
erty 2 was more di�cult to meet as the range of high temperature plastics
and epoxies is limited and the physical properties under circumstances like
the ones encountered in steam-water experiments are not well known. In
particular, how the materials behave after extended periods of exposure to
water at high temperature was important. Property 3 was probably the
most important in the evaluation of the relative permeability. The parame-
ters were to be calculated at steady state conditions during which the system
37

would be in a two-phase state. In this state the temperature and pressure
are coupled by the Clausius-Clapeyron equation and therefore measuring one
implies the other. However, because of the capillary forces the pressure was
also dependent on saturation of the phase.
Given the simulation results (Figures 3.10 and 3.11), which showed simi-
lar values of temperature on the outer and inner layers, it was decided that
measuring pressure on the core surface would give accurate readings. The
thermocouples were placed at the same points.
Property 4 was necessary to ensure that there was no ow between the core
and the core holder. This, in fact, was one of the reasons for the use of a real
core rather than an arti�cial core where ow channeling has been suspected
to lead to enhanced steam ow and to give misleadingly higher relative per-
meability for the gaseous phase (Verma, 1986). Thus some form of sealing
ability was required for the core holder. It was not possible to establish which
materials met all these qualities from published data on plastics and epoxy
and the �nal design was arrived at by a combination of deliberate design and
trial and error. Following is a chronology of the various models that were
tried before the �nal working design was achieved. The purpose of reporting
unsuccessful designs is as an aid to experimenters who wish to attempt sim-
ilar experiments.
38
4.1 The Plastic and Epoxy Core Holder
In the �rst design, the core holder had an oil jacket around it to act both as an
insulator and to minimize beam hardening e�ect in the scanning area. How-
ever after di�culties in constructing a leak-free con�guration the oil jacket
was removed from the design.
The alternative design for the core holder had a simple structure that in-
volved two plastic end plugs at the ends of the core, held to the core by
high temperature epoxy, while the rest of the body was covered completely
by the same epoxy. Con�ning pressure was not intended for the core as the
outer epoxy was su�ciently thick and rigid. The plastic brand name was
known as Hydlar Z. Although rated for use at 1700C our own test showed
that the plastic crystallizes at about 1550C after a few hours and therefore
had a lower temperature rating. The front side of the plastic, the surface
facing the core, was machined into small groves radiating from the center for
an even uid distribution. The edge of the plug was raised to form a socket
in which the core would �t by leaving little room to be �lled by epoxy. The
rear side of the end plug had three holes intended originally for measuring
temperature and pressure and injecting uids. Each of these holes were �t-
ted with threaded metallic �ttings which were connected to the supply tubes.
The brand name for the epoxy we used is Duralco-4461 and is manufactured
by Cotronics Inc. of New York. This particular brand is relatively viscous
(600 centipoise) and ows if uncontained for up to a few hours after mixing.
It cures at room temperature over a 24 hour period and therefore does not
39
require any equipment to prepare at any stage. Because of its viscosity it
had to be applied onto the core in stages in order to avoid penetration into
the core body. First, a thin layer was applied over the core surface and al-
lowed to cure for 4 hours. Additional layers were applied until a layer 5 mm
thick was formed over the core. Eight pairs of 1
8inch diameter holes 2 inches
apart were then drilled into the core body. A pressure tube (plastic) and a
thermocouple were placed at each pair of holes and �xed in place with epoxy.
The core was tested at room conditions for leaks. During the tests the core
holder withstood pressures of 200 psi at room temperature. This core was
also used successfully for experiments on nitrogen and water which were rou-
tinely run at 30 psi and occasionally at 60 psig (Satik et al., 1994). However
during warm up at 700C in steam-water experiments the core failed repeat-
edly at the connection between the end plugs. Our investigations eventually
established that these failures were due to the higher thermal expansion of
the plastic end plugs whose linear thermal coe�cient of expansion is 10�4
m/C. This is about an order of magnitude higher than that for the epoxy
and the core (sandstone) both of which had comparable thermal expansion
coe�cients.
As a quick correction, the manufacturers of the epoxy suggested the use
of a exing additive that could make the epoxy more elastic thus e�ectively
increasing the thermal expansion coe�cient to about that of the plastic. Tri-
als of various proportions of the additive improved the temperature at which
the plastic parted from the core body (to about 1100 C). Apart from this
40

temperature being lower than that expected during the experiments, further
tests revealed that the exed epoxy had lower bonding capabilities and could
not withstand high pressure (>30 psi) even at room temperature conditions.
Tests on using this brand of epoxy were abandoned and similar tests on
an alternative high temperature epoxy, Duralco-4703, were conducted. This
brand of epoxy is paste like at room conditions but can remain in that state
for several days without hardening and therefore requires a three-stage heat-
ing process to cure to optimum properties. As in the previous case failures
occurred between the core and the end plugs during either the curing process
or during the cooling stage after curing. Thus this epoxy was never tested
under experimental conditions. The tests however did show that the epoxy
had stronger bonding characteristics that later proved to be very valuable.
Trials using this brand of epoxy with a exing additive showed that the epoxy
hardened very rapidly after being mixed with the additive and could not be
spread out properly on the core surface.
4.2 Ceramic End Plates
Following these two experiences, an alternative material with lower coe�-
cient of thermal expansion was sought for the end plugs. The �rst material
to be tested that also proved to be the last was a ceramic material that has
thermal expansion properties similar to the sandstone. Unlike the plastic
used originally the ceramic material has high density and therefore absorbs
X-rays. It was therefore not possible to use the socket type shape for �tting
41

the core and the end plate was machined with at faces only. The end plugs
were �xed on to the face of the core by epoxy as in the previous case but
with additional layers of epoxy at the sand face. Eight pairs of holes for
thermocouples and pressure ports were drilled and �tted with tubing as in
the previous case.
Prior to attempting complete experiments with the core trial runs in the
laboratory under conditions close to those in the real experiments were con-
ducted. After successfully heating the core to experimental conditions for
about 3 hours the core was able to take 8 gm/min of a mixture of steam
and water at about 1200C for most day before a break on the core body was
discovered. It was not possible to establish how long the core had been able
to take sustained ow since the failure occurred during the night. However
our estimates placed the time at about fourteen hours. This was encourag-
ing and two cores were prepared in a similar way for full- edged experiments.
During experiments with the �rst core it was possible to heat the core and
conduct one full equilibrium step successfully. However when the steam frac-
tion was increased with change in pressure one of the pressure ports started
leaking profusely and the experiments had to be abandoned. Further inspec-
tion of the core revealed several other smaller leaks on the body and close
to the end plugs making it clear that several aspects were still not adequate
for complete use of the design in the experiments. It was still unclear up
to this point whether the failure was due to epoxy fatigue or to improper
handling of the epoxy during the preparation or during the heating process.
42
To help establish the modes and the nature of the failures a second similar
core was used for another experiment with similar results except that this
time the failures occurred after a much longer injection period with at least
two complete steps. A closer look at the CT images for saturation distri-
butions also revealed steam channeling at the edge of the core, presumably
caused by separation between the epoxy and the core (Ambusso et al., 1996).
These issues taken together implied that though the epoxy had the correct
properties it could not endure the long periods of the tests. It is not clear to
date why this is so. Our suspicion is that the epoxy has a water absorption
property and loses its bonding capabilities with time when in contact with
hot water for a long period of time. Thus we tried the Duralco-4703 epoxy
with similar cores. The �rst test was conducted on a miniature core 5 inches
long. Since the epoxy has to be cured at high temperature it presented spe-
cial problems in preparation and some Duralco-4461 epoxy had to be used
for �xing the end plugs onto the core. A small leak was detected after more
than 16 hours of continuous injection of a two-phase mixture at pressures of
about 3 bars (30 psig). The failure was at the end plugs which were held in
place by the Duralco-4461 epoxy.
This result was a clear indicator that the Duralco-4703 epoxy was more hardy
and could endure higher temperatures and pressures for a longer period. The
next step was to use this brand of epoxy alone on a core holder. This was
done but unfortunately the epoxy developed large cracks while being cured
the second time to �t the end plugs. It was also discovered that though the
43
epoxy held on well during trials with the miniature core it had also cracked
apparently on cooling. Thus it was concluded that the epoxy, though with
better water absorption properties, was inelastic and responded badly to
thermal shock. This implied that the epoxy could not be used by itself on
the core as situations where temperature was likely to change suddenly were
numerous. A �nal change in epoxy usage was to apply the Duralco-4703 �rst
and then cover it with a thin layer of Duralco-4461. This turned out to be
the �nal solution to the epoxy selection. This design still required a number
of other changes to other features of the core holder, namely the pressure
ports and the location for the thermocouples. These are discussed in the
next section.
4.3 Final Design
As discussed in the previous section the �nal design of the core holder used
the Duralco-4703 which had a low water absorption property but was inelas-
tic and cracked when exposed to rapid thermal stress. The remedy was to
cover it in a layer of the more elastic Duralco-4461. To achieve this was still
a challenge since the pressure ports and thermocouples had to be �xed on
the core body.
The �rst step in the construction was to apply a thin layer of Duralco-4703
to the core and cure it to optimum conditions before covering it with a thick
layer of Duralco-4461. This was achieved by inserting the core, covered in
44
Duralco-4703, in a Te on sleeve sealed at one end and pouring the elastic
epoxy to cover the core completely except for the injection and production
ends. The epoxy was allowed to cure for the required time after which the
holes for the pressure ports and the thermocouples were drilled. The holes
for thermocouples were drilled on the outer layer of epoxy. Those for the
pressure ports were drilled through to the core after which tubes were �xed
by applying epoxy carefully so that the epoxy never entered into the body
of the core nor sealed the tubes.
This design proved to be better than the previous construction but failed
twice after several hours of use, each time at the pressure ports. On each
occasion the failures looked minor enough to be repairable by redrilling and
reapplying the epoxy. However attempts to dry the core for resumption of
the experiments resulted in the development of extensive cracks on the core
body. A closer look at the cracks showed that the cracks always started or
terminated at the ports drilled for the pressure tubings. This implied that
the holes acted as stress concentrators and drilling was probably the cause
of these problems. Furthermore, direct attachment of the tubes to the core
body also put a restriction on the type of tubes to be used; Te on tubes
could not be used since they are epoxy repellant.
To overcome this weakness the �nal choice was to use threaded nylon nuts to
which Swagelok pressure �ttings could be attached. The nuts were �xed on
the body of the core after the initial application of the epoxy Duralco-4703
at the designated points for pressure ports. The nuts were held on the core
45

by coating the Duralco-4461 epoxy on to one face of the nuts and allowing
it to cure. The other face of the nut was covered by a removable tape to
prevent entry of the Duralco-4461 epoxy during the subsequent application
of the core surrounding epoxy using the sleeve. The faces were cut out imme-
diately the last layer of epoxy cured but before it hardened completely and
the sealing paper removed. The correct Swagelok �ttings were then placed
with some application of epoxy to improve the sealing.
This design proved robust and was able to last for a week of pre-experiment
test without failure at pressures above 60 psig and temperatures in excess of
1400C. Parts of the core holder between the core and the end plugs failed at
a pressures of about 70 psig. This established the limiting pressure at which
the core holder could be used without failure. This pressure was twice the
value expected for the experiments. To date this design has been able to
withstand all pressures applied on all occasions and was used for the actual
experiments.
One additional modi�cation was to change the way the thermocouples were
placed by avoiding drilled holes which are potential stress concentrators. Ce-
ramic tubings were used for this purpose and had to be �xed at the same
time as the nylon nuts. These tubes performed well without failing. How-
ever the readings from the ports were always less than expected from the
pressure readings using Clausius-Clapeyron equation. This is because the
ceramic tubes were placed in the outer layer of the core holder. This will
require improvement in the future.
46

4.4 Mounting the Core
To �nally assemble the core for the experiments it was required that the tub-
ings for pressure measurement and for injection and production be connected
at the inlet and outlet. The thermocouples were connected at the assigned
places. Heat ux sensors were placed along the body starting from the injec-
tion end and uniformly spaced towards the production end. Four heat ux
sensors were used. The sensor readings were corrected for curvature of the
surface and gave the heat loss required for calculation of the owing fractions.
The entire assembly was then covered in four layers of insulation made from
ceramic blanket, forming a one inch layer around the core. The blanket was
carefully wrapped around the core with no air pockets to avoid any draught
cooling due to air circulation. For safety, plastic rods were used to hold the
end plugs in place against any blow out. The entire unit was then mounted
on to a wooden frame that was placed on the movable couch of the X-ray
CT scanner.
47

Chapter 5
Experiments and Results
5.1 General
As discussed earlier the single core dynamic method was used for the mea-
surement of the relative permeability. This required that a two-phase mixture
be injected into the core. By changing the owing fractions and letting the
system adjust itself to steady state conditions the relative permeability rela-
tions were determined from the knowledge of the owing fractions and the
measured pressures and temperatures.
To determine the owing fractions it is necessary that the enthalpy of the
injected uid be known accurately. Thus it is important that the injected
fractions of the components in the core be known before injection and the
phase change accompanying pressure drop be considered. Though it has been
suggested that in the porous media the process of boiling and phase change
may require more energy due to capillary forces (Udell, 1980), experiments
48

by Miller (1952) with light gasoline showed that the temperature and pres-
sure follow values close to those for at surface thermodynamics. For this
reason steam table values were used to compute owing proportions in the
core.
Two methods were used to inject uids of predetermined enthalpy. The
�rst was to inject a two-phase mixture that was heated to high temperature
but always keeping the pressure above saturation so that the uid always
remained in the liquid phase upstream of a throttle valve set to release uid
only after some threshold pressure has been reached. The enthalpy of the
two-phase mixture would be the same as that of the liquid water corrected
for heat losses along the line, the kinetic energy being negligible in this case.
This method is a modi�cation of that used by Miller (1951) and Arihara
(1976) who injected the uid as a single phase into the core. For these exper-
iments this method was used for injection of uid at low enthalpy to produce
low steam fractions and proved useful since steam table values could be used
to determine the enthalpy given either the temperature or the pressure.
The second method was to mix streams of steam and water. Due to dif-
�culty in keeping both streams close to saturation, steam was superheated
by a few degrees and liquid water was kept a few degrees below boiling point.
This too enabled the use of steam table values for computation of fractions.
This approach was used at high steam fractions.
The temperature logging unit consisted of a thermometer which could take
49
up to twelve readings simultaneously. This unit was connected to a computer
for storing and displaying the temperature data. The thermometer gathered
readings from the eleven J-type thermocouples, eight of which were located
on the core while the other three were on the steam generator, the water line
and the mixing point for the steam and water at the injection end of the core.
The pressure measuring unit consisted of eleven transducers each with its
own read-out screen. Some of the transducers were connected to a chart
recorder. This enabled direct monitoring of pressure which together with the
temperature readings were used to determine when steady state conditions
had been reached.
5.2 Experiments
After assembling the core and the auxiliaries, the experiment was initiated
by �rst determining the porosity of the core. This was done by taking X-ray
CT scans of the core at various locations while it is dry and when fully sat-
urated with water. A steady stream of carbon dioxide was passed through
the core for several hours after the initial scan, referred to as the dry scan,
before injecting a steady stream of water at low rate (5 cc/min) for twelve
hours. A second scan, the wet scan, was then conducted. By analyzing these
two sets of images at every point scanned it was possible to determine the
porosity of the core, which was found to be 20% for all points. These scans
also revealed that the core had a few vugs identi�ed as points with higher
50

Table 5.1: Permeability at di�erent ow rates
Rate Pressure Pressure Permeability
cc/min psi psi md
10 7.8 6.5 944
15 10.2 8.5 1082
20 13.1 10.8 1102
porosity from the bar scale.
After the porosity distribution had been determined the absolute permeabil-
ity was determined by owing water at di�erent ow rates and measuring
pressure along the core. Three rates were used and the results are summa-
rized in the Table 5.1. The results were taken after an hour of pumping. The
readings show that there is a small dependence of permeability on injection
rate. The range is somewhat small and it is not clear whether this variation
is due to other parameters.
After determining the absolute permeability, the core was brought to ex-
perimental conditions by injecting hot water. This was done in stages to
avoid problems of rapid thermal expansion and shock. These heating stages
at low ow rates provided an additional opportunity to check the permeabil-
ity of the core at higher temperatures. The values were found to be within
the range of those measured at room conditions giving credence to the as-
sumption that permeability does not change with temperature.
51
Once the temperature for the experiments had been reached, the core was
allowed to attain thermal equilibrium before readings were taken. For the
�rst four steps only the water line was used. The steam fraction was adjusted
by changing the injection temperature and the ow rate. For the subsequent
�ve steps both the steam and water lines were used.
These experiments were aimed at determining the drainage relative perme-
ability curves and were conducted in steps of increasing steam saturation.
Between the steps this was achieved by increasing the injection temperature
and reducing ow rates for the steps where only water was injected. For
the steps where both water and steam were injected this was achieved by
increasing the steam fraction and reducing the water.
In practice a number of other variables made perfect control of injection
temperature and fractions di�cult. This was because the steam generators
took time to reach thermal equilibrium each time the ow rate or tempera-
ture was changed. As a result the steam fractions being injected were initially
either less than or more than intended for the next step. This was the same
when water ow rate was changed. In addition the pressures within the core
body were limited to values that did no surpass the limit determined in the
laboratory in the pre-experiments. This might have a�ected some of the
drainage features of the results.
Steady state conditions were recognized by the constant values of tempera-
52

ture and pressure. Typically this took three to �ve hours, though the readings
reported here were taken after at least eight hours. Once a steady state had
been con�rmed, the readings of temperature and pressure were recorded to-
gether with the voltage measurements of the heat ux sensors. The X-ray
CT scans were then taken at locations where the the dry and wet scans. had
been taken. These scans were then processed into images using the software
ct2tif.exe which generated the �les with the density pro�le of the images.
These pro�les were then processed with the dry and wet scans to give the
saturations at each point.
The saturation pro�les presented in this report were from average values
over the entire core surface. To determine whether the distribution was uni-
form each image had to be examined. In general all the images showed very
uniform saturations for most sections for all ow rates.
5.3 Analysis
The data collected during the experiments were reviewed for consistency.
This was done by evaluating the data for application of the results to general
ow situations of steam and water ow in porous media. We also compared
the data to the simulation predictions.
Dry Scans
In general all the images gave an average porosity of 20.0 � 0.5 %, which
is very acceptable for a �eld sample like the core that was used for the ex-
53
periments. In spite of this uniform value some images had regions of local
variations in porosity. Figure 5.1 shows selected images of the dry core. Some
of the images show zones with di�erent porosity. It is not clear whether the
anomalous zones are due to larger pores or due to a di�erent packing of sand
grains. Otherwise, most of the core is very close to the average porosity.
This core can therefore be considered as a close approximation to a uniform
porous medium. The regions of nonuniform porosity such as those with vugs
provided the a useful check for repeatability of the locations of the images.
Saturation
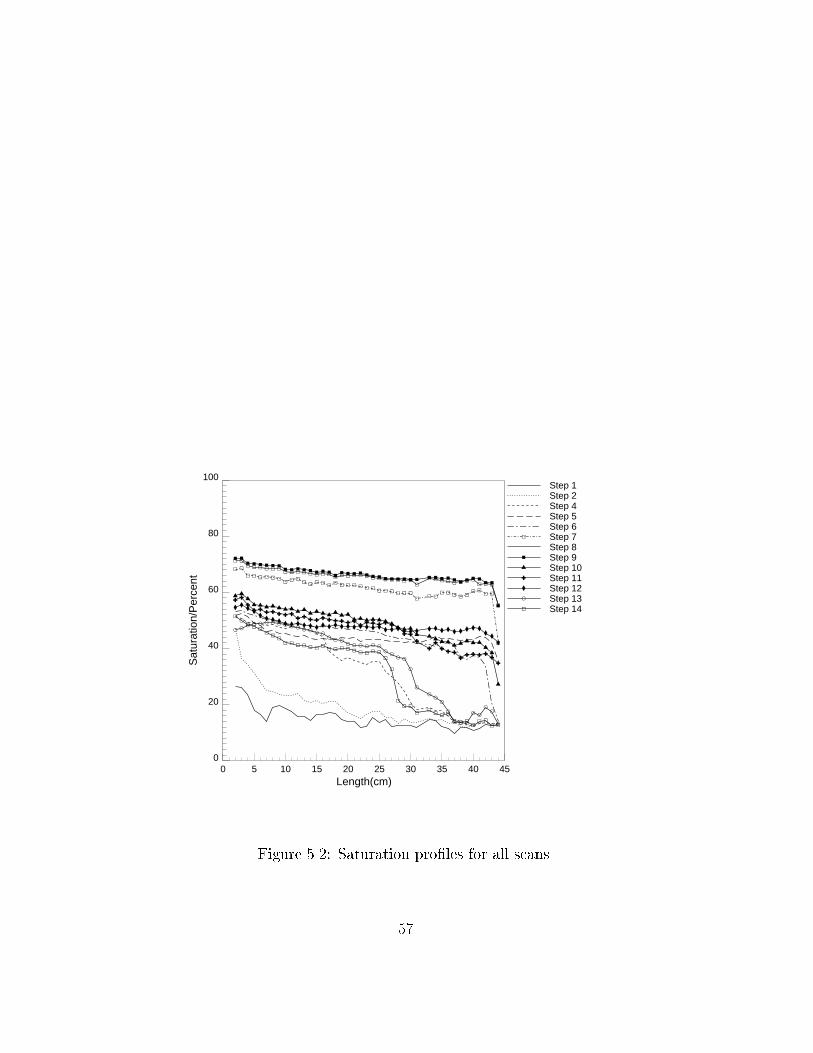
Figure 5.2 shows a plot of all the saturation pro�les obtained during the ex-
periments. In general all saturations show a trend of decreasing values from
the injection end to the production end which is what is expected from the
numerical simulation of the non-adiabatic case. The �rst and second steps of
injection show a few irregular trends at 17 cm and at 25 cm from the injection
point. These trends are also repeated to a lesser degree at the same points
at higher saturations. These anomalies are probably due to inhomogeneities
in permeability or porosity. These are however minor and the saturations
still re ect the general trend. In addition, the values of saturation are never
really constant but change gradually. Thus the at saturation pro�les are
not always at. However the values change very little over most of the core
length and can be averaged over an interval to a representative value. In
addition, from previous experience with other experiments (e.g oil and wa-
ter) relative permeability typically changes monotonically with saturation by
small amounts. Therefore relative permeability computed over regions where
54

Figure 5.1: Selected images from the dry scan.
55
saturations vary by less than �2% can be considered to be constant.
The saturation pro�les reveal a number of other interesting features. The
capillary end-e�ects are observed for low steam ow rates with high steam
fraction. This can be seen for steps that are di�erent in rates but have the
same steam fractions (e.g. Steps 4 and 5). This supports some of the results
obtained from the simulation where the end-e�ect is very strong for small
ow rates.
Heat Losses
Heat losses on the core body were measured by using heat ux sensors. These
sensors are made up of thermopile which magni�es the current created by the
individual thermocouples. In general the heat loss is highest on the injection
end of the core and decreases towards the production end of the core. This
is expected since the temperature pro�les decrease in the same direction. In
addition, the heat losses show dependence on the body temperature. These
are small since the experiments were conducted within a narrow temperature
range.
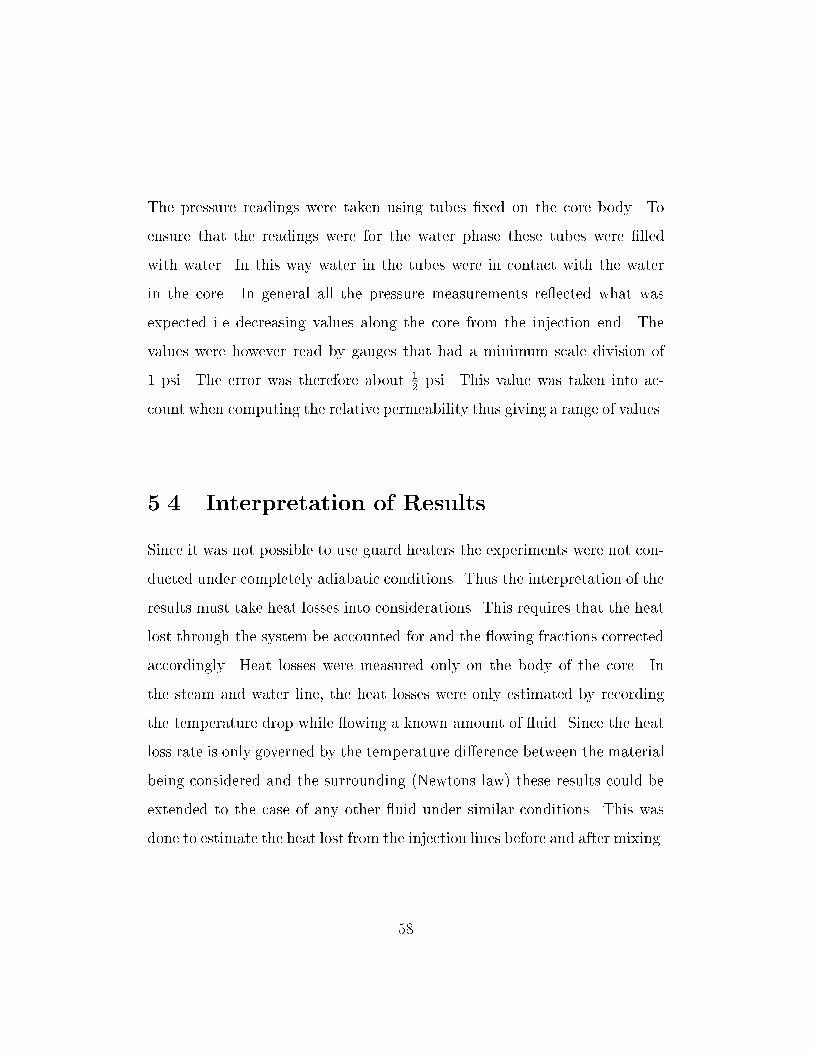
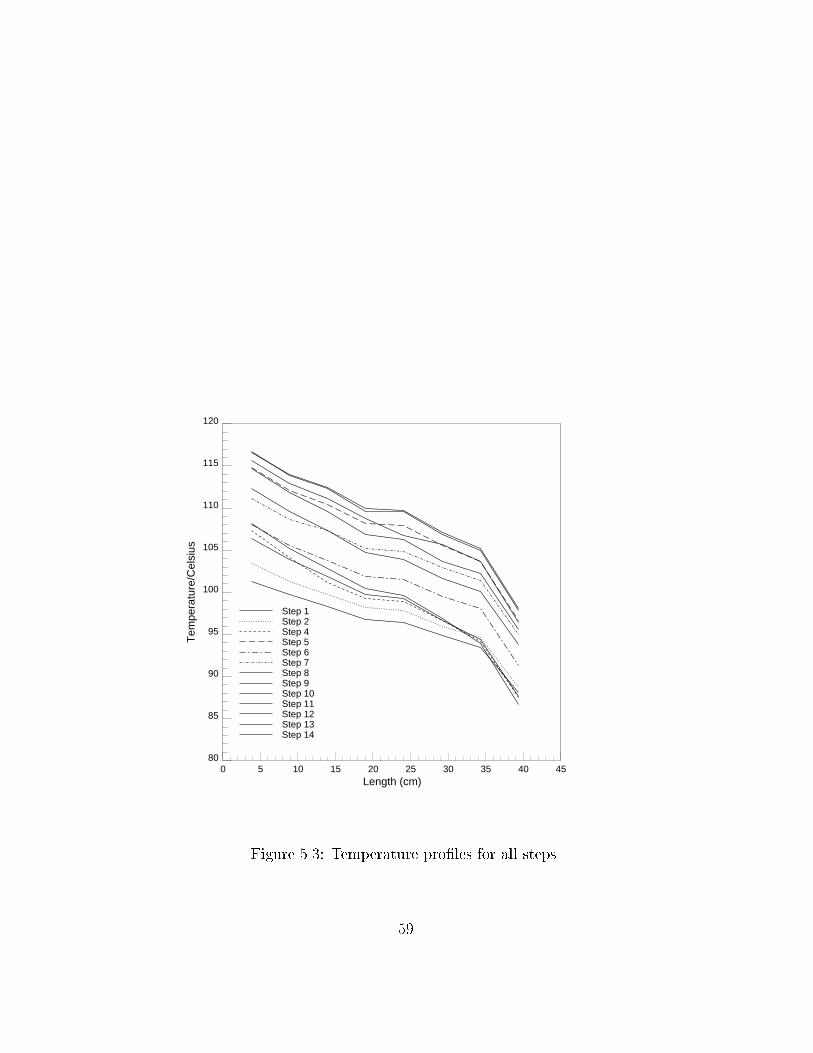
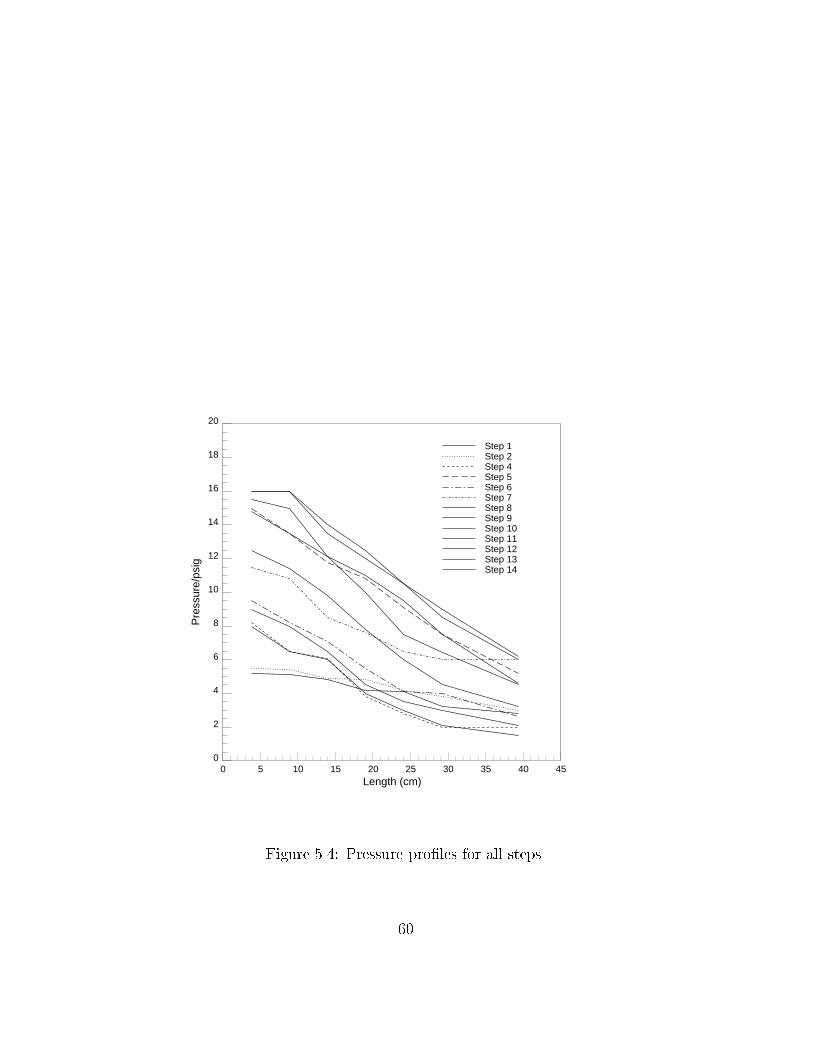
Temperature and Pressure
Figures 5.3 and 5.4 show steady state temperature and pressure pro�les re-
spectively for the injection steps. As described in chapter 4 the thermocou-
ples were inserted in ceramic tubes within the outer most layer of the epoxy.
Thus the thermocouples did not make direct contact with the core. This led
to lower temperature readings than expected.
56
0
20
40
60
80
100
Sat
urat
ion/
Per
cent
0 5 10 15 20 25 30 35 40 45Length(cm)
gg
gggggggg
ggggggggggggggggggg
g ggggggg
gggg
g
gggggggg
gggggggggggggggggggggg
ggggggggggg
g
bbbbbbbb
bbbbbbbbbbbbbbbbbbbbbb bbbbbbb
bbbb
b
ccccccccccccccccccc
cccccccccc
c cccccc
ccccc
c
dd
dddddddd
ddddddddddddddddddd
d
ddddd
dddddd
d
eeeeeeeeeeeeeeeeeeeeeeeeeeeeee eeeeeee
eeeee
fffffffffffffff
fffffffff
ffff
f
ffff
f
fff
ff
ff
f
ggggg
ggggggggggggggggggg
g
g
ggg
g gggg
gggggg
gg
g
b
c
d
e
f
g
Step 1Step 2Step 4Step 5Step 6Step 7Step 8Step 9Step 10Step 11Step 12Step 13Step 14
Figure 5.2: Saturation pro�les for all scans.
57
The pressure readings were taken using tubes �xed on the core body. To
ensure that the readings were for the water phase these tubes were �lled
with water. In this way water in the tubes were in contact with the water
in the core. In general all the pressure measurements re ected what was
expected i.e decreasing values along the core from the injection end. The
values were however read by gauges that had a minimum scale division of
1 psi. The error was therefore about 1
2psi. This value was taken into ac-
count when computing the relative permeability thus giving a range of values.
5.4 Interpretation of Results
Since it was not possible to use guard heaters the experiments were not con-
ducted under completely adiabatic conditions. Thus the interpretation of the
results must take heat losses into considerations. This requires that the heat
lost through the system be accounted for and the owing fractions corrected
accordingly. Heat losses were measured only on the body of the core. In
the steam and water line, the heat losses were only estimated by recording
the temperature drop while owing a known amount of uid. Since the heat
loss rate is only governed by the temperature di�erence between the material
being considered and the surrounding (Newtons law) these results could be
extended to the case of any other uid under similar conditions. This was
done to estimate the heat lost from the injection lines before and after mixing.
58
80
85
90
95
100
105
110
115
120
Tem
pera
ture
/Cel
sius
0 5 10 15 20 25 30 35 40 45Length (cm)
Step 1Step 2Step 4Step 5Step 6Step 7Step 8Step 9Step 10Step 11Step 12Step 13Step 14
Figure 5.3: Temperature pro�les for all steps.
59
0
2
4
6
8
10
12
14
16
18
20
Pre
ssur
e/ps
ig
0 5 10 15 20 25 30 35 40 45Length (cm)
Step 1Step 2Step 4Step 5Step 6Step 7Step 8Step 9Step 10Step 11Step 12Step 13Step 14
Figure 5.4: Pressure pro�les for all steps.
60
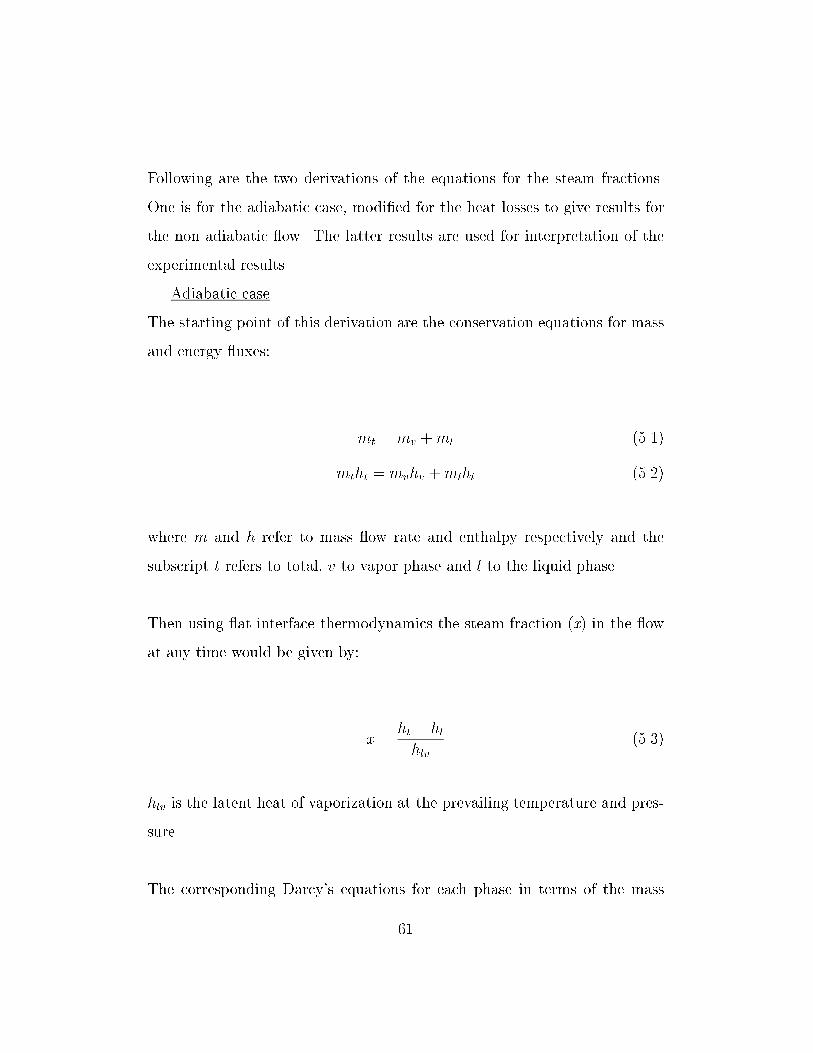
Following are the two derivations of the equations for the steam fractions.
One is for the adiabatic case, modi�ed for the heat losses to give results for
the non adiabatic ow. The latter results are used for interpretation of the
experimental results .
Adiabatic case
The starting point of this derivation are the conservation equations for mass
and energy uxes:
mt = mv +ml (5.1)
mtht = mvhv +mlhl (5.2)
where m and h refer to mass ow rate and enthalpy respectively and the
subscript t refers to total, v to vapor phase and l to the liquid phase.
Then using at interface thermodynamics the steam fraction (x) in the ow
at any time would be given by:
x =ht � hl
hlv(5.3)
hlv is the latent heat of vaporization at the prevailing temperature and pres-
sure.
The corresponding Darcy's equations for each phase in terms of the mass
61
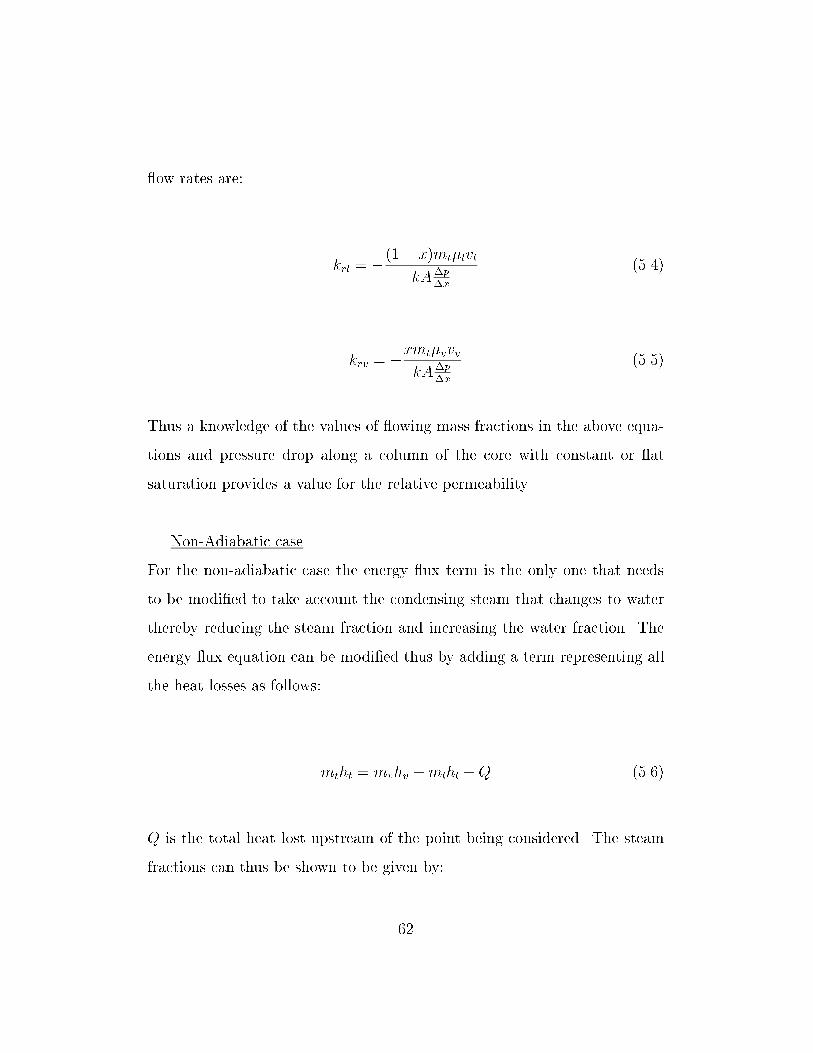
ow rates are:
krl = �(1� x)mt�lvl
kA�p
�x
(5.4)
krv = �xmt�vvv
kA�p
�x
(5.5)
Thus a knowledge of the values of owing mass fractions in the above equa-
tions and pressure drop along a column of the core with constant or at
saturation provides a value for the relative permeability.
Non-Adiabatic case
For the non-adiabatic case the energy ux term is the only one that needs
to be modi�ed to take account the condensing steam that changes to water
thereby reducing the steam fraction and increasing the water fraction. The
energy ux equation can be modi�ed thus by adding a term representing all
the heat losses as follows:
mtht = mvhv +mlhl +Q (5.6)
Q is the total heat lost upstream of the point being considered. The steam
fractions can thus be shown to be given by:
62
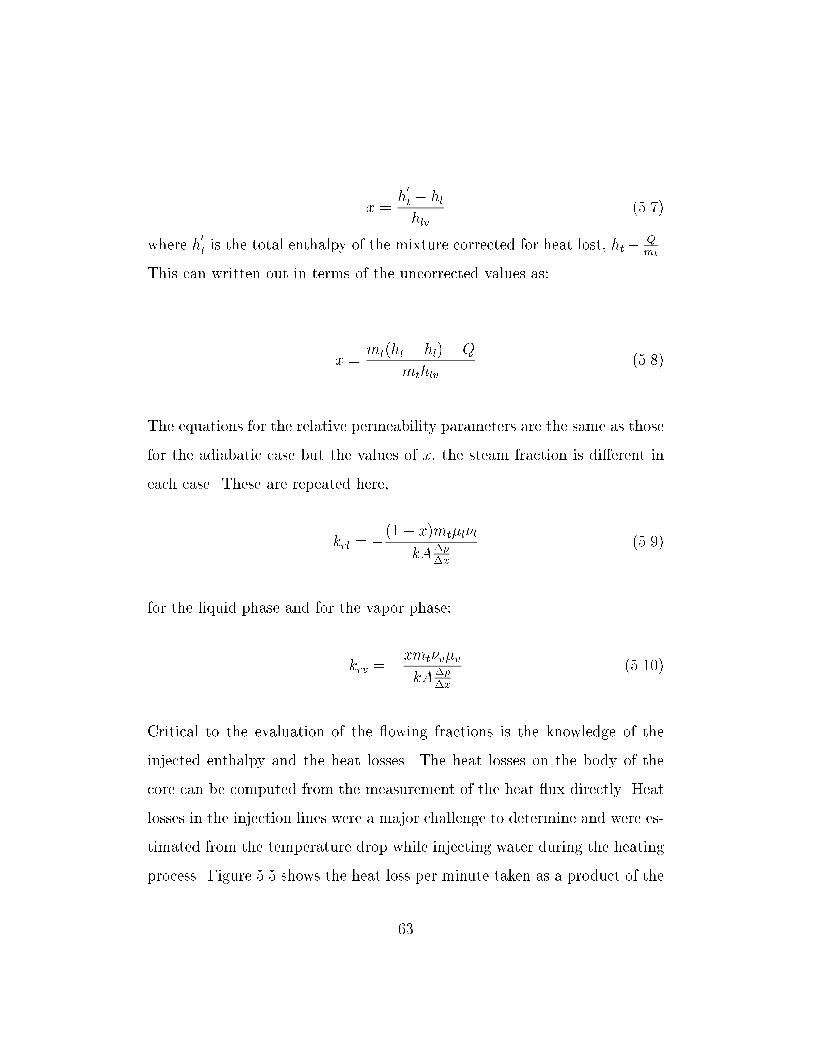
x =h
0
t � hl
hlv(5.7)
where h0
t is the total enthalpy of the mixture corrected for heat lost, ht�Q
mt
.
This can written out in terms of the uncorrected values as:
x =mt(ht � hl)�Q
mthlv(5.8)
The equations for the relative permeability parameters are the same as those
for the adiabatic case but the values of x, the steam fraction is di�erent in
each case. These are repeated here,
krl = �(1� x)mt�l�l
kA�p
�x
(5.9)
for the liquid phase and for the vapor phase:
krv = �xmt�v�v
kA�p
�x
(5.10)
Critical to the evaluation of the owing fractions is the knowledge of the
injected enthalpy and the heat losses. The heat losses on the body of the
core can be computed from the measurement of the heat ux directly. Heat
losses in the injection lines were a major challenge to determine and were es-
timated from the temperature drop while injecting water during the heating
process. Figure 5.5 shows the heat loss per minute taken as a product of the
63
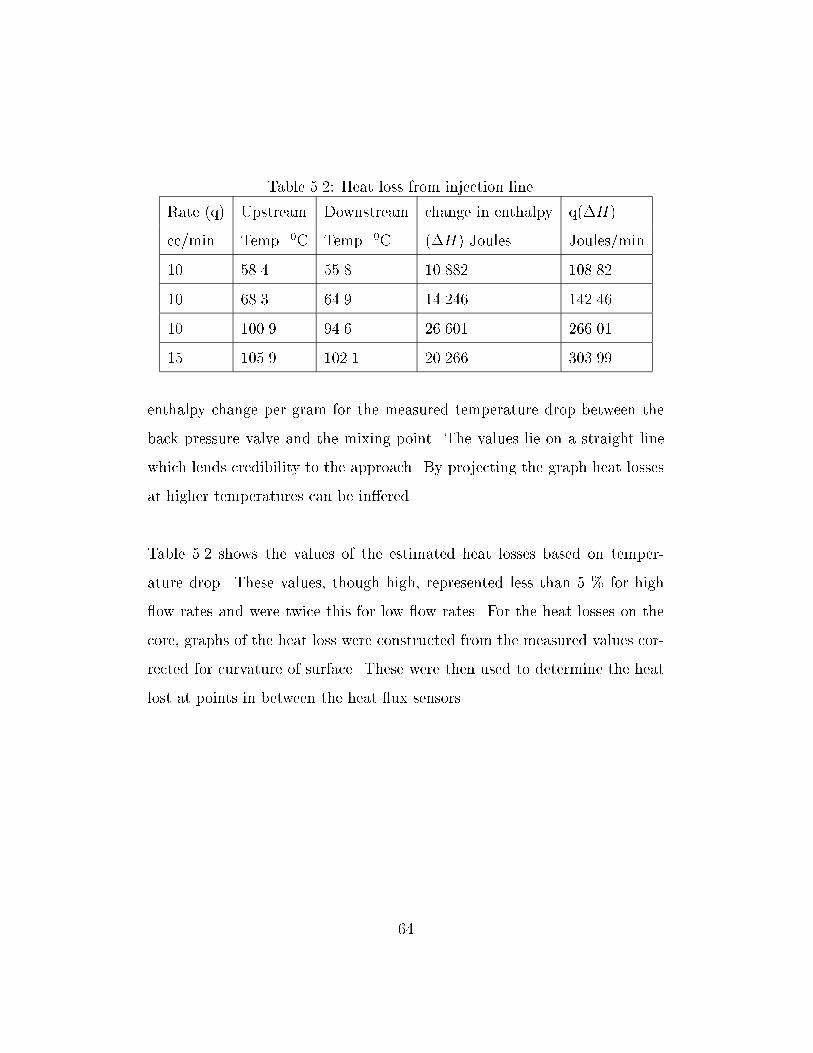
Table 5.2: Heat loss from injection line.
Rate (q) Upstream Downstream change in enthalpy q(�H)
cc/min Temp. 0C Temp. 0C (�H) Joules Joules/min
10 58.4 55.8 10.882 108.82
10 68.3 64.9 14.246 142.46
10 100.9 94.6 26.601 266.01
15 105.9 102.1 20.266 303.99
enthalpy change per gram for the measured temperature drop between the
back pressure valve and the mixing point. The values lie on a straight line
which lends credibility to the approach. By projecting the graph heat losses
at higher temperatures can be in�ered.
Table 5.2 shows the values of the estimated heat losses based on temper-
ature drop. These values, though high, represented less than 5 % for high
ow rates and were twice this for low ow rates. For the heat losses on the
core, graphs of the heat loss were constructed from the measured values cor-
rected for curvature of surface. These were then used to determine the heat
lost at points in between the heat ux sensors.
64
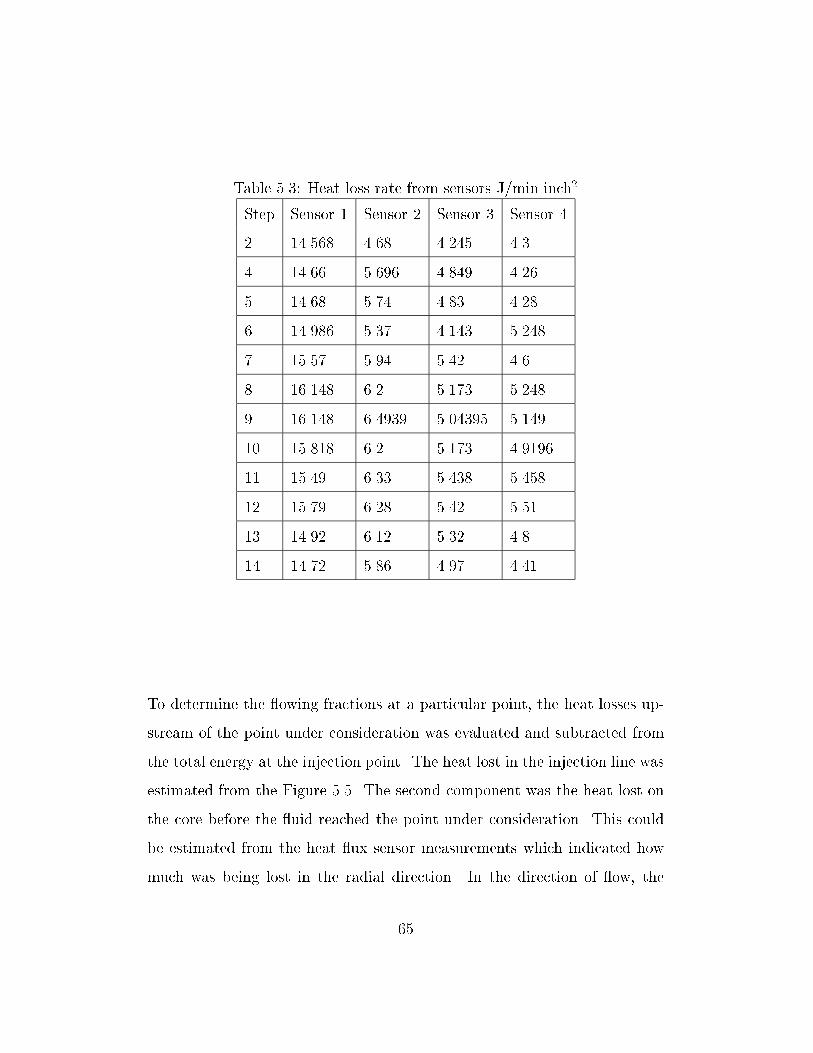
Table 5.3: Heat loss rate from sensors J/min inch2
Step Sensor 1 Sensor 2 Sensor 3 Sensor 4
2 14.568 4.68 4.245 4.3
4 14.66 5.696 4.849 4.26
5 14.68 5.74 4.83 4.28
6 14.986 5.37 4.143 5.248
7 15.57 5.94 5.42 4.6
8 16.148 6.2 5.173 5.248
9 16.148 6.4939 5.04395 5.149
10 15.818 6.2 5.173 4.9196
11 15.49 6.33 5.438 5.458
12 15.79 6.28 5.42 5.51
13 14.92 6.12 5.32 4.8
14 14.72 5.86 4.97 4.41
To determine the owing fractions at a particular point, the heat losses up-
stream of the point under consideration was evaluated and subtracted from
the total energy at the injection point. The heat lost in the injection line was
estimated from the Figure 5.5. The second component was the heat lost on
the core before the uid reached the point under consideration. This could
be estimated from the heat ux sensor measurements which indicated how
much was being lost in the radial direction. In the direction of ow, the
65
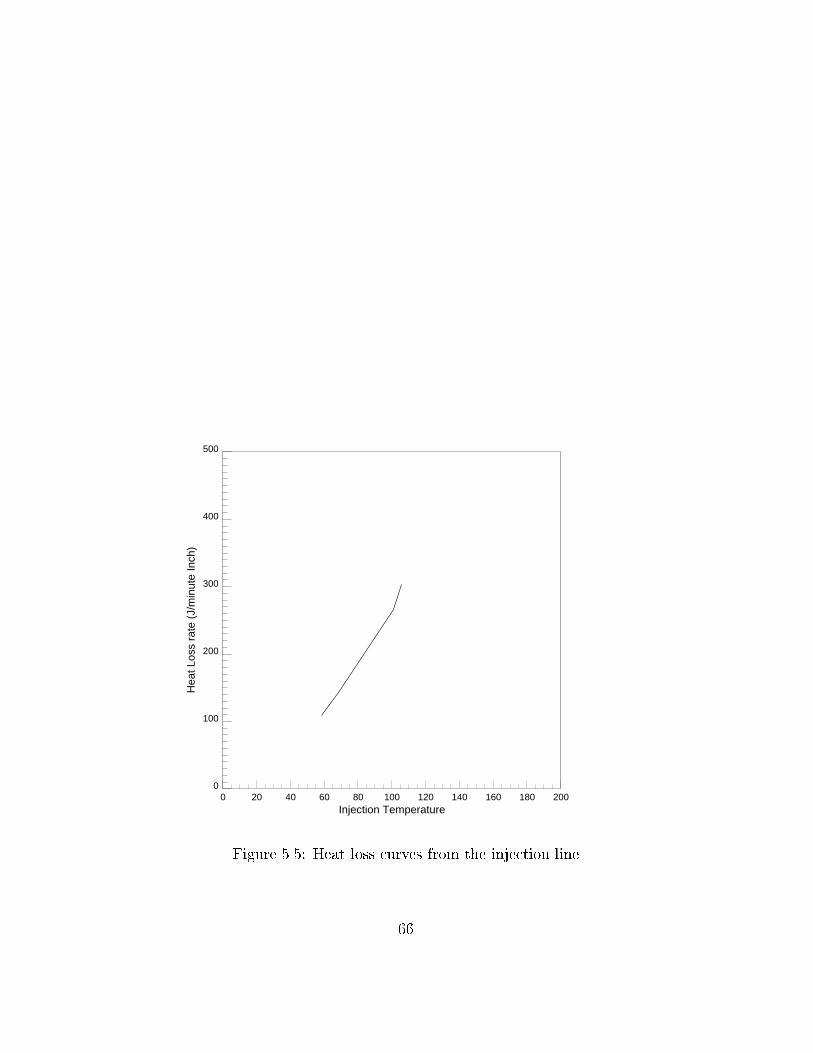
0
100
200
300
400
500
Hea
t Los
s ra
te (
J/m
inut
e In
ch)
0 20 40 60 80 100 120 140 160 180 200Injection Temperature
Figure 5.5: Heat loss curves from the injection line
66
temperature gradient also leads to conductive heat loss. This component is
negligibly small compared to heat lost in the radial direction and was ne-
glected in the computations.
To use the heat loses from the heat ux sensors, it was found convenient
to convert the readings into graphs that gave the cumulative heat lost as the
uid moved along the core. This was done for each set of measurements and
the results are plotted on Figure 5.6.
Thus to compute the owing fractions, Equations 5.8-5.10 were used after Q
had been calculated from the summation of the heat lost on the body and the
heat lost on the line. These were then converted into volumetric ow rates for
the prevailing temperature and pressure. Since the pressure changed along
the core and therefore the speci�c volume of steam, the volumetric ow rate
was computed for all the points along the core and the average value over
the interval used. The volumetric ow rates were surprisingly similar and
generally di�ered by no more than 2 % over 2.0 inch intervals.
The next parameter of interest was the temperature dependent viscosity
particularly for water which varied between 252 and 211 x 10�6 kg
ms. The
arithmetic mean of the values at the two end points was used for a given
interval. A �nal correction to the results was to include the errors due to
pressure measurements. This was done for all the intervals. The error as-
sumed in each case was � 1.0 psi. Table 5.4 shows a summary of the essential
data from all the steps.
67
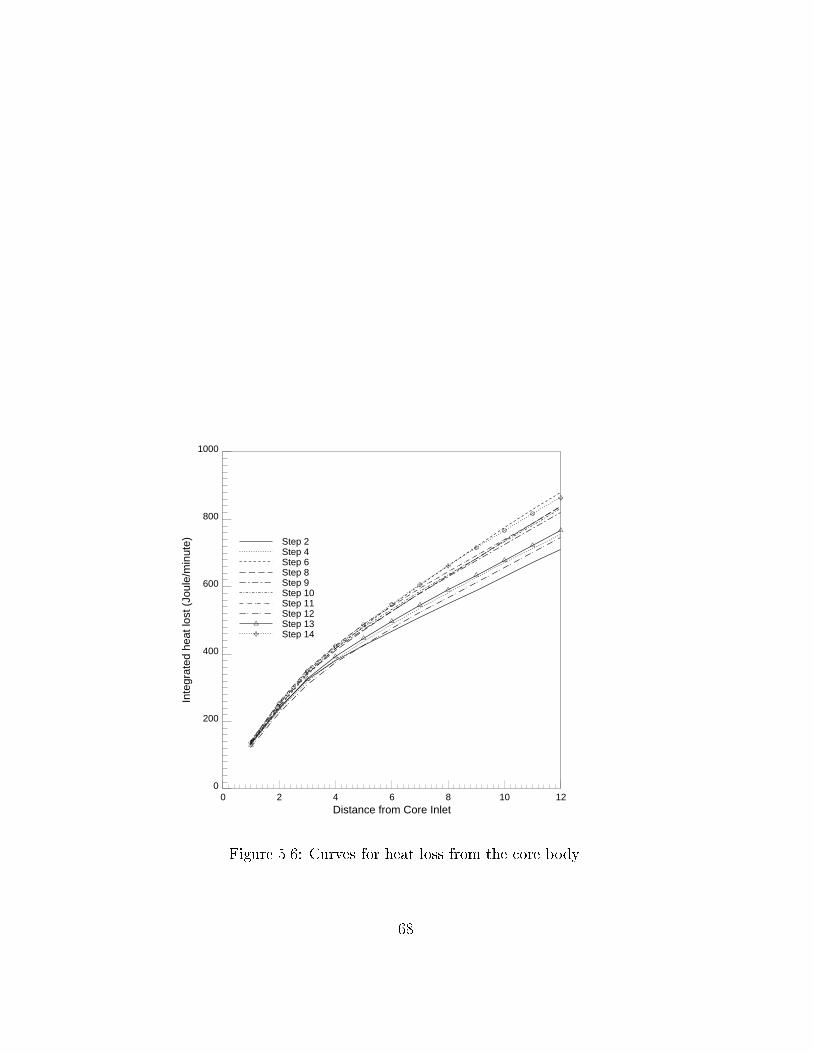
0
200
400
600
800
1000
Inte
grat
ed h
eat l
ost (
Joul
e/m
inut
e)
0 2 4 6 8 10 12Distance from Core Inlet
h
h
h
h
h
h
h
h
h
h
h
h
i
i
i
i
i
i
i
i
i
i
i
i
h
i
Step 2Step 4Step 6Step 8Step 9Step 10Step 11Step 12Step 13Step 14
Figure 5.6: Curves for heat loss from the core body.
68

Table 5.4: Summary of important results.
Step Injection Corrected Steam krw krs
rate enthalpy Saturation
cc/min Joules/gm Percent
1 15 464 10-15 916 -
2 14 474 22 846 99.2
4 8 567 38 365 564
5 8.35 631 50 331 809
6 4.0 764 53 227 711
7 2.25 1285 64 94 908
8 1.3 2264 68 27 987
9 1.33 2262 68 34 974
10 5.05 940 63-54 164 752
11 5.0 624 52-49 198 783
12 6.4 695 49 219 736
13 6.0 548 45-39 306 658
14 8.0 527 43 396 549
The relative permeability computed from the data are shown on Figure
5.6. The relative permeability for the steam phase varies approximately lin-
early with saturation. The liquid phase on the other hand has a curved
variation with saturation somewhat reminiscent of the Corey curves (1954)
and those derived by Verma (1986). The curvature is rather small and may
change to linear at high temperature as the interfacial tension between water
69

0.0
0.2
0.4
0.6
0.8
1.0
Kr
0 20 40 60 80 100saturation
SteamWater
Figure 5.7: Relative Permeability for Steam and Water
70

and steam reduces.
71

Chapter 6
Conclusion
The relative permeability curves presented in the previous section have been
derived from experiments in which the saturations within the core have been
measured very accurately. Furthermore the saturation pro�les have been
shown to follow very closely what is expected from the numerical simulation.
The residual limits are not well de�ned in the experiments. This is because
it was not possible to inject steam at 100% quality due to condensation in
the injection line. It was also not possible to estimate the steam relative per-
meability at low saturations as the correction for the enthalpy of the injected
uid was very close to the correction in heat lost from the injection line and
the core body. These end points can however be inferred from the relative
permeability curves and are about 20% for water and less than 10% for the
steam phase.
Analysis of the X-ray CT images from the porosity scans and the images
of low ow rate saturation show that the core had some inhomogeneity in
72
porosity and probably also in permeability. However these are small and the
results may be applied to homogeneous porous material of uniform proper-
ties. The most likely sources of error in these results are, 1) the heat losses
from the injection lines that were only estimated indirectly from the temper-
ature drop along the line and, 2) the pressure readings due to the scale of
the gauges used.
Several relative permeability relations for ow of steam and water in porous
media derived from experiments have been proposed in the past (Chen et al,
1979; Council and Ramey, 1980; Verma, 1986; Clossman and Vinegar, 1988).
In all the curves reported the relative permeability for one or more of the
phases have tended to follow the relations obtained by Corey (1954) for nitro-
gen and water. However none of the investigators have measured saturation
directly in the manner of the experiments reported here. As a result, none of
them has measured the pressure of a single phase alone over any interval. Un-
like previous investigations these results show that the relative permeability
for both phases are enhanced in comparison to relations obtained by Corey
(1954) which is a major departure from any of the results reported previously.
The main di�erence between the results obtained from these experiments
is the linear variation of the relative permeability of the steam phase with
saturation. Though a number of investigators reported enhancement of rel-
ative permeability of the steam phase none of them obtained a linear rela-
tion between steam phase relative permeability and saturation (Verma, 1986;
Clossman and Vinegar, 1988). It is however worth noting that Verma (1986)
73

reported that the gamma ray densitometer only accessed 5% of the sample
and it is possible that his measurements were inaccurate. Also Clossman
and Vinegar (1988) used samples that were only 6 inches long. For such
lengths capillary e�ects will dominate and the ow of the wetting phase will
be retarded. The relative permeability will therefore be underestimated.
The liquid phase relative permeability still shows resemblance to those ob-
tained by Corey (1954) and Verma (1988). To verify whether the results
obtained here can be applied generally, further experiments will be required.
These experiments could be done on rocks with di�erent wetting characteris-
tics. It will also be of interest to increase the temperature in the experiments
to establish whether the water relative permeability will become linear at
higher temperature.
74
Chapter 7
References
Ambusso W.J., Satik C. and Horne R.N.: A Study of Relative Permeability
For Steam-Water Flow in Porous Media. Proc of 21st on Geothermal Work-
shop on Geothermal Reservoir Engineering. (1996)
Arihara N.: A Study of Non-Isothermal Single and Two-Phase Flow Through
Consolidated Sandstones PhD dissertation, Stanford University, Stanford.
CA. (1976).
Bodvarsson G.S., O'SullivanM.J. and Tsang C.F.: The Sensitivity of Geother-
mal Reservoir Behavior to Relative Permeability Parameters. Proc. of 6th
Workshop on Geothermal Reservoir Engineering, Stanford. (1980)
Brooks R.H. and A.T Corey.: Hydraulic Properties of Porous Media, Col-
orado State University, Hydro paper No.5. (1964)
75
Chen H.K., Council J.R. and Ramey H.J., Jr.: Experimental Steam-Water
Permeability Curves, GRC Transaction, Vol 2. (1978), pp 102-104
Clossman P.J. and Vinegar H.J.: Relative Permeability to Steam and Wa-
ter at Residual Oil in Natural Cores; CT Scan Saturation. SPE paper 174449
Corey A.T.: The Interrelations Between Gas and Oil Relative Permeabili-
ties, Producers Monthly Vol. 19. (1954), pp 38-41.
Council J.R. and Ramey Jr, H.J.: Drainage Relative Permeabilities Obtained
from Steam Water boiling Flow and External Gas Drive experiments. GRC
Trans. Vol 3. (1979), pp 141-143.
Fulcher R.A. Jr, Ertekin T. and Stahl C.D.: The E�ects of Capillary Num-
ber and Its Constituents on Two-Phase Permeability Curves. SPE Paper No.
12170
Grant M.A.: Permeability Reduction Factors at Wairakei. Paper Presented
at AIChE-ASME Heat Transfer Conference, AIChE, Salt Lake City,Utah,
(August 1977), pp 15-17.
Hassler J.L., Rice R.R. and Leeman, E.H.: Trans. AIME, Vol. 118, (1936),
pp 114.
Heiba A.A., Davis H.T. and Scriven L.E.: The E�ects of Wettability on
76
Two-Phase Relative Permeabilities and Capillary Pressure Curves, SPE pa-
per 12172.
Horne R.N. and Ramey H.J., Jr,: Steam/Water Relative Permeability from
Production Data,GRC Trans.(1978) Vol 2
Johns J.R. and Steude J.S, Castanier L.M and Roberts P.V.: Nondestructive
Measurements of Fracture Aperture in Crystalline Rock Core Using X-ray
Computed Tomography. J. Geophys. Res. Vol. 98(B2) pp 1889-1900.
Osoba J.S., Richardson J.J., Kerver J.K., Ha�ord J.A. and Blair P.M.: Lab-
oratory Measurements of Relative Permeability. Petroleum Transactions,
AIME, Vol.192, (1951), pp 47-55.
Piquemal J.: Saturated Steam Relative Permeabilities of Unconsolidated Porous
Media. Transport in Porous Media 17. (1994), 105-120.
Reda D.C. and Eaton. R.R.: In uence of Steam Water Relative Permeabil-
ity Models on Predicted Geothermal Reservoir Performance; A Sensitivity
Study. 6th Annual Workshop on Geothermal Reservoir Engineering, Stan-
ford. (1980)
Sanchez J.M and Schechter R.S.: Comparison of Two-Phase Flow of Steam/Water
through an Unconsolidated Permeable Medium, SPE 16967.
77

Satik C, Ambusso W.J. Castanier L.M. and Horne R.N.: A Preliminary
Study of Relative Permeability in Geothermal Rocks, GRC Trans. Vol. 19.
(1995). pp 539.
Sorey M.L, Grant M.A. and Bradford E.: NonLinear E�ects in Two-phase
Flow to Wells in Geothermal Reservoirs. Water Resources Research, Vol 16
No.4. (1980), pp 767-777.
Udell K.S.: The Thermodynamics of Evaporation and Condensation in Porous
Media. SPE Paper 10779. Presented at SPE California Regional Meeting San
Francisco, CA. March 24-26, 1982.
Verma M.A.: E�ects of Phase Transformation of Steam-Water Two-Phase
Relative Permeability. Ph.D Thesis. University of California, Berkeley.
(1986)
78