Embed Size (px)
Citation preview
International Journal of Applied Science and Technology Vol. 3 No. 4; April 2013
69
Experimental Design Methodology Applied to Bleaching of Palm Oil Using Local Clay
Nwabanne, J.T
Department of Chemical Engineering Nnamdi Azikiwe University
P.M.B. 5025 Awka, Nigeria.
Ekwu, F. C
Department of Food Science and Technology Ebonyi State University
Abakiliki, Nigeria. Abstract In the present work, response surface methodology was used to study the optimization of bleaching of palm oil using local clay. Chemical activation method which employed phosphoric acid was used for the preparation of the clay. Box Wilson experimental design was employed to correlate the bleaching parameters (temperature, time and dosage of clay) to the percentage palm oil bleached. The result showed that the optimum condition for the bleaching process was temperature of 1000C, time of 30 min and dosage of 2.4g of clay which resulted in 99.17% bleaching of the palm oil. The experimental result was in agreement with the model prediction. Quadratic polynomial equation was developed for proper process parametric study in order to achieve optimal performance. The study has shown that the clay is a good adsorbent for the bleaching of palm oil. Key Words: optimization, bleaching, palm oil, clay, response surface methodology 1. Introduction Crude oil is refined to obtain the purity characteristics desirable in edible oil (Basiron, 1996). In refining vegetable oils, the bleaching process is an important step that removes pigments and other unwanted constituents such as those of mucilaginous character and other volatiles (Christidis & Kosiari., 1997). Bleaching is an adsoption process which involves the use of acid-treated clays to remove undesirable oil components (Foletto, Volzone & Porto, 2006). Several authors have used different adsorbents for the removal of pigments from vegetable oil (Kamga, Kayem & Rouxhet, 2000., Falaras, Lezou,, Seiragakis & Petrakis 2000., Topallar, 1998). The present trend in edible oil industry is the evaluation of the optimal conditions that will lead to most efficient bleaching (Berbesi, 2006). The main parameters controlling the bleaching process are particle size of bleaching clay, proportion of oil to clay (dosage), temperature and time of contact between bleaching clay and oil. Classical and conventional methods of studying a process by maintaining other parameters involved at an unspecified constant level does not depict the combined effect of all the parameters involved (Kumar, Prasad & Mishra, 2008). This is referred as one factor at a time. This method is also time consuming and requires large number of experiments to determine optimum levels, which are unreliable. These limitations can be avoided by optimizing all the parameters collectively by statistical experimental design such as response surface methodology (Ko, Porter, & Mc kay, 2000). Response surface methodology is based on polynomial surface analysis and it is a collection of mathematical and statistical techniques that are useful for the modeling and analysis of problems in which a response of interest is influenced by several variables (Park and Ahn, 2004). The main objective of response surface methodology is to determine the optimum operational conditions for the process (Kumar et al., 2008). The application of statistical experimental design techniques in adsorption process development can result in improved product yields, closer confirmation of the output response to nominal and target requirement reduced process variability and reduced development time and overall costs (Annadurai, Juang, & Lee, 2002).

© Center for Promoting Ideas, USA www.ijastnet.com
70
Application of response surface methodology in adsorption process have been reported by several authors (Shar, Ingavle, Ponrathnam & Pawar, 2007; Silva, Sousa, Goncalves, Porter & Ferreira-Dias, 2004; Ravikumar, Krishnan, Ramalingam, & Balu, 2007; Goel, Velu, Rajagopal & Garg, 2005; Garg Kaur, Garg, & Sud, 2008; Zulkali, Ahmad, & Norulakmal, 2006). This main objective of this work is to optimize the variables (dosage, temperature and time of contact between the bleaching clay and palm oil) in order to obtain the optimum conditions for the bleaching of palm oil using Box Wilson design.
2. Experimental
2.1. Materials
The clay was obtained locally from Achalla-agu village, Nteje, in Oyi Local Government Area of Anambra State, Nigeria as a dry lumped sample. The clay is grey in colour. The palm oil was obtained locally from Onitsha main market in Nigeria. Sulphuric acid used for acid activation and petroleum ether were analytical grade.
2.2.1. Characterization of Clay Sample
The clay sample was characterised using Atomic Absorption spectrophotometer and X-ray Fluorensce (PW 4030 X-Ray Spectrophotometer).
2.2.2. Acid Activation of Clay Sample
The acid activation was carried out according to the method described by James, Mesubi, Adekola, Odebunmi, Adekeye & Bale, (2008) and Vicente – Rodriquez, Suarez, de Dios Lopes-Gonzalez & Banares – Munoz, (1996). The clay was ground into powder using pestle and mortar, and sieved through a laboratory test sieve of aperture -150m. The clay sample (50g) was introduced into a 600ml pyrex beaker and 250ml of 1M sulphuric acid solution added. The mixture was homogenized in a thermostat bath at a temperature of 950C for 3hours. The resulting mixture was filtered, washed with distilled water severally to reduce the acidity. The activated clay sample was dried in an electric oven at a temperature of 1050C. The dried activated clay sample was then sieved through a laboratory test sieve of aperture - 150m and stored in an air tight container.
2.2.3 Bleaching Process Assays and Analysis
Bleaching of the palm oil was carried out according to the procedure reported by Nde-Aga, Kamga, & Nguetnkam (2007). 30g of degummed, neutralized palm oil was poured into a 50ml pyrex beaker and heated up to an required temperature for the reaction on a magnetic hot plate. When the magnetic hot plate reached the set temperature, the activated clay sample was added. The reaction was carried out at 60, 80 and 1000C and the reaction times were 10, 20 and 30min with dosage of 4%, 6% and 8%. At the end of the reaction, the mixture was filtered through Whatman No 1 filter paper into a test tube until a reasonable amount was obtained. The absorbance of the oil was measured using a UV spectrophotometer as follows: 0.1g of palm oil was diluted in 7.5ml of petroleum ether and the absorbance of the sample determined at 445nm wavelength using petroleum ether as reference (Nde Aga et al, 2007). The percentage of oil bleached was calculated as follows:
100Asorbance
Asorbance-Asorbance=%Bleachedunbleached
bleachedunbleached (1)
Where, % Bleached = percentage bleached, Absorbanceunbleached = Absorbance of unbleached palm oil, Absorbancebleached = Absorbance of bleached palm oil.
2.2.4. Experimental Design
Box Wilson design of experiment (central composite rotatable design) was used to optimize the variables in order to obtain optimum bleaching of palm oil using Nteje clay. Time, temperature and dosage were chosen as independent variables, and the percentage bleached was the dependent variable. The experimental range and level of independent variables for bleaching of palm oil are given in Table 1. In this study, a set of 20 experiments were carried out. These 20 experiments contain 8 core points, 6 star like points and 6 null points. The distance of the star like points from core point is given by = 2n/4
, where n is the number of factors (for three factors, = 23/4 = 1.68).

International Journal of Applied Science and Technology Vol. 3 No. 4; April 2013
71
The coded values of the independent variables for the design of the experiment for bleaching of palm oil are given in Table 2. x1 is a coded variable that represents the temperature, x2 represents the time and x3 represents the dosage.
Table 1: Factor levels of the independent variables for the bleaching of palm oil.
Independent variables Low level (-1) Medium level (0) High level (+1) Temperature, 0C Time, min Dosage, g
60 10 1.2
80 20 1.8
100 30 2.4
Table 2: Box Wilson experimental design for the bleaching of palm oil
The design of the experiment was analyzed with the aid of Minitab software (Minitab Release 15). By solving the regression equation and analyzing the response surface contour plots, the optimum values of selected variables were obtained.
εxBxxBxBβYk
jjij
i jjiij
k
jjj ++++= ∑∑∑∑
1=
2
<1=0 (2)
Where Y is the predicted response, ijj BBβ ,,0 and jjB constant coefficients; xi and xj are the coded independent variables or factors: is random error.
3. Results and Discussion
3.1. Chemical Properties of the Clay
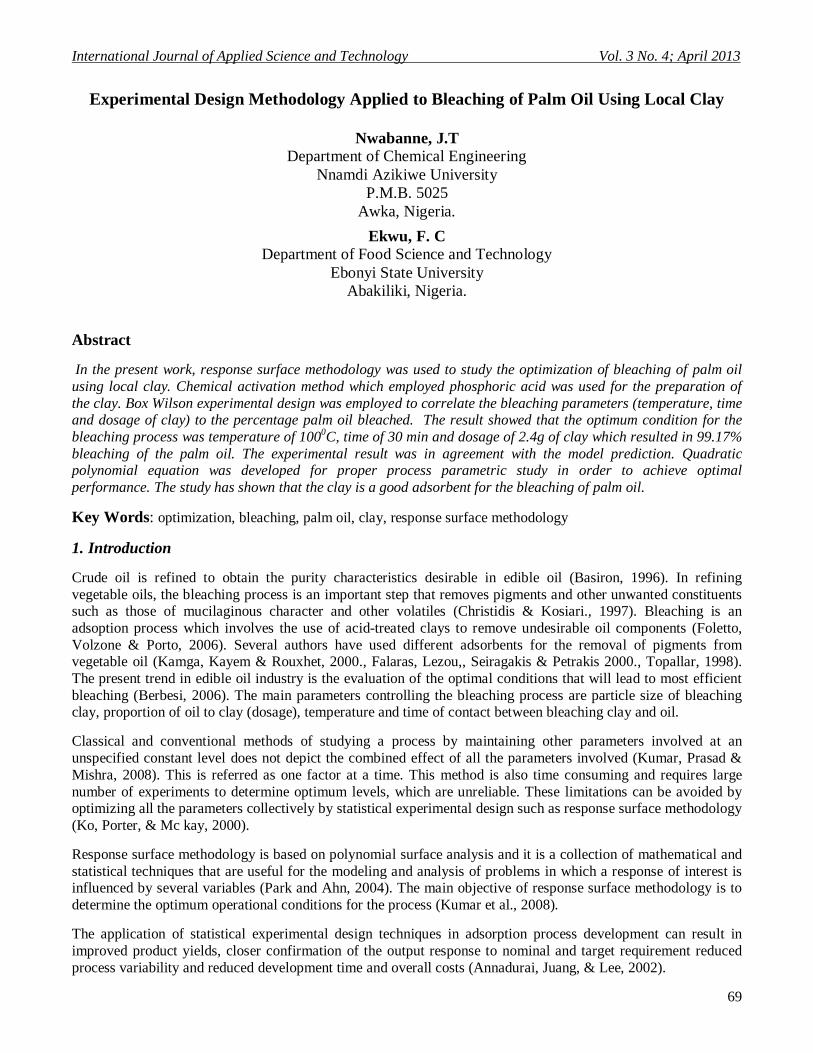
The result for chemical analysis in Table 3 shows a high silica content of Nteje clay (52.70%) which suggests its use as source of silica for the production of floor tiles. When the silica oxide composition is between 50 – 70% it suggests the existence of calcium montmorillonite (bentonite) (Foletto et al., 2006, Falaras et al., 2000, Njiribeakor and Nwanya, 2000). It is seen from Table 4 that Nteje clay contains aluminium and iron in major quantities and trace elements like zinc, potassium and copper in minor quantities.
Run Coded values Natural values Temperature, 0C Time, min Dosage, g
1 2 3 4 5 6 7 8 9 10 11 12 13 14 15 16 17 18 19 20
+ + + + + - + - + + - - - + + - + - - - + - - - -1.68 0 01.68 0 0 0 -1.68 00 1.68 0 0 0 -1.680 0 1.680 0 0 0 0 0 0 0 0 0 0 0 0 0 0 0 0 0
100 100
100 100 60 60 60 60 46 114 80 80 80 80 80 80 80 80 80 80
30 30 10 10 30 30 10 10 20 20 3
37 20 20 20 20 20 20 20 20
2.4 1.2 2.4 1.2 2.4 1.2 2.4 1.2 1.8 1.8 1.8 1.8 0.8 2.8 1.8 1.8 1.8 1.8 1.8 1.8
© Center for Promoting Ideas, USA www.ijastnet.com
72
Table 3: Chemical analysis of Nteje clay using X-ray flourescence
Oxide Composition Al2O3 SiO2 CaO TiO2 FeO3 V2O5 Cr2O3 MnO NiO CuO ZnO Loss in ignition
17.5 56.6 1.52 2.36 19.29 0.14 0.09 0.20 0.04 0.03 0.06 4.49
Table 4: AAS Characterization of Nteje Clay
Element Concentration (ppm) Fe Al Na Cu K Zn Ca Mg Mn Ni
23.6340 35.4839 11.5033 0.0264 0.0163 0.0190 0.1214 0.1265 0.2204 0.1059
3.3. Design of Experiments Using Box Wilson Design
The most important parameters affecting the efficiency of the bleaching process are temperature (x1), time (x2) and dosage (x3). In order to study the combined effects of these factors, experiments were performed by varying physical parameters using experimental design. Experimental and Theoretical values for percentage palm oil bleached are shown in Table 5. It can be seen that the optimum percentage oil bleached of 99.17 % was obtained at temperature of 1000C, 30mins bleaching time and dosage of 2.4g. The result of analysis of variance (ANOVA) for the response surface quadratic model is shown in Table 6. The tests for adequacy of the regression models, significance of individual model coefficients and the lack of fit test were performed using the same statistical package. The regression model obtained is given in equation 3.
Y (%) = - 35.1 + 1.27 x1 + 2.17 x2 + 25.24 x3 - 0.00621 x1x2 - 0.207 x2x3 - 0.124 x1x3 - 0.0041 x1
2 - 0.0197 x22 - 0.094 x3
2 (3)
The P values were used as a tool to check the significance of each of the coefficients, which in turn are necessary to understand the pattern of the mutual interactions between the test variables (Shrivastava, Saudagar, Bajaj, & Singhal, 2008). The larger the magnitude of F-test value and the smaller the magnitude of P-values, the higher the significance of corresponding coefficient (Alam, Muyibi, Kamaldin, 2008). Values of P less than 0.05 indicate that the model terms are significant. The fitness of the model equation was also expressed by the coefficient of determination, R2. In this case, x1, x2, x3, x1
2 and x22 are the significant model terms. The final mathematical model
by eliminating the insignificant terms and interactions is expressed as equation 4.
Y (%) = -35.08 + 1.27x1 + 2.17 x2 +25.2 x3 – 0.00411xଵଶ - 0.0197xଶଶ (4)
International Journal of Applied Science and Technology Vol. 3 No. 4; April 2013
73
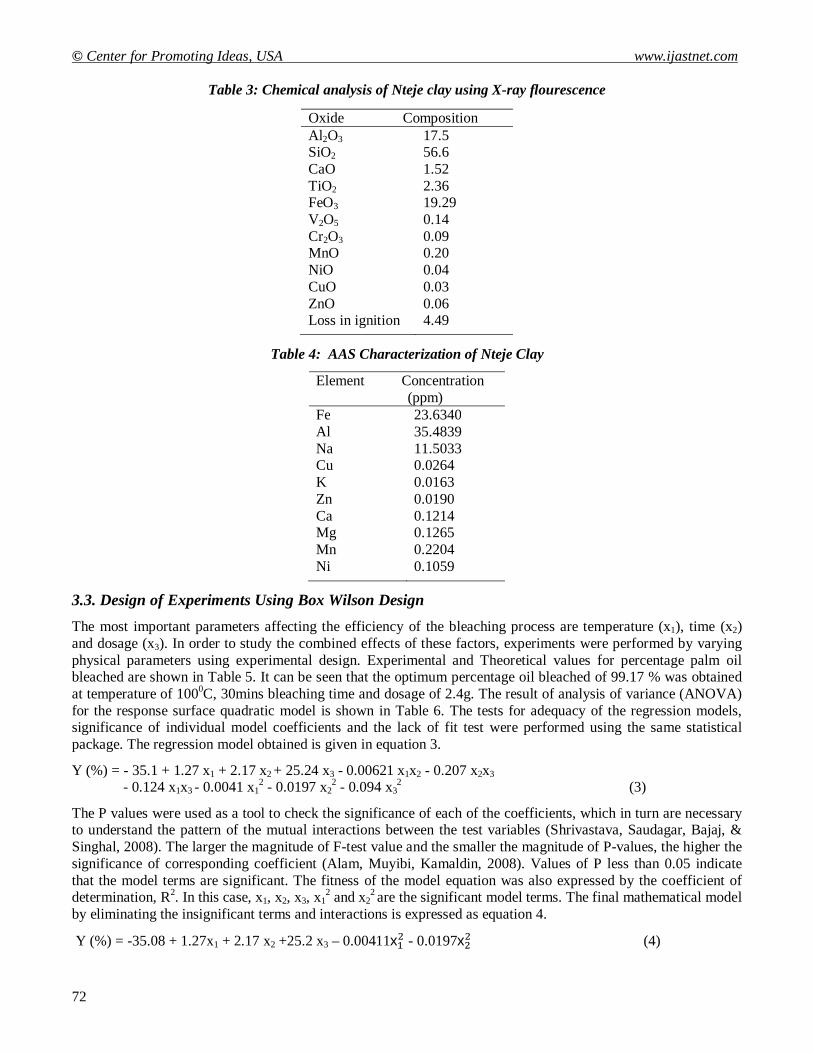
Table 5: Experimental and Theoretical values for percentage palm oil bleached
Run Temperature, Time, Dosage Experimental Predicted 0C Min g (% bleached) (% bleached.) 1 2 3 4 5 6 7 8 9 10 11 12 13 14 15 16 17 18 19 20
100 100 100 100 60 60 60 60 46 114 80 80 80 80 80 80 80 80 80 80
30 30 10 10 30 30 10 10 20 20 3 37 20 20 20 20 20 20 20 20
2.4 1.2 2.4 1.2 2.4 1.2 2.4 1.2 1.8 1.8 1.8 1.8 0.8 2.8 1.8 1.8 1.8 1.8 1.8 1.8
98.05 85.34 90.98 78.27 89.92 76.21 82.84 59.21 71.87 89.10 70.02 89.09 77.52 92.72 85.78 86.32 86.30 85.57 86.10 85.05
99.17 86.17 88.92 75.92 88.46 75.47 78.21 65.22 71.95 90.15 71.41 88.84 74.97 96.56 85.80 85.80 85.80 85.80 85.80 85.80
Table 6: Minitab output (ANOVA) for bleaching of palm oil
Predictor Coefficient StDev T-value P-value Constant x1 x2 x3 x1x2 x2x3 x1x3 x1
2 x2
2 X3
2
-35.08 1.2732 2.1682 25.237 -0.006213 -0.2067 -0.12417 -0.004111 -0.019664 -0.094
17.79 0.2885 0.4872 8.915 0.004167 1.389 0.06945 0.001526 0.006105 1.715
-1.97 4.41 4.45 2.83 -1.49 -1.49 -1.79 -2.69 -3.22 0.05
0.077 0.001 0.001 0.018 0.167 0.168 0.104 0.023 0.009 0.958
S = 2.35738 R-sq = 96.3% R-sq(adjusted) = 93.0% PRESS = 427.337 R-sq(predicted) = 71.84%
Analysis of Variance Source DF SS MS F-value P-value Regression Error Total
9 1461.70 62.41 5.56
29.23 0.000 10 55.57 10 1516.67
From equation (3), temperature (x1), time (x2) and dosage (x3) are the most significant variables for the bleaching of palm oil, followed by their square (x1
2) and (x22). Thus, increase in temperature, time and dosage will have a
significant increase in the bleaching efficiency. The positive value of the coefficient of temperature, time and dosage indicates that the increase in these factors will lead to an increase in the percentage oil bleached. Time and dosage will have more significant effect in the increment of the response value since their coefficients are higher. Kumar et al. (2008) stated that when regression coefficient has a positive sign, the increase of the associated factor causes an increase in response and a negative sign would cause a decrease in the optimization parameter.
© Center for Promoting Ideas, USA www.ijastnet.com
74
Second order main effects (x1
2and x22) had a negative algebraic sign which indicated a negative effect on the
bleaching process. Above 30 minutes and 1200C, the bleaching efficiency decreased as a result of destruction of some of the active sites (James et al., 2008). It was found from Table 6 that the regression F-value of 29.23 implies that the model is significant. The probability P value is zero, indicating the significance of the model. For an adsorption process, adequate precision (press) 427.337 indicates an adequate signal implying that he model can be used to navigate the design space. The adequate precision compares the range of the predicted value at the design points to the average prediction error (Kumar et al., 2008). The adequate precision ratio above 4 indicates adequate model efficacy (Kumar et al, 2007). The value of R2 = 96.3% indicates that 96.3% of the variability in the response could be explained by the model.
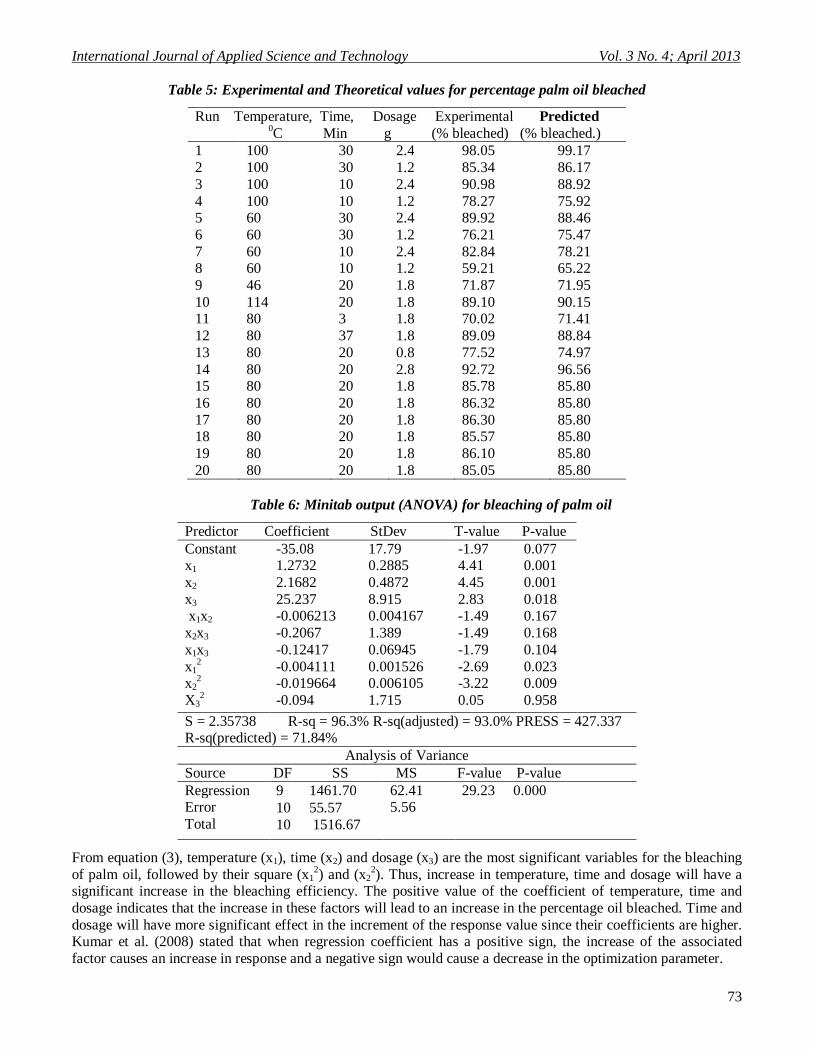
The 3D response surface plots and contour plots which are the graphical results of interactive effects are shown in Figs 1 - 6. Figures 1 and 4 represent the response for the interactive factors – temperature and time. It is seen from the figures that percentage bleached increased with increase in temperature and time. It was observed that above 1200C and 30min, there was decrease in the bleaching efficiency. This can be seen from Figure 4 since the area above this value indicates lesser bleaching efficiency (80 – 90%) compared to the darkest region which has bleaching efficiency (> 90%). From Fig .1, more increase in time leads to higher increase in bleaching efficiency than increase in temperature. This is due to the second most significant factor being the time, and to its effect being positive.
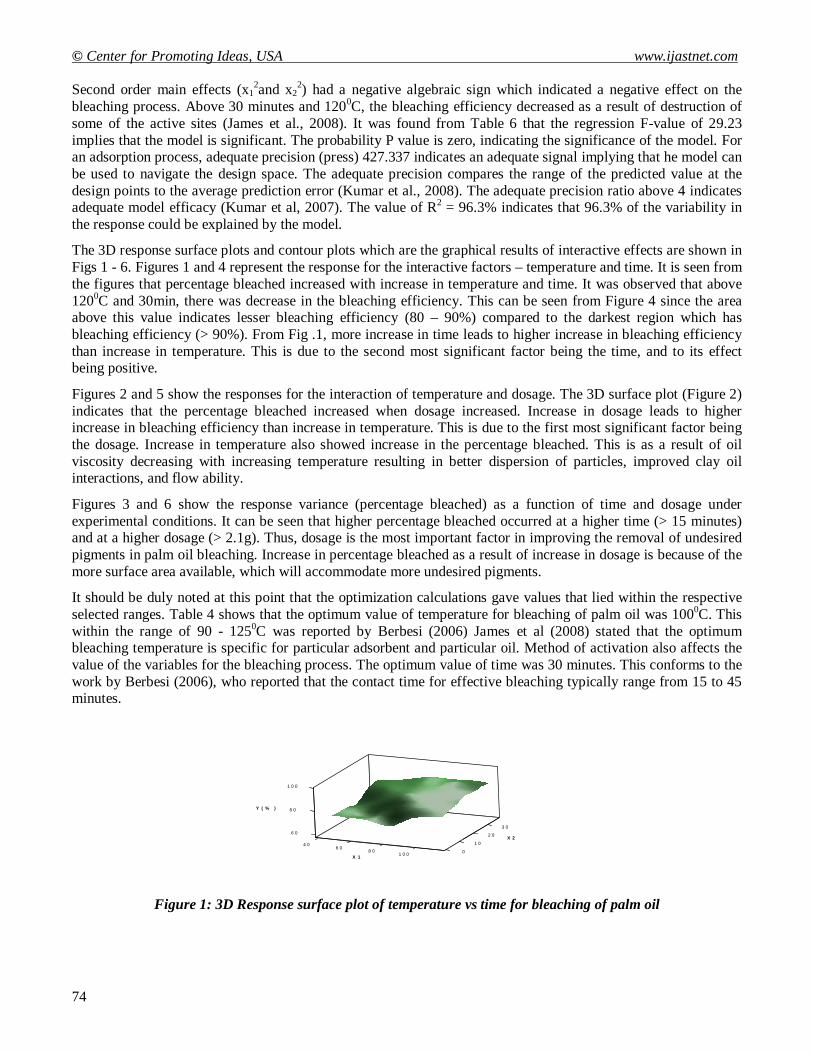
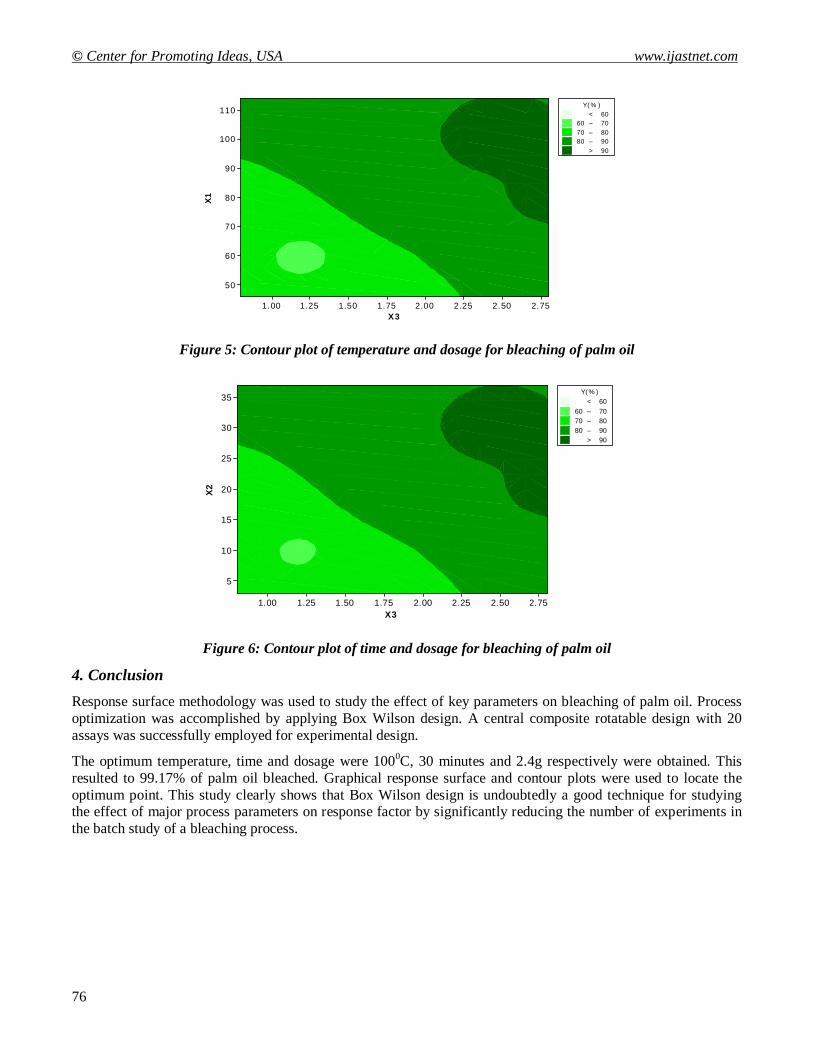
Figures 2 and 5 show the responses for the interaction of temperature and dosage. The 3D surface plot (Figure 2) indicates that the percentage bleached increased when dosage increased. Increase in dosage leads to higher increase in bleaching efficiency than increase in temperature. This is due to the first most significant factor being the dosage. Increase in temperature also showed increase in the percentage bleached. This is as a result of oil viscosity decreasing with increasing temperature resulting in better dispersion of particles, improved clay oil interactions, and flow ability.
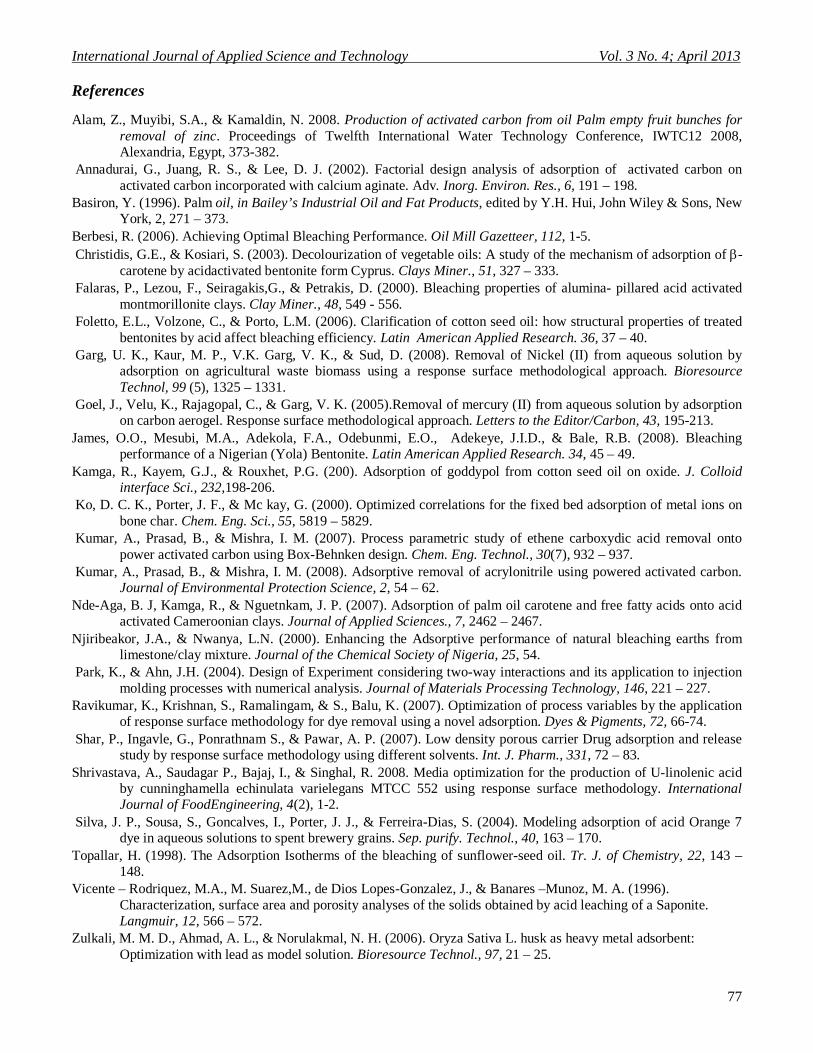
Figures 3 and 6 show the response variance (percentage bleached) as a function of time and dosage under experimental conditions. It can be seen that higher percentage bleached occurred at a higher time (> 15 minutes) and at a higher dosage (> 2.1g). Thus, dosage is the most important factor in improving the removal of undesired pigments in palm oil bleaching. Increase in percentage bleached as a result of increase in dosage is because of the more surface area available, which will accommodate more undesired pigments.
It should be duly noted at this point that the optimization calculations gave values that lied within the respective selected ranges. Table 4 shows that the optimum value of temperature for bleaching of palm oil was 1000C. This within the range of 90 - 1250C was reported by Berbesi (2006) James et al (2008) stated that the optimum bleaching temperature is specific for particular adsorbent and particular oil. Method of activation also affects the value of the variables for the bleaching process. The optimum value of time was 30 minutes. This conforms to the work by Berbesi (2006), who reported that the contact time for effective bleaching typically range from 15 to 45 minutes.
3 06 0 2 0
8 0
4 0 1 0
1 0 0
6 08 0 01 0 0
Y ( % )
X 2
X 1
Figure 1: 3D Response surface plot of temperature vs time for bleaching of palm oil

International Journal of Applied Science and Technology Vol. 3 No. 4; April 2013
75
2.5
2.060
80
1.540
100
60 1.080
100
Y ( % )
X 3
X 1
Figure 2: 3D Response surface plot of temperature vs dosage for bleaching of palm oil
2.5
2.060
80
1.50
100
10 1.02030
Y ( % )
X 3
X 2
Figure 3: 3D Response surface plot of time against dosage for bleaching of palm oil
X 2
X1
3530252015105
110
100
90
80
70
60
50
> – – – < 60
60 7070 8080 90
90
Y (% )
Figure 4: Contour plot of temperature and time for bleaching of palm oil
© Center for Promoting Ideas, USA www.ijastnet.com
76
X3
X1
2.752.502.252.001.751.501.251.00
110
100
90
80
70
60
50
> – – – < 60
60 7070 8080 90
90
Y(% )
Figure 5: Contour plot of temperature and dosage for bleaching of palm oil
X3
X2
2.752.502.252.001.751.501.251.00
35
30
25
20
15
10
5
> – – – < 60
60 7070 8080 90
90
Y(%)
Figure 6: Contour plot of time and dosage for bleaching of palm oil
4. Conclusion
Response surface methodology was used to study the effect of key parameters on bleaching of palm oil. Process optimization was accomplished by applying Box Wilson design. A central composite rotatable design with 20 assays was successfully employed for experimental design.
The optimum temperature, time and dosage were 1000C, 30 minutes and 2.4g respectively were obtained. This resulted to 99.17% of palm oil bleached. Graphical response surface and contour plots were used to locate the optimum point. This study clearly shows that Box Wilson design is undoubtedly a good technique for studying the effect of major process parameters on response factor by significantly reducing the number of experiments in the batch study of a bleaching process.
International Journal of Applied Science and Technology Vol. 3 No. 4; April 2013
77
References Alam, Z., Muyibi, S.A., & Kamaldin, N. 2008. Production of activated carbon from oil Palm empty fruit bunches for
removal of zinc. Proceedings of Twelfth International Water Technology Conference, IWTC12 2008, Alexandria, Egypt, 373-382.
Annadurai, G., Juang, R. S., & Lee, D. J. (2002). Factorial design analysis of adsorption of activated carbon on activated carbon incorporated with calcium aginate. Adv. Inorg. Environ. Res., 6, 191 – 198.
Basiron, Y. (1996). Palm oil, in Bailey’s Industrial Oil and Fat Products, edited by Y.H. Hui, John Wiley & Sons, New York, 2, 271 – 373.
Berbesi, R. (2006). Achieving Optimal Bleaching Performance. Oil Mill Gazetteer, 112, 1-5. Christidis, G.E., & Kosiari, S. (2003). Decolourization of vegetable oils: A study of the mechanism of adsorption of -
carotene by acidactivated bentonite form Cyprus. Clays Miner., 51, 327 – 333. Falaras, P., Lezou, F., Seiragakis,G., & Petrakis, D. (2000). Bleaching properties of alumina- pillared acid activated
montmorillonite clays. Clay Miner., 48, 549 - 556. Foletto, E.L., Volzone, C., & Porto, L.M. (2006). Clarification of cotton seed oil: how structural properties of treated
bentonites by acid affect bleaching efficiency. Latin American Applied Research. 36, 37 – 40. Garg, U. K., Kaur, M. P., V.K. Garg, V. K., & Sud, D. (2008). Removal of Nickel (II) from aqueous solution by
adsorption on agricultural waste biomass using a response surface methodological approach. Bioresource Technol, 99 (5), 1325 – 1331.
Goel, J., Velu, K., Rajagopal, C., & Garg, V. K. (2005).Removal of mercury (II) from aqueous solution by adsorption on carbon aerogel. Response surface methodological approach. Letters to the Editor/Carbon, 43, 195-213.
James, O.O., Mesubi, M.A., Adekola, F.A., Odebunmi, E.O., Adekeye, J.I.D., & Bale, R.B. (2008). Bleaching performance of a Nigerian (Yola) Bentonite. Latin American Applied Research. 34, 45 – 49.
Kamga, R., Kayem, G.J., & Rouxhet, P.G. (200). Adsorption of goddypol from cotton seed oil on oxide. J. Colloid interface Sci., 232,198-206.
Ko, D. C. K., Porter, J. F., & Mc kay, G. (2000). Optimized correlations for the fixed bed adsorption of metal ions on bone char. Chem. Eng. Sci., 55, 5819 – 5829.
Kumar, A., Prasad, B., & Mishra, I. M. (2007). Process parametric study of ethene carboxydic acid removal onto power activated carbon using Box-Behnken design. Chem. Eng. Technol., 30(7), 932 – 937.
Kumar, A., Prasad, B., & Mishra, I. M. (2008). Adsorptive removal of acrylonitrile using powered activated carbon. Journal of Environmental Protection Science, 2, 54 – 62.
Nde-Aga, B. J, Kamga, R., & Nguetnkam, J. P. (2007). Adsorption of palm oil carotene and free fatty acids onto acid activated Cameroonian clays. Journal of Applied Sciences., 7, 2462 – 2467.
Njiribeakor, J.A., & Nwanya, L.N. (2000). Enhancing the Adsorptive performance of natural bleaching earths from limestone/clay mixture. Journal of the Chemical Society of Nigeria, 25, 54.
Park, K., & Ahn, J.H. (2004). Design of Experiment considering two-way interactions and its application to injection molding processes with numerical analysis. Journal of Materials Processing Technology, 146, 221 – 227.
Ravikumar, K., Krishnan, S., Ramalingam, & S., Balu, K. (2007). Optimization of process variables by the application of response surface methodology for dye removal using a novel adsorption. Dyes & Pigments, 72, 66-74.
Shar, P., Ingavle, G., Ponrathnam S., & Pawar, A. P. (2007). Low density porous carrier Drug adsorption and release study by response surface methodology using different solvents. Int. J. Pharm., 331, 72 – 83.
Shrivastava, A., Saudagar P., Bajaj, I., & Singhal, R. 2008. Media optimization for the production of U-linolenic acid by cunninghamella echinulata varielegans MTCC 552 using response surface methodology. International Journal of FoodEngineering, 4(2), 1-2.
Silva, J. P., Sousa, S., Goncalves, I., Porter, J. J., & Ferreira-Dias, S. (2004). Modeling adsorption of acid Orange 7 dye in aqueous solutions to spent brewery grains. Sep. purify. Technol., 40, 163 – 170.
Topallar, H. (1998). The Adsorption Isotherms of the bleaching of sunflower-seed oil. Tr. J. of Chemistry, 22, 143 – 148.
Vicente – Rodriquez, M.A., M. Suarez,M., de Dios Lopes-Gonzalez, J., & Banares –Munoz, M. A. (1996). Characterization, surface area and porosity analyses of the solids obtained by acid leaching of a Saponite. Langmuir, 12, 566 – 572.
Zulkali, M. M. D., Ahmad, A. L., & Norulakmal, N. H. (2006). Oryza Sativa L. husk as heavy metal adsorbent: Optimization with lead as model solution. Bioresource Technol., 97, 21 – 25.