Embed Size (px)
Citation preview

EXPERIMENTAL DESIGNDeveloped by Kathy Melvin
Presented by Dr.Gerard J. Putz
Science answers questions with experiments

Begin by asking a question about your topic
One that is testable with the materials at hand
What is a good question for an experiment?
DEFINE THE PROBLEM

Now we need a hypothesis to guide our investigation.
What is a hypothesis?
Your best thinking about how the change you make might affect another factor. Tentative or trial solution to the question. An if ………… then ………… statement.
The independent variable is the variable that is purposely changed. It is the manipulated variable.
The dependent variable changes in response to the independent variable. It is the responding variable.
Be sure to operationally define each variable.
VariablesVariables are things that change.
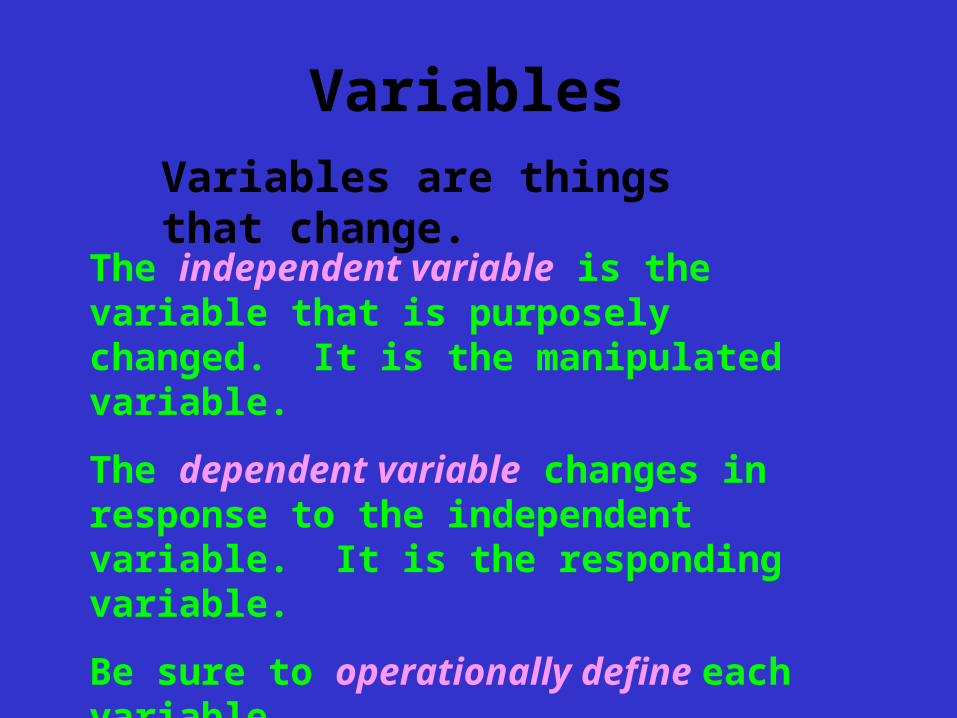
Operational Definition
What are operational definitions?
Description of an observable procedure that
we followed in measuring an abstract characteristic
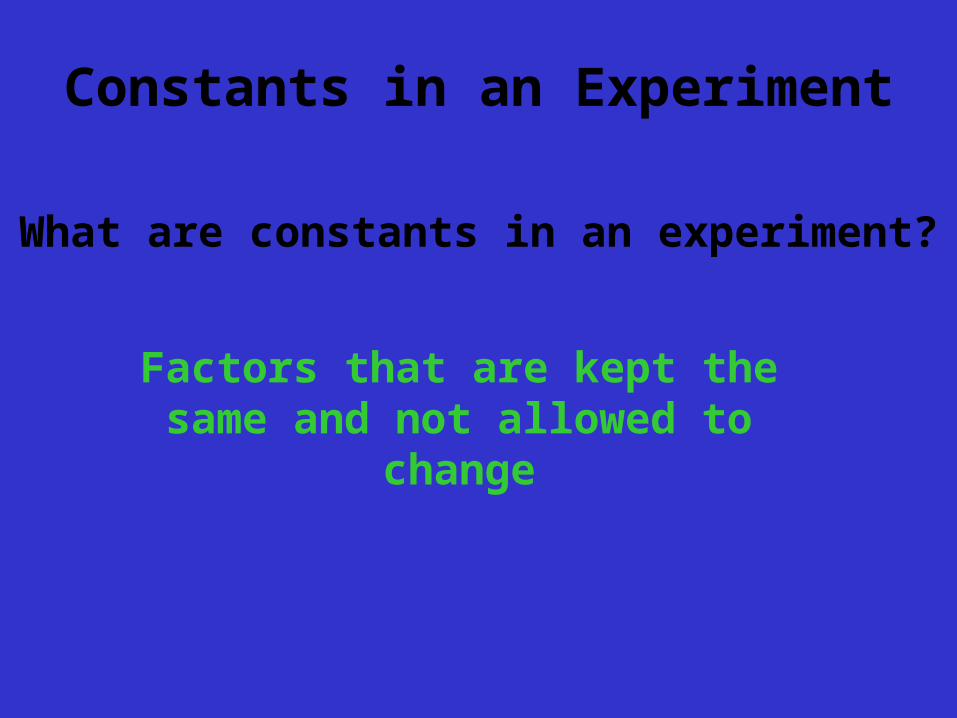
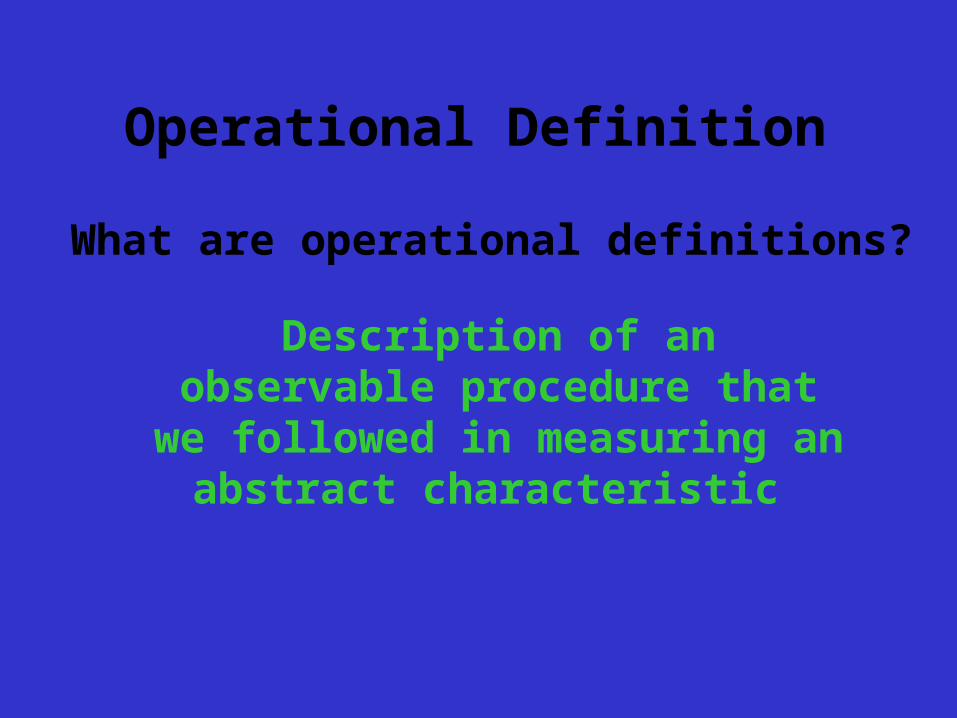
Constants in an Experiment
What are constants in an experiment?
Factors that are kept the same and not allowed to change
The Control in an Experiment
What is a control?
The part of the experiment that serves as the standard of comparison.
Why is a control necessary?
It is the unchanged part of the experiment that detects the effects of hidden variables

Materials and ProceduresA description of what you will use for your experiment, and
how you will do it.
Be sure to include:
•Levels of the Independent Variable
•Repeated Trials
•Drawing of Apparatus

Levels of the Independent Variable
How many different levels of the independent variable should we test?
3 ? 5? 10? The more the better?
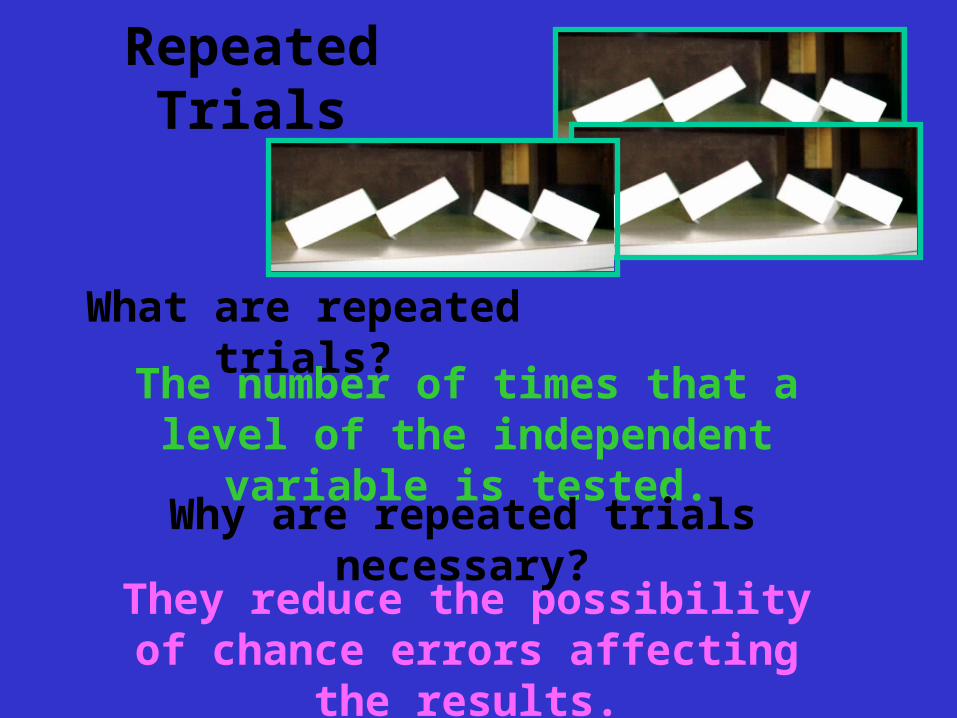
Repeated Trials
What are repeated trials?
The number of times that a level of the independent variable is tested.
Why are repeated trials necessary?
They reduce the possibility of chance errors affecting the results.

Drawing of Experiment
Include Labels to clearly
identify the important parts
of the experimental
setup

Qualitative Observations and Results
What are qualitative observations?
They are what you perceive that occurred during the course of your
experiment. They are identification of trends in the data.
Quantitative Observations and Results
What are quantitative observations?
Numbers in the form of raw data displayed in data tables and graphs
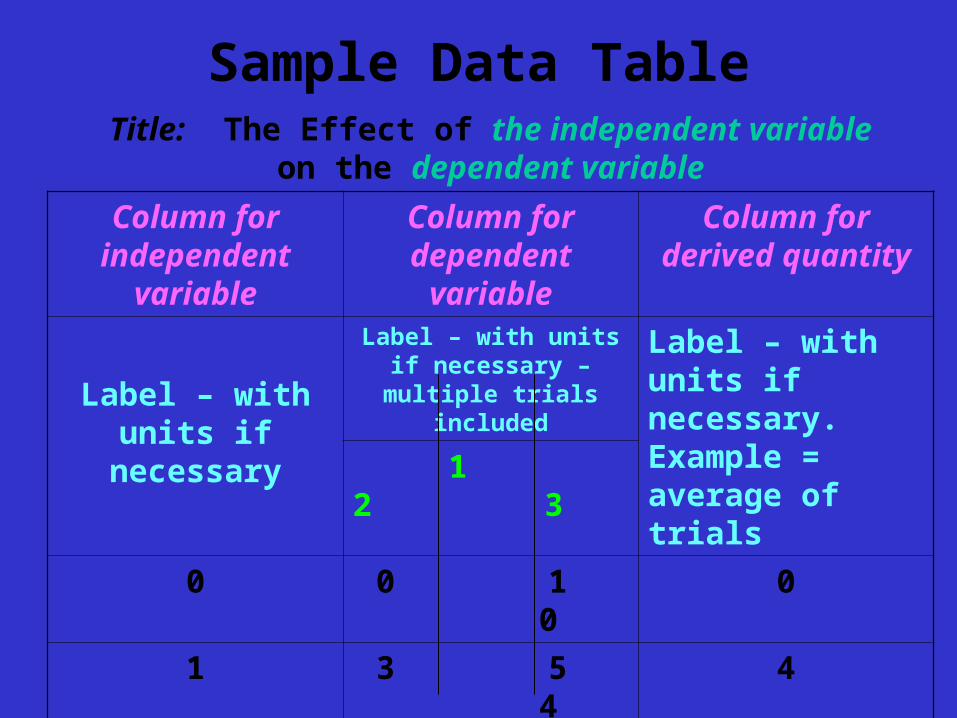
Sample Data TableTitle: The Effect of the independent variable on the
dependent variable
Column for independent variable
Column for dependent variable
Column for derived quantity
Label – with units if necessary
Label – with units if necessary – multiple trials
included
Label – with units if necessary. Example = average of trials
1 2 3
0 0 1 0 0
1 3 5 4 4
2 6 4 7 6
3 7 6 8 7
4 9 9 8 9
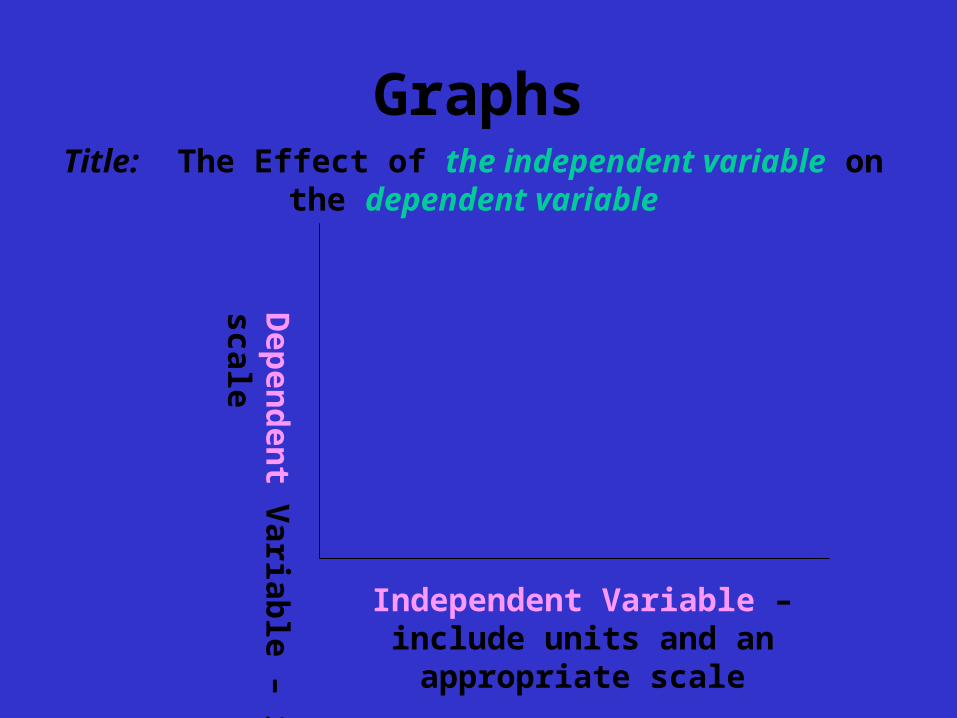
GraphsTitle: The Effect of the independent variable on the dependent
variable
Independent Variable – include units and an appropriate scale
Dep
end
ent V
ariable – in
clud
e un
its and
an ap
prop
riate scale
Analysis and Interpretation of Results
This is where you describe in words what is illustrated by your data as shown in your table and graph
You also describe the meaning of the results

Possible Experimental Errors
What factors in your materials or procedure might have had an impact on your
results?
Conclusion
Why or why not your results supported or did not support the hypothesis.
Hypotheses are never “wrong”. They are either supported or not supported.
Include reasons for the hypothesis to be supported or unsupported.

Recommendations for Further Experimentation
What are some practical applications of your results?
What other questions that could be tested arise from your results?
Writing A Statement of the Problem for the
Experiment
It should state: “The Effect of the Independent Variable on the Dependent Variable”.
What is a good statement of the problem for “The Helicopter?
What should it state?
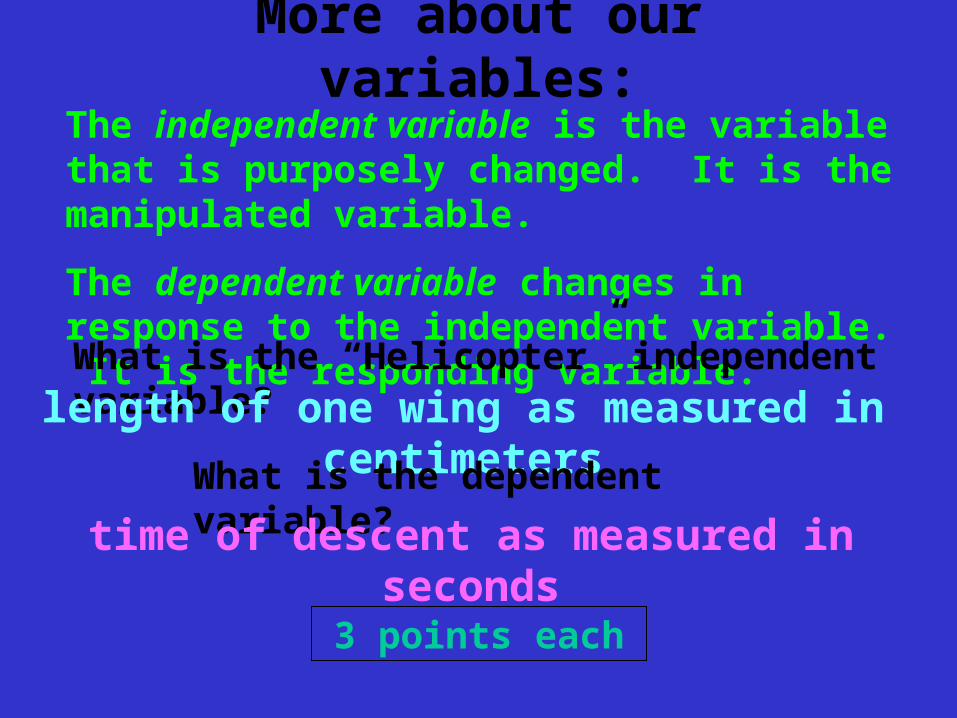
More about our variables:The independent variable is the variable that is purposely changed. It is the manipulated variable.
The dependent variable changes in response to the independent variable. It is the responding variable.
What is the “Helicopter” independent variable?
length of one wing as measured in centimeters
What is the dependent variable?
time of descent as measured in seconds
3 points each
Title for the Helicopter Experiment
The Effect of Wing Length on the Length of Time the Helicopter Takes to Reach
the Ground
4 points
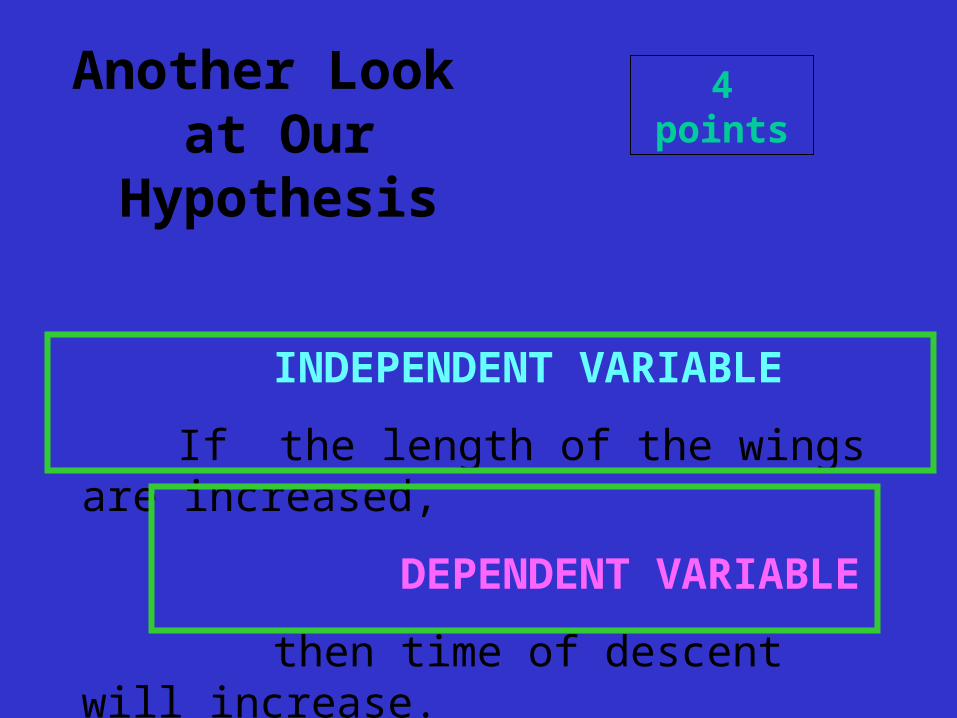
Another Look at Our Hypothesis
INDEPENDENT VARIABLE
If the length of the wings are increased,
DEPENDENT VARIABLE
then time of descent will increase.
4 points
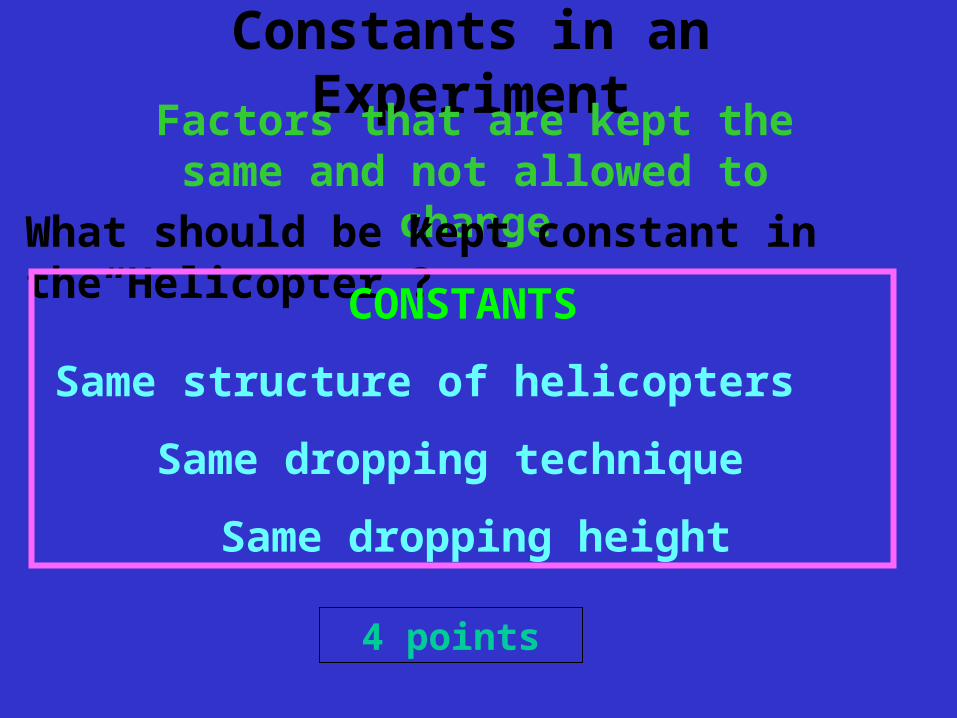
Constants in an ExperimentFactors that are kept the same and not
allowed to change
What should be kept constant in the“Helicopter”?
CONSTANTS
Same structure of helicopters
Same dropping technique
Same dropping height
4 points
The Control in an ExperimentThe part of the experiment that serves
as the standard of comparison.
What is a good control for the “Helicopter”?
CONTROL
Beginning length of wings (5 cm)
2 points

Levels of the Independent Variable
How many different levels of the independent variable should we test?
Enough to clearly illustrate a trend in the data - 5cm, 6cm, 7cm, 8cm…..
Repeated Trials
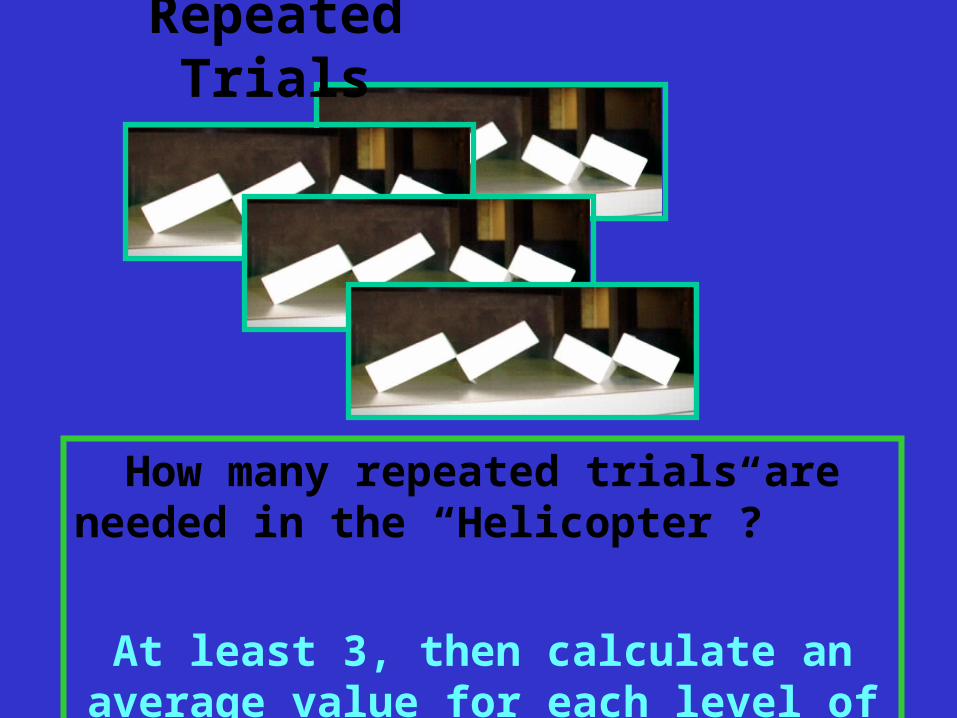
How many repeated trials are needed in the “Helicopter”?
At least 3, then calculate an average value for each level of the independent variable
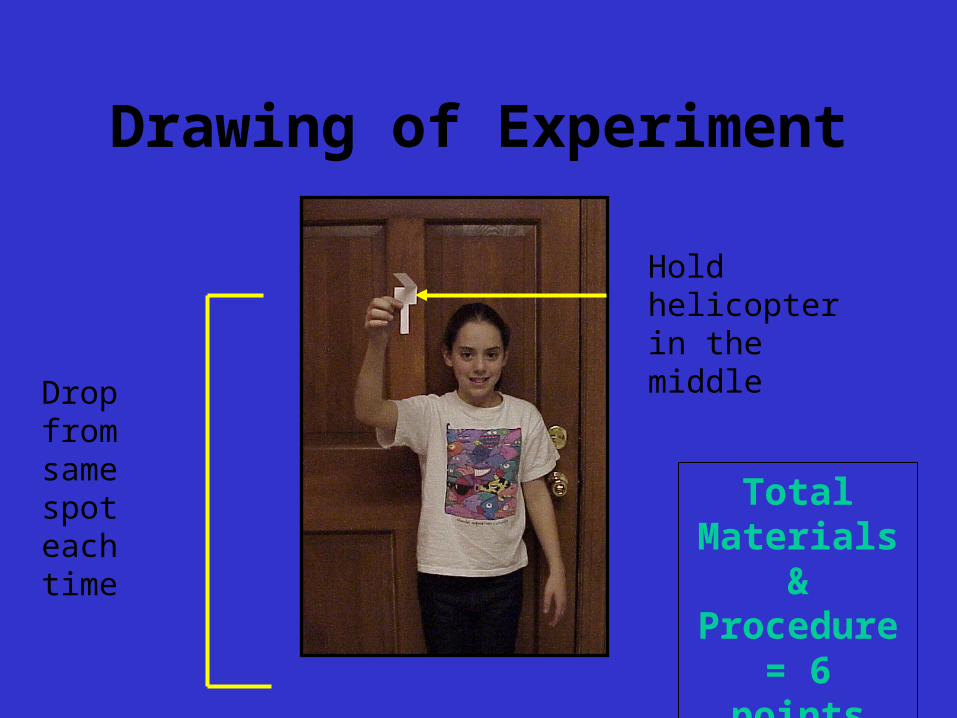
Drawing of Experiment
Hold helicopter in the middle
Drop from same spot each time
Total Materials & Procedure =
6 points
Qualitative Observations and Results
•As we dropped the helicopter, we observed that sometimes they seemed to be affected by air currents.•It appeared that helicopters with longer wingspans took a greater time to reach the ground
4 points
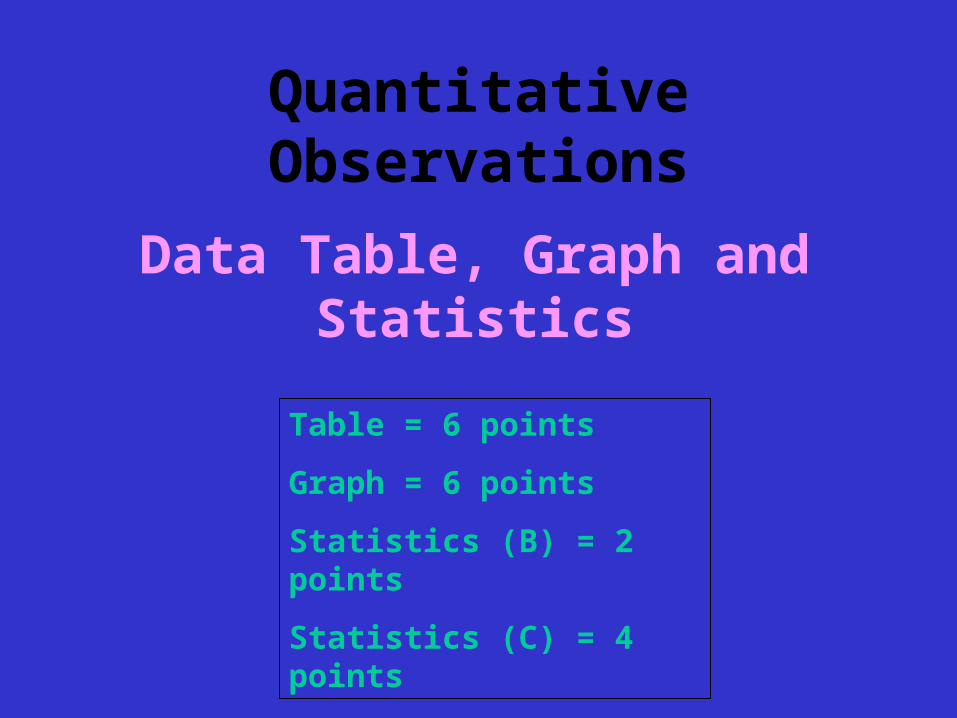
Quantitative Observations
Data Table, Graph and Statistics
Table = 6 points
Graph = 6 points
Statistics (B) = 2 points
Statistics (C) = 4 points
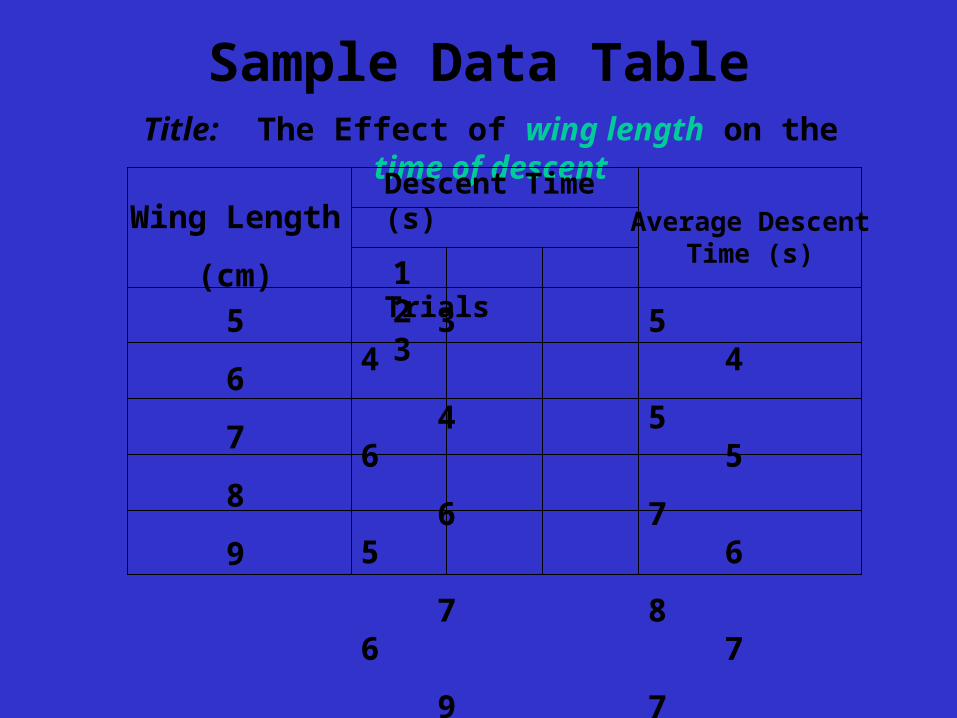
Sample Data TableTitle: The Effect of wing length on the time of descent
Wing Length
(cm)
Average Descent Time (s)
Descent Time (s)
Trials1 2 3
5
6
7
8
9
3 5 4 4
4 5 6 5
6 7 5 6
7 8 6 7
9 7 8 8
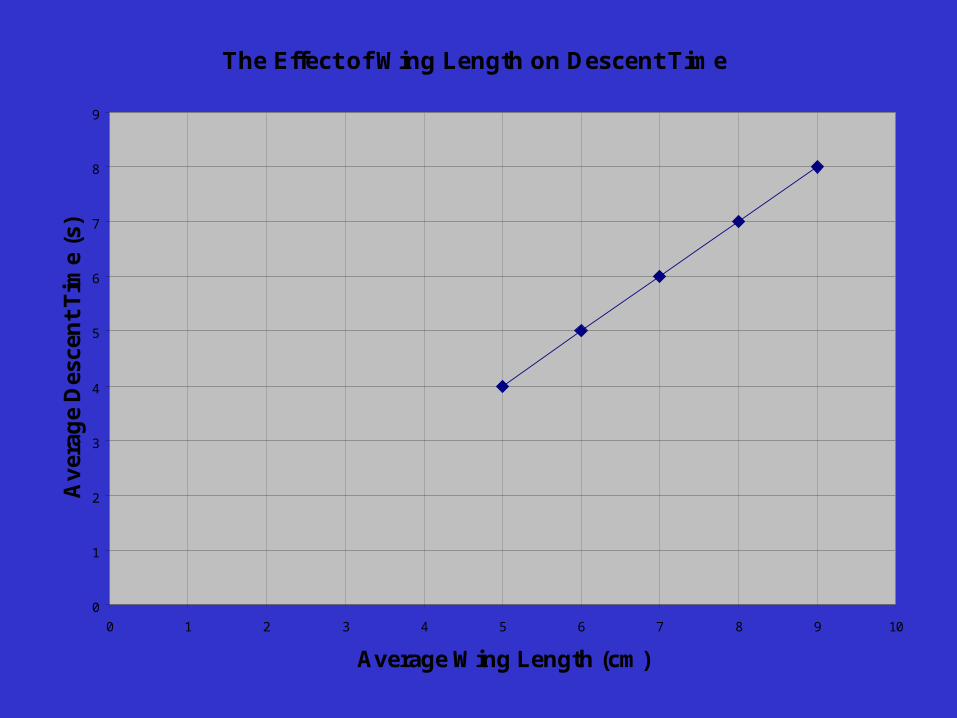
The Effect of Wing Length on Descent Time
0
1
2
3
4
5
6
7
8
9
0 1 2 3 4 5 6 7 8 9 10
Average Wing Length (cm)
Av
erag
e D
esce
nt
Tim
e (s
)
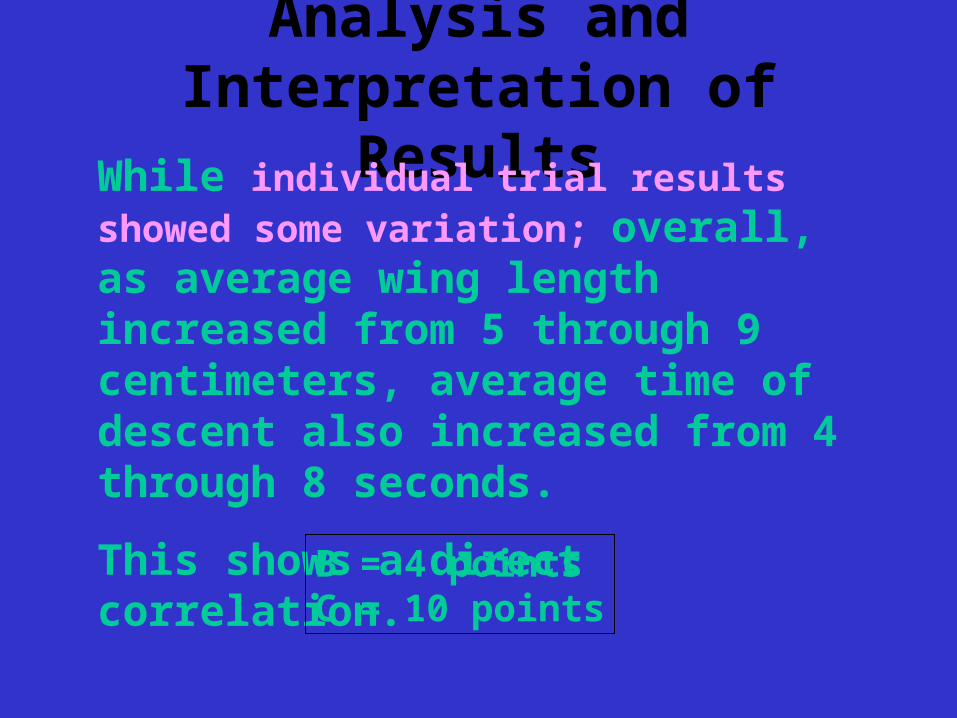
Analysis and Interpretation of Results
While individual trial results showed some variation; overall, as average wing length increased from 5 through 9 centimeters, average time of descent also increased from 4 through 8 seconds.
This shows a direct correlation.
B = 4 pointsC = 10 points
Possible Experimental Errors
Although the average results supported the hypothesis, the individual trial results showed some variation. Some possible reasons for this could be due to air currents in the room or reaction time differences between the timer and the helicopter dropper.
3 points
Conclusion
The overall results supported the hypothesis.
A possible reason for this could be due to increased surface area of the wing in contact with the air - allowing for greater air support.
4 points
Recommendations for Further Experimentation/ Practical Applications
Increased time of descent due to greater wing length suggests that increased wing length could lead to greater fuel efficiency of an actual helicopter.
Other experiments investigating factors that would contribute to greater descent time might include: making modifications in the shape of the wings, changing the number of wing blades, and making folds in the wing blades
4 points