Embed Size (px)
Citation preview

Journal of Chromatography A, 1121 (2006) 99–105
Experimental design considerations in quantification experiments byusing the internal standard technique: Cholesterol determination
by gas chromatography as a case study
Pedro Araujo ∗, Felicia Couillard, Else Leirnes, Kjersti Ask, Annbjørg Bøkevoll, Livar FrøylandNational Institute of Nutrition and Seafood Research (NIFES), P.O. Box 2029 Nordnes, N-5817 Bergen, Norway
Received 27 January 2006; received in revised form 30 March 2006; accepted 31 March 2006Available online 2 May 2006
Abstract
An overview on experimental design in quantification experiments using the internal standard technique is described. Particular emphasis is givento the modelling of the relationship analyte/internal standard and the estimation of the optimal amount of internal standard to be used throughoutthe analytical concentration range by using a uniform shell design with a minimum number of seven experiments. The described approach isdT©
K
1
lcuanfe
R
Tlkifvd
0d
emonstrated in the analysis of cholesterol in various reference materials by gas chromatography (GC), using �-5 cholestan as internal standard.he outlined approaches can be applied in the determination of any kind of analyte.2006 Elsevier B.V. All rights reserved.
eywords: Internal standard; Modelling; Experimental design; Doehlert matrix; Quantification; Cholesterol
. Introduction
The internal standard is a compound different from the ana-yte which is added to the analyzed sample to assist the quantifi-ation process. Regardless of the analytical instrumentation, these of the internal standard technique involves the preparation ofsolution with known concentrations of analyte [A] and inter-al standard [IS], determination of their signal ratio (SA/SIS) andurther determination of a response factor (R) calculated by thexpression:
= SA
SIS× [IS]
[A](1)
he determination of the unknown amount of analyte in a prob-em sample is achieved by spiking the problem sample with anown concentration of internal standard and by solving [A]n Eq. (1), using the calculated R and the appropriate dilutionactors involved in the preparation of the problem sample. Thealidity of Eq. (1) relies on the assumptions of linearity of theetector response towards the analyte and the internal standard,
normality of the data, homoscedasticity of the errors and inde-pendency of residuals.
A wide variety of articles on quantification and use of internalstandard are published every year in different scientific journalsstating that the best internal standard is either an isotopicallylabelled version of the analyte or a compound similar to theanalyte, when an isotopically labelled standard is not available[1]. However, in spite of the number of articles published andthe attention given to the selection of the internal standard lit-tle has been done on how much internal standard should beadded. Traditionally, details on the detector linearity are com-monly described for the analyte alone or in combination with afixed amount of internal standard [2–4], however, no descriptionis given on how to estimate the fixed level of internal standard.In laboratories engaged in the analysis of a single or various ana-lytes presented in samples of diverse nature, where the analytescan have a wide span of concentrations, the determination ofthe response factor R at different levels of analyte and internalstandard is of paramount importance. If we determine the rangeof concentrations of [A] and [IS] where R remains constant, thenproblem samples with unknown concentrations of [A] out of the
∗ Corresponding author. Tel.: +47 55905115; fax: +47 55905299.E-mail address: [email protected] (P. Araujo).
linear range and spiked with known concentrations of [IS] canbe diluted confidently into the range where R does not changewith the concentration of [A] and [IS]. This approach will assist
021-9673/$ – see front matter © 2006 Elsevier B.V. All rights reserved.
oi:10.1016/j.chroma.2006.03.119
100 P. Araujo et al. / J. Chromatogr. A 1121 (2006) 99–105
the analyst in saving time and resources and avoiding furtherpreparation, which is essential when the amount of sample islimited. Comprehensive studies on how simultaneous changesof the analyte and the internal standard affect the response factorR and therefore, the quantification process need to be under-taken. The one-at-the-time methodology, a traditional methodto that effect, is a tedious procedure and the exact behaviourof the relationship SA/SIS can be missed if there is a second-order interaction effect. Although multivariate analysis seemsto be a reliable tool to study the relationship of these factors,works regarding its application are not widespread. This studydescribes a general methodology to calculate the optimal levelsof internal standard in quantification experiments. In particular,the article provides firstly an overview of the various experi-mental designs that can be used in the selection of the optimalamount of internal standard and secondly, the described theoryis applied in the determination of cholesterol in three differ-ent reference materials, namely milk fat, frozen diet and eggpowder.
2. Experimental design in quantification experiments
2.1. General overview
Trial and error methods and rules of thumb techniques aregnbsmctcnabitttabiia
R
R
R
wcaW
standard technique it is expected that first and second order effectcoefficients are negligible in the range of concentrations to bestudied. The characteristics and properties of various experi-mental designs have been studied and summarized in Table 1.The lack of fit of the models is judged by mean of the degrees offreedom, defined in Table 1 as the minimum number of exper-iments minus the number of parameter in the model. The termefficiency (E) [7] which measures the relationship between thenumber of estimated coefficients and the amount of effort putinto the execution of the experiments is defined by the expression
E = number of coefficients
number of experiments(5)
The values of E vary from 0 to 1 and it is clearly evidentfrom Eq. (5) that a model with E = 1 is not desirable due tothe lack of degrees of freedom and a model with E > 1 can-not be fit. In quantification experiments aiming at studying thebehavior of R and the optimal amount of internal standard,values of E lying between 0.40 and 0.60 can be consideredacceptable.
Table 1 shows that from the simplicity point of view a facto-rial design seems an adequate approach to model the effect ofthe two variables with a minimum number of experiments. Thedisadvantages of this design are the few levels of analyte andinternal standard studied and the lack of degree of freedom tojudge the lack of fit when the interaction effect is considered.FtelitebitiipAsTdlatocsidcttsto
enerally used in the estimation of an optimal level of inter-al standard and further calculation of R. For instance, it haseen suggested that the analysis of one or two levels of internaltandard and three levels of analyte is appropriate in order to esti-ate a reliable amount of the former and to build an appropriate
urve of the latter [2,5]. Another approach has been to targethe internal standard to the lower 1/3 of the working standardurve in order to have a level above the limit of quantification butot so high as to overshadow the analytical signal [5,6]. Thesepproaches, although valuable to assess prospectively the num-er of replicas and have a rapid initial guidance of the amount ofnternal standard to be used, do not take into consideration thathe calculated factor R assumes a linear response of the detectoro both analyte and the internal standard. The determination ofhe dependence of these factors is essential. Different modelsnd experimental designs can be analyzed in order to study theehavior of R when [A] and [IS] are varied. The main character-stics and properties of various experimental designs are shownn Table 1. The models described by the different experimentalrrangements are:
= bo + bA[A] + bIS[IS] (2)
= bo + bA[A] + bIS[IS] + bA×IS[A] × [IS] (3)
= bo + bA[A] + bIS[IS] + b2A[A]2 + b2
IS[IS]2
+ bA×IS[A] × [IS] (4)
here bo represents the intercept, bA and bIS the linear termoefficients, bA×IS the first order interaction effect coefficientnd b2
A and b2IS are second order curvature effect coefficients.
hen performing a quantification analysis using the internal
actorial design at three levels, in spite of the various modelshat allow us to study with adequate degrees of freedom andfficiency, is not advisable due to few number of concentrationevels studied compared to the relative high number of exper-ments performed. Simplex design is the worst alternative dueo the lack of degree of freedom when a minimum number ofxperiments is considered. Star design offers a reasonable num-er of experiments, concentration levels and degrees of freedomf the main goal is to investigate the model described by Eq. (2),heir main disadvantage is that they cannot estimate first ordernteraction effects but only second order curvature effects, caus-ng that the term bA×IS is zeroed in Eq. (4), which in turn canroduce a failure in the model if this particular term is relevant.
central composite design overcomes with the problem pre-ented by the star design by adding four factorial experiments.his kind of design provides the same efficiency than a factorialesign at three levels but with a major number of concentrationevels. Uniform shell design, specifically a Doehlert matrix [8],llows us to study the same number of models than the cen-ral composite design with a relative well equilibrated numberf experiments and concentration levels. This design allows thealculation of a response surface with a minimum number ofeven experiments, allocated in a regular hexagon with a pointn the center (Fig. 1A). One of the most salient features of thisesign is its equally spaced distribution of experimental pointsircumscribed in a circle (for two variables) of radius one, inhis way the design generates information equally in all direc-ions, for instance the variance of the estimated response is theame at all points on the circle centred at the origin. In addi-ion, it is possible to extend the experimental matrix and studyther experimental arrangements by using previous experiments
P. Araujo et al. / J. Chromatogr. A 1121 (2006) 99–105 101
Table 1Main characteristics of the various experimental designs discussed in this article
Design Type General experimentalarrangement
Minimum number ofexperiments forN = 2 variables
Number of[A] levels
Number of[IS] levels
Model Degrees offreedom
Efficiency
Factorial
2 Levels 2N = 4 exp 2 2 Eq. (2) 1 0.75Eq. (3) 0 1
3 Levels 3N = 9 exp 3 3 Eq. (2) 6 0.33Eq. (3) 5 0.44Eq. (4) 3 0.67
Sequential Simplex N + 1 = 3 exp 3 3 Eq. (2) 0 1
Simultaneous
Star 2N + 1 = 5 exp 3 3 Eq. (2) 2 0.60Eq. (4)a 0 1
Central composite 2N + 2N + 1 = 9 exp 5 5 Eq. (2) 6 0.33Eq. (3) 5 0.44Eq. (4) 3 0.67
Uniform shell 2N + N + 1 = 7 exp 3 5 Eq. (2) 4 0.43Eq. (3) 3 0.57Eq. (4) 1 0.86
[A]: analyte; [IS]: internal standard.a bA×IS = 0.
(Fig. 1B). A uniform shell design is especially useful in situa-tions where there is little a priori knowledge of the form of thetrue regression function.
2.2. Number of replications
In quantification experiments, where the preparation error isalways larger than the instrumental error, the use of replicates isessential in order to decrease the associated error providing that
precautions such as randomization have been taken to ensurethat one level of concentration is no more likely to be favouredin any replicate than another, so that the errors affecting any levelcancel out as the number of replications is increased. The uncer-tainty of an experimental design is influenced by the number ofreplicates, so it is important to determine in advance the num-ber of replicates. A classical method for predicting the numberof replicates (Ji) per concentration levels (i) when the standarderror (SE) is known from previous experiments has been pro-

102 P. Araujo et al. / J. Chromatogr. A 1121 (2006) 99–105
Fig. 1. Doehlert design used for the study of two variables. (A) Spatial distri-bution of the experimental points; (B) extension of the initial matrix by usingprevious adjacent points; (C) generation of the experimental points.
posed by Cochran and Cox [9]. According to this approach andin the frame of a quantification experiment using the internalstandard technique, the confidence limits (δ) for the mean value(R̄) are given by the equation
δ = R̄ ±(√
2
Ji
× so × t
)= R̄ ± L (6)
so is the overall standard deviation, t the value in the t-tablecorresponding to the confidence probability (95%) at a given Ji
and the quantity in round brackets represents the limit of errorL. The relationship between the standard error and so is givenby the equation:
SE = so
R̄ × √Ji
× 100 (7)
By knowing SE and calculating and expressing L as a per-cent of the mean (L% = (L/R) × 100) it is possible to deter-mine the number of replicates by consulting the Cochran andCox tables.
It must be mentioned that this is not the only method to cal-culate the number of replicates. Different approaches have beenstudied in this respect. For instance, the visualization of the con-fidence bands as a function of a parameter called leverage and thenumber of replicates, has been a valuable methodology when theanalyst does not have a previous estimate of the standard error[10].
3. Application
3.1. Stating the goal
The intended purpose of an experiment was to developa method for the determination of cholesterol in milk fat,frozen diet and egg powder reference materials using �-5cholestan as internal standard and gas chromatography (GC)as instrumental technique. It was decided to determine theoptimal level of internal standard due to the different con-centrations of cholesterol in the various reference materials.Changes in the cholesterol/cholestan signal ratio and the robust-ness of the response factor R as a result of simultaneous vari-ations of both compounds (cholesterol and cholestan) wereanalysed.
3.2. Instrumental conditions
tEpwHsthrrf
3
sbaoec0ivaai0ca
A Thermo Trace 2000 GC equipped with a flame ioniza-ion detector (FID) was used. The samples were separated onquity-5 column (30 m × 0.25 mm) from Supelco coated witholysiloxane (5% diphenyl, 95% dimethyl), low-bleed. Heliumas employed as carrier gas at a linear velocity 1.5 ml/min.ydrogen and compressed air were used for the FID. A
plit/splitless injector was used under splitless mode. The injec-or volume was 0.6 �l. The column temperature was initiallyeld at 65 ◦C for 1 min, then ramped up from 65 to 270 ◦C at aate of 45 ◦C/min, with a final hold time of 30 min. Chromatog-aphy peak areas were used for the calculations of the responseactors and calibration curves.
.3. Stating the model
Based on the observations derived from Table 1, a uniformhell design seems to be the best alternative to investigate theehaviour of the response factor when cholesterol and cholestanre varied simultaneously and to determine the optimal levelsf internal standard. Fig. 1C shows how this design is gen-rated for two variables by establishing five equally spacedoded levels for variable 1 between −1 and 1 (−1, −0.5, 0,.5, 1) circumscribed in a circle of radius one and by solv-ng Pythagoras the three coded levels (−0.866, 0, 0.866) forariable 2 are determined. Table 2 shows how the coded vari-bles 1 and 2 are converted into natural variables cholestannd cholesterol, respectively and the coded levels convertedn natural levels in mg/ml units. The concentration range.01–0.5 mg/ml was selected taking into account the theoreti-al levels of cholesterol in the various reference materials to benalysed.
P. Araujo et al. / J. Chromatogr. A 1121 (2006) 99–105 103
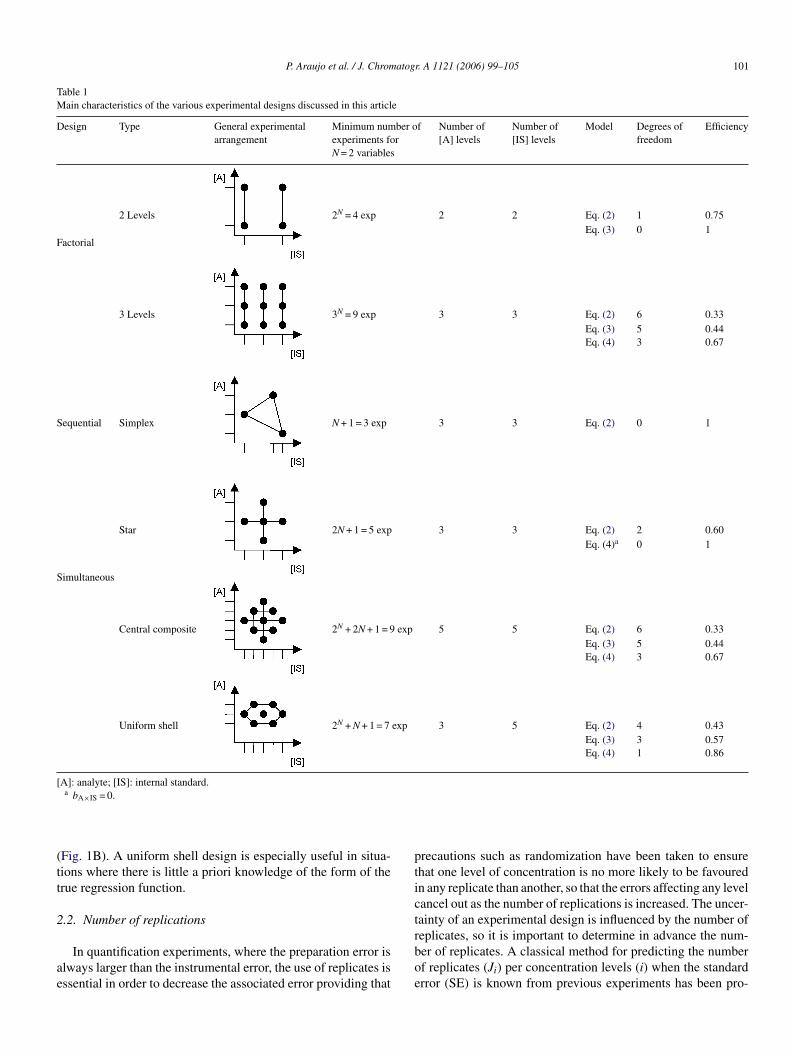
Table 2Experimental concentration ranges selected according to a Doehlert matrix and used to estimate the response factors at each experimental point
Experimental point according to Fig. 1C �-5 Cholestane (mg/ml) Cholesterol (mg/ml) Response factor (R)
0.169 0.4670.76/0.770.68/0.670.78/0.77
0.5 0.0430.61/0.600.80/0.77nr/nr
0.003 0.2550.65/0.670.65/0.710.75/0.74
0.667 0.2550.88/0.890.92/0.920.84/0.85
0.5 0.4670.81/0.810.82/0.820.78/0.77
0.169 0.0430.82/0.810.67/nr0.67/0.66
0.335 0.2550.85/0.850.88/0.880.79/0.77
nr: not recorded.
3.4. Stating the number of replicates per concentrationlevel
Preliminary studies in our laboratory by using two differ-ent concentrations of cholesterol and a fixed concentration ofcholestan estimated an average response factor R̄ of 0.761 witha standard deviation of 0.033. These results were obtained bypreparing triplicates (Ji = 3) mixtures of cholesterol/cholestan ateach level. By substituting the previous values into Eqs. (6) and(7) a limit of error as a percent of the mean (L%) and a stan-dard error of 9.82 and 2.50% were calculated, respectively. Itmust be mentioned that a t-value of 2.776 was used in the previ-
ous calculation, corresponding to four degrees of freedom (twotriplicate mixtures cholesterol/cholestan). Consulting the entryL% = 9.82%, SE = 2.50%, in the tables provided by Cochran, inorder to determine the number of replicates required for givenlimits of error, it was found that two replicates are sufficient fora confidence probability of 95%. An extra replicate was addedto those estimated from Cochran’s tables giving a total of threereplicates at each experimental point of the Doehlert matrix, inorder to comply with the practical guidance of analytical valida-tion [11], which suggests a minimum number of three replicatesin order to judge statistically the acceptability of the analyticalresults.
104 P. Araujo et al. / J. Chromatogr. A 1121 (2006) 99–105
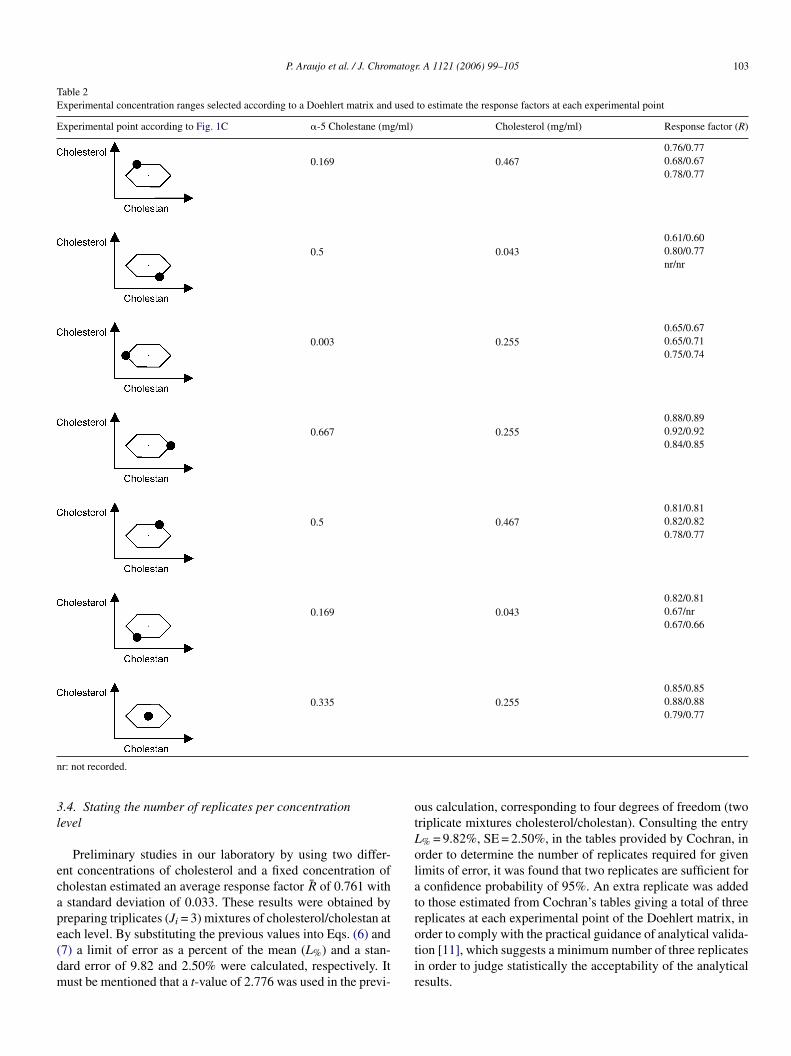
Table 3Estimated concentration of cholesterol at 0.003 mg/ml cholestane using differentresponse factors
Response factor Cholesterol found (mg/ml) Difference (%)
0.68 0.250 1.80.72 0.236 7.30.76 0.224 12.20.80 0.213 16.60.84 0.203 20.50.88 0.193 24.1
Cholesterol true value 0.255 mg/ml; Cholesterol/cholestan signal ratio 56.74.
4. Results and discussion
A total of seven mixtures of cholesterol and cholestanwere prepared in triplicate according to the Doehlert designdescribed above and measured twice randomly. The calcu-lated response factors at each concentration levels (Table 2)were analysed as a function of the concentration of choles-terol and cholestan. The various models described above werestudied and the four parameters model defined by Eq. (3)was considered adequate to generate a response surface thatallows visualising and estimating the optimal concentration ofcholestan to be added in the cholesterol concentration rangeof 0.01–0.50 mg/ml. Fig. 2 shows that in the whole cholesterolanalytical range, robust response factors of 0.68 and 0.72 areobtained when the concentration of cholestan is varied between0.003–0.08 and 0.17–0.21 mg/ml, respectively. Concentrationsof cholestan higher than 0.21 mg/ml bring about a reduction inthe dynamic analytical range. For instance, when the concen-tration of cholestan is 0.38 mg/ml, three response factors (0.72,0.76 and 0.80) are obtained at three different cholesterol con-centration ranges (0.01–0.11, 0.12–0.38 and 0.39–0.5 mg/ml).The curvatures observed in Fig. 2 are direct consequence ofthe interaction between analyte–internal standard which is over-looked generally in quantification experiments and affect theaccuracy of the determination. For instance, a solution con-taining 0.255 and 0.003 mg/ml of cholesterol and cholestane,rtm6
Fc
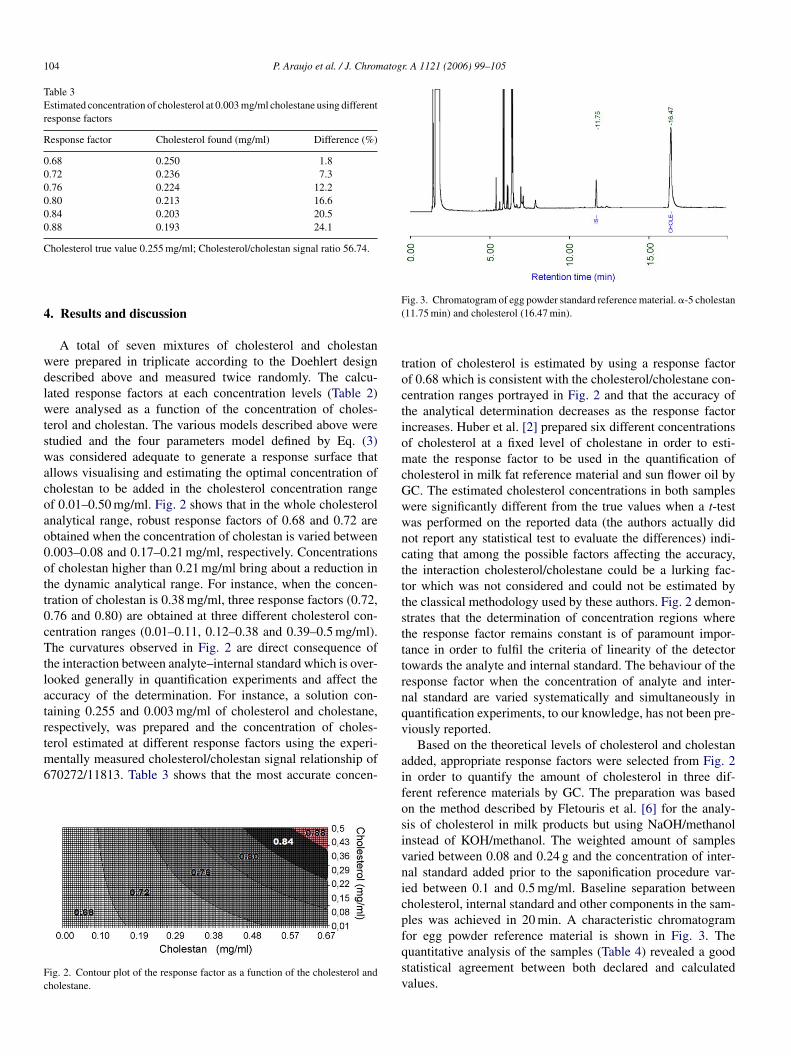
Fig. 3. Chromatogram of egg powder standard reference material. �-5 cholestan(11.75 min) and cholesterol (16.47 min).
tration of cholesterol is estimated by using a response factorof 0.68 which is consistent with the cholesterol/cholestane con-centration ranges portrayed in Fig. 2 and that the accuracy ofthe analytical determination decreases as the response factorincreases. Huber et al. [2] prepared six different concentrationsof cholesterol at a fixed level of cholestane in order to esti-mate the response factor to be used in the quantification ofcholesterol in milk fat reference material and sun flower oil byGC. The estimated cholesterol concentrations in both sampleswere significantly different from the true values when a t-testwas performed on the reported data (the authors actually didnot report any statistical test to evaluate the differences) indi-cating that among the possible factors affecting the accuracy,the interaction cholesterol/cholestane could be a lurking fac-tor which was not considered and could not be estimated bythe classical methodology used by these authors. Fig. 2 demon-strates that the determination of concentration regions wherethe response factor remains constant is of paramount impor-tance in order to fulfil the criteria of linearity of the detectortowards the analyte and internal standard. The behaviour of theresponse factor when the concentration of analyte and inter-nal standard are varied systematically and simultaneously inquantification experiments, to our knowledge, has not been pre-viously reported.
Based on the theoretical levels of cholesterol and cholestanadded, appropriate response factors were selected from Fig. 2ifosivnicpfqsv
espectively, was prepared and the concentration of choles-erol estimated at different response factors using the experi-
entally measured cholesterol/cholestan signal relationship of70272/11813. Table 3 shows that the most accurate concen-
ig. 2. Contour plot of the response factor as a function of the cholesterol andholestane.
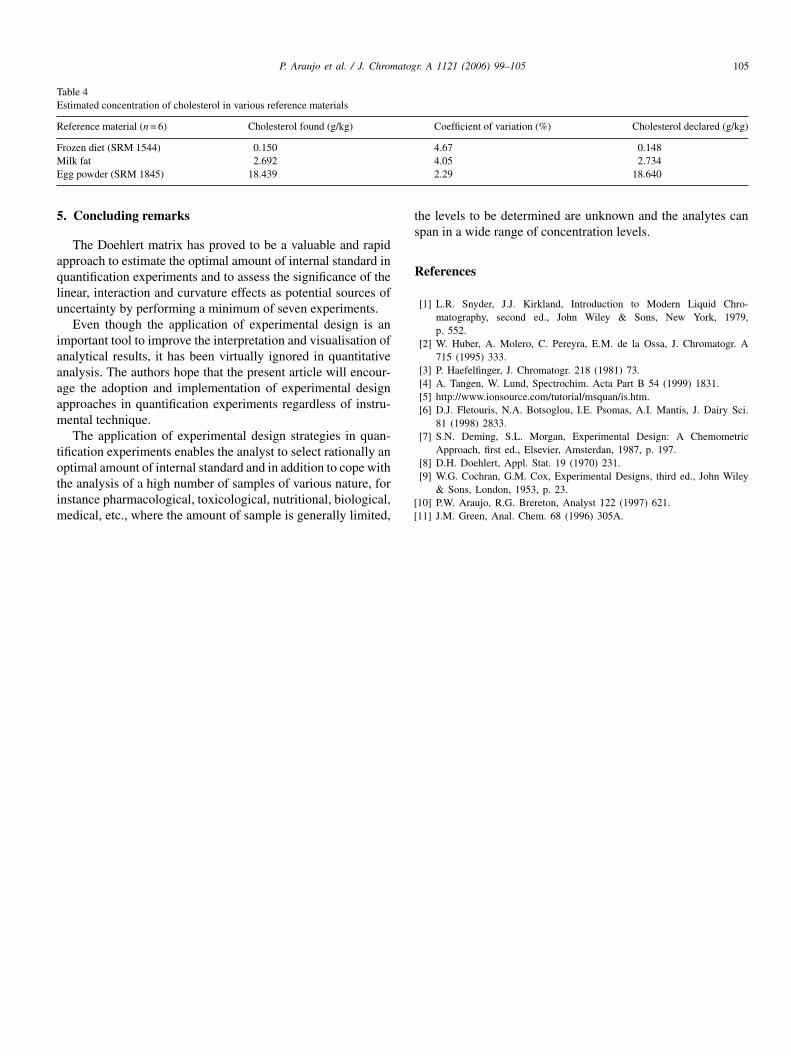
n order to quantify the amount of cholesterol in three dif-erent reference materials by GC. The preparation was basedn the method described by Fletouris et al. [6] for the analy-is of cholesterol in milk products but using NaOH/methanolnstead of KOH/methanol. The weighted amount of samplesaried between 0.08 and 0.24 g and the concentration of inter-al standard added prior to the saponification procedure var-ed between 0.1 and 0.5 mg/ml. Baseline separation betweenholesterol, internal standard and other components in the sam-les was achieved in 20 min. A characteristic chromatogramor egg powder reference material is shown in Fig. 3. Theuantitative analysis of the samples (Table 4) revealed a goodtatistical agreement between both declared and calculatedalues.
P. Araujo et al. / J. Chromatogr. A 1121 (2006) 99–105 105
Table 4Estimated concentration of cholesterol in various reference materials
Reference material (n = 6) Cholesterol found (g/kg) Coefficient of variation (%) Cholesterol declared (g/kg)
Frozen diet (SRM 1544) 0.150 4.67 0.148Milk fat 2.692 4.05 2.734Egg powder (SRM 1845) 18.439 2.29 18.640
5. Concluding remarks
The Doehlert matrix has proved to be a valuable and rapidapproach to estimate the optimal amount of internal standard inquantification experiments and to assess the significance of thelinear, interaction and curvature effects as potential sources ofuncertainty by performing a minimum of seven experiments.
Even though the application of experimental design is animportant tool to improve the interpretation and visualisation ofanalytical results, it has been virtually ignored in quantitativeanalysis. The authors hope that the present article will encour-age the adoption and implementation of experimental designapproaches in quantification experiments regardless of instru-mental technique.
The application of experimental design strategies in quan-tification experiments enables the analyst to select rationally anoptimal amount of internal standard and in addition to cope withthe analysis of a high number of samples of various nature, forinstance pharmacological, toxicological, nutritional, biological,medical, etc., where the amount of sample is generally limited,
the levels to be determined are unknown and the analytes canspan in a wide range of concentration levels.
References
[1] L.R. Snyder, J.J. Kirkland, Introduction to Modern Liquid Chro-matography, second ed., John Wiley & Sons, New York, 1979,p. 552.
[2] W. Huber, A. Molero, C. Pereyra, E.M. de la Ossa, J. Chromatogr. A715 (1995) 333.
[3] P. Haefelfinger, J. Chromatogr. 218 (1981) 73.[4] A. Tangen, W. Lund, Spectrochim. Acta Part B 54 (1999) 1831.[5] http://www.ionsource.com/tutorial/msquan/is.htm.[6] D.J. Fletouris, N.A. Botsoglou, I.E. Psomas, A.I. Mantis, J. Dairy Sci.
81 (1998) 2833.[7] S.N. Deming, S.L. Morgan, Experimental Design: A Chemometric
Approach, first ed., Elsevier, Amsterdan, 1987, p. 197.[8] D.H. Doehlert, Appl. Stat. 19 (1970) 231.[9] W.G. Cochran, G.M. Cox, Experimental Designs, third ed., John Wiley
& Sons, London, 1953, p. 23.[10] P.W. Araujo, R.G. Brereton, Analyst 122 (1997) 621.[11] J.M. Green, Anal. Chem. 68 (1996) 305A.