Embed Size (px)
Citation preview
Experimental approach to estimate species concentrations in a compartment fire
J. LASSUS1, L. COURTY1,*, E. STUDER2, J.P. GARO1, P. JOURDA3, P. AINE4
1 Institut P’, CNRS, ENSMA, Université de Poitiers, 1 Av. Clément Ader, Téléport 2, BP 40109, 86961 Futuroscope Chasseneuil, France. 2 Commissariat à l’Energie Atomique, DEN/DANS/DM2S/SFME/LTMF, CEA de Saclay, 91191 Gif-sur-Yvette Cedex, France. 3 Commissariat à l’Energie Atomique, CEA/PMR/DPSN, CEA de Fontenay-aux-Roses, BP 6, 92265 Fontenay-aux-Roses Cedex, France. 4 AREVA NC, 33 Rue la Fayette, 75442 Paris Cedex 09, France.
ABSTRACT
An approach for estimating species concentration during a fire in a well-stirred compartment is
investigated. A semi-empirical model based on oxygen concentration is used. It gives an estimate of the
concentrations of carbon monoxide, carbon dioxide, hydrogen and hydrocarbons with a carbon chain length
lower than five. Three intervals of oxygen concentration are noticed, they correspond to sufficiently
ventilated, underventilated and very underventilated fires. In order to validate this model, fire experiments
are performed in a reduced-scale compartment . Species concentrations predicted by the model are in good
agreement with our experimental data and with those of literature. Coefficients used for the model are
obtained for heptane and dodecane fires.
KEYWORDS: compartment fires; heat release rate; species concentration; reduced-scale; fire
experiments.
NOMENCLATURE
ACPH Air Change Per Hour
D Fire diameter (m)
2Of Normalized oxygen yield
Fr Froude number
g Acceleration of gravity (m s-2
)
h Fuel height in the pan (m)
ik Theoretical maximum mass yield of the species i
L Characteristic length (m)
LFL Lower Flammability Limit (% vol.)
n Number of moles (mol)
M Molecular weight (g mol-1
)
m Burning rate per unit area (kg m-2
s-1
)
MOC Minimum Oxygen Concentration of fuel (% vol.)
Q Heat release rate (kJ s-1)
S Fuel pan surface area (m²)
t Time (s)
T Temperature (K)
u Gas velocity (m s-1)
FIRE SAFETY SCIENCE-PROCEEDINGS OF THE ELEVENTH INTERNATIONAL SYMPOSIUM pp. 346-360 COPYRIGHT © 2014 INTERNATIONAL ASSOCIATION FOR FIRE SAFETY SCIENCE/ DOI: 10.3801/IAFSS.FSS.11-346
346
iY Mass yield of the species i
cH Heat of combustion (J kg-1)
Global Equivalence Ratio (GER)
INTRODUCTION
The calculation of species concentration has often been made using Global Equivalence Ratio Φ (GER)
concept, which is defined as the fuel mass flow to the air entrainment mass flow into the plume, normalized
by the stoichiometric ratio of fuel to air. Beyler [1], Cetegen [2], Toner et al. [3] and Morehart et al. [4]
have studied oxygen, carbon monoxide and other species yields as a function of global equivalence ratio
during hood experiments. It was found that, during sufficiently ventilated fires (Φ < 1), oxygen yield is
maximal and unburnt gas levels are low. A very underventilated fire is a fire that can stop by lack of
oxygen. The heat release rate generally presents a noisy evolution (because the fire is close to extinction)
and the production of unburnt species is important.When the fire becomes underventilated, unburnt gases
increase following a 1/Φ law. Pitts [5] has summarized a large number of these investigations. These
experiments were designed to easily determine species yields and GER thanks to the steady-state nature of
the hood experiments and the use of a burner. More recently, Hu et al. [6] have considered and adapted
current combustion models to study the emissions of carbon monoxide and unburnt hydrocarbon mass in a
compartment fire. Their model was tested for different fire room global equivalence ratios.
Experimental studies were performed in order to determine the validation of GER concept for realistic fire
compartment. In this way, Gottuk et al [7] performed investigations in an ideal two-layer zone
compartment and Bryner et al. [8] and Wieczorek [9] in more realistic reduced scale rooms. Gottuk et al.
[7] showed that carbon monoxide production depends on the compartment flow dynamics and on the
Global Equivalence Ratio. Similar tendencies were found by Beyler [1] but with higher carbon monoxide
yield and lower carbon dioxide yield due to the differences of upper layer temperatures between these two
types of experiments.
However, there are significant differences between phenomena encountered with upper layer environment
and during fires in a compartment. In this way, Pitts [5] has studied the application of the Global
Equivalence Ratio concept to the prediction of combustion gas species during enclosures fires. He has
shown that the use of GER is inappropriate at intermediate temperatures ranging between 700 and 900 K.
Moreover, Gottuk et al. [10] have underlined the fact that carbon monoxide production during a
compartment fire as a function of GER is dependent on temperature. Beyler [1] and Tewarson [11] have
also shown that the carbon monoxide yield depends on the fuel but is correlated to the fuel type.
There are not many works in the literature dealing experimentally with species concentrations during
confined and mechanically ventilated fires. In this work, an approach for estimating species concentrations
during a fire in a compartment (considered as a well-stirred reactor) is carried out using oxygen
concentration in a fire room. This latter is obtained using the global equivalence ratio. This approach is
semi-empirical and allows the estimation of oxygen, carbon monoxide, carbon dioxide, hydrogen and total
hydrocarbon concentrations. It is based on fire tests performed in a 8-cubic-meter compartment with two
fuels: heptane and dodecane and during ICFMP [12] heptane fire tests. A comparison between species
concentrations measured during heptane fires in the 8-cubic-meter compartment and corresponding model
predictions is also made to validate this model.
EXPERIMENTAL SECTION
The experimental device consists in a 8-cubic-meter room-test scaled from a 100-cubic-meter
compartment. The Froude scaling technique has been widely used in reduced scale fire experiments [13]
and this technique has been adopted in this work. The compartment has therefore been scaling maintaining
the Froude number ( Fr = u2 / gL) constant. The Reynolds number is large enough to ensure the turbulence
of the flow. Walls are made of reinforced concrete. Scaling heat release rate (HRR) imposes the
FIRE SAFETY SCIENCE-PROCEEDINGS OF THE ELEVENTH INTERNATIONAL SYMPOSIUM pp. 346-360 COPYRIGHT © 2014 INTERNATIONAL ASSOCIATION FOR FIRE SAFETY SCIENCE/ DOI: 10.3801/IAFSS.FSS.11-346
347
preservation of the quantity 2 5/Q L [14]. The powers tested are lower than 130 kW, which corresponds to a
maximum HRR of 1 MW at full scale. Details on the derivation of the scaling laws can be found in [15].
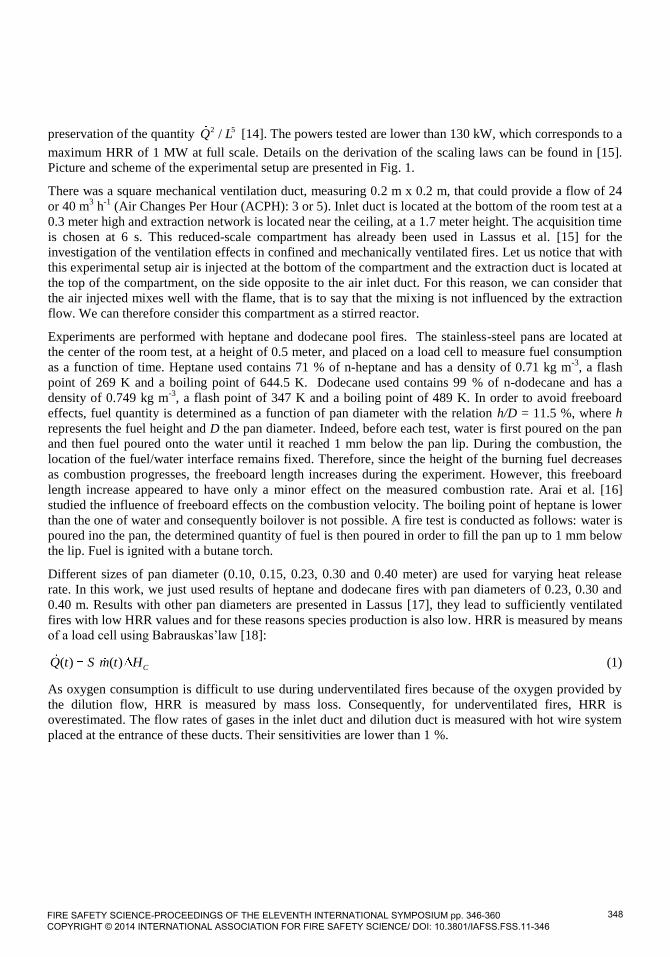
Picture and scheme of the experimental setup are presented in Fig. 1.
There was a square mechanical ventilation duct, measuring 0.2 m x 0.2 m, that could provide a flow of 24
or 40 m3 h
-1 (Air Changes Per Hour (ACPH): 3 or 5). Inlet duct is located at the bottom of the room test at a
0.3 meter high and extraction network is located near the ceiling, at a 1.7 meter height. The acquisition time
is chosen at 6 s. This reduced-scale compartment has already been used in Lassus et al. [15] for the
investigation of the ventilation effects in confined and mechanically ventilated fires. Let us notice that with
this experimental setup air is injected at the bottom of the compartment and the extraction duct is located at
the top of the compartment, on the side opposite to the air inlet duct. For this reason, we can consider that
the air injected mixes well with the flame, that is to say that the mixing is not influenced by the extraction
flow. We can therefore consider this compartment as a stirred reactor.
Experiments are performed with heptane and dodecane pool fires. The stainless-steel pans are located at
the center of the room test, at a height of 0.5 meter, and placed on a load cell to measure fuel consumption
as a function of time. Heptane used contains 71 % of n-heptane and has a density of 0.71 kg m-3
, a flash
point of 269 K and a boiling point of 644.5 K. Dodecane used contains 99 % of n-dodecane and has a
density of 0.749 kg m-3
, a flash point of 347 K and a boiling point of 489 K. In order to avoid freeboard
effects, fuel quantity is determined as a function of pan diameter with the relation h/D = 11.5 %, where h
represents the fuel height and D the pan diameter. Indeed, before each test, water is first poured on the pan
and then fuel poured onto the water until it reached 1 mm below the pan lip. During the combustion, the
location of the fuel/water interface remains fixed. Therefore, since the height of the burning fuel decreases
as combustion progresses, the freeboard length increases during the experiment. However, this freeboard
length increase appeared to have only a minor effect on the measured combustion rate. Arai et al. [16]
studied the influence of freeboard effects on the combustion velocity. The boiling point of heptane is lower
than the one of water and consequently boilover is not possible. A fire test is conducted as follows: water is
poured ino the pan, the determined quantity of fuel is then poured in order to fill the pan up to 1 mm below
the lip. Fuel is ignited with a butane torch.
Different sizes of pan diameter (0.10, 0.15, 0.23, 0.30 and 0.40 meter) are used for varying heat release
rate. In this work, we just used results of heptane and dodecane fires with pan diameters of 0.23, 0.30 and
0.40 m. Results with other pan diameters are presented in Lassus [17], they lead to sufficiently ventilated
fires with low HRR values and for these reasons species production is also low. HRR is measured by means
of a load cell using Babrauskas’law [18]:
( ) ( ) CQ t S m t H (1)
As oxygen consumption is difficult to use during underventilated fires because of the oxygen provided by
the dilution flow, HRR is measured by mass loss. Consequently, for underventilated fires, HRR is
overestimated. The flow rates of gases in the inlet duct and dilution duct is measured with hot wire system
placed at the entrance of these ducts. Their sensitivities are lower than 1 %.
FIRE SAFETY SCIENCE-PROCEEDINGS OF THE ELEVENTH INTERNATIONAL SYMPOSIUM pp. 346-360 COPYRIGHT © 2014 INTERNATIONAL ASSOCIATION FOR FIRE SAFETY SCIENCE/ DOI: 10.3801/IAFSS.FSS.11-346
348
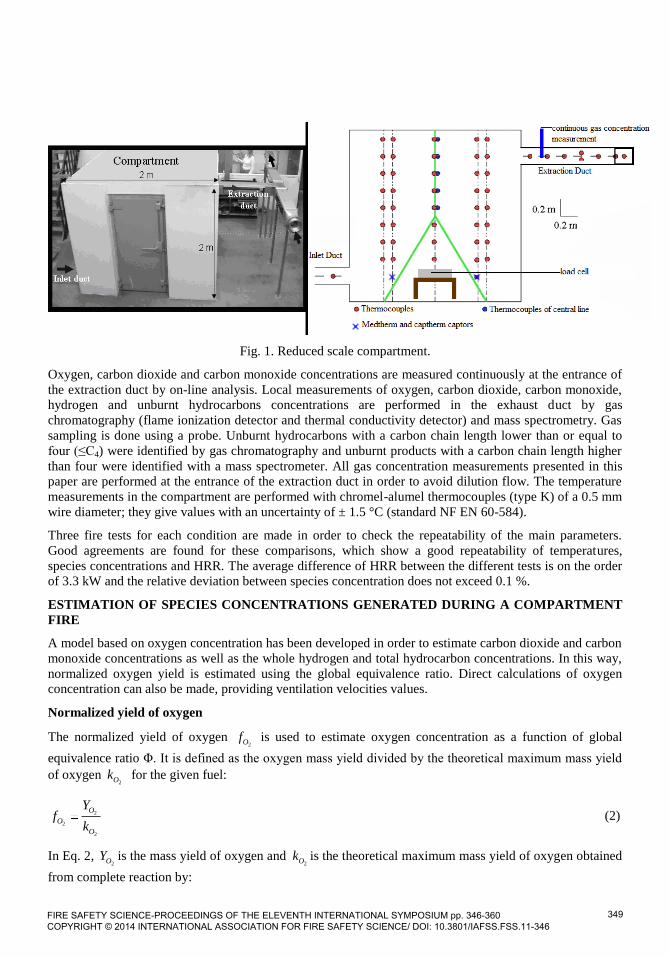
Fig. 1. Reduced scale compartment.
Oxygen, carbon dioxide and carbon monoxide concentrations are measured continuously at the entrance of
the extraction duct by on-line analysis. Local measurements of oxygen, carbon dioxide, carbon monoxide,
hydrogen and unburnt hydrocarbons concentrations are performed in the exhaust duct by gas
chromatography (flame ionization detector and thermal conductivity detector) and mass spectrometry. Gas
sampling is done using a probe. Unburnt hydrocarbons with a carbon chain length lower than or equal to
four (≤C4) were identified by gas chromatography and unburnt products with a carbon chain length higher
than four were identified with a mass spectrometer. All gas concentration measurements presented in this
paper are performed at the entrance of the extraction duct in order to avoid dilution flow. The temperature
measurements in the compartment are performed with chromel-alumel thermocouples (type K) of a 0.5 mm
wire diameter; they give values with an uncertainty of ± 1.5 °C (standard NF EN 60-584).
Three fire tests for each condition are made in order to check the repeatability of the main parameters.
Good agreements are found for these comparisons, which show a good repeatability of temperatures,
species concentrations and HRR. The average difference of HRR between the different tests is on the order
of 3.3 kW and the relative deviation between species concentration does not exceed 0.1 %.
ESTIMATION OF SPECIES CONCENTRATIONS GENERATED DURING A COMPARTMENT
FIRE
A model based on oxygen concentration has been developed in order to estimate carbon dioxide and carbon
monoxide concentrations as well as the whole hydrogen and total hydrocarbon concentrations. In this way,
normalized oxygen yield is estimated using the global equivalence ratio. Direct calculations of oxygen
concentration can also be made, providing ventilation velocities values.
Normalized yield of oxygen
The normalized yield of oxygen 2Of is used to estimate oxygen concentration as a function of global
equivalence ratio Φ. It is defined as the oxygen mass yield divided by the theoretical maximum mass yield
of oxygen 2Ok for the given fuel:
2
2
2
O
O
O
Yf
k (2)
In Eq. 2, 2OY is the mass yield of oxygen and
2Ok is the theoretical maximum mass yield of oxygen obtained
from complete reaction by:
FIRE SAFETY SCIENCE-PROCEEDINGS OF THE ELEVENTH INTERNATIONAL SYMPOSIUM pp. 346-360 COPYRIGHT © 2014 INTERNATIONAL ASSOCIATION FOR FIRE SAFETY SCIENCE/ DOI: 10.3801/IAFSS.FSS.11-346
349
2 2
2
.
.
O O
O
fuel fuel
n Mk
n M (3)
Fig. 2. Normalized oxygen yield as a function of global equivalence ratio for heptane fires at reduced scale.
Comparison with Lower Limit Model and Beyler’s model.
Assuming that there is no air accumulation in the compartment, the evolution of normalized oxygen yield is
presented in Fig. 2 as function of the global equivalence ratio for heptane fires performed in the reduced
scale room with pans of diameter of 0.23 and 0.30 meter, at 3 and 5 Air Change Per Hour (ACPH).
Maximum HRR for 5 ACPH is found at 50 kW for a pan diameter of 0.23 m and at 150 kW for a pan
diameter of 0.30 m. We can see in Fig. 2 that during sufficiently ventilated conditions, the normalized yield
of oxygen is approximately equal to one. This shows a nearly complete reaction. It decreases with the
increase of underventilated conditions. Evolutions are similar whatever the ventilation flow and the pan
diameter are, which show that normalized oxygen yields are independent from the pan diameter size. For
each condition applied, two curves are formed that respectively correspond to the oxygen depletion during
fire and the oxygen increase at the extinction. Beyler’s model is also represented for heptane in Fig. 2. It
considers that normalized oxygen yield is equal to one during sufficiently ventilated fire (Φ < 1) and that its
evolution is 2
1Of for Φ > 1, that is to say for underventilated conditions. Comparing this method with
experimental results, Beyler’s model gives an upper limit of the normalized yield of oxygen during
underventilated conditions. Beyler’s model is presented in [1]. A model has been developed in order to
obtain a lower limit of this normalized yield that is given by the equation:
2
2
1
.O
O
fk
(4)
FIRE SAFETY SCIENCE-PROCEEDINGS OF THE ELEVENTH INTERNATIONAL SYMPOSIUM pp. 346-360 COPYRIGHT © 2014 INTERNATIONAL ASSOCIATION FOR FIRE SAFETY SCIENCE/ DOI: 10.3801/IAFSS.FSS.11-346
350
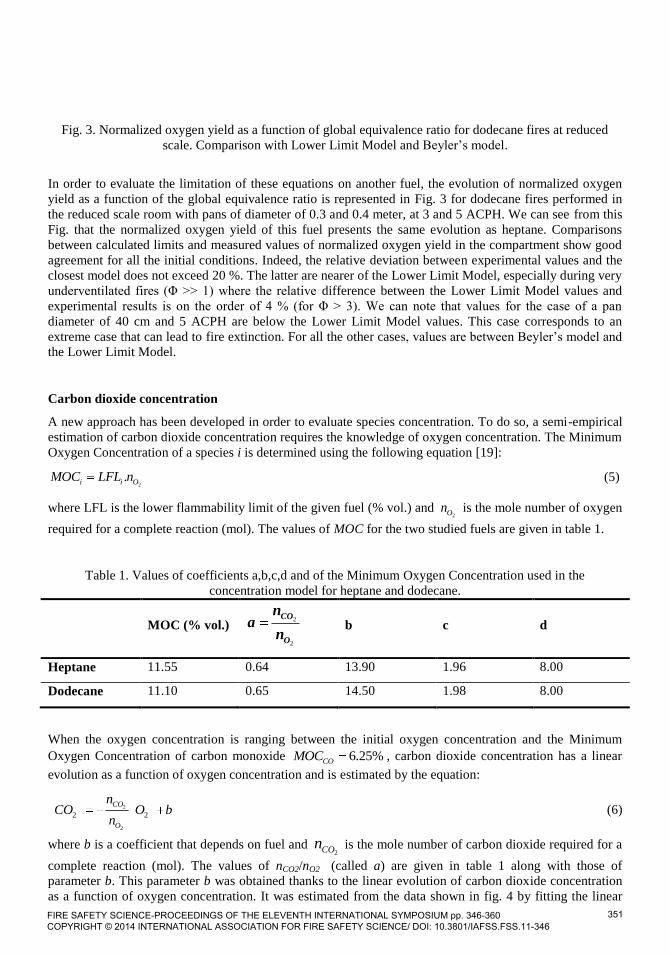
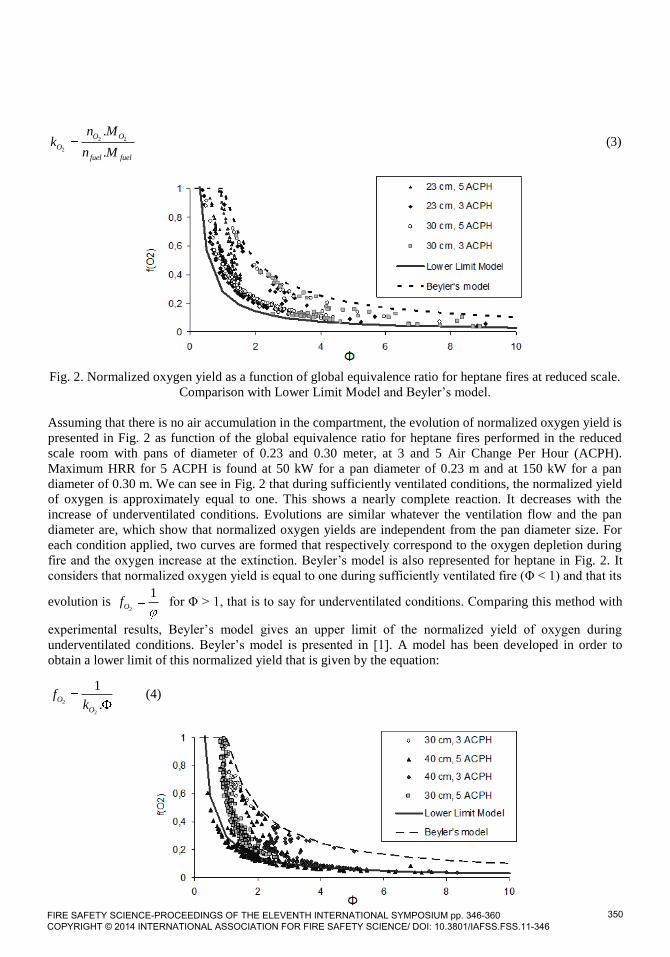
Fig. 3. Normalized oxygen yield as a function of global equivalence ratio for dodecane fires at reduced
scale. Comparison with Lower Limit Model and Beyler’s model.
In order to evaluate the limitation of these equations on another fuel, the evolution of normalized oxygen
yield as a function of the global equivalence ratio is represented in Fig. 3 for dodecane fires performed in
the reduced scale room with pans of diameter of 0.3 and 0.4 meter, at 3 and 5 ACPH. We can see from this
Fig. that the normalized oxygen yield of this fuel presents the same evolution as heptane. Comparisons
between calculated limits and measured values of normalized oxygen yield in the compartment show good
agreement for all the initial conditions. Indeed, the relative deviation between experimental values and the
closest model does not exceed 20 %. The latter are nearer of the Lower Limit Model, especially during very
underventilated fires (Φ >> 1) where the relative difference between the Lower Limit Model values and
experimental results is on the order of 4 % (for Φ > 3). We can note that values for the case of a pan
diameter of 40 cm and 5 ACPH are below the Lower Limit Model values. This case corresponds to an
extreme case that can lead to fire extinction. For all the other cases, values are between Beyler’s model and
the Lower Limit Model.
Carbon dioxide concentration
A new approach has been developed in order to evaluate species concentration. To do so, a semi-empirical
estimation of carbon dioxide concentration requires the knowledge of oxygen concentration. The Minimum
Oxygen Concentration of a species i is determined using the following equation [19]:
2.i i OMOC LFL n (5)
where LFL is the lower flammability limit of the given fuel (% vol.) and 2On is the mole number of oxygen
required for a complete reaction (mol). The values of MOC for the two studied fuels are given in table 1.
Table 1. Values of coefficients a,b,c,d and of the Minimum Oxygen Concentration used in the
concentration model for heptane and dodecane.
MOC (% vol.) 2
2
CO
O
na
n
b c d
Heptane 11.55 0.64 13.90 1.96 8.00
Dodecane 11.10 0.65 14.50 1.98 8.00
When the oxygen concentration is ranging between the initial oxygen concentration and the Minimum
Oxygen Concentration of carbon monoxide 6.25%COMOC , carbon dioxide concentration has a linear
evolution as a function of oxygen concentration and is estimated by the equation:
2
2
2 2
CO
O
nCO O b
n (6)
where b is a coefficient that depends on fuel and 2COn is the mole number of carbon dioxide required for a
complete reaction (mol). The values of nCO2/nO2 (called a) are given in table 1 along with those of
parameter b. This parameter b was obtained thanks to the linear evolution of carbon dioxide concentration
as a function of oxygen concentration. It was estimated from the data shown in fig. 4 by fitting the linear
FIRE SAFETY SCIENCE-PROCEEDINGS OF THE ELEVENTH INTERNATIONAL SYMPOSIUM pp. 346-360 COPYRIGHT © 2014 INTERNATIONAL ASSOCIATION FOR FIRE SAFETY SCIENCE/ DOI: 10.3801/IAFSS.FSS.11-346
351
model using least squares method. Very similar results are obtained from our experiments and from ICFMP
fire tests.
When oxygen concentration is below the Minimum Oxygen Concentration of carbon monoxide, carbon
monoxide is no longer oxidized in carbon dioxide. Consequently, carbon dioxide concentration becomes
constant and can be expressed by:
2
2
2
CO
CO
O
nCO MOC b
n (7)
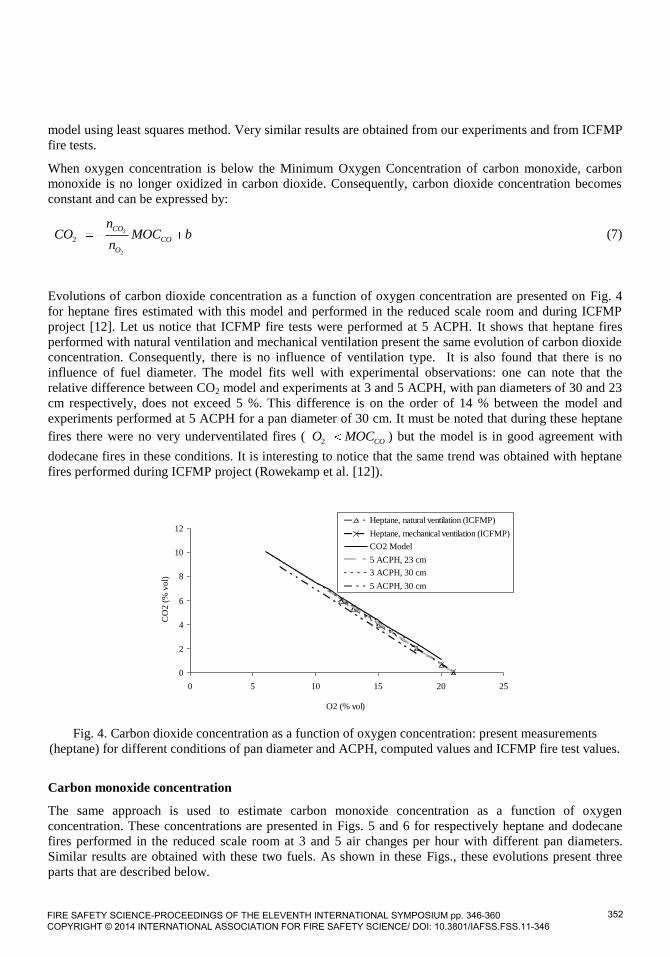
Evolutions of carbon dioxide concentration as a function of oxygen concentration are presented on Fig. 4
for heptane fires estimated with this model and performed in the reduced scale room and during ICFMP
project [12]. Let us notice that ICFMP fire tests were performed at 5 ACPH. It shows that heptane fires
performed with natural ventilation and mechanical ventilation present the same evolution of carbon dioxide
concentration. Consequently, there is no influence of ventilation type. It is also found that there is no
influence of fuel diameter. The model fits well with experimental observations: one can note that the
relative difference between CO2 model and experiments at 3 and 5 ACPH, with pan diameters of 30 and 23
cm respectively, does not exceed 5 %. This difference is on the order of 14 % between the model and
experiments performed at 5 ACPH for a pan diameter of 30 cm. It must be noted that during these heptane
fires there were no very underventilated fires ( 2 COO MOC ) but the model is in good agreement with
dodecane fires in these conditions. It is interesting to notice that the same trend was obtained with heptane
fires performed during ICFMP project (Rowekamp et al. [12]).
0
2
4
6
8
10
12
0 5 10 15 20 25
O2 (% vol)
CO
2 (
% v
ol)
Heptane, natural ventilation (ICFMP)
Heptane, mechanical ventilation (ICFMP)
CO2 Model
5 ACPH, 23 cm
3 ACPH, 30 cm
5 ACPH, 30 cm
Fig. 4. Carbon dioxide concentration as a function of oxygen concentration: present measurements
(heptane) for different conditions of pan diameter and ACPH, computed values and ICFMP fire test values.
Carbon monoxide concentration
The same approach is used to estimate carbon monoxide concentration as a function of oxygen
concentration. These concentrations are presented in Figs. 5 and 6 for respectively heptane and dodecane
fires performed in the reduced scale room at 3 and 5 air changes per hour with different pan diameters.
Similar results are obtained with these two fuels. As shown in these Figs., these evolutions present three
parts that are described below.
FIRE SAFETY SCIENCE-PROCEEDINGS OF THE ELEVENTH INTERNATIONAL SYMPOSIUM pp. 346-360 COPYRIGHT © 2014 INTERNATIONAL ASSOCIATION FOR FIRE SAFETY SCIENCE/ DOI: 10.3801/IAFSS.FSS.11-346
352
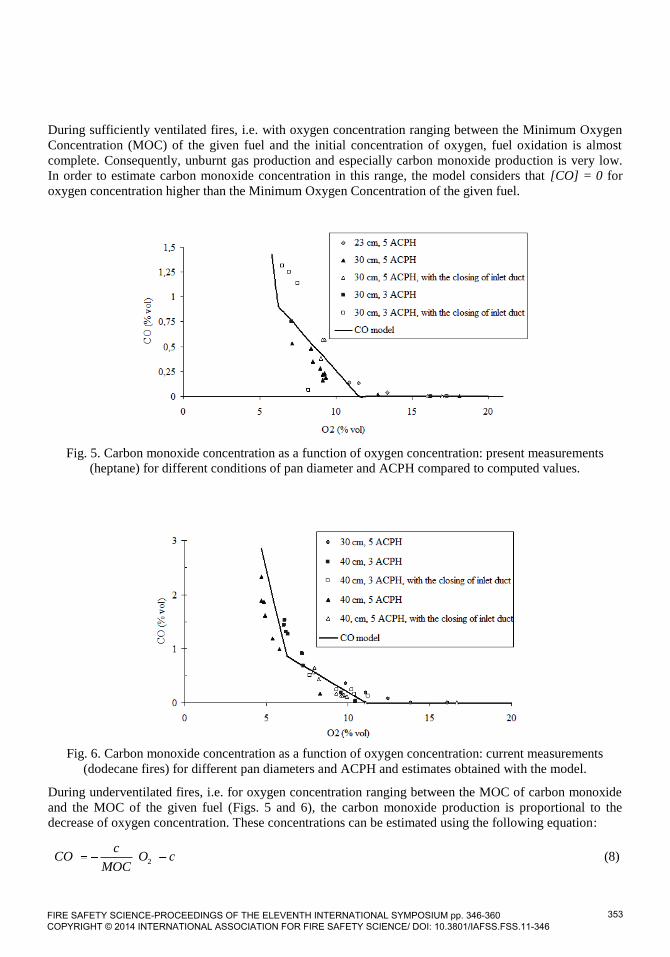
During sufficiently ventilated fires, i.e. with oxygen concentration ranging between the Minimum Oxygen
Concentration (MOC) of the given fuel and the initial concentration of oxygen, fuel oxidation is almost
complete. Consequently, unburnt gas production and especially carbon monoxide production is very low.
In order to estimate carbon monoxide concentration in this range, the model considers that [CO] = 0 for
oxygen concentration higher than the Minimum Oxygen Concentration of the given fuel.
Fig. 5. Carbon monoxide concentration as a function of oxygen concentration: present measurements
(heptane) for different conditions of pan diameter and ACPH compared to computed values.
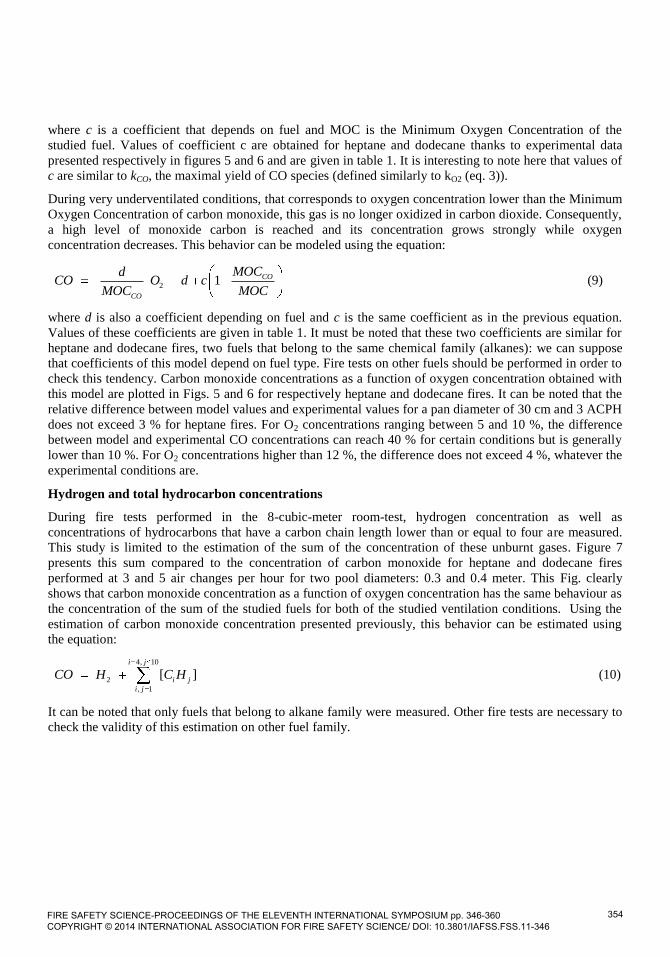
Fig. 6. Carbon monoxide concentration as a function of oxygen concentration: current measurements
(dodecane fires) for different pan diameters and ACPH and estimates obtained with the model.
During underventilated fires, i.e. for oxygen concentration ranging between the MOC of carbon monoxide
and the MOC of the given fuel (Figs. 5 and 6), the carbon monoxide production is proportional to the
decrease of oxygen concentration. These concentrations can be estimated using the following equation:
2
cCO O c
MOC (8)
FIRE SAFETY SCIENCE-PROCEEDINGS OF THE ELEVENTH INTERNATIONAL SYMPOSIUM pp. 346-360 COPYRIGHT © 2014 INTERNATIONAL ASSOCIATION FOR FIRE SAFETY SCIENCE/ DOI: 10.3801/IAFSS.FSS.11-346
353
where c is a coefficient that depends on fuel and MOC is the Minimum Oxygen Concentration of the
studied fuel. Values of coefficient c are obtained for heptane and dodecane thanks to experimental data
presented respectively in figures 5 and 6 and are given in table 1. It is interesting to note here that values of
c are similar to kCO, the maximal yield of CO species (defined similarly to kO2 (eq. 3)).
During very underventilated conditions, that corresponds to oxygen concentration lower than the Minimum
Oxygen Concentration of carbon monoxide, this gas is no longer oxidized in carbon dioxide. Consequently,
a high level of monoxide carbon is reached and its concentration grows strongly while oxygen
concentration decreases. This behavior can be modeled using the equation:
2 1 CO
CO
MOCdCO O d c
MOC MOC (9)
where d is also a coefficient depending on fuel and c is the same coefficient as in the previous equation.
Values of these coefficients are given in table 1. It must be noted that these two coefficients are similar for
heptane and dodecane fires, two fuels that belong to the same chemical family (alkanes): we can suppose
that coefficients of this model depend on fuel type. Fire tests on other fuels should be performed in order to
check this tendency. Carbon monoxide concentrations as a function of oxygen concentration obtained with
this model are plotted in Figs. 5 and 6 for respectively heptane and dodecane fires. It can be noted that the
relative difference between model values and experimental values for a pan diameter of 30 cm and 3 ACPH
does not exceed 3 % for heptane fires. For O2 concentrations ranging between 5 and 10 %, the difference
between model and experimental CO concentrations can reach 40 % for certain conditions but is generally
lower than 10 %. For O2 concentrations higher than 12 %, the difference does not exceed 4 %, whatever the
experimental conditions are.
Hydrogen and total hydrocarbon concentrations
During fire tests performed in the 8-cubic-meter room-test, hydrogen concentration as well as
concentrations of hydrocarbons that have a carbon chain length lower than or equal to four are measured.
This study is limited to the estimation of the sum of the concentration of these unburnt gases. Figure 7
presents this sum compared to the concentration of carbon monoxide for heptane and dodecane fires
performed at 3 and 5 air changes per hour for two pool diameters: 0.3 and 0.4 meter. This Fig. clearly
shows that carbon monoxide concentration as a function of oxygen concentration has the same behaviour as
the concentration of the sum of the studied fuels for both of the studied ventilation conditions. Using the
estimation of carbon monoxide concentration presented previously, this behavior can be estimated using
the equation:
4, 10
2
, 1
[ ]i j
i j
i j
CO H C H (10)
It can be noted that only fuels that belong to alkane family were measured. Other fire tests are necessary to
check the validity of this estimation on other fuel family.
FIRE SAFETY SCIENCE-PROCEEDINGS OF THE ELEVENTH INTERNATIONAL SYMPOSIUM pp. 346-360 COPYRIGHT © 2014 INTERNATIONAL ASSOCIATION FOR FIRE SAFETY SCIENCE/ DOI: 10.3801/IAFSS.FSS.11-346
354
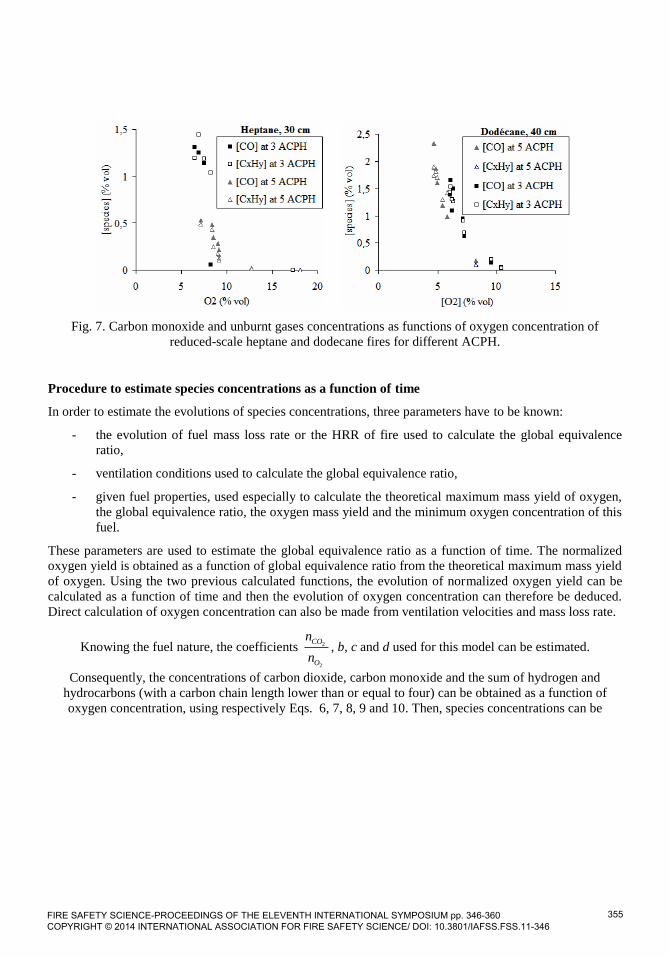
Fig. 7. Carbon monoxide and unburnt gases concentrations as functions of oxygen concentration of
reduced-scale heptane and dodecane fires for different ACPH.
Procedure to estimate species concentrations as a function of time
In order to estimate the evolutions of species concentrations, three parameters have to be known:
- the evolution of fuel mass loss rate or the HRR of fire used to calculate the global equivalence
ratio,
- ventilation conditions used to calculate the global equivalence ratio,
- given fuel properties, used especially to calculate the theoretical maximum mass yield of oxygen,
the global equivalence ratio, the oxygen mass yield and the minimum oxygen concentration of this
fuel.
These parameters are used to estimate the global equivalence ratio as a function of time. The normalized
oxygen yield is obtained as a function of global equivalence ratio from the theoretical maximum mass yield
of oxygen. Using the two previous calculated functions, the evolution of normalized oxygen yield can be
calculated as a function of time and then the evolution of oxygen concentration can therefore be deduced.
Direct calculation of oxygen concentration can also be made from ventilation velocities and mass loss rate.
Knowing the fuel nature, the coefficients 2
2
CO
O
n
n, b, c and d used for this model can be estimated.
Consequently, the concentrations of carbon dioxide, carbon monoxide and the sum of hydrogen and
hydrocarbons (with a carbon chain length lower than or equal to four) can be obtained as a function of
oxygen concentration, using respectively Eqs. 6, 7, 8, 9 and 10. Then, species concentrations can be
FIRE SAFETY SCIENCE-PROCEEDINGS OF THE ELEVENTH INTERNATIONAL SYMPOSIUM pp. 346-360 COPYRIGHT © 2014 INTERNATIONAL ASSOCIATION FOR FIRE SAFETY SCIENCE/ DOI: 10.3801/IAFSS.FSS.11-346
355
deduced from oxygen concentration as a function of
time.
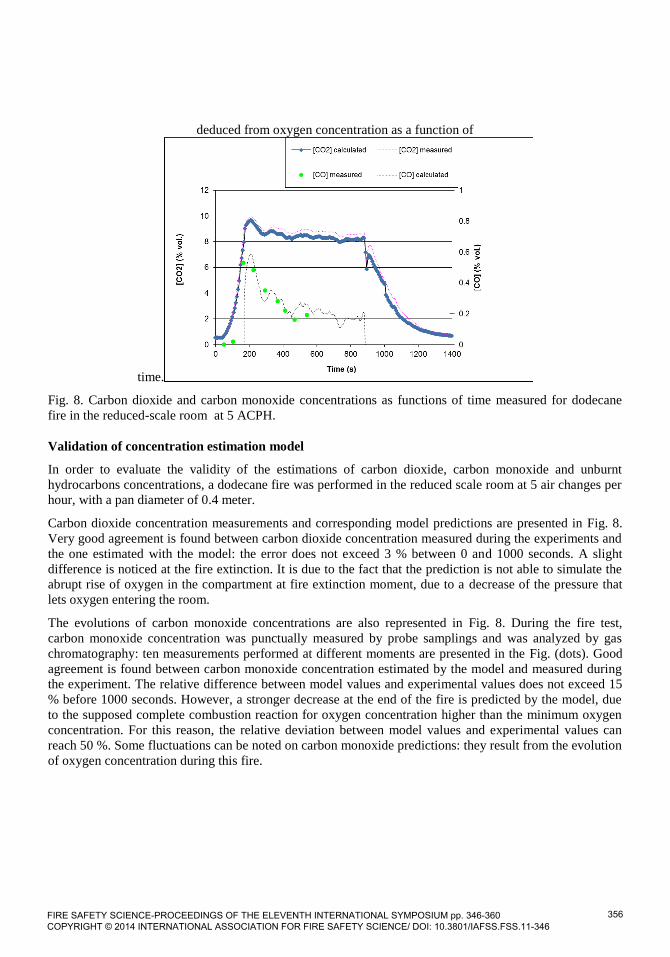
Fig. 8. Carbon dioxide and carbon monoxide concentrations as functions of time measured for dodecane
fire in the reduced-scale room at 5 ACPH.
Validation of concentration estimation model
In order to evaluate the validity of the estimations of carbon dioxide, carbon monoxide and unburnt
hydrocarbons concentrations, a dodecane fire was performed in the reduced scale room at 5 air changes per
hour, with a pan diameter of 0.4 meter.
Carbon dioxide concentration measurements and corresponding model predictions are presented in Fig. 8.
Very good agreement is found between carbon dioxide concentration measured during the experiments and
the one estimated with the model: the error does not exceed 3 % between 0 and 1000 seconds. A slight
difference is noticed at the fire extinction. It is due to the fact that the prediction is not able to simulate the
abrupt rise of oxygen in the compartment at fire extinction moment, due to a decrease of the pressure that
lets oxygen entering the room.
The evolutions of carbon monoxide concentrations are also represented in Fig. 8. During the fire test,
carbon monoxide concentration was punctually measured by probe samplings and was analyzed by gas
chromatography: ten measurements performed at different moments are presented in the Fig. (dots). Good
agreement is found between carbon monoxide concentration estimated by the model and measured during
the experiment. The relative difference between model values and experimental values does not exceed 15
% before 1000 seconds. However, a stronger decrease at the end of the fire is predicted by the model, due
to the supposed complete combustion reaction for oxygen concentration higher than the minimum oxygen
concentration. For this reason, the relative deviation between model values and experimental values can
reach 50 %. Some fluctuations can be noted on carbon monoxide predictions: they result from the evolution
of oxygen concentration during this fire.
FIRE SAFETY SCIENCE-PROCEEDINGS OF THE ELEVENTH INTERNATIONAL SYMPOSIUM pp. 346-360 COPYRIGHT © 2014 INTERNATIONAL ASSOCIATION FOR FIRE SAFETY SCIENCE/ DOI: 10.3801/IAFSS.FSS.11-346
356
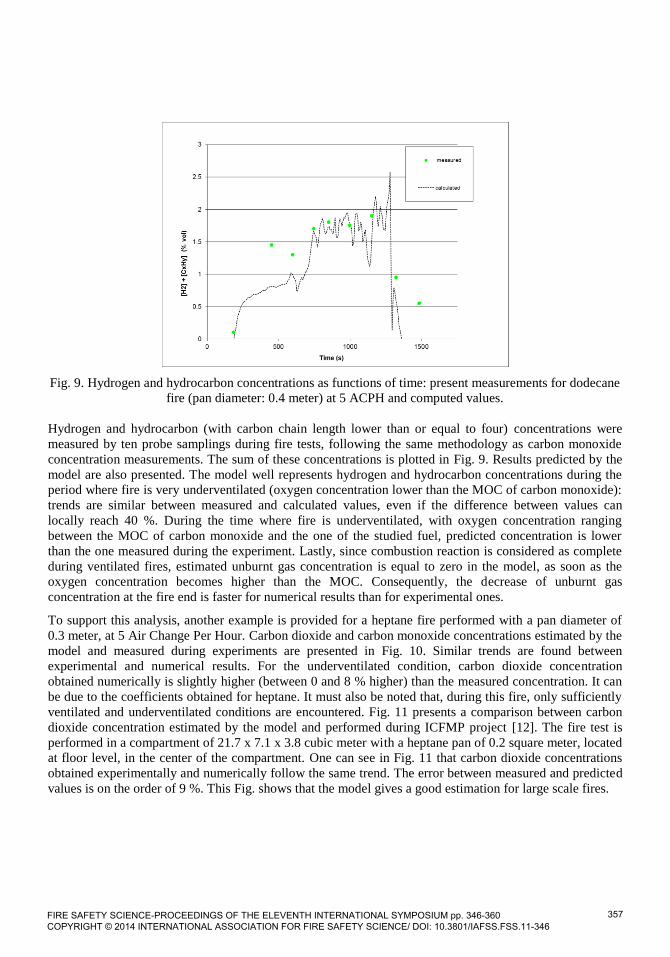
Fig. 9. Hydrogen and hydrocarbon concentrations as functions of time: present measurements for dodecane
fire (pan diameter: 0.4 meter) at 5 ACPH and computed values.
Hydrogen and hydrocarbon (with carbon chain length lower than or equal to four) concentrations were
measured by ten probe samplings during fire tests, following the same methodology as carbon monoxide
concentration measurements. The sum of these concentrations is plotted in Fig. 9. Results predicted by the
model are also presented. The model well represents hydrogen and hydrocarbon concentrations during the
period where fire is very underventilated (oxygen concentration lower than the MOC of carbon monoxide):
trends are similar between measured and calculated values, even if the difference between values can
locally reach 40 %. During the time where fire is underventilated, with oxygen concentration ranging
between the MOC of carbon monoxide and the one of the studied fuel, predicted concentration is lower
than the one measured during the experiment. Lastly, since combustion reaction is considered as complete
during ventilated fires, estimated unburnt gas concentration is equal to zero in the model, as soon as the
oxygen concentration becomes higher than the MOC. Consequently, the decrease of unburnt gas
concentration at the fire end is faster for numerical results than for experimental ones.
To support this analysis, another example is provided for a heptane fire performed with a pan diameter of
0.3 meter, at 5 Air Change Per Hour. Carbon dioxide and carbon monoxide concentrations estimated by the
model and measured during experiments are presented in Fig. 10. Similar trends are found between
experimental and numerical results. For the underventilated condition, carbon dioxide concentration
obtained numerically is slightly higher (between 0 and 8 % higher) than the measured concentration. It can
be due to the coefficients obtained for heptane. It must also be noted that, during this fire, only sufficiently
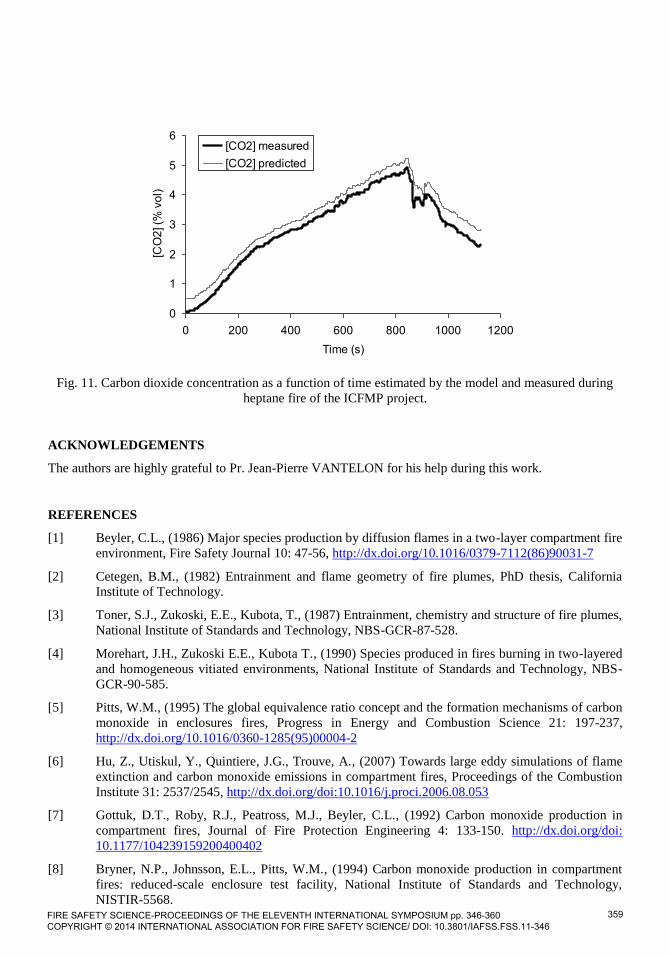
ventilated and underventilated conditions are encountered. Fig. 11 presents a comparison between carbon
dioxide concentration estimated by the model and performed during ICFMP project [12]. The fire test is
performed in a compartment of 21.7 x 7.1 x 3.8 cubic meter with a heptane pan of 0.2 square meter, located
at floor level, in the center of the compartment. One can see in Fig. 11 that carbon dioxide concentrations
obtained experimentally and numerically follow the same trend. The error between measured and predicted
values is on the order of 9 %. This Fig. shows that the model gives a good estimation for large scale fires.
FIRE SAFETY SCIENCE-PROCEEDINGS OF THE ELEVENTH INTERNATIONAL SYMPOSIUM pp. 346-360 COPYRIGHT © 2014 INTERNATIONAL ASSOCIATION FOR FIRE SAFETY SCIENCE/ DOI: 10.3801/IAFSS.FSS.11-346
357
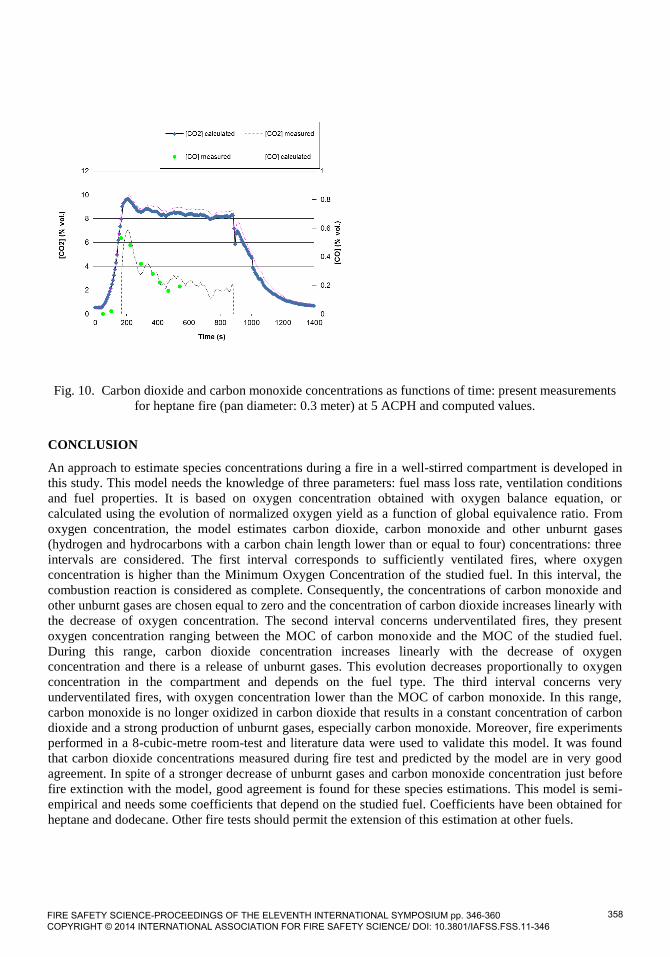
Fig. 10. Carbon dioxide and carbon monoxide concentrations as functions of time: present measurements
for heptane fire (pan diameter: 0.3 meter) at 5 ACPH and computed values.
CONCLUSION
An approach to estimate species concentrations during a fire in a well-stirred compartment is developed in
this study. This model needs the knowledge of three parameters: fuel mass loss rate, ventilation conditions
and fuel properties. It is based on oxygen concentration obtained with oxygen balance equation, or
calculated using the evolution of normalized oxygen yield as a function of global equivalence ratio. From
oxygen concentration, the model estimates carbon dioxide, carbon monoxide and other unburnt gases
(hydrogen and hydrocarbons with a carbon chain length lower than or equal to four) concentrations: three
intervals are considered. The first interval corresponds to sufficiently ventilated fires, where oxygen
concentration is higher than the Minimum Oxygen Concentration of the studied fuel. In this interval, the
combustion reaction is considered as complete. Consequently, the concentrations of carbon monoxide and
other unburnt gases are chosen equal to zero and the concentration of carbon dioxide increases linearly with
the decrease of oxygen concentration. The second interval concerns underventilated fires, they present
oxygen concentration ranging between the MOC of carbon monoxide and the MOC of the studied fuel.
During this range, carbon dioxide concentration increases linearly with the decrease of oxygen
concentration and there is a release of unburnt gases. This evolution decreases proportionally to oxygen
concentration in the compartment and depends on the fuel type. The third interval concerns very
underventilated fires, with oxygen concentration lower than the MOC of carbon monoxide. In this range,
carbon monoxide is no longer oxidized in carbon dioxide that results in a constant concentration of carbon
dioxide and a strong production of unburnt gases, especially carbon monoxide. Moreover, fire experiments
performed in a 8-cubic-metre room-test and literature data were used to validate this model. It was found
that carbon dioxide concentrations measured during fire test and predicted by the model are in very good
agreement. In spite of a stronger decrease of unburnt gases and carbon monoxide concentration just before
fire extinction with the model, good agreement is found for these species estimations. This model is semi-
empirical and needs some coefficients that depend on the studied fuel. Coefficients have been obtained for
heptane and dodecane. Other fire tests should permit the extension of this estimation at other fuels.
FIRE SAFETY SCIENCE-PROCEEDINGS OF THE ELEVENTH INTERNATIONAL SYMPOSIUM pp. 346-360 COPYRIGHT © 2014 INTERNATIONAL ASSOCIATION FOR FIRE SAFETY SCIENCE/ DOI: 10.3801/IAFSS.FSS.11-346
358
0
1
2
3
4
5
6
0 200 400 600 800 1000 1200Time (s)
[CO
2] (%
vol
)[CO2] measured[CO2] predicted
Fig. 11. Carbon dioxide concentration as a function of time estimated by the model and measured during
heptane fire of the ICFMP project.
ACKNOWLEDGEMENTS
The authors are highly grateful to Pr. Jean-Pierre VANTELON for his help during this work.
REFERENCES
[1] Beyler, C.L., (1986) Major species production by diffusion flames in a two-layer compartment fire
environment, Fire Safety Journal 10: 47-56, http://dx.doi.org/10.1016/0379-7112(86)90031-7
[2] Cetegen, B.M., (1982) Entrainment and flame geometry of fire plumes, PhD thesis, California
Institute of Technology.
[3] Toner, S.J., Zukoski, E.E., Kubota, T., (1987) Entrainment, chemistry and structure of fire plumes,
National Institute of Standards and Technology, NBS-GCR-87-528.
[4] Morehart, J.H., Zukoski E.E., Kubota T., (1990) Species produced in fires burning in two-layered
and homogeneous vitiated environments, National Institute of Standards and Technology, NBS-
GCR-90-585.
[5] Pitts, W.M., (1995) The global equivalence ratio concept and the formation mechanisms of carbon
monoxide in enclosures fires, Progress in Energy and Combustion Science 21: 197-237,
http://dx.doi.org/10.1016/0360-1285(95)00004-2
[6] Hu, Z., Utiskul, Y., Quintiere, J.G., Trouve, A., (2007) Towards large eddy simulations of flame
extinction and carbon monoxide emissions in compartment fires, Proceedings of the Combustion
Institute 31: 2537/2545, http://dx.doi.org/doi:10.1016/j.proci.2006.08.053
[7] Gottuk, D.T., Roby, R.J., Peatross, M.J., Beyler, C.L., (1992) Carbon monoxide production in
compartment fires, Journal of Fire Protection Engineering 4: 133-150. http://dx.doi.org/doi:
10.1177/104239159200400402
[8] Bryner, N.P., Johnsson, E.L., Pitts, W.M., (1994) Carbon monoxide production in compartment
fires: reduced-scale enclosure test facility, National Institute of Standards and Technology,
NISTIR-5568. FIRE SAFETY SCIENCE-PROCEEDINGS OF THE ELEVENTH INTERNATIONAL SYMPOSIUM pp. 346-360 COPYRIGHT © 2014 INTERNATIONAL ASSOCIATION FOR FIRE SAFETY SCIENCE/ DOI: 10.3801/IAFSS.FSS.11-346
359
[9] Wieczorek, C.J. (2003) Carbon monoxide generation and transport from compartment fires, PhD
thesis, Virginia Polytechnic Institute and State University.
[10] Gottuk, D.T., Roby, R.J., Beyler, C.L., (1995) The role of temperature on carbon monoxide
production in compartment fires, Fire Safety Journal 24: 315-331.
[11] Tewarson, A., (2002) Generation of heat and chemical compounds in fires, In: SFPE Handbook of
fire protection engineering, National Fire Protection Association.
[12] Rowekamp, M., Dreisbach, J., Kelin-Hessling, W., McGrattan, K.B., Miles, S., Plys, M., Riese, O.
(2008) International Collaborative Fire Modeling Project (ICFMP) Summary of Benchmark
Exercises 1-5, Report 227.
[13] Kayili, S., Yozgatligil, A., Cahit Eralp, O., (2012) Effect of ventilation and geometrical parameters
of the burning object on the heat release rate in tunnel fires, Combustion Science and Technology
184: 165-177, http://dx.doi.org/10.1080/00102202.2011.625371
[14] Quintiere, J.G., (1989) Scaling applications in fire research, Fire Safety Journal 15: 3-29,
http://dx.doi.org/10.1016/0379-7112(89)90045-3
[15] Lassus, J., Courty, L., Garo, J.P., Studer, E., Jourda, P., Aine, P., (2014) Ventilation effects in
confined and mechanically ventilated fires, International Journal of Thermal Sciences 75: 87-94,
http://dx.doi.org/10.1016/j.ijthermalsci.2013.07.015
[16] Arai, M., Saito, K., Altenkrich, R.A., (1990) A study of boilover in liquid pool fires supported on
water, Part I : effects of a water sublayer on pool fires, Combustion Science and Technology 71:
25-40, http://dx.doi.org/10.1080/00102209008951622
[17] Lassus, J. (2009) Risque d’inflammation de gaz imbrûlés au cours d’un incendie en milieu
confiné-ventilé, PhD Thesis, Université de Poitiers.
[18] Babrauskas, V., Ignition Handbook, Fire Science Publishers, 2003, Chapter 4.
[19] Bodurtha, F.T., Industrial explosion prevention and protection, Mc Graw-Hill, 1980.
FIRE SAFETY SCIENCE-PROCEEDINGS OF THE ELEVENTH INTERNATIONAL SYMPOSIUM pp. 346-360 COPYRIGHT © 2014 INTERNATIONAL ASSOCIATION FOR FIRE SAFETY SCIENCE/ DOI: 10.3801/IAFSS.FSS.11-346
360