Embed Size (px)
Citation preview

Experimental and Theoretical Studies of the Isotope ExchangeReaction + ++ +D H H D H3 2
P.-M. Hillenbrand1,4 , K. P. Bowen1 , J. Liévin2, X. Urbain3 , and D. W. Savin11 Columbia Astrophysics Laboratory, Columbia University, New York, NY 10027, USA; [email protected], [email protected]
2 Service de Chimie Quantique et Photophysique, Université Libre de Bruxelles, B-1050 Brussels, Belgium3 Institute of Condensed Matter and Nanosciences, Université catholique de Louvain, B-1348 Louvain-la-Neuve, Belgium
Received 2019 March 4; revised 2019 April 4; accepted 2019 April 4; published 2019 May 22
Abstract
Deuterated molecules are important chemical tracers of prestellar and protostellar cores. Up to now, the titular reactionhas been assumed to contribute to the generation of these deuterated molecules. We have measured the merged-beamsrate coefficient for this reaction as a function of the relative collision energy in the range of about 10meV–10 eV. Byvarying the internal temperature of the reacting +H3 molecules, we found indications for the existence of a reactionbarrier. We have performed detailed theoretical calculations for the zero-point-corrected energy profile of the reactionand determined a new value for the barrier height of ≈68meV. Furthermore, we have calculated the tunnelingprobability through the barrier. Our experimental and theoretical results show that the reaction is essentially closed atastrochemically relevant temperatures. We derive a thermal rate coefficient of <1×10⁻¹² cm3 s−1 for temperaturesbelow 75K with tunneling effects included and below 155K without tunneling.
Key words: astrochemistry – ISM: molecules – methods: laboratory: molecular – molecular data – molecularprocesses
1. Introduction
Deuterated molecules are important chemical tracers of theinterstellar molecular clouds where stars form. At the ∼10–20Ktemperatures typical of these environments, exoergic deuterium-substitution reactions go forward, but the endoergic hydrogen-substitution reverse reactions do not, due to the vibrational zero-point energy (ZPE) of a deuterated molecule lying below that of itsH-bearing counterpart. This fractionation process explains why, incold environments, the observed abundance ratios of deuteratedmolecules relative to their H-bearing analogs are orders ofmagnitude larger than the galactic D/H ratio. Since these findingsbecame apparent, numerous astrochemical models have beendeveloped to explain the observations (an incomplete list ofmodels includes Millar et al. 1989; Rodgers & Millar 1996;Roberts & Millar 2000; Walmsley et al. 2004; Flower et al. 2006;Aikawa et al. 2012; Albertsson et al. 2013; McElroy et al.2013; Sipilä et al. 2013; Kong et al. 2015; Lee & Bergin 2015;Majumdar et al. 2017).
A particularly important deuterated molecule for tracing theproperties of the cold gas in star-forming regions is H2D
+. Oncethe particle density of the cloud reaches ∼106 cm−3, heavyelements are predicted to freeze onto dust grains. +H3 and itsisotopologues are predicted to become the dominant carriers ofpositive charge, a role normally played by metals such as S+ andFe+, along with C-, N-, and O-bearing molecules such as HCO+,H3O
+, and N2H+ (van der Tak 2006). However, +H3 and +D3 are
not observable at such low temperatures as they have no dipolemoment and lack a pure rotational spectrum. Conversely, H2D
+
and D2H+ have dipole moments and a pure rotational spectrum
that can be excited at these temperatures. For example, H2D+ has
been observed in low-mass prestellar cores (Caselli et al. 2003;Vastel et al. 2004, 2006; Pagani et al. 2009; Friesen et al. 2010),low-mass protostellar cores (Stark et al. 1999; Caselli et al. 2008;
Friesen et al. 2014), low-mass young stellar objects (Stark et al.1999; Brünken et al. 2014), and massive star-forming regions(Harju et al. 2006; Swift 2009; Pillai et al. 2012).In order to harness the full diagnostic power of H2D
+ forcold and dense star-forming regions, accurate chemicalabundance models are needed. Measurements of the H2D
+
abundance, combined with these models, can be used todetermine the ionization fraction of the object. This fractionsets the timescale for the gas-phase chemistry of the gas, asion–neutral reactions dominate such chemistry at thesetemperatures. Additionally, reliable values for the electronnumber density relative to the value of =x n nH , e e2 H2 areneeded to calculate the electron-driven portion of the chemistryoccurring in a cloud (Caselli et al. 2008). The quantity xe isapproximately equal to the ionization fraction, assuming thatthe gas is neutral. Lastly, the ionization and electron fractionsdetermine the influence of magnetic fields on the dynamics ofthe object, especially for the ability of the ambient fields tosupport against gravitational collapse (van der Tak 2006;Grenier et al. 2015; Kong et al. 2015).Of the six reactions identified as being key in the formation
and destruction of H2D+ in cold and dense star-forming
regions, two reactions involve HD, one involves D2, and twoinvolve atomic D (Albertsson et al. 2013). Laboratorymeasurements exist for the reactions involving HD and D2
(Adams & Smith 1981; Giles et al. 1992; Gerlich et al. 2002;Gerlich & Schlemmer 2002; Hugo et al. 2009), and the ratecoefficients are thought to be well understood. The same cannotbe said for the two reactions involving atomic D. This is due tothe experimental challenges of generating controlled and well-quantified beams of atomic D (Bruhns et al. 2010a). Paganiet al. (2013) also highlighted the fact that reactions with atomicD have a sizable influence on the chemistry, especially atsteady state when atomic D becomes important. These studiessuggest that our ability to reliably use H2D
+ as a diagnostic forstar-forming regions is hindered by the lack of accurate
The Astrophysical Journal, 877:38 (16pp), 2019 May 20 https://doi.org/10.3847/1538-4357/ab16dc© 2019. The American Astronomical Society. All rights reserved.
4 Present address: GSI Helmholtzzentrum für Schwerionenforschung, D-64291Darmstadt, Germany.
1
astrochemical data for the reactions of atomic D with +H3forming H2D
+ and with H2D+ destroying the molecule.
Here we focus on the H2D+ formation reaction
+ ++ + ( )D H H D H, 13 2
which is exoergic by 51.51 meV (Ramanlal & Tennyson 2004).The only theoretical results published for this reaction appearsto be the classical dynamics study by Moyano et al. (2004),which did not include corrections for the isotope-dependentZPE along the reaction path. Their cross-section results lie anorder of magnitude below the Langevin value. They hypothe-sized that this discrepancy might be reduced when quantumeffects are taken into account. However, Moyano et al. alsopredicted that the reaction path possesses a barrier ofEb=149 meV, and they did not account for the possibleeffects of tunneling. So, it is surprising that they report anonzero cross section for collision energies below Eb.
To help to resolve this issue, we have carried out laboratorymeasurements for Reaction(1). The measurements wereperformed using our dual-source, ion–neutral, merged-fast-beams apparatus (O’Connor et al. 2015b; de Ruette et al.2016). In addition, we have carried out new theoreticalcalculations for the ZPEs for all of the stationary points alongthe reaction path, giving an improved value for Eb. Using ourcombined experimental and theoretical results, we havedeveloped a semiempirical model for the reaction cross section,from which we have generated a thermal rate coefficient forReaction(1) for astrochemical models.
The rest of the paper is organized as follows. In Section 2,we briefly describe the experimental apparatus. The measure-ment procedure and data analysis are highlighted in Section 3.Section 4 provides a theoretical description of the reaction pathincluding the potential energy surface (PES) and the ZPE at allstationary points. The experimental results are presented inSection 5 and discussed in Section 6. A summary is given inSection 7. Throughout the paper, uncertainties are quoted at aconfidence level taken to be equivalent to a one-standard-deviation statistical confidence level, unless otherwise noted.
2. Experimental Apparatus
We have developed a dual-source, merged-fast-beamsapparatus that enables us to study reactions between neutralatoms and molecular cations, and to measure the chargeddaughter products. The experimental apparatus and methodol-ogy have already been described in detail in O’Connor et al.(2015b) and de Ruette et al. (2016). We provide here only abrief description, emphasizing aspects that are new or specificto the present study.
2.1. Neutral Beam
The neutral beam is formed by the photodetachmentof a beam of D−, the only bound level of which is 1S0(Rienstra-Kiracofe et al. 2002). The anions are generated usinga Peabody Scientific duoplasmatron source, accelerated to forma beam with kinetic energy =-E 12.00 keVD (5.96 keV u−1 or1.07×108 cm s−1) and guided electrostatically into a Wienfilter. This charge-to-mass filter is used to select the desiredD− beam and remove any other negatively charged particlesextracted from the source. Typical D− currents after the Wienfilter were 3.7 μA. The D− beam is then directed into a
photodetachment chamber by a series of electrostatic ionoptical elements.In this chamber, the anions pass through a floating cell at a
voltage of Uf. Upon entering this cell, the anions assume anenergy of +-E eUD f , where e is the elementary charge. Withinthe floating cell, a few percent of the anions are photodetachedby a ∼1kW laser beam at a wavelength of λ=808 nm (aphoton energy of hν=1.53 eV, where h is Planck’s constantand ν the photon frequency). This energy lies close to themaximum of the photodetachement cross section (McLaughlinet al. 2017) and generates ground-level atomic D via
n+ +- -( ) ( ) ( )S h S eD D . 210
21 2
We have previously used this technique to produce beams ofneutral atomic H and D for studies of associative detachment(Bruhns et al. 2010a, 2010b; Kreckel et al. 2010; Miller et al.2011, 2012). Additional details can be found in O’Connor et al.(2015a).The energy of the neutral beam formed is = +-E E eUn D f
and does not change upon leaving the floating cell. The beam iscollimated by a set of two 5 mm apertures separated by adistance of 3168 mm, one before and one after the photo-detachment chamber. The current before the first aperture was3.3 μA. The remaining D− beam after the second aperture iselectrostatically removed and directed into a beam dump,leaving a pure beam of ground-level D that continuesballistically into the interaction region.
2.2. Cation Beam
H3+ is generated using a Peabody Scientific duoplasmatron
and extracted from the ion-source chamber through an aperturewith a diameter of d=0.25mm. The cations are accelerated toform a beam of energy = =+E E 18.02 keVH i3
or 5.96 keV u−1.This energy has been selected to velocity match that of theneutral D beam for Uf=0 V. The beam then passes through aWien filter to select the desired +H3 and remove all other cationsextracted from the source. After the Wien filter, the +H3 beam iselectrostatically directed into a set of two 5 mm collimatingapertures separated by a distance of 3069mm. The currentbefore the first aperture is typically ≈7 μA. The second apertureis followed by a 90° electrostatic cylindrical deflector. Thisdeflector merges the cations onto the neutral beam (which passesthrough a hole in the outer plate of the deflector and then throughthe exit of the deflector into the interaction region). Electrostaticion optics after the last collimating aperture and before thismerging deflector are used to maximize the overlap betweenboth beams in the interaction region.It is well known that duoplasmatrons form +H3 ions that
are internally excited. The lower limit for this excitation at∼300 K is due to the water-cooled walls of the duoplasmatron.The upper limit is the predicted dissociation temperatureof ∼4000 K for +H3 in thermal equilibrium (Kylänpää &Rantala 2011). Our previous studies of C and O reacting with
+H3 inferred an internal temperature of ∼2500–3000 K bycomparing the measured thresholds for competing channels tothose predicted theoretically (O’Connor et al. 2015b; de Ruetteet al. 2016).Here we adjusted the source-operating conditions in order to
vary the level of internal excitation. The parameters that wevaried were the pressure inside the duoplasmatron chamber, thearc current, the magnet current, and the filament current. As we
2
The Astrophysical Journal, 877:38 (16pp), 2019 May 20 Hillenbrand et al.
will discuss in more detail in Section 5, the level of +H3 internalexcitation was most sensitive to the source pressure ps.
We estimated ps from the pressure measured just outside thesource chamber, po. The short distance between the sourceaperture and the turbomolecular pump on the system allows usto treat the problem as two chambers separated by an aperture.Using the fact that ps?po, the basic formula of molecularflow through an aperture gives (O’Hanlon 2003)
p= ( )p p
S
d
m
k T
4 2. 3s o 2
H
B
2
Here, S=220 l s−1 is the H2 pumping speed of theturbomolecular pump, mH2 is the H2 mass, kB is the Boltzmannconstant, and T=300 K is the gas temperature. Inserting thesevalues into Equation (3) yields
» ´ ( )p p1 10 . 4s4
o
We operated the source at po=(0.72–7.2)×10−5 Torr, withthe gauge calibrated for reading H2. This corresponds tops=0.072–0.72 Torr.
2.3. Interaction Region
The interaction region begins near the exit of the mergerdeflector, at z=0 mm, where z is the distance along theoverlap of the two beams. The length of the interaction regionis L=1215 mm and is set by the location of the entranceelectrode of an electrostatic chicane, described below. Theprofiles of the two parent beams are measured individuallyusing rotating wire beam profile monitors (BPMs; Seely et al.2008), one near the beginning of the interaction region atz=280 mm and the other near the end at z=1090 mm. Themeasured profiles are used to calculate the mean overlap factorof the parent beams, áW ñ( )z , as well as the bulk angle betweenthem, θbulk. A Faraday cup can be inserted between the twoBPMs to measure the cation beam current. Typical ion currentsat this point were Ii≈1.1 μA. For Uf=0 V, daughter H2D
+
ions form in the interaction region with an energy given by theinitial =+E 18.02 keVH3
plus ED=12.00 keV and minus theenergy of the replaced H atom, EH=6.01 keV, resultingin =+E 24.01 keVH D2 .
2.4. Signal Detection
After the interaction region, the desired daughter productsare separated from the parent beams by a series of electrostaticanalyzers. Using electrostatics allows us to analyze chargedparticles based on their kinetic energies. The first analyzer is achicane, consisting of a series of four pairs of parallel plateelectrodes. These deflect the charged particles in the horizontaldirection. For each pair of plates, ℓ, one was set to a voltage+Uℓ and the other to −Uℓ. The orientation of the chicanedeflection has been rotated 90° from the configuration used inO’Connor et al. (2015b) and de Ruette et al. (2016).
In our previous work, we used the chicane to deflect theparent cation beam into a Faraday cup located after the firstelectrode, while guiding the product ions back onto the opticalaxis of the chicane, as defined by the neutral beam trajectory.However, the geometry of the Faraday cup location requires alarge mass difference between the parent and product ions. Thiscould not be fulfilled in the present experiment. So, the +H3beam current, Ii, was measured at the beginning and end of
each setting of Uf during data acquisition, typically a 10sinterval. The current was measured by applying a suitablevoltage to the entrance electrode of the chicane. At this voltage,the transmittance of the cation beam from the interaction regionto the chicane Faraday cup was 100%. During the H2D
+ signal-collection portion of the data-acquisition cycle, the voltage onthe entrance electrode was set to transmit the product ionsthrough the chicane.The daughter H2D
+ ions are directed by the chicane into thefinal analyzer. This consists of a series of three 90° cylindricaldeflectors, each with a bending radius of ≈137 mm: a lowercylindrical deflector (LCD), a middle cylindrical deflector(MCD), and an upper cylindrical deflector (UCD). The outerplate for each cylindrical deflector was set to a voltage of +Uℓand the inner plate to-Uℓ. In contrast to our previous work, allthree deflections are now arranged in one vertical plane. TheLCD and MCD together form a bend of 180° and the UCDprovides a 90° bend in the opposite direction. A slit with a gap of5 mm is positioned at the focus at the exit of the MCD to helpsuppress any background. This background is due, in part, to +H3ions that make their way out of the chicane and into the finalanalyzer. The rear deflector pair of the chicane is used to correctfor slight misalignments of the beam perpendicular to the verticaldeflection plane of the final analyzer. The transmittance from theinteraction region to the exit of the UCD was measured atTa=90%±5% using a proxy cation beam at the energy of thesignal ions and a Faraday cup after the exit of the UCD.Product ions are counted after the exit of the UCD using a
channel electron multiplier (CEM) with an efficiency ofη=99%±3%. A repeller grid is located in front of theCEM and biased negatively to repel electrons. The geometrictransmittance of this grid is Tg=90%±1%. Typical H2D
+
signal count rates were S≈20 s−1. The voltages on thechicane exit electrode, LCD, MCD, and UCD were scanned todetermine the optimal settings for signal collection. Represen-tative scans are shown in Figure 1 for Uf=0 V.The trajectory of the H2D
+ products is determined by thevoltages applied to the four deflector pairs of the chicane andthe three deflectors of the final analyzer. During dataacquisition, we typically scan Uf to vary Er. This also varies
+EH D2 , and the various deflector voltages must be scaledaccordingly. Denoting the deflectors from the entranceelectrode of the chicane to the UCD by Uℓ, with ℓ=1–7, wescale Uℓ versus Uf as
= +⎛⎝⎜
⎞⎠⎟( ) ( ) ( )U U U
eU
E0 1 . 5ℓ ℓf
f
0
Here, E0=24.01 keV is the H2D+ energy for Uf=0 V. These
settings were routinely confirmed with signal scans similar tothose shown in Figure 1.
2.5. Neutral Current
The neutral D beam travels ballistically from the interactionregion, through the chicane, into the entrance aperture of theLCD, through an exit hole in the outer plate of the LCD, andinto the neutral detector. The transmission of the neutral beamfrom the interaction region to the neutral detector, dubbed theneutral cup (NC), is Tn=95%±3%, as measured usingproxy ion beams.The neutral particle current, In, is measured in amperes. The
neutral beam strikes a target inside the neutral cup, which is
3
The Astrophysical Journal, 877:38 (16pp), 2019 May 20 Hillenbrand et al.

configured to collect the resulting secondary emission ofnegative particles from the target (Bruhns et al. 2010b). Thisneutral cup can also be configured externally to serve as aFaraday cup for ion current measurements. The measuredneutral current is given by
g= ( )I
I
T, 6n
NC
n
where INC is the negative particle current measured by theneutral cup and γ is the mean number of negative particlesemitted by a neutral particle striking the target. For our workhere, typical neutral D currents were In=43 nA.
We measured the value of γ using collisional detachment ofthe D− beam on a gas target, in this case the interaction regionfilled with Ar at a typical pressure of 6×10⁻⁴ Torr, using apressure gauge calibrated for Ar. The resulting D beam wasmeasured in the neutral cup. The remaining D− beam was
deflected by the LCD into the MCD (which had no appliedvoltage), passed through a hole in the outer plate of the MCD,and was measured in a Faraday cup, dubbed the upper cup(UC). The transmittance of the D− beam from the interactionregion to the upper cup was measured to be Tu=65%±2%.Baseline measurements were also carried out for a residual gaspressure of 8×10⁻⁸ Torr, using the same Ar-calibrated gauge.The resulting value of γ is given by
gss
= +DD
⎛⎝⎜
⎞⎠⎟ ( )I
I
T
T1 . 7DED
SED
NC
UC
u
n
ΔINC and ΔIUC represent the measured current changes in theneutral cup and upper cup, respectively. Each of these needs tobe corrected for by the transmittance from the interactionregion to the corresponding cup: Tn and Tu, respectively. Wealso accounted for the unmeasured D+ cations generated by the
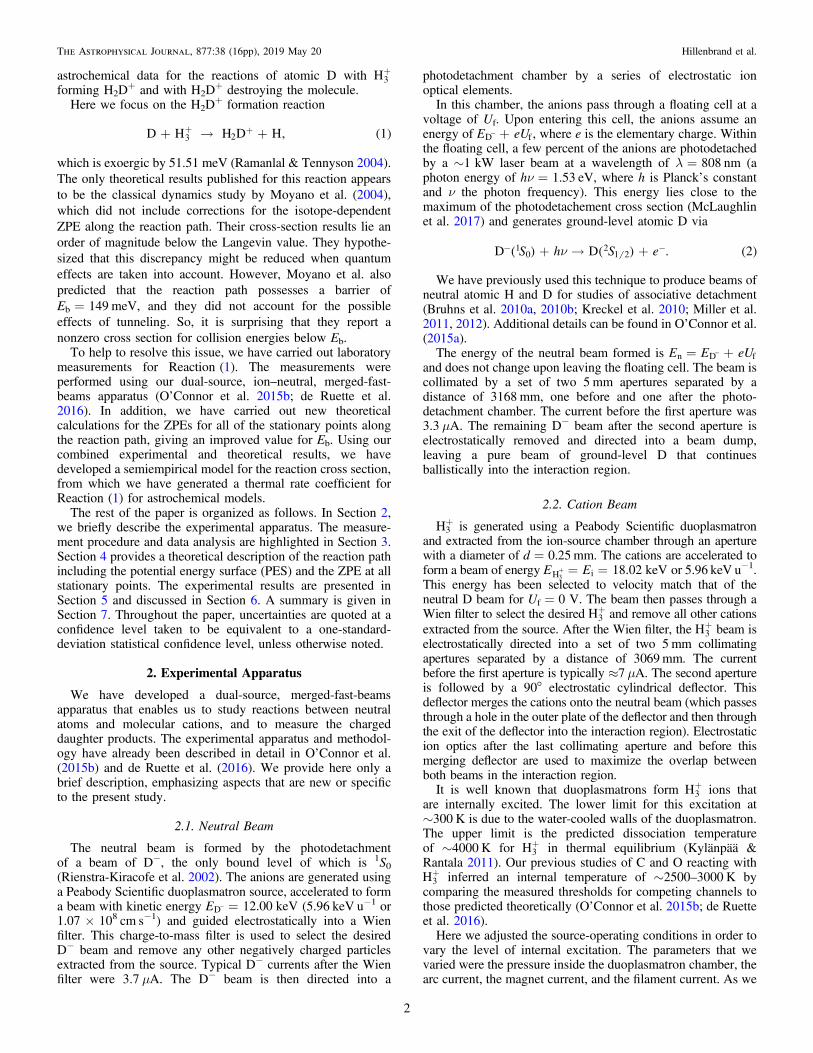
Figure 1. Voltage scans of the electrostatic analyzers for =U 0 Vf for the (a) rear deflector pair of the chicane, (b) LCD, (c)MCD, and (d) UCD. For these scans, eachvoltage was set to =∣ ∣U 0.439ℓ , 4.271, 4.526, and 4.182 kV, respectively, when not being scanned. Shown are the normalized counts for the different phases of themeasurement cycle, which provide unambiguous background subtraction. For N1 (blue squares), only the D beam is on. For N2 (red upward triangles), both beams areon. For N3 (green diamonds), only the +H3 beam is on. For N4 (purple downward triangles), both beams are off. The background-corrected signal (black circles) isgiven by NS (see Section 3.1). The dashed lines are normalized fits using a modified Gaussian function s- -[ ( ) ( )]U Uexp 20
6 6 , where U is the applied voltage, U0
the central voltage, and σ a fitting parameter. These fits are given as a guide to the eye.
4
The Astrophysical Journal, 877:38 (16pp), 2019 May 20 Hillenbrand et al.
double electron detachment (DED) of D− on Ar. The ratio ofthe DED cross section, σDED, compared to that for singleelectron detachment (SED), σSED, is σDED/σSED=3.5%. Thisis based on the compilation of Phelps (1992) and assumes thatthe cross sections for D− on Ar are the same as those for H− atmatched velocities.
We measured γ over several measurement series spread outover a number of weeks and also for a range of values for En.At 12.00 keV, we found γ=1.6±0.1. As a function of En,the data showed a small linear dependence of
g = +( [ ]) ( )E EkeV 0.113 0.244 8n n
within the energy range of En=11.1–13.0 keV studied here.We accounted for this variation in the data analysis of ourresults.
3. Measurement and Analysis
We begin by explaining the signal determination(Section 3.1), followed by the data-acquisition procedure(Section 3.2), which has been enhanced since the work ofO’Connor et al. (2015b) and de Ruette et al. (2016). Next, wediscuss the relative translational energy scale of the collision(Section 3.3). Then we review how we evaluate the corresp-onding merged-beams rate coefficient (Section 3.4). Again, weprovide here only a brief description, emphasizing aspects thatare new or specific to the present study. Additional details canbe found in Bruhns et al. (2010b) and O’Connor et al. (2015b).
3.1. Signal Determination
In order to extract the desired signal, the two beams arechopped on and off, but out of phase with one another. Thisenables us to unambiguously subtract the various backgrounds.The chopping cycle is governed by the laser operating in asquare-wave mode: on for 5 ms and then off for 5 ms. The +H3beam is electrostatically chopped with the same time structure,but delayed by a phase shift of 2.5 ms. This chopping cycle isrepeated for 10 s at a given value of Uf.
In the first phase of this chopping cycle, only the D beam ison and the counts are denoted by N1. In the second phase, bothbeams are on and the counts are N2. In the third phase, only the
+H3 beam is on and the counts are N3. In the last phase, bothbeams are off and the counts are N4. The desired signal countsNs are given by
= - - + ( )N N N N N 9S 2 1 3 4
and the corresponding statistical uncertainty by
d = + + +( ) ( )N N N N N . 10S 1 2 3 41 2
The signal rate S is given by dividing NS by the correspondingintegration time of τ=2.5 s at each step in the chopping pattern.The fractional statistical uncertainty in S is given by δNS/NS.
3.2. Data Acquisition Procedure
Each data run typically consists of 10 scans of Uf
(i=1–10), which is swept through a series of 20 voltagesteps ( j=1–20) for each scan. A run corresponds to about onehour and is comparable to the timescale over which both beamsare stable.
The Uf scan ranges used here were −900 to 1000 V, −450 to500 V, and −225 to 250 V. Measurements of the ion and
neutral beam profiles are performed independently at thebeginning and end of each sweep. For the neutral beammeasurements, we found no significant variation over the rangescanned in Uf. So, we set Uf=0 V for the neutral beam profilemeasurements. The data presented below represent the averageof various accumulated data runs over the three Uf ranges listedabove.Signal is collected within a predefined sweep range for Uf by
automatically incrementing the floating cell voltage every 10s.The voltages of the chicane and the final analyzer are scaledsynchronously with each step of the floating cell voltage, asgiven by Equation (5). This configuration is to be contrastedwith our earlier work where data were collected at just onefloating cell voltage for each data run (O’Connor et al. 2015b;de Ruette et al. 2016).As mentioned earlier, it is not possible to set the voltages on
the chicane to simultaneously direct the +H3 into the chicaneFaraday cup and transmit the product H2D
+ into the finalanalyzer. To overcome this, we measure the +H3 current, Ii,before and after each 10 s increment at a given Uf using thechicane Faraday cup as described earlier. We have confirmedthat the ion beam is sufficiently stable over a 10s increment tojustify this.
3.3. Relative Translational Energy and Beam Overlap
The relative translational energy Er in the center-of-masssystem for monoenergetic beams intersecting at an angle θ isgiven by (Brouillard & Claeys 1983)
m q= + -⎛⎝⎜
⎞⎠⎟ ( )E
E
m
E
m
E E
m m2 cos . 11r
n
n
i
i
n i
n i
Here, mn=2.015 u and mi=3.023 u are the masses of the Datom and the +H3 ion, respectively (Linstrom & Mallard 2018).The reduced mass is defined as
m =+
( )m m
m m. 12n i
n i
For our work here, we have μ=1.209 u. The correspondingrelative velocity is
m= ( )v
E2. 13r
r
In our experiment, the two beams interact over a range ofangles and with a spread in kinetic energies. The former isdetermined by θbulk between the two beams combined withthe divergences of each beam. The latter is determined by the±10 eV energy spread of each source. We have calculated theresulting Er using a Monte Carlo particle ray tracing asdescribed in Bruhns et al. (2010b) and O’Connor et al. (2015b).These simulations were adjusted to match the constraints fromthe various collimating aperture dimensions and locations inthe apparatus as well as from the measured beam profiles.Specifically, the simulations were adjusted to reproduce themeasured typical bulk angle of θbulk=0.39±0.19 mrad,beam profiles, overlaps, and the overlap integral of áW ñ =( )z
-2.81 0.19 cm 2, which was calculated from the beamprofiles measured along the interaction region as describedby Bruhns et al. (2010b) and O’Connor et al. (2015b).
5
The Astrophysical Journal, 877:38 (16pp), 2019 May 20 Hillenbrand et al.
The simulations also yield a histogram of relative transla-tional energies throughout the interaction volume. We take themean of this distribution as our experimental Er and the one-standard-deviation spread of the histogram, ΔEr, as our relativeenergy uncertainty. The resulting distribution of Er for a givenUf is nearly Maxwellian for low values of ∣ ∣Uf and converges toa Gaussian distribution for larger values of ∣ ∣Uf .
Additional fine-tuning of the Er scale is achieved bycomparing the results measured when the neutrals are fasterthan the ions (Uf>0 V) to when they are slower (Uf<0 V).The results should be symmetric in magnitude around Uf=0 V. We find that the expected symmetry requires applying asmall correction of +6 V to Uf. We attribute this to slightdifferences in the plasma potentials between the D− and +H3duoplasmatron sources. Taking this into account in oursimulations results in a calculated minimum experimentalEr=9±7 meV, corresponding to a translational temperatureof ≈70 K. The highest collision energies studied correspond to10.8±0.1 eV and 11.8±0.1 eV for Uf=−0.9 kV and1.0 kV, respectively.
3.4. Merged-beams Rate Coefficient
We measure the cross section, σ, for Reaction(1) times therelative velocity, vr, between the collidors convolved with theenergy spread of the experiment. The merged-beams ratecoefficient and corresponding uncertainty for a given Uf scan iand voltage step j is given by
sd
t há ñ =
áW ñ( )( )v
N N
T T
e v v
I I L z
1 1. 14i j
S Sr ,
a g
2n i
n i
i j i j, ,
Here, the velocities vn and vi are those of the neutral andmolecular ion beams, respectively, and are calculated using thecorresponding beam energies. The other variables have beendefined previously. We measure each of the quantities on theright-hand side of Equation (14), enabling us to generateabsolute results, independent of any normalization.
Typical values of the experimental parameters going intoEquation (14) and their uncertainties are summarized inTable 1. The neutral current is given by the average over the10 s period j and the ion current by the average of themeasurements before and after this period. áW ñ( )z is taken fromthe average of all overlap measurements in a given data run,typically 11. Those quantities that varied between the steps of ascan are grouped under “Nonconstants” in Table 1 and thosethat remained constant throughout all runs are grouped under“Constants.”
In order to calculate sá ñv jr and the corresponding uncertaintyfor a given data run, we used the unweighted average of theresults from all voltage scans i, given by
ss
á ñ =S á ñ= ( )v
v
i. 15j
ii
i jr
1 r ,
max
max
Various data runs were combined using a statistically weightedaverage of all measured sá ñv jr at the same Uf step (e.g.,O’Connor et al. 2015b). Finally, the values of Er and ΔEr wereassigned to each value of Uf, based on the average overlap andbulk angle from all data runs, as described in Section 3.3.
4. Theoretical Approach
4.1. Energy Profile of the Reaction Path
The six-dimensional Born–Oppenheimer (BO) electronicPES of the +H4 cation defines the energy landscape governingthe dynamics of the isotopic exchange reaction
+ ++ + ( )X H XH H, 163 2
where X=H or D.For the X/H exchange reaction, a wave packet propagating
on this PES will follow a route connecting the entrance channelto the exit channel. Along this path, the system will crossstationary points located on this surface (global/local minimaand transition states). The relative energies of these criticalpoints and the minimum energy path linking them define theBO-energy profile of the reaction. This profile is useful fordiscussing our experimental results and how they are affectedby the presence of the potential energy barrier along thereaction path.The height of the barrier with respect to the entrance channel
corresponds to the minimum energy classically required toobserve reactive trajectories. However, quantum mechanicsrequires that the total internal energy of the system be greaterthan or equal to its vibrational ZPE. It is therefore necessary toadd the ZPE values of the different stationary points to thecorresponding BO energies, leading to a vibrationally adiabaticminimum energy path (Jankunas et al. 2014). We refer to thisbelow as the ZPE-corrected energy profile. The correctedbarrier height can then be used to predict the minimumcollision energy at which a nonzero cross section would beobserved, in absence of quantum tunneling. Note that the BO
Table 1Typical Experimental Values for Equation (14) with Corresponding
Uncertainties
Source Symbol Value Uncertainty(%)
Nonconstants:Signal rate S 20 s−1 �9(statistical)D velocity vn 1.07×108 cm s−1 =1D current In 43 nA 5H3+ current Ii 1.1 μA 5
Overlap factor áW ñ( )z 2.8 cm−2 10
Neutral detector γ 1.6 6efficiencyConstants:H3+ velocity vi 1.07×108 cm s−1 =1
Analyzer Ta 0.90 5transmissionGrid Tg 0.90 1transmissionNeutral Tn 0.95 3transmissionCEM efficiency η 0.99 3Interaction L 121.5 cm 2length
Total systematic uncertainty 15(excluding the signal rate)
Note.The total systematic uncertainty (excluding the statistical error) iscalculated by treating each individual uncertainty as a random sign error andadding all in quadrature.
6
The Astrophysical Journal, 877:38 (16pp), 2019 May 20 Hillenbrand et al.
PES and the resulting energy profile are independent of thenuclear masses and are identical for the X=H or D reactions.However, the corresponding ZPE-corrected profiles acquire themass dependency of the vibrational energies and are thus notidentical for X=H and D.
Below, we determine the ZPE-corrected energy profiles fromab initio calculations. For this we build on previously publishedab initio work characterizing the +H4 BO PES (Jiang et al. 1989;Álvarez-Collado et al. 1995; Moyano et al. 2004; Alijah &Varandas 2008; Sanz-Sanz et al. 2013).
4.2. Topography of the +H4 PES
The global topography of the +H4 PES is well known. Thestationary points have been characterized (energies andgeometries) at different levels of ab initio theory, and theconvergence toward exact energies has been carefully inves-tigated (Moyano et al. 2004; Alijah & Varandas 2008; Sanz-Sanz et al. 2013). Harmonic vibrational frequencies and thecorresponding ZPE values have been calculated, but only forthe +H4 isotopologue (Alijah & Varandas 2008; Sanz-Sanz et al.2013). Global analytical PESs have also been interpolated fromab initio points, first by Moyano et al. (2004) at a medium levelof theory and later by Sanz-Sanz et al. (2013) at a higher level.These calculations predict the energy path describing the X/Hexchange reaction.
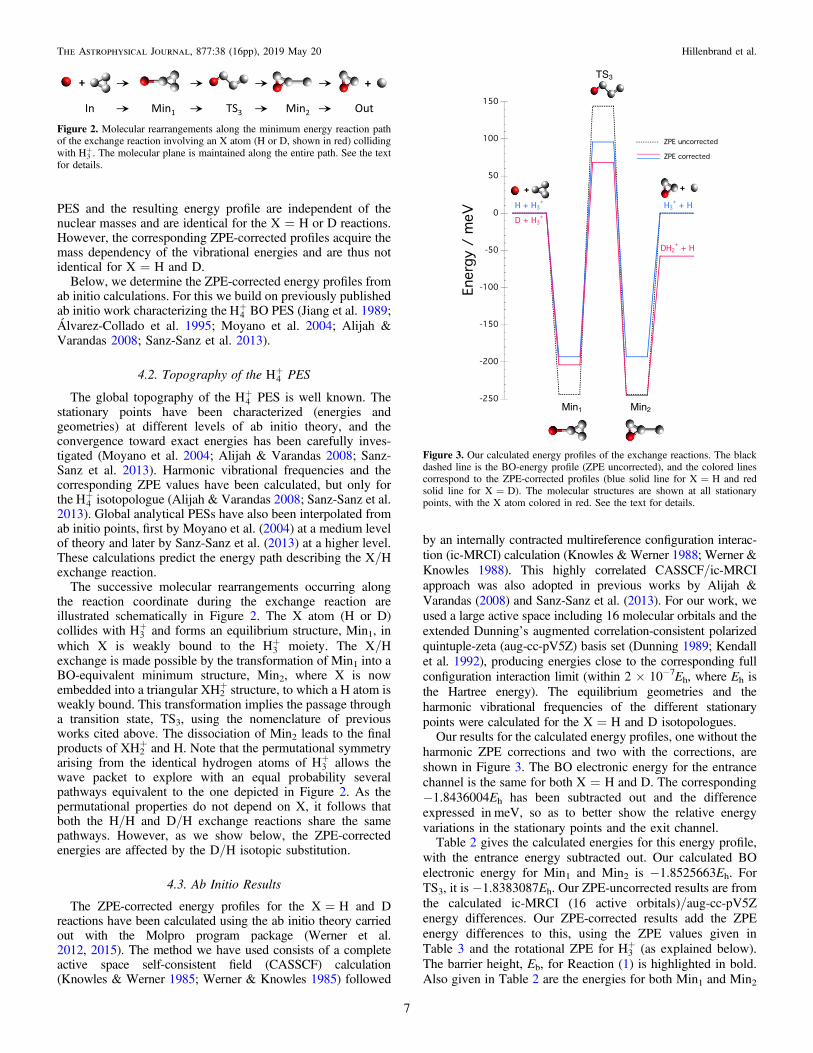
The successive molecular rearrangements occurring alongthe reaction coordinate during the exchange reaction areillustrated schematically in Figure 2. The X atom (H or D)collides with +H3 and forms an equilibrium structure, Min1, inwhich X is weakly bound to the +H3 moiety. The X/Hexchange is made possible by the transformation of Min1 into aBO-equivalent minimum structure, Min2, where X is nowembedded into a triangular XH2
+ structure, to which a H atom isweakly bound. This transformation implies the passage througha transition state, TS3, using the nomenclature of previousworks cited above. The dissociation of Min2 leads to the finalproducts of XH2
+ and H. Note that the permutational symmetryarising from the identical hydrogen atoms of +H3 allows thewave packet to explore with an equal probability severalpathways equivalent to the one depicted in Figure 2. As thepermutational properties do not depend on X, it follows thatboth the H/H and D/H exchange reactions share the samepathways. However, as we show below, the ZPE-correctedenergies are affected by the D/H isotopic substitution.
4.3. Ab Initio Results
The ZPE-corrected energy profiles for the X=H and Dreactions have been calculated using the ab initio theory carriedout with the Molpro program package (Werner et al.2012, 2015). The method we have used consists of a completeactive space self-consistent field (CASSCF) calculation(Knowles & Werner 1985; Werner & Knowles 1985) followed
by an internally contracted multireference configuration interac-tion (ic-MRCI) calculation (Knowles & Werner 1988; Werner &Knowles 1988). This highly correlated CASSCF/ic-MRCIapproach was also adopted in previous works by Alijah &Varandas (2008) and Sanz-Sanz et al. (2013). For our work, weused a large active space including 16 molecular orbitals and theextended Dunning’s augmented correlation-consistent polarizedquintuple-zeta (aug-cc-pV5Z) basis set (Dunning 1989; Kendallet al. 1992), producing energies close to the corresponding fullconfiguration interaction limit (within 2×10⁻⁷Eh, where Eh isthe Hartree energy). The equilibrium geometries and theharmonic vibrational frequencies of the different stationarypoints were calculated for the X=H and D isotopologues.Our results for the calculated energy profiles, one without the
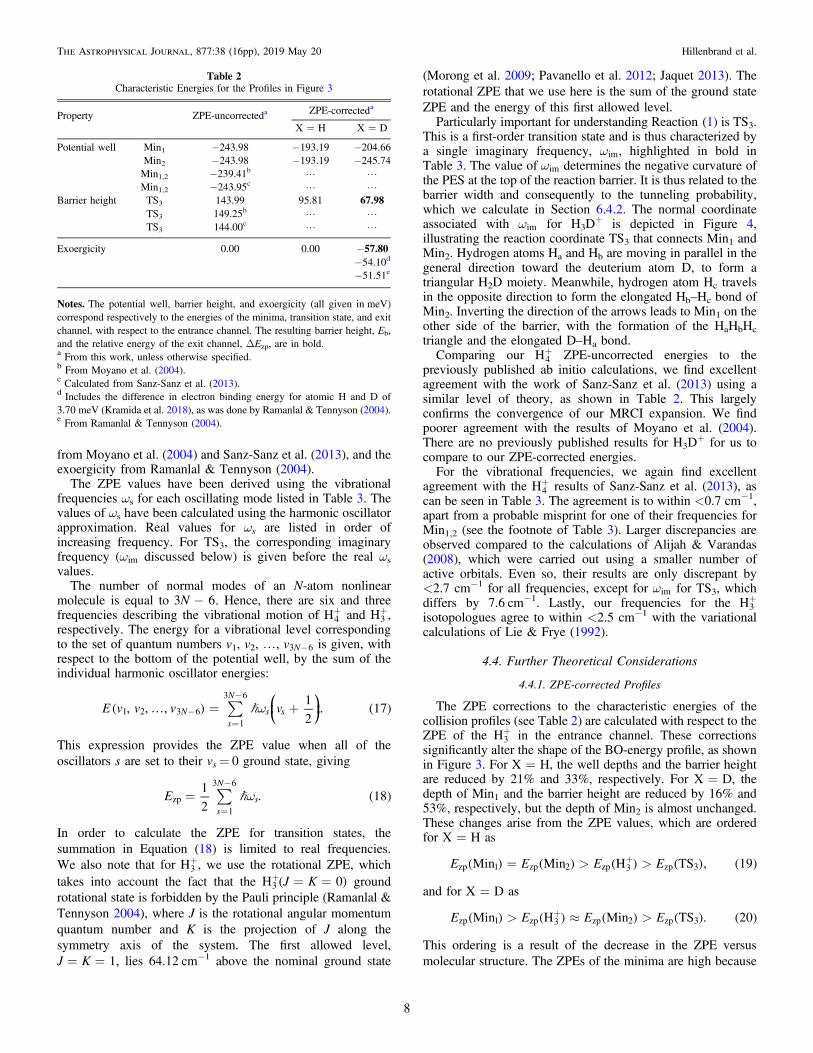
harmonic ZPE corrections and two with the corrections, areshown in Figure 3. The BO electronic energy for the entrancechannel is the same for both X=H and D. The corresponding−1.8436004Eh has been subtracted out and the differenceexpressed in meV, so as to better show the relative energyvariations in the stationary points and the exit channel.Table 2 gives the calculated energies for this energy profile,
with the entrance energy subtracted out. Our calculated BOelectronic energy for Min1 and Min2 is −1.8525663Eh. ForTS3, it is −1.8383087Eh. Our ZPE-uncorrected results are fromthe calculated ic-MRCI (16 active orbitals)/aug-cc-pV5Zenergy differences. Our ZPE-corrected results add the ZPEenergy differences to this, using the ZPE values given inTable 3 and the rotational ZPE for +H3 (as explained below).The barrier height, Eb, for Reaction(1) is highlighted in bold.Also given in Table 2 are the energies for both Min1 and Min2
Figure 2. Molecular rearrangements along the minimum energy reaction pathof the exchange reaction involving an X atom (H or D, shown in red) collidingwith +H3 . The molecular plane is maintained along the entire path. See the textfor details.
Figure 3. Our calculated energy profiles of the exchange reactions. The blackdashed line is the BO-energy profile (ZPE uncorrected), and the colored linescorrespond to the ZPE-corrected profiles (blue solid line for X=H and redsolid line for X=D). The molecular structures are shown at all stationarypoints, with the X atom colored in red. See the text for details.
7
The Astrophysical Journal, 877:38 (16pp), 2019 May 20 Hillenbrand et al.
from Moyano et al. (2004) and Sanz-Sanz et al. (2013), and theexoergicity from Ramanlal & Tennyson (2004).
The ZPE values have been derived using the vibrationalfrequencies ωs for each oscillating mode listed in Table 3. Thevalues of ωs have been calculated using the harmonic oscillatorapproximation. Real values for ωs are listed in order ofincreasing frequency. For TS3, the corresponding imaginaryfrequency (wim discussed below) is given before the real ωs
values.The number of normal modes of an N-atom nonlinear
molecule is equal to -N3 6. Hence, there are six and threefrequencies describing the vibrational motion of +H4 and +H3 ,respectively. The energy for a vibrational level correspondingto the set of quantum numbers v1, v2, K, -v N3 6 is given, withrespect to the bottom of the potential well, by the sum of theindividual harmonic oscillator energies:
å w¼ = +-=
-⎜ ⎟⎛⎝
⎞⎠( ) ( )E v v v v, , ,
1
2. 17N
s
N
s s1 2 3 61
3 6
This expression provides the ZPE value when all of theoscillators s are set to their vs= 0 ground state, giving
å w==
-
( )E1
2. 18
s
N
szp1
3 6
In order to calculate the ZPE for transition states, thesummation in Equation (18) is limited to real frequencies.We also note that for +H3 , we use the rotational ZPE, whichtakes into account the fact that the = =+( )J KH 03 groundrotational state is forbidden by the Pauli principle (Ramanlal &Tennyson 2004), where J is the rotational angular momentumquantum number and K is the projection of J along thesymmetry axis of the system. The first allowed level,J=K=1, lies 64.12 cm−1 above the nominal ground state
(Morong et al. 2009; Pavanello et al. 2012; Jaquet 2013). Therotational ZPE that we use here is the sum of the ground stateZPE and the energy of this first allowed level.Particularly important for understanding Reaction(1) is TS3.
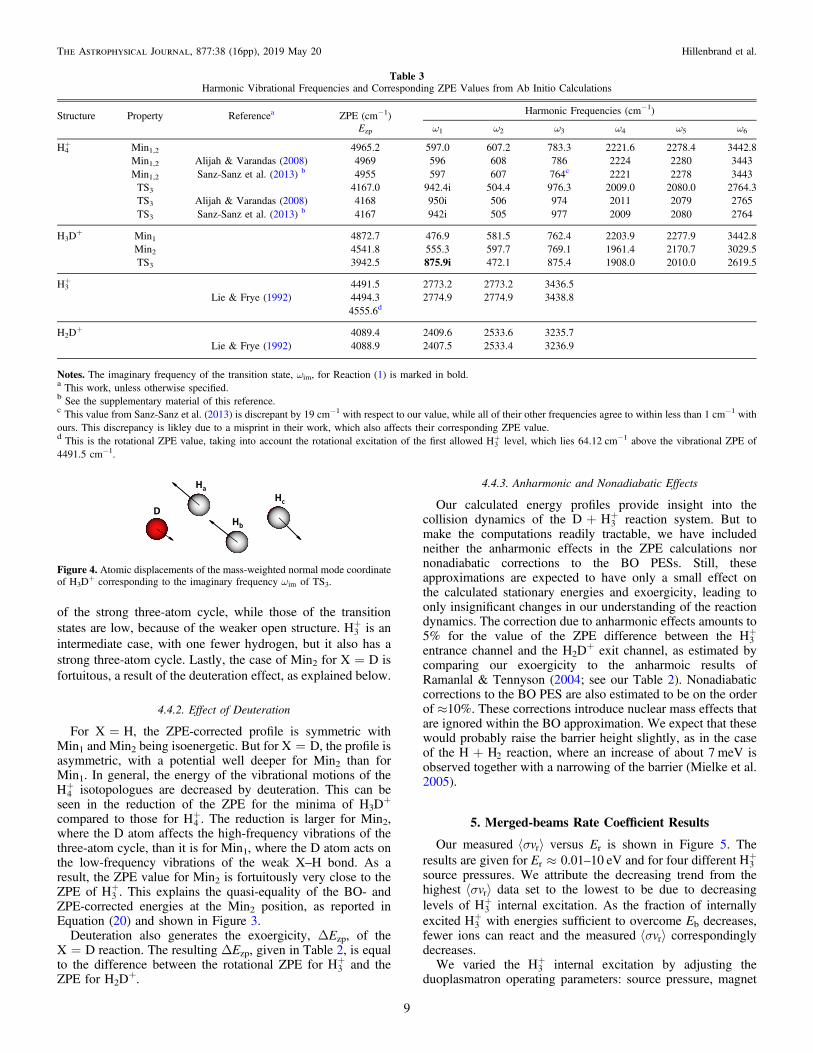
This is a first-order transition state and is thus characterized bya single imaginary frequency, wim, highlighted in bold inTable 3. The value of wim determines the negative curvature ofthe PES at the top of the reaction barrier. It is thus related to thebarrier width and consequently to the tunneling probability,which we calculate in Section 6.4.2. The normal coordinateassociated with wim for H3D
+ is depicted in Figure 4,illustrating the reaction coordinate TS3 that connects Min1 andMin2. Hydrogen atoms Ha and Hb are moving in parallel in thegeneral direction toward the deuterium atom D, to form atriangular H2D moiety. Meanwhile, hydrogen atom Hc travelsin the opposite direction to form the elongated Hb–Hc bond ofMin2. Inverting the direction of the arrows leads to Min1 on theother side of the barrier, with the formation of the HaHbHc
triangle and the elongated D–Ha bond.Comparing our +H4 ZPE-uncorrected energies to the
previously published ab initio calculations, we find excellentagreement with the work of Sanz-Sanz et al. (2013) using asimilar level of theory, as shown in Table 2. This largelyconfirms the convergence of our MRCI expansion. We findpoorer agreement with the results of Moyano et al. (2004).There are no previously published results for H3D
+ for us tocompare to our ZPE-corrected energies.For the vibrational frequencies, we again find excellent
agreement with the +H4 results of Sanz-Sanz et al. (2013), ascan be seen in Table 3. The agreement is to within <0.7 cm−1,apart from a probable misprint for one of their frequencies forMin1,2 (see the footnote of Table 3). Larger discrepancies areobserved compared to the calculations of Alijah & Varandas(2008), which were carried out using a smaller number ofactive orbitals. Even so, their results are only discrepant by<2.7 cm−1 for all frequencies, except for wim for TS3, whichdiffers by 7.6 cm−1. Lastly, our frequencies for the +H3isotopologues agree to within <2.5 cm−1 with the variationalcalculations of Lie & Frye (1992).
4.4. Further Theoretical Considerations
4.4.1. ZPE-corrected Profiles
The ZPE corrections to the characteristic energies of thecollision profiles (see Table 2) are calculated with respect to theZPE of the +H3 in the entrance channel. These correctionssignificantly alter the shape of the BO-energy profile, as shownin Figure 3. For X=H, the well depths and the barrier heightare reduced by 21% and 33%, respectively. For X=D, thedepth of Min1 and the barrier height are reduced by 16% and53%, respectively, but the depth of Min2 is almost unchanged.These changes arise from the ZPE values, which are orderedfor X=H as
= > >+( ) ( ) ( ) ( ) ( )E E E EMin Min H TS , 19zp 1 zp 2 zp 3 zp 3
and for X=D as
> » >+( ) ( ) ( ) ( ) ( )E E E EMin H Min TS . 20zp 1 zp 3 zp 2 zp 3
This ordering is a result of the decrease in the ZPE versusmolecular structure. The ZPEs of the minima are high because
Table 2Characteristic Energies for the Profiles in Figure 3
Property ZPE-uncorrecteda ZPE-correcteda
X=H X=D
Potential well Min1 −243.98 −193.19 −204.66Min2 −243.98 −193.19 −245.74Min1,2 −239.41b L LMin1,2 −243.95c L L
Barrier height TS3 143.99 95.81 67.98TS3 149.25b L LTS3 144.00c L L
Exoergicity 0.00 0.00 −57.80−54.10d
−51.51e
Notes.The potential well, barrier height, and exoergicity (all given in meV)correspond respectively to the energies of the minima, transition state, and exitchannel, with respect to the entrance channel. The resulting barrier height, Eb,and the relative energy of the exit channel, ΔEzp, are in bold.a From this work, unless otherwise specified.b From Moyano et al. (2004).c Calculated from Sanz-Sanz et al. (2013).d Includes the difference in electron binding energy for atomic H and D of3.70 meV (Kramida et al. 2018), as was done by Ramanlal & Tennyson (2004).e From Ramanlal & Tennyson (2004).
8
The Astrophysical Journal, 877:38 (16pp), 2019 May 20 Hillenbrand et al.
of the strong three-atom cycle, while those of the transitionstates are low, because of the weaker open structure. +H3 is anintermediate case, with one fewer hydrogen, but it also has astrong three-atom cycle. Lastly, the case of Min2 for X=D isfortuitous, a result of the deuteration effect, as explained below.
4.4.2. Effect of Deuteration
For X=H, the ZPE-corrected profile is symmetric withMin1 and Min2 being isoenergetic. But for X=D, the profile isasymmetric, with a potential well deeper for Min2 than forMin1. In general, the energy of the vibrational motions of the
+H4 isotopologues are decreased by deuteration. This can beseen in the reduction of the ZPE for the minima of H3D
+
compared to those for +H4 . The reduction is larger for Min2,where the D atom affects the high-frequency vibrations of thethree-atom cycle, than it is for Min1, where the D atom acts onthe low-frequency vibrations of the weak X–H bond. As aresult, the ZPE value for Min2 is fortuitously very close to theZPE of +H3 . This explains the quasi-equality of the BO- andZPE-corrected energies at the Min2 position, as reported inEquation (20) and shown in Figure 3.
Deuteration also generates the exoergicity, ΔEzp, of theX=D reaction. The resulting ΔEzp, given in Table 2, is equalto the difference between the rotational ZPE for +H3 and theZPE for H2D
+.
4.4.3. Anharmonic and Nonadiabatic Effects
Our calculated energy profiles provide insight into thecollision dynamics of the + +D H3 reaction system. But tomake the computations readily tractable, we have includedneither the anharmonic effects in the ZPE calculations nornonadiabatic corrections to the BO PESs. Still, theseapproximations are expected to have only a small effect onthe calculated stationary energies and exoergicity, leading toonly insignificant changes in our understanding of the reactiondynamics. The correction due to anharmonic effects amounts to5% for the value of the ZPE difference between the +H3entrance channel and the H2D
+ exit channel, as estimated bycomparing our exoergicity to the anharmoic results ofRamanlal & Tennyson (2004; see our Table 2). Nonadiabaticcorrections to the BO PES are also estimated to be on the orderof ≈10%. These corrections introduce nuclear mass effects thatare ignored within the BO approximation. We expect that thesewould probably raise the barrier height slightly, as in the caseof the +H H2 reaction, where an increase of about 7 meV isobserved together with a narrowing of the barrier (Mielke et al.2005).
5. Merged-beams Rate Coefficient Results
Our measured sá ñvr versus Er is shown in Figure 5. Theresults are given for Er≈0.01–10 eV and for four different +H3source pressures. We attribute the decreasing trend from thehighest sá ñvr data set to the lowest to be due to decreasinglevels of +H3 internal excitation. As the fraction of internallyexcited +H3 with energies sufficient to overcome Eb decreases,fewer ions can react and the measured sá ñvr correspondinglydecreases.We varied the +H3 internal excitation by adjusting the
duoplasmatron operating parameters: source pressure, magnet
Table 3Harmonic Vibrational Frequencies and Corresponding ZPE Values from Ab Initio Calculations
Structure Property Referencea ZPE (cm−1) Harmonic Frequencies (cm−1)
Ezp ω1 ω2 ω3 ω4 ω5 ω6
H4+ Min1,2 4965.2 597.0 607.2 783.3 2221.6 2278.4 3442.8
Min1,2 Alijah & Varandas (2008) 4969 596 608 786 2224 2280 3443Min1,2 Sanz-Sanz et al. (2013) b 4955 597 607 764c 2221 2278 3443TS3 4167.0 942.4i 504.4 976.3 2009.0 2080.0 2764.3TS3 Alijah & Varandas (2008) 4168 950i 506 974 2011 2079 2765TS3 Sanz-Sanz et al. (2013) b 4167 942i 505 977 2009 2080 2764
H3D+ Min1 4872.7 476.9 581.5 762.4 2203.9 2277.9 3442.8
Min2 4541.8 555.3 597.7 769.1 1961.4 2170.7 3029.5TS3 3942.5 875.9i 472.1 875.4 1908.0 2010.0 2619.5
H3+ 4491.5 2773.2 2773.2 3436.5
Lie & Frye (1992) 4494.3 2774.9 2774.9 3438.84555.6d
H2D+ 4089.4 2409.6 2533.6 3235.7
Lie & Frye (1992) 4088.9 2407.5 2533.4 3236.9
Notes.The imaginary frequency of the transition state, ωim, for Reaction(1) is marked in bold.a This work, unless otherwise specified.b See the supplementary material of this reference.c This value from Sanz-Sanz et al. (2013) is discrepant by 19 cm−1 with respect to our value, while all of their other frequencies agree to within less than 1 cm−1 withours. This discrepancy is likley due to a misprint in their work, which also affects their corresponding ZPE value.d This is the rotational ZPE value, taking into account the rotational excitation of the first allowed +H3 level, which lies 64.12 cm−1 above the vibrational ZPE of4491.5 cm−1.
Figure 4. Atomic displacements of the mass-weighted normal mode coordinateof H3D
+ corresponding to the imaginary frequency wim of TS3.
9
The Astrophysical Journal, 877:38 (16pp), 2019 May 20 Hillenbrand et al.
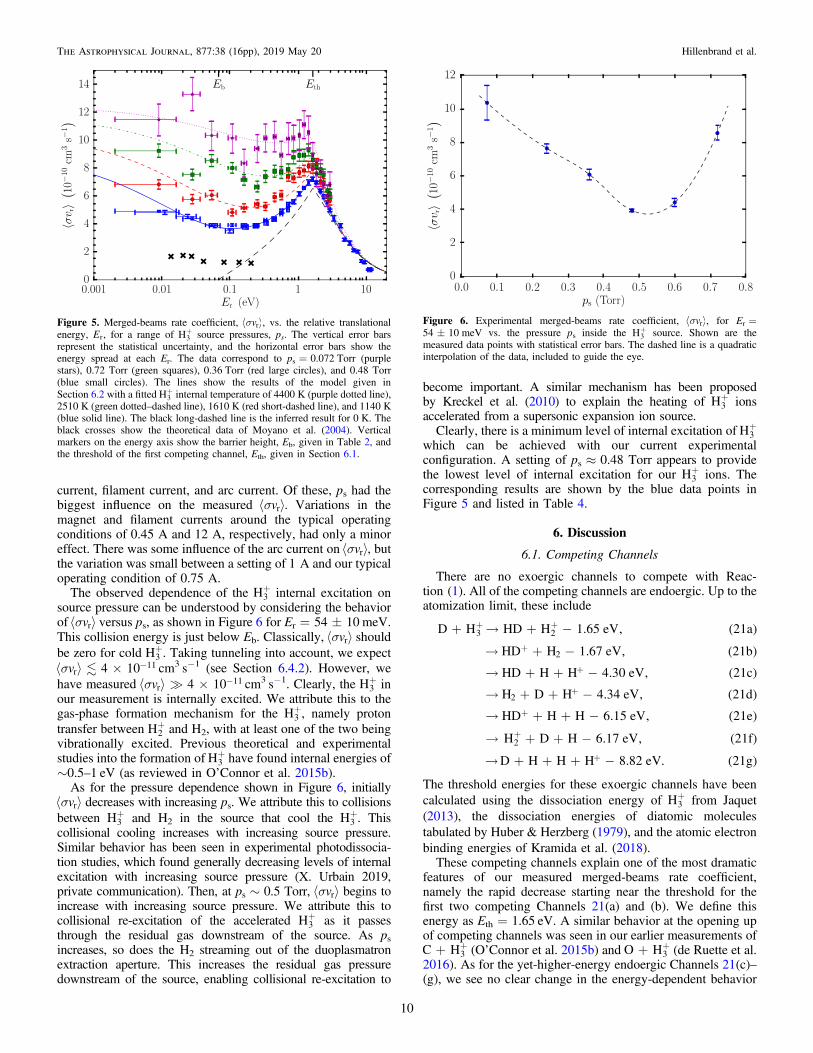
current, filament current, and arc current. Of these, ps had thebiggest influence on the measured sá ñvr . Variations in themagnet and filament currents around the typical operatingconditions of 0.45A and 12A, respectively, had only a minoreffect. There was some influence of the arc current on sá ñvr , butthe variation was small between a setting of 1A and our typicaloperating condition of 0.75A.
The observed dependence of the +H3 internal excitation onsource pressure can be understood by considering the behaviorof sá ñvr versus ps, as shown in Figure 6 for Er=54±10 meV.This collision energy is just below Eb. Classically, sá ñvr shouldbe zero for cold +H3 . Taking tunneling into account, we expect
sá ñ ´ -v 4 10r11 cm3 s−1 (see Section 6.4.2). However, we
have measured sá ñ ´ -v 4 10r11 cm3 s−1. Clearly, the +H3 in
our measurement is internally excited. We attribute this to thegas-phase formation mechanism for the +H3 , namely protontransfer between +H2 and H2, with at least one of the two beingvibrationally excited. Previous theoretical and experimentalstudies into the formation of +H3 have found internal energies of∼0.5–1 eV (as reviewed in O’Connor et al. 2015b).
As for the pressure dependence shown in Figure 6, initiallysá ñvr decreases with increasing ps. We attribute this to collisionsbetween +H3 and H2 in the source that cool the +H3 . Thiscollisional cooling increases with increasing source pressure.Similar behavior has been seen in experimental photodissocia-tion studies, which found generally decreasing levels of internalexcitation with increasing source pressure (X. Urbain 2019,private communication). Then, at ps∼0.5 Torr, sá ñvr begins toincrease with increasing source pressure. We attribute this tocollisional re-excitation of the accelerated +H3 as it passesthrough the residual gas downstream of the source. As psincreases, so does the H2 streaming out of the duoplasmatronextraction aperture. This increases the residual gas pressuredownstream of the source, enabling collisional re-excitation to
become important. A similar mechanism has been proposedby Kreckel et al. (2010) to explain the heating of +H3 ionsaccelerated from a supersonic expansion ion source.Clearly, there is a minimum level of internal excitation of +H3
which can be achieved with our current experimentalconfiguration. A setting of ps≈0.48 Torr appears to providethe lowest level of internal excitation for our +H3 ions. Thecorresponding results are shown by the blue data points inFigure 5 and listed in Table 4.
6. Discussion
6.1. Competing Channels
There are no exoergic channels to compete with Reac-tion(1). All of the competing channels are endoergic. Up to theatomization limit, these include
+ + -+ + ( )D H HD H 1.65 eV, 21a3 2
+ -+ ( )HD H 1.67 eV, 21b2
+ + -+ ( )HD H H 4.30 eV, 21c
+ + -+ ( )H D H 4.34 eV, 21d2
+ + -+ ( )HD H H 6.15 eV, 21e
+ + -+ ( )H D H 6.17 eV, 21f2
+ + + -+ ( )D H H H 8.82 eV. 21g
The threshold energies for these exoergic channels have beencalculated using the dissociation energy of +H3 from Jaquet(2013), the dissociation energies of diatomic moleculestabulated by Huber & Herzberg (1979), and the atomic electronbinding energies of Kramida et al. (2018).These competing channels explain one of the most dramatic
features of our measured merged-beams rate coefficient,namely the rapid decrease starting near the threshold for thefirst two competing Channels 21(a) and (b). We define thisenergy as Eth=1.65 eV. A similar behavior at the opening upof competing channels was seen in our earlier measurements of
+ +C H3 (O’Connor et al. 2015b) and + +O H3 (de Ruette et al.2016). As for the yet-higher-energy endoergic Channels 21(c)–(g), we see no clear change in the energy-dependent behavior
Figure 5. Merged-beams rate coefficient, sá ñvr , vs. the relative translationalenergy, Er, for a range of +H3 source pressures, ps. The vertical error barsrepresent the statistical uncertainty, and the horizontal error bars show theenergy spread at each Er. The data correspond to ps=0.072 Torr (purplestars), 0.72 Torr (green squares), 0.36 Torr (red large circles), and 0.48 Torr(blue small circles). The lines show the results of the model given inSection 6.2 with a fitted +H3 internal temperature of 4400 K (purple dotted line),2510 K (green dotted–dashed line), 1610 K (red short-dashed line), and 1140 K(blue solid line). The black long-dashed line is the inferred result for 0 K. Theblack crosses show the theoretical data of Moyano et al. (2004). Verticalmarkers on the energy axis show the barrier height, Eb, given in Table 2, andthe threshold of the first competing channel, Eth, given in Section 6.1.
Figure 6. Experimental merged-beams rate coefficient, sá ñvr , for Er=54±10 meV vs. the pressure ps inside the +H3 source. Shown are themeasured data points with statistical error bars. The dashed line is a quadraticinterpolation of the data, included to guide the eye.
10
The Astrophysical Journal, 877:38 (16pp), 2019 May 20 Hillenbrand et al.

of our results that would correspond to these channelsopening up.
6.2. Cross-section Model for the Experimental Results
We have developed a semiempirical model to describe theexperimental results shown in Figure 5. This model accountsfor the dominant features seen in our measurements: theinferred reaction barrier, the varying levels of +H3 internalexcitation, and the opening up of competing exoergic channels.We base our model, in part, on the Langevin-like formalismgiven by Levine (2005) for a scattering event with a reactionbarrier. In this model, the cross section is given by σ=πb2,where b is the maximum impact parameter for which the
reaction proceeds. In addition, all reactions are assumed tooccur with a probability of unity for all impact parametersequal to or smaller than b.For the first part of the model, we assume that any internal
excitation energy, Eint, for a given level in +H3 is fully availableto overcome any reaction barriers. Thus, the reaction will goforward when the sum of Er and Eint is sufficient to overcomethe combined energies of the repulsive centrifugal barrier andthe reaction barrier. This gives
+ + ( )E EE b
RE , 22r int
r b2
b2 b
where bb is the impact factor taking the reaction barrier intoaccount and Rb is the radial separation of the reactants at thelocation of the reaction barrier. Solving for bb
2 gives
+-⎡
⎣⎢⎤⎦⎥ ( )b R
E E
E1 . 23b
2b2 int b
r
We take the maximum value of bb2.
For the second part of the model, we introduce a fluxreduction factor, S(Er, Eint, Eth), to account for the opening of thecompeting exoergic channels discussed in Section 6.1. The valueof Er where the first competing channel opens up can be shiftedfrom Eth toward lower energies by all or part of Eint, dependingon the fraction, f, of Eint that goes into overcoming the thresholdfor the competing exoergic channel. By analogy with the so-called survival factor introduced for dissociative recombinationstudies by Strömholm et al. (1995), we can then write
=< -
+ - +-
⎧⎨⎪⎩⎪
( )
[ ( )]
( )
S E E E
E E fE
a E E fEE E fE
, ,
1
1
1,
24
r int th
r th int
r th int2 r th int
where a and f are adjustable parameters. Putting togethereverything so far, we have
s
p=
+ <
+-
+
⎧⎨⎪⎩⎪
⎡⎣⎢
⎤⎦⎥
( )
( )
( )
E E
E E E
RE E
ES E E E E E E
,
0
1 , , .
25
b r int
r int b
b2 int b
rr int th r int b
Next, we take into account that the upper limit for a reactioncross section is commonly assumed to be the classicalLangevin value, σL. The Langevin cross section results fromthe combined effects of the attractive charge-induced dipolemoment between D and +H3 , and the repulsive centrifugalbarrier, and is given by (Levine 2005)
s pa
=⎛⎝⎜
⎞⎠⎟( ) ( )E e
E
2. 26L r
D
r
1 2
Here, αD is the static dipole polarizability of D. This is givenby Schwerdtfeger & Nagle (2019) as a p= ( )a9 8D 0
30 , where
a0 is the Bohr radius and ò0 is the vacuum permittivity.Solving Equations (25) and (26), we find that for a given
value of Eint, σb>σL for Er below some energy that we defineas Ex. As Eint increases, so does the value of Ex. To avoid thesesituations, we select the reaction cross section to be the smallerof σb and σL. In addition, we assume complete scrambling of
Table 4List of Experimental Merged-beams Rate Coefficients, sá ñvr , with
Corresponding One-standard-deviation Statistical Uncertainties, sDá ñvr , as aFunction of the Relative Translational Energy, Er, with the One-standard-
deviation Width of the Collision-energy Spread,ΔEr, vs. Applied Floating CellVoltages, Uf
Uf Er ΔEr sá ñvr sDá ñvr(kV) (eV) - -( )10 cm s10 3 1
−0.900 10.774 0.120 0.754 0.066−0.800 8.501 0.107 1.350 0.086−0.700 6.506 0.093 2.112 0.102−0.600 4.784 0.080 2.886 0.120−0.500 3.333 0.066 4.404 0.145−0.450 2.707 0.060 5.543 0.138−0.400 2.148 0.053 6.377 0.111−0.350 1.655 0.047 7.205 0.153−0.300 1.227 0.040 6.604 0.113−0.250 0.864 0.034 5.567 0.136−0.225 0.707 0.031 5.059 0.154−0.200 0.565 0.028 4.763 0.082−0.175 0.440 0.025 4.358 0.143−0.150 0.331 0.021 4.263 0.091−0.125 0.238 0.018 3.861 0.136−0.100 0.161 0.016 3.901 0.075−0.075 0.099 0.013 3.521 0.129−0.050 0.054 0.010 3.928 0.089−0.025 0.024 0.008 4.543 0.1460.000 0.009 0.007 4.918 0.0830.025 0.011 0.007 4.820 0.1520.050 0.028 0.008 4.383 0.0940.075 0.060 0.011 3.905 0.1370.100 0.108 0.013 3.930 0.0750.125 0.172 0.016 3.782 0.1360.150 0.251 0.019 3.891 0.0890.175 0.345 0.022 4.079 0.1390.200 0.454 0.025 4.359 0.0790.225 0.579 0.028 4.908 0.1560.250 0.719 0.031 5.402 0.1040.300 1.045 0.037 6.179 0.1110.350 1.430 0.043 6.968 0.1530.400 1.876 0.049 6.988 0.1180.450 2.381 0.055 5.932 0.1450.500 2.946 0.061 5.003 0.1020.600 4.251 0.073 3.889 0.1400.700 5.788 0.084 2.642 0.1220.800 7.556 0.096 2.033 0.1030.900 9.550 0.108 1.262 0.8341.000 11.769 0.119 0.710 0.064
Note.The data listed here correspond to the measurement, where the internaltemperature of the +H3 inferred from our model is 1140 K.
11
The Astrophysical Journal, 877:38 (16pp), 2019 May 20 Hillenbrand et al.
the nuclei during the + +D H3 reaction. This is guided by thetheoretical approach of Hugo et al. (2009) for isotopic variantsof the + +H H2 3 reaction. For the + +D H3 reaction, only threeof the asymptotic channels lead to the formation of H2D
+. Thefourth outgoing channel leads to the formation of +H3 . Toaccount for this, we introduce a factor of 3/4 into our reactioncross section, giving
s s s=( ) [ ( ) ( )] ( )E E E E E,3
4min , , . 27r int b r int L r
Now, in order to compare this reaction cross section to ourexperimental results, we need to take into account theexcitation energy of each +H3 level involved in the reaction.We do this assuming that the +H3 levels follow a Boltzmanndistribution,
= - á ñ( ) ( ) ( )g E E Eexp , 28int int int
where á ñEint is a function of the internal temperature Tint of+H3
and is derived from the partition function Z(T),
á ñ =¶¶
( )E k TZ
Z
T
1. 29int B int
2
int
We use the parameterization of á ñEint versus Tint given inKylänpää & Rantala (2011).
In the penultimate step of our model, we convolveEquation (27) over Eint. The resulting model cross section isgiven by
òs
s
á ñ
=á ñ
- á ñ¥
( )
( ) ( ) ( )
E E
EE E E E dE
,1
, exp . 30
mod r int
int 0r int int int int
There are four adjustable parameters in our model crosssection: á ñR E a, ,b int , and f. For the other values needed inEquation (30), we use Eb=67.98 meV from our ab initiocalculations (see Section 4.3) and Eth=1.65 eV from thecalculated energetics for the competing exoergic channels (seeSection 6.1).
Lastly, in order to compare to our measured merged-beamsrate coefficient, we multiplied Equation (30) by vr and variedthe four adjustable parameters to best fit the experimental data.Given the complexity of the model cross section and the lack ofany clean analytic formula for the cross section, we carried outa by-eye fit, as opposed to a least-squares fit. This is notexpected to be an issue as our model is overconstrained by thedata. For E Eth, the magnitude and energy dependence ofthe data are determined by Rb and á ñEint . Having fixed thosetwo parameters, we then fit for a and f using the data for Er Eth. In each energy range, we fit for two free parameters usingour four sets of measured data, thereby making the systemoverconstrained. As an additional constraint, we required thatthe fits all use the same set of values for Rb, a, and f, and onlylet á ñEint vary between the fits to the four data sets.
Our semiempirical model results are shown in Figure 5. Themodel clearly demonstrates all of the major energy dependen-cies seen in the experimental data, namely (i) a pronouncedminimum in the merged-beams rate coefficient nearEr∼0.1 eV, (ii) a distinct increase in the merged-beams ratecoefficient from this energy until the opening of the competingexoergic reaction channels, (iii) a subsequent rapid decrease inmerged-beams rate coefficient, and (iv) an overall increase ofthe merged-beams rate coefficient with increasing á ñEint of +H3 .
Commenting on the best-fit parameters, we found the bestagreement between the measured data and our model forRb=2.53a0. This is relatively close to the geometry of TS3,which has a distance of 2.87a0 between the D atom andthe center of mass of the +H3 moiety, as deduced from theoptimized geometry computed by Sanz-Sanz et al. (2013).The best-fit values of á ñEint for the various source conditions are0.185, 0.32, 0.65, and 1.5 eV, corresponding to Tint=1140,1610, 2510, and 4400 K, respectively. The case where weattribute an internal temperature of 4400 K to the reacting +H3illustrates the uncertainty in our model, as this temperature isbeyond the calculated 4000 K dissociation limit of +H3(Kylänpää & Rantala 2011). Nevertheless, the inferred rangeof +H3 temperatures is in reasonable agreement with previousestimates from our measurements of C and O reacting with +H3(O’Connor et al. 2015b; de Ruette et al. 2016). Finally, the fall-off in the merged-beams rate coefficient that starts near Eth isbest fit with a=0.3 and f=0.2. The value for f suggests that20% of Eint goes into overcoming the opening up of thecompeting exoergic channels, while 80% is transferred into thedaughter products.
6.3. Comparison to Theoretical Cross Sections
The classical trajectory (CT) cross-section calculations ofMoyano et al. (2004) for Reaction(1) are shown in Figure 5,multiplied by the values of vr that correspond to their reportedcollision energies. Surprisingly, the CT data are nonzero belowEb. It appears that Moyano et al. have only taken into accountthe ZPE of the initial +H3 and have not accounted for theimportant ZPE changes along the reaction path. As a result,the reaction complex begins with sufficient energy to overcomethe ZPE-uncorrected reaction barrier. This leads to theobserved unphysical prediction in the low-energy reactiondynamics, an issue known as the “ZPE-leakage” problem thatis encountered in CT and quasi-classical trajectory (QCT)simulations (Lu & Hase 1989; Guo et al. 1996). This probablyexplains the unphysical CT results of Moyano et al., whopredicted a nonzero cross section at energies below Eb for bothX=H and D collisions.Several different solutions for solving the ZPE leakage have
been proposed (Guo et al. 1996; Lee et al. 2018, and referencestherein). Among these solutions, the ring-polymer moleculardynamics approach (Habershon et al. 2013) was recentlyapplied with success to the D+ + H2 HD + H+ reaction(Bhowmick et al. 2018). This could be an interesting alternativeto CT or QCT calculations for Reaction(1).
6.4. Thermal and Translational Temperature Rate Coefficients
Using our semiempirical model cross section, we cangenerate rate coefficients for thermal conditions where thetranslational temperature of the gas, Tgas, and the internaltemperature, Tint, are equal. However, the published theoreticalrate coefficients are more appropriately compared to atranslational temperature rate coefficient where Tint=0 K.Here, we present both rate coefficients. We also present atheoretical correction to our thermal results to account for theeffects of tunneling through the reaction barrier.
12
The Astrophysical Journal, 877:38 (16pp), 2019 May 20 Hillenbrand et al.
6.4.1. Model Rate Coefficients
Using our cross-section model, the thermal rate coefficient isgiven by
ò
pm
s
=
´ á ñ-¥
⎛⎝⎜
⎞⎠⎟
⎛⎝⎜
⎞⎠⎟
( )
( ) ( )
k Tk T
E E EE
k TdE
8
, exp , 31
modB3 3
1 2
0mod r int r
r
Br
where T=Tgas=Tint. The value of σmod is from Equation (30)using our best-fit values of Rb=2.53a0, a=0.3, and f=0.2.á ñEint is obtained from Equation (29).
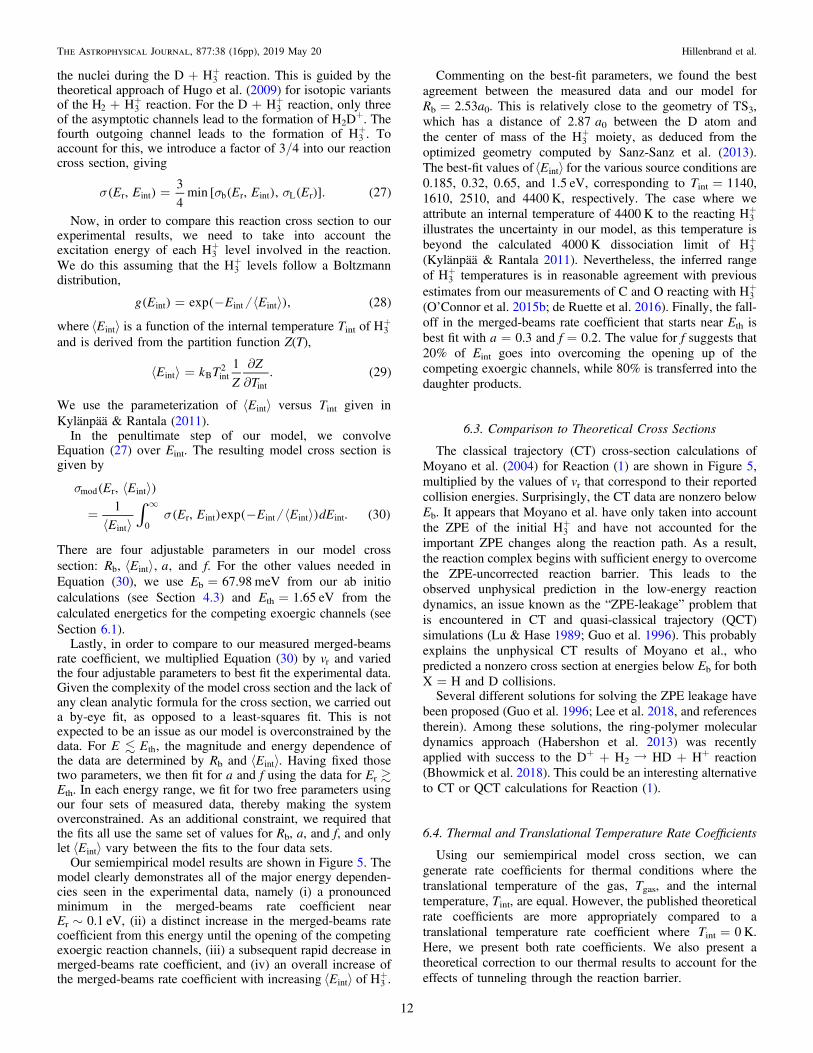
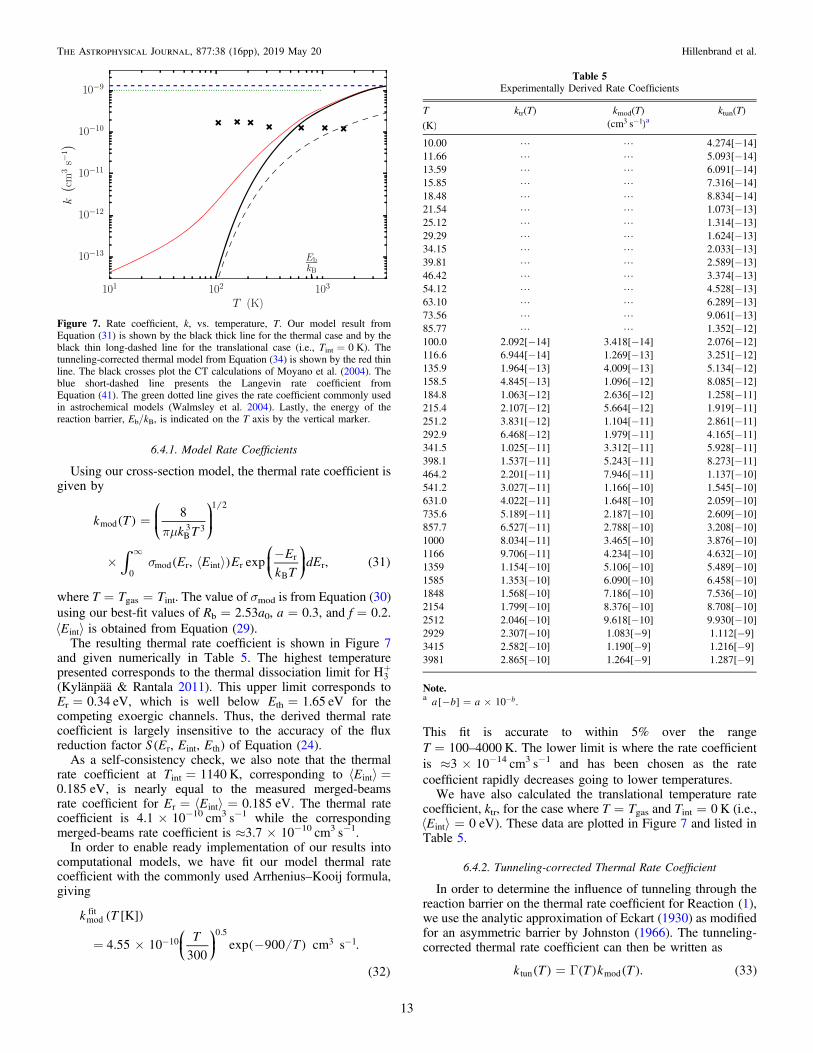
The resulting thermal rate coefficient is shown in Figure 7and given numerically in Table 5. The highest temperaturepresented corresponds to the thermal dissociation limit for +H3(Kylänpää & Rantala 2011). This upper limit corresponds toEr=0.34 eV, which is well below Eth=1.65 eV for thecompeting exoergic channels. Thus, the derived thermal ratecoefficient is largely insensitive to the accuracy of the fluxreduction factor ( )S E E E, ,r int th of Equation (24).
As a self-consistency check, we also note that the thermalrate coefficient at Tint=1140 K, corresponding to á ñ =Eint0.185 eV, is nearly equal to the measured merged-beamsrate coefficient for = á ñ =E E 0.185 eVr int . The thermal ratecoefficient is 4.1×10⁻¹⁰ cm3 s−1 while the correspondingmerged-beams rate coefficient is ≈3.7×10⁻¹⁰ cm3 s−1.
In order to enable ready implementation of our results intocomputational models, we have fit our model thermal ratecoefficient with the commonly used Arrhenius–Kooij formula,giving
= ´ -- -⎜ ⎟⎛⎝
⎞⎠
( [ ])
( )
( )
k T
TT
K
4.55 10300
exp 900 cm s .
32
modfit
100.5
3 1
This fit is accurate to within 5% over the rangeT=100–4000 K. The lower limit is where the rate coefficientis ≈3×10⁻¹⁴ cm3 s−1 and has been chosen as the ratecoefficient rapidly decreases going to lower temperatures.We have also calculated the translational temperature rate
coefficient, ktr, for the case where T=Tgas and Tint=0 K (i.e.,á ñ =E 0 eVint ). These data are plotted in Figure 7 and listed inTable 5.
6.4.2. Tunneling-corrected Thermal Rate Coefficient
In order to determine the influence of tunneling through thereaction barrier on the thermal rate coefficient for Reaction(1),we use the analytic approximation of Eckart (1930) as modifiedfor an asymmetric barrier by Johnston (1966). The tunneling-corrected thermal rate coefficient can then be written as
= G( ) ( ) ( ) ( )k T T k T . 33tun mod
Figure 7. Rate coefficient, k, vs. temperature, T. Our model result fromEquation (31) is shown by the black thick line for the thermal case and by theblack thin long-dashed line for the translational case (i.e., Tint=0 K). Thetunneling-corrected thermal model from Equation (34) is shown by the red thinline. The black crosses plot the CT calculations of Moyano et al. (2004). Theblue short-dashed line presents the Langevin rate coefficient fromEquation (41). The green dotted line gives the rate coefficient commonly usedin astrochemical models (Walmsley et al. 2004). Lastly, the energy of thereaction barrier, Eb/kB, is indicated on the T axis by the vertical marker.
Table 5Experimentally Derived Rate Coefficients
T ktr(T) kmod(T) ktun(T)( )K -( )cm s3 1 a
10.00 L L 4.274[−14]11.66 L L 5.093[−14]13.59 L L 6.091[−14]15.85 L L 7.316[−14]18.48 L L 8.834[−14]21.54 L L 1.073[−13]25.12 L L 1.314[−13]29.29 L L 1.624[−13]34.15 L L 2.033[−13]39.81 L L 2.589[−13]46.42 L L 3.374[−13]54.12 L L 4.528[−13]63.10 L L 6.289[−13]73.56 L L 9.061[−13]85.77 L L 1.352[−12]100.0 2.092[−14] 3.418[−14] 2.076[−12]116.6 6.944[−14] 1.269[−13] 3.251[−12]135.9 1.964[−13] 4.009[−13] 5.134[−12]158.5 4.845[−13] 1.096[−12] 8.085[−12]184.8 1.063[−12] 2.636[−12] 1.258[−11]215.4 2.107[−12] 5.664[−12] 1.919[−11]251.2 3.831[−12] 1.104[−11] 2.861[−11]292.9 6.468[−12] 1.979[−11] 4.165[−11]341.5 1.025[−11] 3.312[−11] 5.928[−11]398.1 1.537[−11] 5.243[−11] 8.273[−11]464.2 2.201[−11] 7.946[−11] 1.137[−10]541.2 3.027[−11] 1.166[−10] 1.545[−10]631.0 4.022[−11] 1.648[−10] 2.059[−10]735.6 5.189[−11] 2.187[−10] 2.609[−10]857.7 6.527[−11] 2.788[−10] 3.208[−10]1000 8.034[−11] 3.465[−10] 3.876[−10]1166 9.706[−11] 4.234[−10] 4.632[−10]1359 1.154[−10] 5.106[−10] 5.489[−10]1585 1.353[−10] 6.090[−10] 6.458[−10]1848 1.568[−10] 7.186[−10] 7.536[−10]2154 1.799[−10] 8.376[−10] 8.708[−10]2512 2.046[−10] 9.618[−10] 9.930[−10]2929 2.307[−10] 1.083[−9] 1.112[−9]3415 2.582[−10] 1.190[−9] 1.216[−9]3981 2.865[−10] 1.264[−9] 1.287[−9]
Note.a - = ´ -[ ]a b a 10 b.
13
The Astrophysical Journal, 877:38 (16pp), 2019 May 20 Hillenbrand et al.
Here, G( )T is the tunneling-correction factor and can beexpressed as
òG =-
-
¥ ⎛⎝⎜
⎞⎠⎟( ) ( ) ( )T
k TP E
E
k TdE
1exp , 34
VBts
ts
Bts
f
where P(Ets) is the tunneling probability (Miller 1979). Thecomputed energy profile of the reaction and the correspondingnormal mode frequencies of TS3, described in Section 4.3,provide a complete parameterization of the generalized Eckartpotential, allowing us to express P(Ets) in terms of the forwardand reverse barrier heights (Vf and Vr, respectively) and themagnitude of the imaginary frequency, w w= ∣ ∣b im (whichquantifies the width of the reaction barrier of the transitionstate). The quantity = + á ñ -E E E Vts r int f is the total reactionenergy available to overcome the forward barrier of thetransition state. The value of P(Ets) can be evaluated as(Miller 1979)
=++( )( ) ( ) ( )
( )( )P E
A B
C
sinh sinh
sinh cosh, 35
A Bts2
22
with A, B, and C defined as
pw
= + +- - -( ) ( ) ( )A E V V V4
, 36b
ts f1 2
f1 2
r1 2 1
pw
= + +- - -( ) ( ) ( )B E V V V4
, 37b
ts r1 2
f1 2
r1 2 1
p
w= -
⎛⎝⎜
⎞⎠⎟ ( )C
V V2
1
16. 38f r
2b2
1 2
For evaluation of the tunneling-corrected thermal ratecoefficient, we use our theoretical results given inSection 4.3. There we find Vf=Eb=67.98 meV and
= + D =∣ ∣V E E 125.78r b zp meV, based on the barrier heightand the exoergicity of the exit channel given in Table 2. Thevalue of ωb=875.9 cm−1 is given in Table 3.
Figure 7 presents our tunneling-corrected thermal ratecoefficient, which is also given numerically in Table 5. Atthe highest temperatures shown, the tunneling correction isunimportant and ktun(T) converges to kmod(T). As is expected,the correction increases with decreasing temperature. AtT=Eb/kB= 789 K, corresponding to the barrier energy,tunneling contributes ≈4×10⁻¹¹ cm3 s−1, or 17%, to thecorrected thermal rate coefficient. Based on the work ofSchwartz et al. (1998), we estimate that there is less than afactor of 2 uncertainty in the correction at this temperature.Going to lower temperatures, at T= 75 K, we find ktun(T)≈10−12 cm3 s−1 and at 10 K, ktun=4.3×10⁻¹⁴ cm3 s−1. Usingthe work of Schwartz et al. as a guide, we estimate that there isat least an order-of-magnitude uncertainty in our ktun at thesetemperatures. Schwartz et al. showed that the accuracy of theΓ(T) factor can be increased by fitting the Eckart potentialfunction to the PES of the transition state. That level oftheoretical complexity is beyond the scope of this paper.
Given the above caveats about the accuracy of the tunnelingcalculations, we have parameterized our results for ktun(T) in
units of cm3 s−1 as
=
´ <
´ -
-
-
⎜ ⎟
⎜ ⎟
⎧⎨⎪⎪
⎩⎪⎪
⎛⎝
⎞⎠
⎛⎝
⎞⎠
( )
( [ ])
( )
( )
/
/
39
k T
TT T
TT T
K
3.3 10300
exp 28 10 180
3.0 10300
exp 560 180 4000.
tunfit
112.73
100.64
The accuracy of the fit is better than 18% over the giventemperature ranges.
6.4.3. Comparison to Theoretical Rate Coefficients
In Figure 7, we compare to various theoretical ratecoefficients for Reaction(1): the Langevin value, the valuecurrently recommended by astrochemical modelers, and the CTresult of Moyano et al. (2004). All three of these are onlytranslational temperature rate coefficients, as they do not takeinto account any possible internal excitation of +H3 .The Langevin rate coefficient is calculated by integrating
σLvr over a Maxwell–Boltzmann distribution, yielding
pam
=⎛⎝⎜
⎞⎠⎟ ( )k e2 . 40L
D1 2
This value is temperature independent. Taking into account thatonly three of the outgoing channels contribute to H2D
+
formation, the Langevin rate coefficient for Reaction(1) is
= ´ - - ( )k 1.3 10 cm s . 41L9 3 1
The Langevin value clearly overestimates the rate coefficientfor this reaction at all temperatures of astrochemical relevance.Going to the high-temperature limit shown in Figure 7, kmod(T)converges to kL. This is expected given our definition of thereaction cross section in Equation (27).The rate coefficient recommended for astrochemical model-
ing appears to have originated with the work of Walmsley et al.(2004). Their value is
= ´ - - ( )k 1.0 10 cm s 42W9 3 1
and is given for the temperature range of 10–1000 K. It is notclear how they derived this Langevin-like value, but their valueclearly overestimates the rate coefficient at astrochemicallyrelevant temperatures.Lastly, we have used the CT results of Moyano et al. (2004)
for ground-state +H3 to generate a translational temperature ratecoefficient. We do this by multiplying their cross-section data,calculated for Tint=0 K, by vr and plotting their monoener-getic results at the temperatures given by = /T E k2 3r B. Theresults are nearly an order of magnitude below kL andapproximately constant with temperature. Compared to kmod,the Moyano et al. results overestimate the rate coefficient at lowtemperatures. This is most likely due to the ZPE-leakage issuediscussed in Section 6.3. At higher temperatures, ZPE leakageshould cease to be an issue. At these temperatures, their resultsare, not surprisingly, significantly below kmod, but they are inrough agreement with our results for ktr.
14
The Astrophysical Journal, 877:38 (16pp), 2019 May 20 Hillenbrand et al.

6.5. Astrophysical Implications
Our combined experimental and theoretical results indicatethat Reaction(1) proceeds at prestellar core temperatures of∼10–20 K with a rate coefficient of 10−13 cm3 s−1. This lowrate coefficient arises from tunneling through a reaction barrierof ≈68 meV. Given the height of this barrier, we expect that themagnitude of the rate coefficient will be insensitive to theortho-to-para ratio of +H3 . The lowest energy level of ortho-H3
+
lies only 2.8 meV above the lowest allowed level for para-H3+
(Hugo et al. 2009). This is an insignificant difference withrespect to the reaction barrier energy.
Deuterated astrochemical models currently assume a ratecoefficient for Reaction(1) of ∼1×10⁻⁹ cm3 s−1 (Roberts &Millar 2000; Walmsley et al. 2004; Albertsson et al. 2013;Majumdar et al. 2017). These should be updated to use ourresults presented here, but we expect that the result will be toessentially turn off this channel for deuterating +H3 at prestellarcore temperatures. Thus, current astrochemical models arelikely to overestimate the H2D
+ number density, +( )n H D2 . Inaddition, this implies that HD is the primary speciesresponsible for deuterating +H3 at these low temperatures (Hugoet al. 2009; Albertsson et al. 2013; Sipilä et al. 2017) via
+ ++ + ( )HD H H D H . 433 2 2
This reaction is barrierless and exoergic by 19.98 meV for thereactants and products in their lowest energy states (Ramanlal& Tennyson 2004; Hugo et al. 2009). We are unaware of anypublicly available deuterated astrochemical models and so ourdiscussions here are purely qualitative.
Our current understanding of collapsing low- and high-massprestellar cores may also be affected by Reaction(1) beingessentially closed below 20 K. Ground-based observations ofthe deuterium fractionation ratio º + ++ ( ) ( )D n nN D N Hfrac
N H2 2
2
are used as a chemical clock for comparing to dynamicalmodels of core formation and evolution (Kong et al. 2015).These two ions are predicted to form primarily from thereactions
+ ++ + ( )H D N H N D , 442 2 2 2
+ ++ + ( )H N H N H . 453 2 2 2
Deuterium fractionation increases with time as a core begins tocollapse. It then decreases once a protostar forms and begins toheat the gas, enabling the endoergic reverse of Reaction(43) totake place, thereby reducing the formation of N2D
+.Kong et al. (2015) reported that values of +
D 0.1fracN H2 are
commonly observed in low- and high-mass prestellar cores.These values imply chemical timescales longer than the localfreefall timescale given by simple gravitational collapsemodels. Kong et al. posited that this is indirect evidence thatmagnetic fields play an important role in regulating theevolution and collapse of prestellar cores, and thereby of starformation. Given that Reaction(1) is essentially closed,reducing the H2D
+ abundance, this implies that even longerchemical timescales are required to match the observed valuesof
+Dfrac
N H2 . If this is the case, then that strengthens the argumentof Kong et al.
7. Summary
We have reported here a combined experimental andtheoretical study of atomic D reacting with +H3 , leading to
the formation of H2D+. Our findings indicate that this reaction
is essentially closed at the ∼10–20 K temperatures ofastrochemical relevance. We have presented thermal ratecoefficients so that deuterated astrochemical models can bereadily updated accordingly.
The authors thank EvelyneRoueff and Fabrice Dayou forstimulating conversations. This research was supported, in part,by the NSF Division of Astronomical Sciences Astronomy &Astrophysics Grants program under AST-1613267. P.-M.H.was supported, in part, by the Deutsche Forschungsge-meinschaft (DFG) under grant No. HI2009/1-1. J.L. thanksthe ULB/VUB computing center and the Consortium desEquipements de Calcul Intensif (FRS-FNRS and WalloonRegion) for computational support. X.U. is a Senior ResearchAssociate of the Fonds de la Recherche Scientifique-FNRS andacknowledges travel support from Fonds de la RechercheScientifique-FNRS through IISN grant No. 4.4504.10.Software: Molpro (Werner et al. 2012, 2015).
ORCID iDs
P.-M. Hillenbrand https://orcid.org/0000-0003-0166-2666K. P. Bowen https://orcid.org/0000-0003-2483-8863X. Urbain https://orcid.org/0000-0003-3326-8823D. W. Savin https://orcid.org/0000-0002-1111-6610
References
Adams, N. G., & Smith, D. 1981, ApJ, 248, 373Aikawa, Y., Wakelam, V., Hersant, F., Garrod, R. T., & Herbst, E. 2012, ApJ,
760, 40Albertsson, T., Semenov, D. A., Vasyunin, A. I., Henning, T., & Herbst, E.
2013, ApJS, 207, 27Alijah, A., & Varandas, A. J. C. 2008, JChPh, 129, 034303Álvarez-Collado, J. R., Aguado, A., & Paniagua, M. 1995, JChPh, 102, 5725Bhowmick, S., Bossion, D., Scribano, Y., & Suleimanov, Y. V. 2018, PCCP,
20, 26752Brouillard, F., & Claeys, W. 1983, in Physics of Ion-Ion and Electron-Ion
Collisions, ed. F. Brouillard & J. W. McGowan (New York: Plenum), 415Bruhns, H., Kreckel, H., Miller, K., et al. 2010a, RScI, 81, 013112Bruhns, H., Kreckel, H., Miller, K. A., Urbain, X., & Savin, D. W. 2010b,
PhRvA, 82, 042708Brünken, S., Sipilä, O., Chambers, E. T., et al. 2014, Natur, 516, 219Caselli, P., van der Tak, F. F. S., Ceccarelli, C., & Bacmann, A. 2003, A&A,
403, L37Caselli, P., Vastel, C., Ceccarelli, C., et al. 2008, A&A, 492, 703de Ruette, N., Miller, K. A., O’Connor, A. P., et al. 2016, ApJ, 816, 31Dunning, T. H., Jr. 1989, JChPh, 90, 1007Eckart, C. 1930, PhRv, 35, 1303Flower, D. R., Pineau Des Forêts, G., & Walmsley, C. M. 2006, A&A,
449, 621Friesen, R. K., Di Francesco, J., Bourke, T. L., et al. 2014, ApJ, 797, 27Friesen, R. K., Di Francesco, J., Myers, P. C., et al. 2010, ApJ, 718, 666Gerlich, D., Herbst, E., & Roueff, E. 2002, P&SS, 50, 1275Gerlich, D., & Schlemmer, S. 2002, P&SS, 50, 1287Giles, K., Adams, N. G., & Smith, D. 1992, JPhCh, 96, 7645Grenier, I. A., Black, J. H., & Strong, A. W. 2015, ARA&A, 53, 199Guo, Y., Thompson, D. L., & Sewell, T. D. 1996, JChPh, 104, 576Habershon, S., Manolopoulos, D. E., Markland, T. E., & Miller, T. E., III 2013,
ARPC, 64, 387Harju, J., Haikala, L. K., Lehtinen, K., et al. 2006, A&A, 454, L55Huber, K., & Herzberg, G. 1979, Molecular Spectra and Molecular Structure:
Constants of Diatomic Molecules, Vol. IV (Boston, MA: Springer)Hugo, E., Asvany, O., & Schlemmer, S. 2009, JChPh, 130, 164302Jankunas, J., Sneha, M., Zare, R. N., et al. 2014, PNAS, 111, 15Jaquet, R. 2013, MoPh, 111, 2606Jiang, G., Wang, H. Y., & Zhu, Z. H. 1989, CPL, 91, 267Johnston, H. S. 1966, Gas Phase Reaction Rate Theory (New York: Ronald
Press Co.), 37Kendall, R. A., Dunning, T. H., & Harrison, R. J. 1992, JChPh, 96, 6796
15
The Astrophysical Journal, 877:38 (16pp), 2019 May 20 Hillenbrand et al.

Knowles, P. J., & Werner, H.-J. 1985, CPL, 115, 259Knowles, P. J., & Werner, H.-J. 1988, CPL, 145, 514Kong, S., Caselli, P., Tan, J. C., Wakelam, V., & Sipilä, O. 2015, ApJ, 804, 98Kramida, A., Ralchenko, Y., Reader, J. & NIST ASD Team 2018, NIST
Atomic Spectra Database (ver. 5.5.6) (Gaithersburg, MD: National Instituteof Standards and Technology), https://physics.nist.gov/asd
Kreckel, H., Bruhns, H., Čížek, M., et al. 2010, Sci, 329, 69Kreckel, H., Novotný, O., Crabtree, K. N., et al. 2010, PhRvA, 82, 042715Kylänpää, I., & Rantala, T. T. 2011, JChPh, 135, 104310Lee, J.-E., & Bergin, E. A. 2015, ApJ, 799, 104Lee, K. L. K., Quinn, M. S., Kolmann, S. J., Kable, S. H., & Jordan, M. J. T.
2018, JChPh, 148, 194113Levine, R. D. 2005, Molecular Reaction Dynamics (Cambridge: Cambridge
Univ. Press)Lie, G. C., & Frye, D. 1992, JChPh, 96, 6784Linstrom, P. J., & Mallard, W. G. (ed.) 2018, NIST Chemistry WebBook,
NIST Standard Reference Database 69 (Gaithersburg MD: National Instituteof Standards and Technology), doi:10.18434/T4D303
Lu, D., & Hase, W. L. 1989, JChPh, 91, 7490Majumdar, L., Gratier, P., Ruaud, M., et al. 2017, MNRAS, 466, 4470McElroy, D., Walsh, C., Markwick, A. J., et al. 2013, A&A, 550, A36McLaughlin, B. M., Stancil, P. C., Sadeghpour, H. R., & Forrey, R. C. 2017,
JPhB, 50, 114001Mielke, S. L., Schwenke, D. W., & Peterson, K. A. 2005, JChPh, 122, 224313Millar, T. J., Bennett, A., & Herbst, E. 1989, ApJ, 340, 906Miller, K. A., Bruhns, H., Čížek, M., et al. 2012, PhRvA, 86, 032714Miller, K. A., Bruhns, H., Eliášek, J., et al. 2011, PhRvA, 84, 052709Miller, W. H. 1979, JAChS, 101, 6810Morong, C. P., Gottfried, J. L., & Oka, T. 2009, JMoSp, 255, 13Moyano, G. E., Pearson, D., & Collins, M. A. 2004, JChPh, 121, 12396O’Connor, A. P., Grussie, F., Bruhns, H., et al. 2015a, RScI, 86, 113306O’Connor, A. P., Urbain, X., Stützel, J., et al. 2015b, ApJ, 219, 6O’Hanlon, J. F. 2003, A User’s Guide to Vacuum Technology (Hoboken, NJ:
Wiley)
Pagani, L., Lesaffre, P., Jorfi, M., et al. 2013, A&A, 551, A38Pagani, L., Vastel, C., Hugo, E., et al. 2009, A&A, 494, 623Pavanello, M., Adamowicz, L., Alijah, A., et al. 2012, JChPh, 136, 184303Phelps, A. V. 1992, JPCRD, 21, 883Pillai, T., Caselli, P., Kauffmann, J., et al. 2012, ApJ, 751, 135Ramanlal, J., & Tennyson, J. 2004, MNRAS, 354, 161Rienstra-Kiracofe, J. C., Tschumper, G. S., Schaefer, H. F., Nandi, S., &
Ellison, G. B. 2002, ChRv, 102, 231Roberts, H., & Millar, T. J. 2000, A&A, 361, 388Rodgers, S. D., & Millar, T. J. 1996, MNRAS, 280, 1046Sanz-Sanz, C., Roncero, O., Paniagua, M., & Aguado, A. 2013, JChPh, 139,
184302Schwartz, M., Marshall, P., Berry, R. J., Ehlers, C. J., & Petersson, G. A. 1998,
JPhChA, 102, 10074Schwerdtfeger, P., & Nagle, J. K. 2019, MolPh, 117, 1200Seely, D., Bruhns, H., Savin, D., et al. 2008, NIMPA, 585, 69Sipilä, O., Caselli, P., & Harju, J. 2013, A&A, 554, A92Sipilä, O., Harju, J., & Caselli, P. 2017, A&A, 607, A26Stark, R., van der Tak, F. F. S., & van Dishoeck, E. F. 1999, ApJL, 521,
L67Strömholm, C., Schneider, I. F., Sundström, G., et al. 1995, PhRvA, 52,
R4320Swift, J. J. 2009, ApJ, 705, 1456van der Tak, F. F. S. 2006, RSPTA, 364, 3101Vastel, C., Caselli, P., Ceccarelli, C., et al. 2006, ApJ, 645, 1198Vastel, C., Phillips, T. G., & Yoshida, H. 2004, ApJL, 606, L127Walmsley, C. M., Flower, D. R., & Pineau des Forêts, G. 2004, A&A,
418, 1035Werner, H.-J., & Knowles, P. J. 1985, JChPh, 82, 5053Werner, H.-J., & Knowles, P. J. 1988, JChPh, 89, 5803Werner, H.-J., Knowles, P. J., Knizia, G., et al. 2015, MOLPRO, version
2015.1, a package of ab initio programs, Cardiff, UKWerner, H.-J., Knowles, P. J., Knizia, G., Manby, F. R., & Schütz, M. 2012,
WIREs Comput. Mol. Sci., 2, 242
16
The Astrophysical Journal, 877:38 (16pp), 2019 May 20 Hillenbrand et al.