Embed Size (px)
Citation preview
The first minima frequencies are given in Table 3 for different plate dimensions. This table also gives, for these frequencies, the required distance to satisfy the Fraunhofer far-field condition.
From this table we can see a relation between the distances dF1 , d,,, and dF3, which are equal, respectively, to 14, 30, and 46 times the observation distance. For this distance the three first frequencies are given by the relations:
F , = - 2.L2 ’
where L is the length of the square in meters. A more general relation can be given as
7 . d . C 1 5 - d * C 2 3 - d . C F2 = - 2 , L 2 9 F 3 = - , (6 ) 2 * L 2
d - C Fn = (-0.5 - 4n) -
L2 ’ (7)
where n is the order of the nth minimum.
B. Specular RCS of a Square Plate versus the Frequency and the Observation Dhtance. Figure 6 represents the monostatic RCS of a 1-m-long square plate, for a specular incidence direction, versus the frequency varying between 0.5 and 50 GHz and for different observation distances 5, 10,20,40, and 2000 m.
A pseudoperiodical appears phenomenon where the pseudoperiodicity is directly related to the observation distance; it doubles when this last one is divided by two. This phenomenon is related to the one observed on the disc (Figure 3), but the minima are not so deep. For a given observation distance, the maxima and min- ima are rising with frequency. Tables 4 and 5 give their values according to the observation distance. We note that when the distance is doubling, the maxima and the minima (in decibels) are growing by 6 dB.
Analysis of these tables shows some simple relations giving the values of the nth minima and maxima, at a distance meters. For the maxima,
urnax = 10 . log [ d 2 * [ 1.5244 * 10 (n+’o.41028)]]. 7
For the minima,
-0.34126 + 2.8438-
The maxima frequencies (in gigahertz) are also defined simple relation where L is the square length in meters:
((8.5 X lo-’ - 0.77629 * d ) + ( -5 .6 x lo-* + 1.2132.d)en)
L2 Fin, =
These expressions give an approximate result with an error less than 0.5% on the frequency location and are exact for the RCS value.
V. CONCLUSION This work presents a near-field physical optics solution ap- plied to the scattering problem of a perfectly conducting disc or square. From the analysis of the results several conclu- sions can be made:
The far field is always linked to the duality distance frequency.
The maximum RCS of a disc and square surface is only a function of the observation distance and at a fixed observation distance a frequency giving this maximum always exists. The observed oscillating phenomena regularity versus the frequency permit simple relations to be established for the values and the frequency of the minima and maxima.
REFERENCES 1. P. Pouliguen and L. Desclos, “An Application of Physical Optics
for Near-Field Mono- or Bistatic Diffraction Calculation,” Mi- crowave Opt. TechnoL Lett., Nov. 1992.
2. G. T. Ruck, D. E. Barrick, W. D. Stuart, and C. K. Krichbaum, Radar Cross Section Handbook, Plenum Press, New York, 1970.
3. J. A. Stratton, Electromagnetic theory, McGraw-Hill, New York, 1941.
4. D. Falconer, “Extrapolation of Near Field R.C.S. Measurements to the Far Zone,” IEEE Trans. Antennas Propagat., Vol. AP-36, No. 6, June 1988.
Received 1-19-94; revised 3-8-95
Microwave and Optical Technology Letters, 9/5,278-283 0 1995 John Wiley & Sons, h c . CCC 0895-2477/95
EXPERIMENTAL AND THEORETICAL ANALYSIS OF PLANAR APPLICATORS FOR MICROWAVE HYPERTHERMIA AT 434 MHz C. Michel, L. Dubols, P. Y. Cntsson, M. Chive, and J. Prlbetich Departement Hyperfrequences & Semiconducteurs (D.H.S.) Universite Des Sciences & Technologies de Lille Domaine Scientifique et Universitaire de Villeneuve D’Ascq Avenue Poincar6 - B.P. 69 59652 Villeneuve D’Ascq Cedex, France
KEY TERMS Planar applicator, spectral-domain approach, microwave hyperthermia
ABSTRACT We propose to show that the use of applicators designed for 915 MHz is possible at 434 MHz provided that a high-pemittwiiy dielectric layer is laid on the microstrip excitation line. In this case, the heated area is practical& the same, but we obtain a better focusing of the hot zone inside the heated tissues. Q 1995 John Wiley & Sons, Inc.
INTRODUCTION The use of a frequency bandwidth around 915 MHz for cellular phones will involve modifications in the microwave hyperthermia systems. It will be necessary either to change the heating frequency (2450 MHz or 434 MHz) or to insulate the equipment (Faraday cage). In the case of the change of frequency, it seems judicious to choose 434 MHz because the penetration depth of the electromagnetic waves inside biolog- ical tissues is greater at this frequency. However, it will be necessary to increase the geometrical dimensions of the ex- ternal planar applicators (microstrip and microstrip-micro- slot), which can be a drawback.
We propose to show that the use of the applicators designed for 915 MHz is possible at 434 MHz provided that some modifications are made.
MICROWAVE AND OPTICAL TECHNOLOGY LETERS / Vol. 9, No. 5, August 5 1995 283
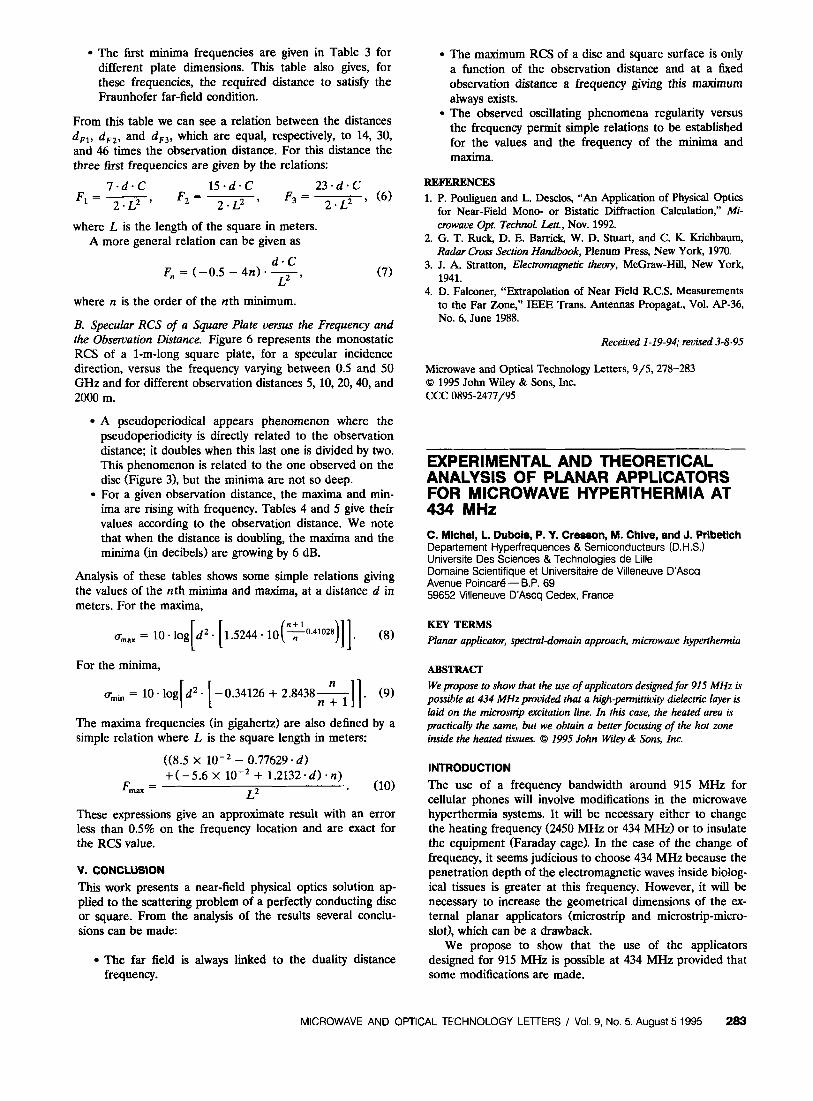
MATERIALS AND METHODS A large number of antennas and planar applicators [l-31 have been designed to produce therapeutic heating of tumors of different sizes in a variety of anatomic locations. The external planar applicators are generally used for the treat- ment of superficial and semi-deep-seated tumors. For this study, we have considered microstrip-microslot applicators that which are constructed on a substrate of thickness d , = 1.58 mm and of permittivity = 4.9 (Figure 1). These appli- cators, covered or not with a protective dielectric superstrate, are laid on multilayered lossy media (such as the human body). To point out the possibility of using the applicator designed for 915 MHz at 434 MHz by covering the microstrip excitation line with a high-permittivity layer, we have consid- ered two kinds of applicators: The first one (called applicator A) is a planar applicator constructed for use at 434 MHz for microwave hyperthermia. The other one (called applicator B) is an applicator for 915 MHz for which the microstrip excita- tion line has been covered with a high-permittivity layer. The geometrical dimensions of these applicators are given in Table 1. We note that only the length S,, of the slot and the strip are different, that is to say 9.1 cm for applicator A and 5 cm for applicator B (covered with the high-permittivity di- electric layer).
The essential part of this work is, on one hand, to know how the electromagnetic energy is deposited inside lossy media such as the human body and, on the other hand, to determine the heating pattern obtained after the resolution of the 3D bioheat transfer equation. In order to determine
TABLE 1
LX
/ /d c Y
electrical walls LZ
TOP VIEW
dielectric layer e*rO
t J g
CROSS SECTION
Figure 1 Scheme of the microstrip-microslot applicator
Applicator A 2.0 cm 3.5 cm 9.1 cm Applicator B 2.0 cm 3.5 cm 5.0 cm
the theoretical power deposition, the model of the studied structure is based on the well-known spectral-domain ap- proach (SDA) 14-61. With this method, we can obtain the propagation constant from which the geometrical dimensions of the applicator can be deduced, the evolution of the reflec- tion coefficient (Sll parameter) as a function of frequency, the resonant frequency F,, and also the electric field from which the theoretical power deposition can be deduced.
The theoretical heating patterns are obtained from the 3D resolution of the bioheat transfer equation. It is possible to obtain transversal and longitudinal thermal patterns.
The spatial distribution of temperature in a lossy medium during the plateau phase of a hyperthermia session is de- scribed by the bioheat transfer equation in the steady state:
where x , y , z are space variables, k,(x, y , z ) is the tissues' thermal conductivity, us(x, y , z) is the blood-flow parameter inside tissues, T, is the temperature of the arterial blood, Q ( x , y , z) is the absorbed microwave power density inside tissues (obtained from previous computations), and T ( x , y , z) is the temperature. The inhomogeneous character of the medium can be taken into account, particularly the blood-flow term u,(x, y, z), which is different in each type of tissue (skin, fat, muscle, tumor. . . ), and also the thermal conductivity k,(x, y , z). For example, for the polyacrylamide gel we have k , = 0.38 W . m-' . OC-'; us = 1500 W - m-3. O C - ' ; T, is close to 20 "C (temperature of the room).
We must take into account the following boundary condi- tions to solve this differential equation:
The external heat exchanges between the lossy medium and the external medium at temperature T, (this re- duced medium may be a water bolus) are reduced by the equation
where T ( x , y , O ) is the surface temperature and H ( x , y ) the heat exchange coefficient with the external medium or water bolus. The deep-seated temperature is equal to arterial blood temperature T,. Far enough from the applicator, tissues present a temperature profile that is the same as the one without heating, and these lateral temperature profiles are computed with a unidimensional model.
The bioheat transfer equation is solved according to the method of discrete finite differences. We obtain a system of differential equations that is solved using an iterative method based on the Cholesky method, in which some coefficients have been introduced in order to increase the convergence speed of the solution.
284 MICROWAVE AND OPTICAL TECHNOLOGY LETTERS / Vol. 9, No. 5, August 5 1995
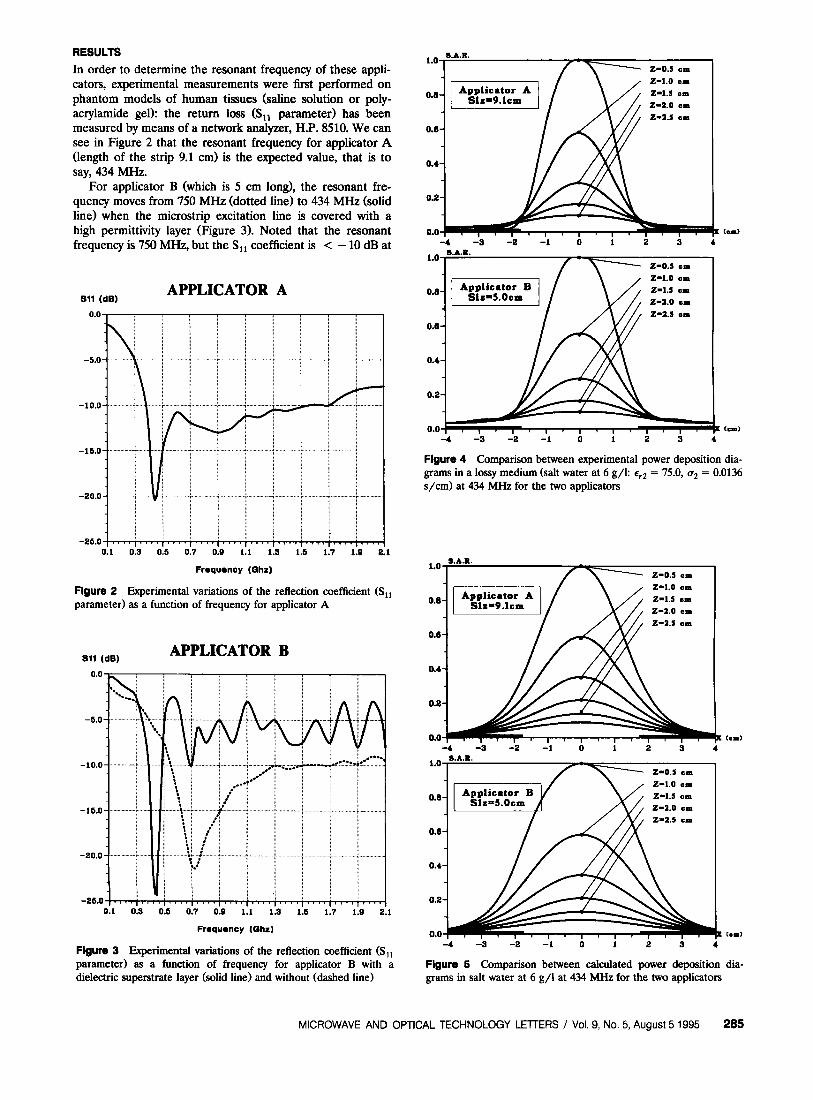
RESULTS In order to determine the resonant frequency of these appli- cators, experimental measurements were first performed on phantom models of human tissues (saline solution or poly- acrylamide gel): the return loss (SIX parameter) has been measured by means of a network analyzer, H.P. 8510. We can see in Figure 2 that the resonant frequency for applicator A (length of the strip 9.1 cm) is the expected value, that is to say, 434 MHz.
For applicator B (which is 5 cm long), the resonant fre- quency moves from 750 MHz (dotted line) to 434 MHz (solid line) when the microstrip excitation line is covered with a high permittivity layer (Figure 3). Noted that the resonant frequency is 750 MHz, but the S,, coefficient is < - 10 dB at
l.o S.A.R.
I /-- z-0.1 C P
- 4 - 9 - 2 - 1 0 1 2 3
l.o S.A.R.
I Z-0.1 cm
APPLICATOR A 511 (dB)
Frequency (Qhz)
Figure 2 Experimental variations of the reflection coefficient (Sll parameter) as a function of frequency for applicator A
0.8-
0.4-
0.2-
0.0- I 1 I 1 I 1 I I , I 1 1 , -4 -3 -2 -1 0 1 2 3
Figure 4 Comparison between experimental power deposition dia- grams in a lossy medium (salt water at 6 g/k cr2 = 75.0, o, = 0.0136 s/cm) at 434 MHz for the two applicators
APPLICATOR B 911 (dB)
l.o S.A.R.
-I 210.5 c m
l.o S.A.R.
I z-0.5 cm
0.8
0.8
0.4
0.2
0.0 - 4 - 3 - 2 - 1 0 1 2 3
K (c-I
FNqUOflCy (aha)
Flgun, 3 Experimental variations of the reflection coefficient (Sll parameter) as a function of frequency for applicator B with a dielectric superstrate layer (solid line) and without (dashed line)
(.I>
i -3 -2 -.I i i i a i Flgure 5 Comparison between calculated power deposition dia- grams in salt water at 6 g/l at 434 MHz for the two applicators
MICROWAVE AND OPTICAL TECHNOLOGY LEllERS / Vol. 9, No. 5, August 5 1995 285
APPLICATOR A
Experimental Pattern Heating Frequency 434 MHZ
(b)
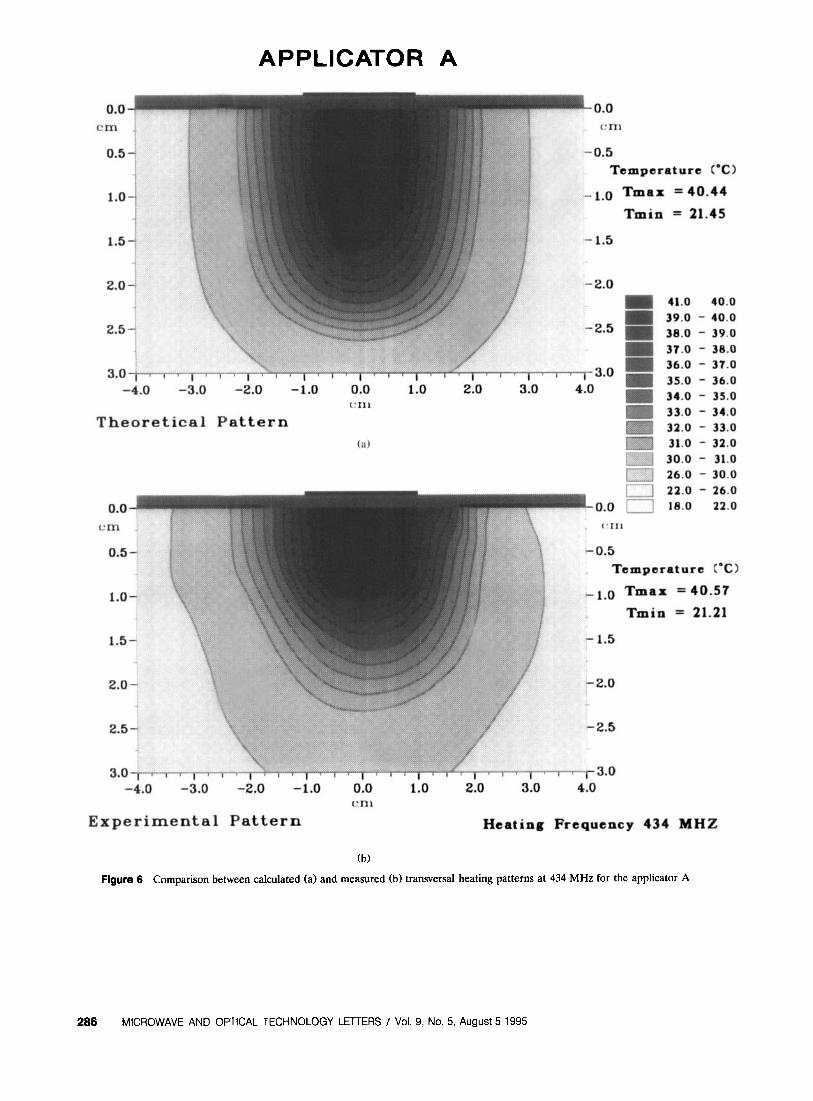
Figure 6 Comparison between calculated (a) and measured (b) transversal heating patterns at 434 MHz for the applicator A
286 MICROWAVE AND OPTICAL TECHNOLOGY LEl7ER.S / Vol. 9, No. 5, August 5 1995
APPLICATOR B
Experimental Pattern Heating Frequency 434 MHZ
(b)
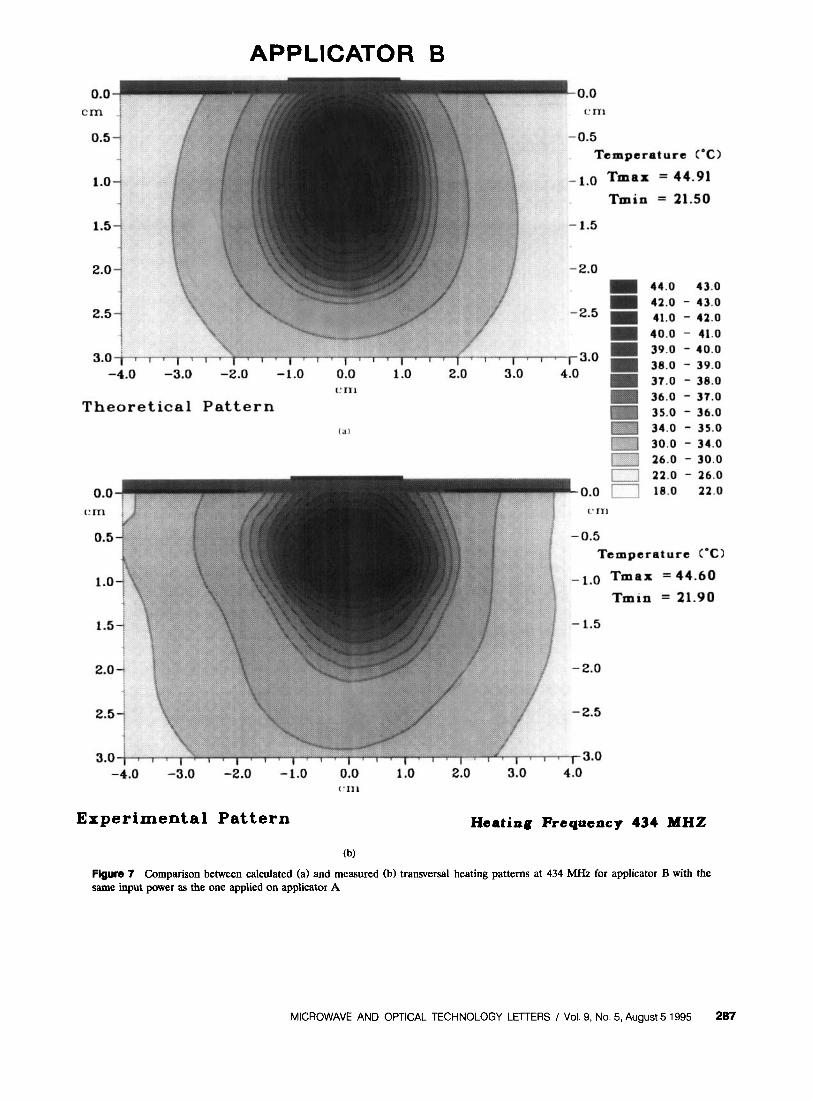
Flgum 7 Comparison between calculated (a) and measured (b) transversal heating patterns at 434 MHz for applicator B with the same input power as the one applied on applicator A
MICROWAVE AND OPTICAL TECHNOLOGY LElTERS / Vol. 9, No. 5, August 5 1995 287
A
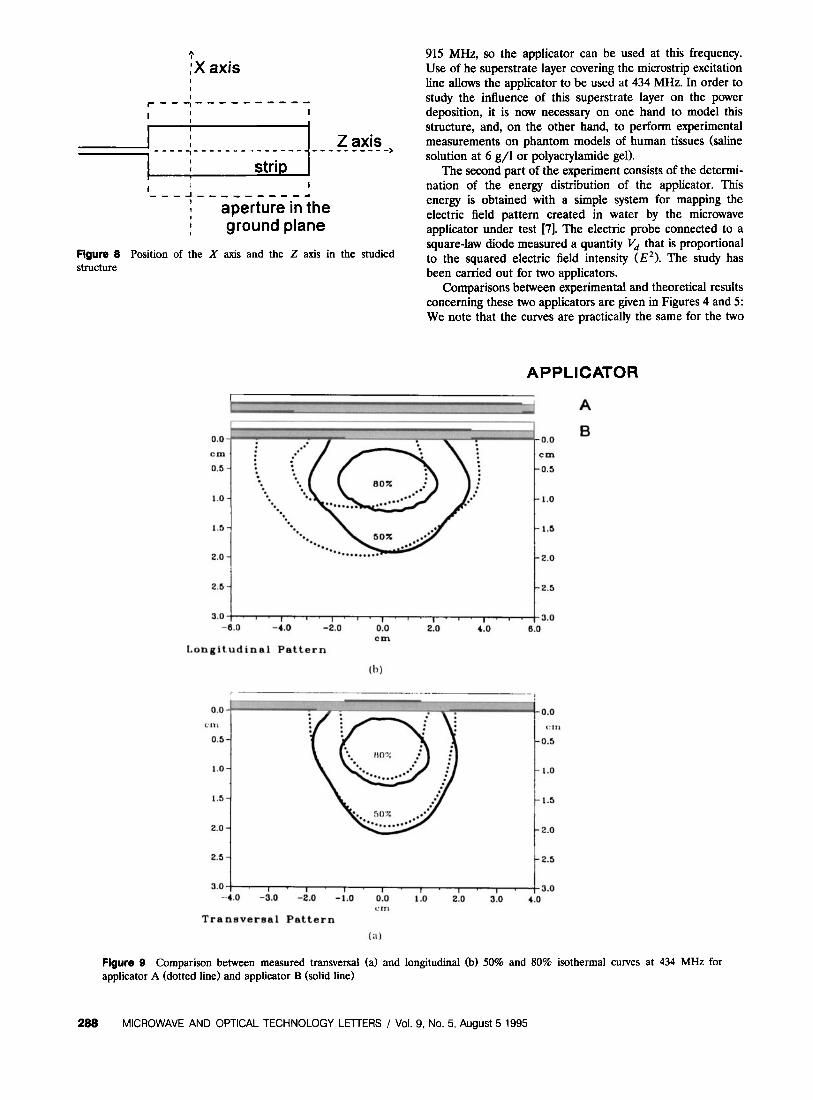
:X axis 915 MHz, so the applicator can be used at this frequency. Use of he superstrate layer covering the microstrip excitation line allows the applicator to be used at 434 MHz. In order to study the influence of this superstrate layer on the power deposition, it is now necessary on one hand to model this structure, and, on the other hand, to perform experimental measurements on phantom models of human tissues (saline solution at 6 g/l or polyacqlamide gel).
The second part of the experiment consists of the determi- nation of the energy distribution of the applicator. This energy is obtained with a simple system for mapping the electric field pattern created in water by the microwave applicator under test [7]. The electric probe connected to a square-law diode measured a quantity V, that is proportional to the squared electric field intensity (E2). The study has been carried out for two applicators.
Comparisons between experimental and theoretical results concerning these two applicators are given in Figures 4 and 5: We note that the curves are practically the same for the two
A P PLI CATOR
3 A
2.04 -. ... \--- .. ..............
2*5i::: 9.0 -6.0 -4.0 -2.0 0.0 2.0 4.0 0.0
c m Longitudinal Pattern
(b)
c m
0.6 0.5
1.0 1.0
2.0 7 W .......... I::: 1 t
3.0 -4.0 -3.0 -2.0 -1.0 0.0 1.0 2.0 3.0 4.0
c m Transversal Pattern
(a)
Figure 9 Comparison between measured transversal (a) and longitudinal (b) 50% and 80% isothermal curves at 434 MHz for applicator A (dotted line) and applicator B (solid line)
288 MICROWAVE AND OPTICAL TECHNOLOGY LElTERS / Vol. 9, No. 5, August 5 1995
applicators (slightly larger for the applicator B) even if the theoretical curves are larger than the experimental ones.
In order to verify these results, we have characterized the thermal performances of the applicators. This is obtained from the temperature measurement performed on a poly- acrylamide gel after a heating session of 45 min using an automatic experimental system. In this polyacrylamide gel, catheters are inserted parallel and regularly spaced 1 cm apart in a vertical plane. The array of thermocouple probes is moved by a stepper motor inside and outside of these catheters. The data system measurement controls the mo- tions of this stepper motor and records the temperature of the probes. As an example, Figures 6 and 7 give comparisons between
theoretical and experimental thermal patterns along the X axis (transversal measurement) (Figure 8 obtained for two applicators A and B when the same input power is applied. We note a relatively good agreement between these theoreti- cal and experimental results. We also observe that the maxi- mum temperature is greater for the applicator B 44.6 “C for applicator B versus 40.6 ”C for applicator A.
Taking into account this fact in order to compare the thermal performances of the two applicators, we have pro- ceeded as follows: The maximum temperature rise above the ambient temperature (temperature of the polyacrylamide gel T‘,) was taken as the 100% value of the isothermal curves. The temperature rises were normalized to this maximum temperature rise and percentage isoline contours were calcu- lated accordingly for each applicator. But we have only plot- ted isothermal curves corresponding to 80% and 50% (Figure 9) for the two applicators along the two directions: X axis (transversal plane) and 2 axis (longitudinal plane).
For the transversal plane [Figure $a)], we note that the shapes of the heated zones corresponding to 80% and 50% are similar. More, for the applicator B, we observe that the hot spot has sunk into the heated tissues, which will lead to a better confinement of the heat inside these tissues and will avoid superficial bums.
In the other direction (longitudinal plane) [Figure 9(b)l, we can see that the heated zone is now smaller for the applicator B It is quite normal because the length of this applicator is smaller than that of applicator A (5 cm for applicator B against 9.1 cm for applicator A). But we can also observe that the spot has driven into the heated tissues.
CONCLUSION We have shown that the previous applicators designed for 915-MHz microwave hyperthermia can be used at 434 MHz when a high-permittivity dielectric layer is laid on the mi- crostrip excitation line. In this case, the following advantages can be obtained: The length of the applicator is smaller than the one designed for 434 MHz, lower input power is needed in order to obtain the same maximum temperature, and we can obtain a sinking of the hot spot into the heated zone.
REFERENCES 1. I. J. Bahl and S. S. Stuchly, “Analysii of a Microstrip Covered
with a Lossy Dielectric,” IEEE T m . Microwave &oiy Tech., Vol. MlT-28, No. 2, Feb. 1980, pp. 104-109.
2. R. H. Johnson, J. R. James, J. W. Hand, J. W. Hopewell, P. R. C. Dunlop, and R. J. DicLinson, “New Low-Pro6le Applicators for Local Heating of Tissues,” IEEE Trans. Bwmed. Eng., Vol. BME-31, NO. 1, Jan. 1984, pp. 28-37.
3. J. Pribetich, R. Ledee, P. Kennis, P. Pribetich, and M. Chive, “Modelling a Microstrip Antenna with Dielectric Protective Layer for Lossy Medium,” Ekctron. Lett., Vol. 24, No. 23, Nov. 1988,
4. Itoh Tatsuo, “Analysis of Microstrip Resonator,” IEEE T M ~ s . Microwams Theory Tech., Vol. MTT-22, No. 11, Nov. 1974, pp. 946-952.
5. L. Dubois, J. Bra, J. Pribetich, and M. Chive, “Theoretical and Experimental Determination of the Poxer Deposition of a Microstrip-Microslot Applicator for Biomedical Applications,” Microwave Opt. Technol. Len., Vol. 4, No. 4, March 1991,
6. L. Dubois, P.-Y. Cresson, J. Pribetich, and M. Chive, “Analysis of Microstrip-Microslot Applicator for Biomedical Applications,” Microwave Opt. Technol. Lett., Vol. 5, No. 13, Dec. 1992, pp. 672-682.
7. G. Gajda, M. A. Stuchly, and S. S. Stuchly, “Mapping of the Near-Field Pattern in Simulated Biological Tissues,” Electron. Lett., Vol. 15, No. 4, Feb. 1979, pp. 120-121.
pp. 1464-1465.
pp. 141-145.
Received 3-9-95
Microwave and Optical Technology Letters, 9/5,283-289 8 1995 John Wdey & Sons, Inc. CCC 0895-2477/95
EXPERIMENTAL INVESTIGATIONS ON THE IMPEDANCE PROPERTIES OF SOME SELF-COM PLEMENTARY MICROSTRIP ANTENNAS Sentanu Das and S. K. Chowdhuty Department of Electronics and Telecommunication Engineering Jadavpur University, Calcutta 700 032, India
KEY TERMS Self-complementary micmsmp antenna, input impedance
ABSTRACT The impedance properties of some self-complementary micmship anten- nas are investigated aperimental&. These structures show interesting input impedance behavior. 0 1995 John Wiley & Sons, Inc.
1. INTRODUCTION Microstrip antennas of different shapes have been investi- gated by many workers 11-61. It is well known that the main drawback of microstrip antennas is their narrow bandwidth characteristics. Various attempts have been made to reduce this limitation with varying degrees of success. Bandwidth enhancement has been achieved by the introduction of addi- tional capacitance by incorporating parasitic metallic strips in the microstrip structure or by increasing the substrate thick- ness [6-91.
The present work is concerned with the experimental investigation of some inherently broadband microstrip an- tenna structures. The design philosophy and experimental results are presented in the following sections.
II. DESIGN PHILOSOPHY A self-complementary structure has a constant input impedance, independent of the frequency and shape of the structure. This property of broadbanding was discovered by Mushiake [lo]. The idea of a self-complementary antenna
MICROWAVE AND OPTICAL TECHNOLOGY LE-TTERS / Vol. 9, No. 5, August 5 1995 289


![Malignant hyperthermia [final]](https://img.pdfslide.us/doc/110x75/58ceb1b71a28abb2218b5123/malignant-hyperthermia-final.jpg)