Embed Size (px)
Citation preview

Published in J Strain Analysis 2015 DOI: 10.1177/0309324715593699
1 Department of Engineering and Innovation, Faculty of Mathematics, Computing and Technology, Open University, Walton Hall, Milton Keynes, MK7 6AA, UK. Corresponding author: [email protected] 2 Siemens Demag Delaval Turbomachinery, Inc., 840 Nottingham Way, Trenton, NJ 08638, USA.
Experimental and numerical study of strength mismatch in
cross-weld tensile testing
Murat O. Acar1,2 and Salih Gungor1
ABSTRACT
The mechanical properties of welded boiler tubes used in power plants can be
significantly altered as a result of the fabrication history, such as pre-straining and heat
treatment. The primary aim of the study was to determine the effect of fabrication history on
local tensile properties across the welds. This was achieved by testing cross-weld specimens
machined from welded thin-walled tubes (with unstrained or pre-strained base metal) before
and after heat treatment. Digital image correlation (DIC), which is a full-field strain
measurement technique, was implemented in order to obtain the local stress-strain curves and
to extract the corresponding local tensile properties such as offset proof stress. Evidence of
strain hardening due to the constraint and thermo-mechanical cycles during the welding
process was found in the heat-affected-zone (HAZ) and evidence of softening was observed
in the pre-strained base metal. It was found that the heat treatment process removed the effect
of pre-straining and welding on the proof stress and the strength along the specimen was
nearly homogenized. However, mapping the local stress-strain curves in the as-welded cross-
weld specimens with pre-strained base metal has revealed abnormal strain-relaxation with
increase in load in the weld-affected region. For a better understanding of this behaviour, a
tensile test of a cross-weld specimen with a large strength mismatch between the weld metal
and the base metal was simulated using the finite element method. It was found that the
strength mismatch in the specimen causes the development of bi-axial stresses in the HAZ
once local yielding begins and the use of global axial stress to construct the local stress-strain

2
curve results in an apparent “reduced-strain” anomaly. Nevertheless, for the strength
mismatch ratios studied, this anomalous behaviour did not seem to significantly affect the
determination of the local proof stress in the specimens.
Keywords: cross-weld tensile testing, strength mismatch, local deformation, digital image
correlation, finite element analysis
Introduction
The structural integrity, performance and life of austenitic stainless steel weldments
in power generation plants is largely determined by the mechanical properties of the weld
metal, the heat affected zone (HAZ) and the base metal. These properties depend on the full
fabrication history including cold bending and swaging, welding, heat treatment and the
effects of service ageing. For example, many metres of austenitic stainless steel tubes are
bent, swaged, welded and heat treated to produce heat exchanger units in the installation of
steam raising power plants. Prior to the instalment the mechanical properties of the virgin
tube have been greatly altered during manufacturing steps.
The tube-shaping operations such as bending and swaging accumulate plastic
deformation in the stainless steel. The plastic deformation can improve the strength of
austenitic stainless steels, but it increases the material's susceptibility to stress corrosion and
creep damage [1, 2]. For this reason, ASME Boiler and Pressure Vessel Design code [3]
specifies forming strain limits for stainless steels for high temperature applications. For
example, for 316H type stainless steel the forming limit is 20% strain, if the material is to
operate between 580°C and 675°C. If it exceeds that threshold, the material should be
annealed above 1040°C to restore its mechanical properties to the start of life values. In
addition to the tube shaping, heat exchanger units require welding to produce tube junctions

3
where the main tube with a larger diameter is connected to a U-bent tube. However, very
little is known about the effects of welding onto plastically deformed tubes. The effect of
heat during welding can alter the material properties around the weld bay either softening or
hardening. In case of welding onto bent or swaged tubes, if the temperature is high enough,
annealing occurs and this softens the previously work-hardened material. Current
construction practices for 316H tubes forbid welding onto material that has experienced more
than 15% plastic strain, without first resolution heat treating the material [4]. If the base metal
near the weld has a relatively lower yield strength, then the thermal cycles during welding
can cause strain hardening or considerable amount of plastic strain near the weld fusion zone
[5]. As a result of hardening or softening the material properties change in weld-near regions
and this causes a strength variation in the heat affected region. Furthermore, the tube-shaping
and welding processes can produce significant level of residual stresses, which can cause
premature failures during operation [6]. Therefore, a post weld heat treatment (PWHT) is
recommended to relieve the weld residual stresses. However, in practice it is not always
possible to follow these codes strictly, especially when the whole boiler is constructed as a
single unit and it is then too large and too complex, and possibly contains different tubing
materials, to have PWHT applied.
The knowledge of local strength variation in the weld-affected regions is crucial in
the structural integrity assessments of these units [7, 8]. Several methods for capturing the
spatial variation in tensile properties in weldments have been reported in literature. One such
method involves testing of miniature-specimens extracted from different regions of
weldments [9–11]. However, the spatial resolution and accuracy that can be achieved using
miniature-specimens are limited by the ability to isolate the individual weld regions. Another
method is based on the instrumented ball indentation technique [12, 13]. Although the
4
resolution obtainable by the ball indentation method is much better than that can be achieved
by miniature-specimens, the technique requires semi-empirical formulas and the conditions
generated by multi-axial compression loading are assumed to correlate well with those of
uniaxial compression and tension loading. A more promising method involves testing tensile
specimens that are machined from weldments to contain the main parts of the weldment
within their gauge length (so-called cross-weld specimens) and mapping full field strain at
the gauge section using a full-field optical technique [5, 14]. The main advantage of this
method over the other methods is that it provides local stress strain curves, from which the
variation of mechanical properties such as proof stress across the weldment can be
determined.
A common optical method used for these measurements is digital image correlation
(DIC), which is based on computational tracking of contrasting surface features (speckle
patterns) on digital images of the specimen's gauge section taken during deformation. The
algorithm used in the DIC technique divides the images into sub-regions and, provided that
each sub-region or “subset” has a unique traceable intensity pattern within the immediate
vicinity, the algorithm cross-correlates the subset patterns in successive images. It then
calculates the relative displacement vector of each subset in each pixel with sub-pixel
accuracy [15]. This spatially resolved displacement/strain measurement with DIC enables the
investigation of the local material properties in heterogeneous materials, such as welded
components. It has been used by several researchers to determine the local material
properties of friction stir weldments [14, 16–24], arc weldments [10, 11, 25–29] and laser
beam weldments [30, 31] during tensile testing.
In the present study, as part of a project investigating the effect of fabrication history
on 316H tube weldments, the local tensile properties of the weldments after different

5
manufacturing steps (pre-straining, welding and heat treatment) have been studied by
carrying out tension tests on specimens that were cut perpendicular to the weld line, such that
the gauge length of the specimen contained the fusion zone and the heat affected zone (cross-
weld specimens). The offset proof strength variation across the weldment was obtained on
cross-weld tensile specimens from the local stress-strain curves which were constructed
using the local displacement measurements by DIC and the global load measured by the load
cell unit of the tensile test machine. An anomaly in the form of apparent strain relaxation
with increasing applied load was observed in the local stress-strain curves obtained in the
HAZ of the cross-welds tensile specimens cut from the tubes that were pre-strained before
welding. Similar observations have been reported in literature [21, 25, 29], which were
attributed to the use of global stress in calculations and the strength mismatch between the
weld and base metals. The global stress is determined directly from the load cell readings of
the testing machine and hence the stress is assumed to be uniform throughout the gauge
section of specimens (“iso-stress assumption”) [14]. Lockwood and Reynolds [17]
experimentally and numerically studied the validity of the iso-stress assumption and the level
of constraint due to the specimen geometry. They reported that, although the use of global
stress was a convenient way of extracting the local material properties, the constraint due to
the thickness of the specimen has an influence on the deformation behaviour, which leads to
the breakdown of the iso-stress assumption. A numerical modelling work using finite
elements has been undertaken in the present study to verify the measured local stress-strain
curves by investigating (1) the strength mismatch effect, (2) the influence of strain calculation
method and (3) the use of global load in characterising local stress-strain curves. The effect
of these anomalies in the prediction of offset proof strength variation across the weld from
the local stress-strain curves was also investigated using the finite element simulations.

6
Experimental Procedure
1. Materials
A set of plastically-strained and butt-welded tubes were supplied for the experimental
programme by EDF Energy (Table 1). The untreated tubes (referred to as the tubes before
plastic straining and welding) were manufactured by extrusion and then solution annealed at
1100°C for 3 minutes followed by water quenching. The final austenite grain size is about
25µm. The tubing material is AISI Type 316H austenitic stainless steel with the composition
given in Table 2. The initial tubing geometry was 38 mm in outer diameter and 4 mm in wall
thickness. The test specimens were fabricated as follows;
(1) two 450 mm long tubes were pulled uniaxially in tension to give a plastic strain of 10%
in the first tube and 20% in the second tube. The pre-straining processes were done using a
strain rate of ~0.15%/s with a servo-hydraulic rig. The tube ends were connected to the servo-
hydraulic rig using specifically manufactured adaptors, which were welded to the ends of the
tubes so that they could be easily fitted to a pair of universal joints for gripping. 25 mm of
the tube ends where the adaptors were welded were chopped off after the completion of pre-
straining process. The strain during the processing was monitored by a side-mounted
extensometer, four strain gauges fitted at 90° intervals around the circumference of the centre
of the pipe and by fiducial markings on the pipe length.
(2) The strained tubes and a non-strained tube were cut into two halves.
(3) Following a root tack welding, the matching half-tubes were clamped together and then
welded using a tungsten inert gas (TIG) welding process (complying to the welding standard
ISO 15614-1) with type 316L filler metal code (Tables 2 and 3). The weld contains two
passes: root pass and cap pass. During the root pass the tacks were incorporated into the weld.

7
A micrograph of the weld cross section and the weld geometry are shown in Fig. 1. A
microstructural examination revealed that the weld microstructure is mainly austenite with
about 5% delta-ferrite.
Flat tensile test specimens from both the welded part of the tube (cross-weld
specimens) and the tube ends that were not affected by the welding process (plain specimens)
were cut using electro-discharge machining (EDM) as shown in Fig. 2. The specimens were
then ground flat to a thickness of 3 mm. Standardized tensile test specimens are generally
designed according to ASTM E 8/E 8M – 11: Standard Test Methods for Tension Testing of
Metallic Materials [32]. However, the dimensions of the specimens have been modified in
this work due to the tube geometry. In addition, the gauge length of the cross-weld specimens
has been designed longer in order to fit all the weld affected zones (the weld metal, the HAZ
and the base metal). The actual test specimens with modified dimensions have been machined
after the verification tests with dummy samples following FEA simulations to check the
stress distribution through the test specimen during tensile test. The cut position and the
dimensions of the tensile specimens are given in Fig. 2. The tubes, cross-weld and plain
tensile specimens are labelled as shown in Table 1. Some of the specimens were labelled as
“HT” to show that they were heat treated at a soaking temperature of 1050°C for 15 minutes
under vacuum and quenched to 50°C with nitrogen gas.
2. Tensile testing
Tension tests of plain and cross-weld specimens (B0, B10, B20, B0-HT, B10-HT, B20-HT
and C0, C10, C20, C0-HT, C10-HT, C20-HT) were carried out using a screw-driven tensile testing
machine with a 30kN load cell. Mechanical wedge action grips were used to fix the
specimens into the machine. In addition to DIC measurements, a clip gauge (Instron, 25mm

8
gauge length) was attached to the specimens to measure the extension of the gauge length.
Before each test commenced, the loading and specimen alignment was checked using a laser
line alignment tool in order to avoid subjecting the specimen to any bending or torsion, i.e.
to ensure the loading was purely uniaxial tension [33, 34]. Two universal joints were used to
improve axial alignment. Additionally, 2 mm thin aluminium guide plates were placed in the
wedge grips to centrally position the shoulders of the specimens with the loading axis of the
testing machine.
3. Digital image correlation
The full field distribution of strain was obtained throughout DIC integrated tensile
tests of plain and cross-weld specimens. The surface pattern required for the DIC
measurements is usually obtained by applying a spray paint. However, in this study, it was
found that the speckle pattern obtained by white light illumination of the rough surface
produced by EDM gave finer and more consistent speckle pattern, and hence better image
correlation [27]. A DC fibre optic light source was used to illuminate the surface. The tensile
tests were performed under displacement control with a constant extension rate of
0.1mm/min. During the tests, images of the front surface of the specimens were captured by
a digital single lens reflex (DSLR) camera (Nikon D300), with a sensor size of 4,288 x 2,848
pixels, and a 200 mm macro lens. The pixel size for the magnification used corresponded to
about 11 m. The images were taken every 10 seconds and the load and extension from the
testing machine were recorded every second. The analysis of the images was performed using
a commercial DIC software package [35].
In-plane displacement vectors in the loading direction were calculated within the
user-defined working space using a ‘256×256 subset size with 50% overlap and 2 passes’
9
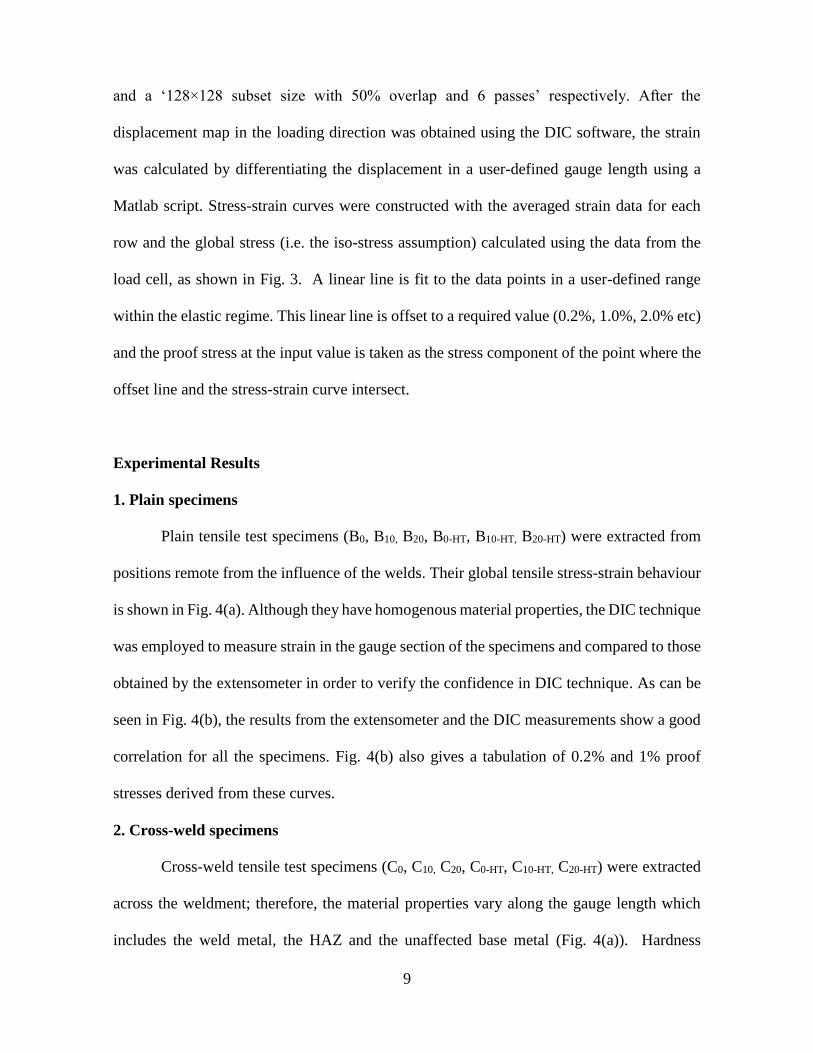
and a ‘128×128 subset size with 50% overlap and 6 passes’ respectively. After the
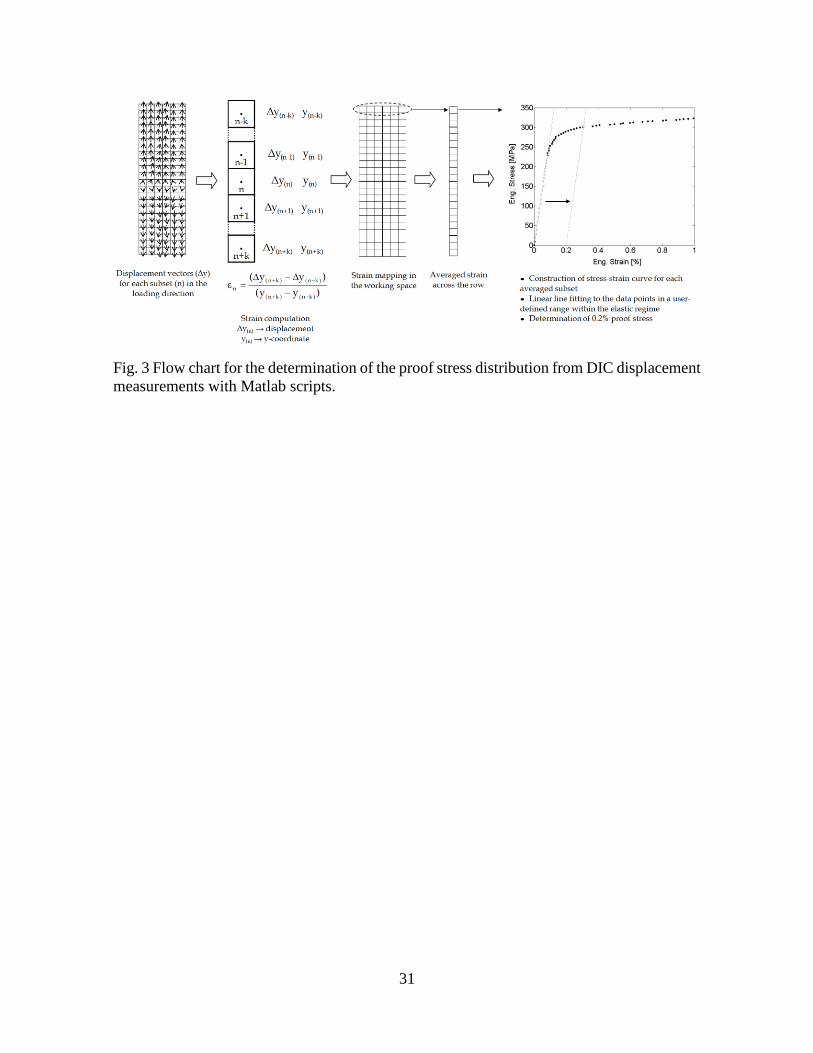
displacement map in the loading direction was obtained using the DIC software, the strain
was calculated by differentiating the displacement in a user-defined gauge length using a
Matlab script. Stress-strain curves were constructed with the averaged strain data for each
row and the global stress (i.e. the iso-stress assumption) calculated using the data from the
load cell, as shown in Fig. 3. A linear line is fit to the data points in a user-defined range
within the elastic regime. This linear line is offset to a required value (0.2%, 1.0%, 2.0% etc)
and the proof stress at the input value is taken as the stress component of the point where the
offset line and the stress-strain curve intersect.
Experimental Results
1. Plain specimens
Plain tensile test specimens (B0, B10, B20, B0-HT, B10-HT, B20-HT) were extracted from
positions remote from the influence of the welds. Their global tensile stress-strain behaviour
is shown in Fig. 4(a). Although they have homogenous material properties, the DIC technique
was employed to measure strain in the gauge section of the specimens and compared to those
obtained by the extensometer in order to verify the confidence in DIC technique. As can be
seen in Fig. 4(b), the results from the extensometer and the DIC measurements show a good
correlation for all the specimens. Fig. 4(b) also gives a tabulation of 0.2% and 1% proof
stresses derived from these curves.
2. Cross-weld specimens
Cross-weld tensile test specimens (C0, C10, C20, C0-HT, C10-HT, C20-HT) were extracted
across the weldment; therefore, the material properties vary along the gauge length which
includes the weld metal, the HAZ and the unaffected base metal (Fig. 4(a)). Hardness

10
profiles across the weld for the as-welded and heat-treated cross-weld specimens have been
obtained using an automated hardness test machine with a load of 5kgf. It can be seen in
Fig. 5 that the hardness values in the unaffected base metal are almost constant, but they vary
in the weld pool and the HAZ.
Four Kyowa KFG-1-120-C1-16 type strain gauges (SGs), which were 1.1 mm wide
and 1 mm long, were glued on the tensile specimens as shown in Fig. 6. The two SGs, which
were attached 20 mm away from the weld centre line (WCL) on opposite faces of the
specimen, were used to check the alignment of the test fixture. The other two SGs were
located on the back surface of the specimen; one SG was glued at the middle of the weld and
the other was in the HAZ region (~6.5 mm away from WCL). The local stress-strain curves
constructed with the strain data obtained from these latter two SGs were compared to the
stress-strain curves constructed with strain data obtained using the DIC measurements for
verification. Note that the global stress (iso-stress), which was calculated from the load (kN)
recorded from the load cell attached to the crosshead of the Instron testing machine, was used
to construct both sets of stress-strain curves.
The full field displacement data obtained by the DIC measurements were used to
construct stress-strain curves at every subset (~ 0.5 mm2) of the test area shown in Fig. 6.
These were then used to map the variation of proof stress across the weldment. The complete
stress-strain curves at three critical locations are mentioned below.
Local stress-strain curves obtained at the weld centre
Stress-strain curves, which were constructed with the strain data from SGs and DIC
at the weld centre, are given in Fig. 7. Results from the two measurement techniques show a
good overall correlation, although there are some discernible differences, which may
possibly be attributed to the fact that these measurements were made on the opposite sides of

11
the test specimen. Stress-strain curves obtained from specimens C0, C10 and C20 at the weld
centre, which represent the weld metal tensile behaviour prior to the heat treatment, are very
similar. The tensile behaviour of the weld metal after the heat treatment is depicted in the
stress-strain curves obtained from specimens C0-HT, C10-HT and C20-HT at the weld centre. The
effect of heat treatment on the weld metal can be clearly seen: 0.2% proof stress of the weld
metal prior to heat treatment is between 265-275 MPa, which decreases to about 200-220
MPa after the heat treatment.
Local stress-strain curves obtained at a distance of 6.5mm from the WCL
Stress-strain curves, which were constructed with the strain data from SGs and DIC
at the position of 6.5mm from the WCL, are given in Fig. 8. Results from the two
measurement techniques show a good correlation for all specimens. (Note that the stress-
strain curves obtained from the SG on specimens C0 and C10 end at 2.7% and 0.8% strain,
respectively, because the SGs detached unexpectedly during testing). However, there is
anomalous behaviour in the curve for the specimen C20; there is an apparent strain relaxation
starting at around 200 MPa. This strain relaxation seems to coincide with the start of the
strain-hardening that the weld metal experiences after yielding at ~210MPa. This anomaly
was also observed in other regions of the HAZ as discussed below.
Local stress-strain curves obtained at a distance of 10mm from the WCL
At 10mm from the WCL in cross-weld specimens, strain data was only obtained from
DIC measurements (Fig. 9). The stress-strain curves for the heat-treated specimens C0-HT,
C10-HT and C20-HT are very similar to those observed at 6.5mm. Similar to the anomaly
detected in specimen C20 at 6.5 mm, but somewhat more pronounced here, an apparent strain
relaxation effect has been observed for specimens C10 and C20. Although this apparent strain
relaxation seems to be starting at around 340 MPa for both specimens (the dashed rectangle

12
in Fig. 9), the change in slope of the elastic line with increasing stress (which will be referred
as “reduced-strain” trend hereafter) starts at a lower stress, coinciding with the strain
hardening in the weld metal after yielding at ~210MPa. This suggests that, once local
yielding starts, the load partitioning is not homogenous throughout the weldment and, hence,
the iso-stress assumption that was used to plot the stress-strain curves is no longer valid.
Local stress-strain curves obtained at a distance of 20mm from the WCL
Stress-strain curves obtained from SG and DIC measurements at 20mm from the
WCL are given in Fig. 10. It can be seen that C10 and C20 specimens show a similar anomaly
as in the case of 10mm, albeit less pronounced. At 20mm from the WCL the stress-strain
curve of C10 has both elastic and plastic regions, however, C20 is still in the elastic region and
does not reach yielding point when the failure occurs in the weld metal. The stress-strain
curve of C10 is very similar to that of plain specimen, B10 (Fig. 4(b)), which suggests that
beyond 20 mm from the WCL, there is no effect of welding on mechanical properties. The
heat-treated specimens C0-HT, C10-HT and C20-HT show again a similar stress-strain behaviour
as in Figures 8 and 9.
The stress-strain curves obtained from the base metal and the HAZ at different
positions suggest that the welding and heat treatment has a considerable influence on the
material properties of the unstrained and pre-strained base metal. It was observed that the
pre-strained base metal becomes softer closer to the fusion boundary after welding. As
mentioned above, some of the stress-strain curves obtained from the pre-strained base metal
in non-heat-treated condition showed some anomalies. The unstrained base metal was also
affected by the welding process; the hardness and the strength of both the weld and the base
metal were lower after the heat treatment. Stress-strain curves obtained from the heat-treated

13
specimens (C0-HT, C10-HT and C20-HT) at different positions in the base metal suggest that the
mechanical properties are very similar at these positions.
For a better understanding of the variation in material properties, the proof stress
distribution is given in Fig. 11 which plots the variation of 0.2% proof stress on one side of
the WCL for the cross-weld specimens based on the analysis of the DIC stress-strain curves.
In specimen C0, the proof stress increases from a minimum of 268 MPa in the weld region to
a maximum of 319 MPa at about 10mm from the WCL and then drops gradually to a steady
value of 285 MPa at about 25mm from the WCL. In specimen C10, the proof stress increases
steadily from a minimum of 260 MPa in the weld region to a maximum of about 565 MPa at
16mm from the WCL, where it levels off. The trend in proof stress for specimen C20 is
similar to C10 but in this case the material beyond 8.5mm did not show any yielding (since
fracture already took place in the softer weld metal before the yield stress level of the material
beyond 8.5mm was reached) and hence the proof stress could not be derived. In specimen
C0-HT, the proof stress increases from a minimum of 200 MPa in the weld region to a
maximum of about 250 MPa at 7mm from the WCL and it remains almost constant beyond
that point. In specimens C10-HT and C20-HT, the trend in proof stress distribution is quite
similar. Apart from a small increase just after the weld interface, the specimens C0-HT, C10-HT
and C20-HT show almost identical yielding behaviour. The proof stresses obtained from SGs
are tabulated in Fig. 11. Results from the DIC and the SGs show a good correlation in general.
However, the proof stress obtained from the SG on specimen C0 at WCL is 290 MPa whereas
the DIC gives 275 MPa. Note that the SGs are on the opposite half and at the back surface of
the specimen. Proof stresses obtained from the back and front SGs at 20mm away from the
WCL for specimens C0 and C10 are very similar, which confirms the alignment of the loading
fixture and the specimen was correct.

14
FE validation of DIC integrated tension test of a cross-weld specimen with strength
mismatch
The hardness profile in Fig. 5 suggests that specimens C0, C0-HT, C10-HT and C20-HT are
almost homogenous whereas the non-heat-treated base metal of the specimens C10 and C20
are much stronger than the weld metal, which means that there is a strength mismatch in
those specimens.
During tensile testing of a cross-weld specimen with a significant strength mismatch
level, as in the case of the specimens C10 and C20, the strong metal can constrain the plastic
deformation of the soft metal and bi-axial stresses can develop during yielding at the interface
they join. Therefore, these bi-axial stresses can influence the yielding behaviour of the
material in the vicinity. So, the softer material may start to deform at a higher applied stress
than those observed in homogeneous materials and this may affect the local stress-strain
curves which are constructed using the uniaxial stress and strain information.
In order to understand the effect of strength mismatch on cross-weld specimens and
validate the experimental results, a finite element model was developed. The main aims were
to investigate: (1) the constraint effects in under-matched strength condition (y-base > y-weld),
(2) the effect of the strain computation technique on the apparent stress-strain curves and (3)
the validity of the iso-stress assumption. The results were also expected to provide
information on the reliability of the prediction of offset proof strength variation across the
weld from the local stress-strain curves showing the anomalies in the elastic region of
sections with higher proof strength.
1. Finite Element Model
A 2D multi-material model with plane stress elements was developed with the
assumption that the weld geometry was symmetrical through the thickness of the specimens.

15
The 2D plane stress assumption was also used by Lockwood and Reynolds, who have found
that plane stress model gives very comparable results with DIC measurements in thin
(2.7mm) tensile specimens [17]. In specimens C10 and C20 there is a gradually softened zone
(i.e. HAZ) where the local yield strength increases continuously from the weld boundary to
the unaffected base metal. Therefore, the yield strength in the model was assumed to increase
linearly from the weld metal to the unaffected base metal as shown in Fig. 12. The strength
mismatch level is given as the ratio of the yield stress of the weld and the base metals.
Therefore, for this model the strength mismatch level was selected as 0.3. The size of each
zone was estimated by using the hardness map of the specimens C10 and C20.
Because of its simplicity, modelling a partitioned HAZ region in cross weld tension
specimens has been very common [17, 20, 36]. However, varying the material properties
between the weld and the unaffected base metal in a stepwise manner creates an artificial
interface between each HAZ partition which results in unrealistic biaxial stress state at each
interface. In the multi-material model used in this study, a continuous HAZ material in which
the properties are functionally graded was generated by the ABAQUS user-subroutines [37].
This finite element model, which had 1518 elements and 4853 nodes (Fig. 13), was
analysed using ABAQUS Version 6.7 [37]. Quadrilateral CPS8R (reduced integration, eight-
node element) type plane stress elements were used in the models. The boundary conditions
were selected to simulate the actual tension tests of cross-weld specimens; i.e. the bottom
end of the specimen was fixed and the top end was pulled with a constant displacement rate
of 0.1mm/min. The FE analysis was static and non-linear, based on isotropic elastic–plastic
materials with isotropic work-hardening. Strain rate dependency was not taken into account
since the displacement rate was small.
2. Numerical Results

16
Local stress-strain curves
In order to investigate whether the anomalies observed in tension tests were caused
by a real material behaviour or were a result of experimental inadequacies, such as the use of
iso-stress assumption, local true-stress versus true-strain curves obtained by the FE modelling
were examined. The effect of strain averaging along the width and the use of global stress on
the shape of a local stress strain curve in HAZ are demonstrated in Fig. 14, where four
different stress-strain curves are plotted to show the local deformation behaviour at 7.75mm
away from the WCL. These curves are compared to the input stress-strain curve (see )
in the same figure. Note that the stress and the strain used to construct these curves are in the
loading direction as it was measured during the DIC integrated tension tests. These four
stress-strain curves are:
(1) “stress @ mid-width” vs. “strain @ mid-width” curve (see on Fig. 14)
which was constructed by the axial stress and axial strain calculated for the middle
domain (filled domain in Fig. 14) at 7.75mm from the WCL. This curve represents
the original local deformation behaviour in this domain when the whole specimen is
under tension.
(2) “averaged-width stress” vs. “averaged-width strain” curve (see on Fig. 14)
which was constructed by the axial stress and strain, both averaged along the full-
width (all unfilled domains + the filled domain in the middle) at 7.75mm from the
WCL. This curve represents the original local deformation behaviour averaged over
the domains lying along the width at a distance of 7.75mm from the WCL.
(3) “global stress” vs. “strain @ mid-width” curve (see on Fig. 14). The curve
(1) was modified by using the global stress (iso-stress) instead of the “stress @ mid-
width” because the experimental local-stress-strain curves can only be constructed

17
using the global stress as the local stress cannot be measured. Therefore, this curve
represents one of the extremes for the experimental way of constructing the local
stress-strain curve using local strain at a point and the global stress. This enables the
spatially-resolved local deformation behaviour on the sample surface to be obtained,
as it was used by Reynolds and Duvall [14].
(4) “global stress” vs. “averaged-width strain” curve (see on Fig. 14). The curve
(2) was modified by using the global stress instead of the “averaged-width stress” due
to not being able to measure local stress. This curve represents another extreme for
the experimental way of constructing the local stress-strain curve using the averaged-
strain along the width at a specific distance from the WCL and the global stress.
Iso-stress assumption (the use of global stress) in DIC analyses means that the stress,
which is used to construct the local stress-strain curves, is uniform along the specimen gauge
length and is calculated by dividing the global load to the original cross-section of the
specimen. In FE analyses, the stress averaged across the width at 24.5mm away from the
WCL was considered as the “global stress”, since at 24.5mm away from WCL and further
away towards the end of the specimen the axial stress is uniform across the width and there
is very small deformation in the transverse direction during the simulation.
In Fig. 14, it can be seen that there is no anomaly on curves (1) and (2), although they
are different from the input stress-strain curve. The use of global stress instead of “averaged-
width stress” does not influence the stress-strain behaviour (see curves (2) and (4)). On the
other hand, the use of global stress instead of “stress @ mid-width” considerably modifies
the stress-strain behaviour (see curves (1) and (3)). On curve (3), the most significant
modification is the “reduced-strain” trend, i.e., the change in the slope of the elastic region

18
after 250MPa. This “reduced-strain” trend on curve (3) was observed in the experimental
local stress-strain curves at 10mm (in the HAZ) from the WCL for specimens C10 and C20
(Fig. 9). Note that curve (3) employs “strain @ mid-width” whereas the experimental local
stress-strain curves employ averaged-width strain. This conflict briefly happens because of
the definition of the working space in which the displacement vectors were calculated. The
working space was defined as a rectangular area which does not include whole of the
specimen width (includes only 3.5mm in the middle of a 6mm specimen width) because, for
practical reasons, the working space selected is based on the last image where the specimen
has shrunk considerably due to Poisson effect.
Reliability of the proof stress distribution
It was shown in Fig. 14 that the use of global stress and strain-averaging across the
width of the specimen influences the local stress-strain curves. Experimentally, local stress-
strain curves which were constructed with global stress and strain averaging across the width
were used to predict the 0.2% offset proof stress along the half the length of the cross-weld
specimens (see Fig. 11). In order to check the reliability of the experimental prediction of the
proof stress distribution in a cross-weld specimen with strength mismatch, the numerical
local stress-strain curves, which were constructed with FE results by using the same
experimental assumptions, were employed to predict the 0.2% and 1% proof stresses. In Fig.
15, 0.2% and 1% proof stress determined from the input stress-strain curves is compared with
the proof stress distributions predicted from two types of local stress-strain curves; curve (3),
which was obtained by plotting “global stress” vs. “strain @ mid-width”, and curve (4),
which was obtained by plotting “global stress” vs. “averaged-width strain”. It can be seen
that although the DIC experimental procedure and strength mismatch has affected the local
stress-strain curves, the use of curve (3) on the determination of the 0.2% and 1% proof stress

19
distributions has a negligible effect. In the HAZ region, when compared to the input 0.2%
proof stress, curve (3) gives a very similar proof stress (~1MPa higher than the input data),
whereas curve (4) gives a considerably lower proof stress (~40MPa lower). Similarly,
compared to the input 1% proof stress, curve (3) gives a very similar proof stress (~4MPa
higher), whereas curve (4) gives a lower proof stress (~25MPa lower).
Discussion
1. Effects of manufacturing steps on tensile properties
Pre-straining
Pre-straining has a considerable effect on the strength of the base material. The 0.2%
proof strength of the plain specimens B0, B10 and B20 are 295MPa, 557MPa and 689MPa,
respectively (Fig. 4(b)). The increase in the strength is due to the accumulation of plastic
strain in the material after pre-straining [38]. The accumulated plastic strain after pre-
straining can be qualitatively determined by hardness measurements. The hardness values of
the non-strained, 10% pre-strained and 20% pre-strained base material are 154, 218 and 251
HV, respectively (Fig. 5).
Welding
It was found that the 0.2% proof stress in the weld is between 260-280MPa and is
similar for specimens C0, C10 and C20. It was also observed that the hardness values of the
weld in all three tubes are the same (150 HV). The difference in stress-strain curves obtained
from SG and DIC (Fig. 7) confirms that the material properties of the front and back surfaces
are possibly different since the back surface represents the root pass whereas the front surface
represents the cap pass.

20
The slight increase in proof stress (Fig. 11) and hardness (Fig. 5) of specimen C0, in
the base metal between 5 and 25mm from the WCL is associated with hardening during the
welding process. The hardening in the base metal near the fusion boundary was reported in
the thermo-mechanical welding simulations of the stainless steels [39, 40]. The hardening
response of this stainless steel tube during a welding thermo-mechanical cycle is very
complicated because of the wide ranges of imposed temperature, total strain and strain rate,
and because of the potential recovery, recrystallization, creep and visco-plastic effects at high
temperatures [39]. Smith et al [39] have developed a numerical model for the accurate
prediction of the weld residual stresses in 3-pass groove welds of a 316L stainless steel plate.
In their simulation, the material model was based on a thermo-mechanical hardening
behaviour which considers the cyclic strain hardening and annealing phenomena. They
observed that plastic strain accumulation occurs in the base metal adjacent to the weld bead
after each weld thermo-mechanical cycle. Their observation was confirmed by spatially
resolved proof stress data on cross-weld samples cut from each weld pass using ESPI
(electron speckle pattern interferometry) integrated tension tests [5]. They measured 4-6.5%
plastic strain in the heat-affected zones of different cross-weld samples. Similarly, Shan et al
[40] has developed a 3D thermo-mechanical model of a single-bead-on-plate weld (316L
stainless steel) and reported accumulation of 4-8% plastic strain near the weld bead in the
base metal due to welding.
The effect of welding onto plastically strained materials in terms of hardness and
0.2% proof stress can be seen in Figures 5 and 11, respectively. There is a marked drop in
hardness and proof stress for the pre-strained and welded samples approaching the weld from
about 16mm away from the WCL. This is caused by the welding process. Base metal near
the weld was heated to temperatures where dislocation annealing mechanisms are known to

21
take place. During welding of tube A0, it was recorded that the peak temperatures had reached
800C, 550C and 400C at 9, 14 and 19mm away from the WCL, respectively. It is known
that the annealing temperature of a metal can be lowered by increasing the amount of cold
work [41]. It was observed in this study that the austenite grain size increases with amount
of cold work from about 25m (no plastic strain) to 45m (20% plastic strain) at 1mm
distance from the fusion boundary. These findings suggest that the pre-strained base metal
adjacent to weld (about 1-1.5mm from the fusion boundary) was annealed due to the heat
produced by welding. The gradual decrease in proof stress towards the fusion boundary may
be explained with partial softening (recovery).
Heat Treatment
Heat treatment at 1050°C with a soaking time of 15 minutes has a significant
influence on the tensile properties of the plain and the cross-weld specimens. The 0.2% proof
strength of the plain specimens decreases dramatically after the heat treatment. The 0.2%
proof stress of specimens B0-HT, B10-HT and B20-HT are 249, 218 and 225MPa, respectively
(Fig. 4(b)).
Surprisingly, the stress-strain curves of the specimens B10-HT and B20-HT are below the
stress-strain curve of the specimen B0-HT. This can be attributed to the Hall-Petch grain size
effect [42, 43]. The micrographs of the plain samples before and after heat treatment are
given in Fig. 16. Prior to the heat treatment, the grain size of both non-strained and pre-
strained material is ~30m in the straining direction. However, after the heat treatment the
grain size of plain material is almost unchanged at about 28 m, whereas the grain size of
the pre-strained materials was almost doubled (>50 m), which resulted in lower strength.
It has been found that the heat treatment has also altered the tensile properties of the
cross-weld specimens. The proof stress of the weld metal decreased by 60MPa as a result of

22
the heat treatment. This can be attributed to the decrease in ferrite content in the
microstructure. Austenitic stainless steel welds usually contain unstable delta ferrite, which
is known to prevent hot-cracking during solidification. The AISI 316L weld metal in the
samples tested in this work contained about 5% delta-ferrite. However, since delta-ferrite is
an unstable phase, it partially transforms to austenite at the heat treatment temperature of
1050°C. Decreasing ferrite content is generally known to result in a decrease in room-
temperature strength [30]. The decrease in 0.2% proof stress of the base metal in specimens
C0-HT, C10-HT and C20-HT is similar to the decrease in the proof stress of plain specimens B0-
HT, B10-HT and B20-HT. The hardness profiles on heat-treated cross-weld samples (Fig. 5)
agrees well with the proof stress distribution on cross-welds C0-HT, C10-HT and C20-HT (Fig.
11).
It can be concluded that the effect of pre-straining on mechanical properties has been
eradicated by the heat treatment process.
2. Local stress-strain curves
Local strains were measured with DIC and SGs during the tension tests of cross-weld
specimens. Since it is not possible to measure local stresses in a composite specimen during
the tension test, in the construction of local stress-strain curves, the global stress was used.
Anomalies have been observed at around 340 MPa on some of the experimental curves
obtained from C10 and C20 specimens (Fig. 9). A realistic FE model of the cross-weld
specimen with strength mismatch was useful to understand why these anomalies exist on
some curves, which are discussed below.
In a tension test of a homogenous specimen the stress is purely axial and no stress
develops in the transverse or through thickness direction in the gauge length until necking

23
starts. However, in a tension test of a cross-weld specimen, biaxial stresses develop after
yielding starts due to the strength mismatch. The strong metal can constrain the deformation
of the soft metal and bi-axial stresses can develop at the interface. The development of
stresses in the loading and transverse direction during the tension test of a cross-weld
specimen with strength mismatch is shown in Fig. 17. According to the 2D von Mises
yielding criteria, the development of transverse stresses will affect the yielding behaviour of
the metal. The reason why curves (1) and (2) in Fig. 14 are different than the input stress-
strain curve is the development of biaxial stresses and strains as demonstrated in Fig. 17.
In Fig. 14, it was observed that, when averaged-width strain was used, the use of
global stress instead of actual averaged-width stress does not modify the local stress-strain
curve (see curves (2) and (4)). This means that the actual stress averaged across the full-width
at 7.75mm is very similar to the global stress. On the other hand, it was found out that when
strain at the mid-width at 7.75mm from WCL was used, the use of global stress instead of
actual stress at mid-width creates an anomaly as observed experimentally (see curves (1) and
(3)). The reason for that is the non-uniform axial stress distribution throughout the specimen
as shown in Fig. 17(a), which results in a significant difference between the global stress and
the actual axial stress at mid-width at 7.75mm.
Fig. 15 shows that the proof stress prediction using the curve (3) (“global stress” vs.
“strain @ mid-width”) is more reliable compared to that using curve (4) (“global stress” vs.
“averaged-width strain”). It can be seen from Fig. 15(b) that even 1% proof stress prediction
using curve (4) is 25MPa less than the input 1% proof stress. The reason why curve (4) does
not predict the proof stress well, despite not showing any anomaly, is because it does not
represent the input stress-strain curve well. On the other hand, even though there is anomaly

24
on curve (3) due to the use of global stress, it is similar to the input stress-strain curve (see
Fig.14).
The deformation behaviour at mid-width at 7.75mm from WCL is governed by the
corresponding local input stress-strain curve. Therefore, curve (3) is expected to be similar
to the input stress-strain curve when (i) the global stress is close to the equivalent stress at
mid-width and (ii) the axial strain at mid-width is close to the equivalent strain at mid-width.
Note that the similarity between the curve (3), or curve (4), and the input stress-strain curve
will change depending on the combined effect of the specimen geometry, length of the HAZ
and the strength mismatch between the base and weld metals.
Conclusions
It has been shown that the DIC technique can successfully be used to map local strain
variations in welded joints during tensile testing. The technique has been employed to study
the effect of pre-straining on the properties of welded thin-walled tubes manufactured from
AISI 316H type stainless steel.
The tensile tests of the plain specimens cut from the studied tubes showed that the
pre-straining the material to 10% and 20% increases the proof stress about 190% and 230%,
respectively. The effect of pre-straining, however, could be reversed by applying an
appropriate heat treatment procedure. The effect of pre-straining on proof stress was also
considerable in cross-weld specimens cut from the welded-tubes. The mapping of the proof
stress across the weldment revealed that, although no significant increase in the proof stress
was observed within the weld metal, it gradually increased in the HAZ away from the WCL,
reaching to the plain metal levels at about 20 mm from the WCL. As in the plain specimens,

25
the effect of pre-straining disappeared in the cross-weld specimens and the proof stress along
the specimens was nearly homogenized after the heat treatment at 1050C for 15 minutes.
Strength mismatch within the weld affected zone resulted in apparent strain relaxation
in local stress-strain curves when strain fields obtained by DIC was constructed using global
stress calculated from the applied load. The reason for this is that once local yielding begins
in a region with lower yield strength, the surrounding region with higher yield strength
constrain the softer material and biaxial stresses develop in the region. FE simulation of a
tension test of a cross-weld specimen using a multi-material model confirmed that bi-axial
stresses develop progressively within the HAZ between the already plastically deformed
region and the adjacent region that hasn't yielded yet. The biaxial stress state changes the
local yielding behaviour of the material and hence the use of global axial stress to construct
the local stress-strain curve in the HAZ where the bi-axial stresses progressively develop
produces an experimental anomaly where the strain appears to relax in the elastic regime
with increasing strain. FE modelling results suggest that the use of global stress to calculate
the proof stress in the specimens showing the reduced-strain anomaly caused by the strength
mismatch level of 0.3 produces less than 8% error in proof stress when strain fields were
obtained from the middle section (strain @midwidth) of the cross-weld specimen tests.
Acknowledment
This study was financially supported by EDF UK (formerly British Energy).
References
1. Kamaya M, Wilkinson a, Titchmarsh J (2006) Quantification of plastic strain of stainless
steel and nickel alloy by electron backscatter diffraction. Acta Materialia 54:539–548.
doi: 10.1016/j.actamat.2005.08.046

26
2. Willis M, McDonaugh-Smith A, Hales R (1999) Prestrain effects on creep ductility of a
316 stainless steel light forging. International Journal of Pressure Vessels and Piping
76:355–359. doi: http://dx.doi.org/10.1016/S0308-0161(99)00007-1
3. ASME Boiler and Pressure Vessel Code, Section I: Rules for Construction of Power
Boilers. ASME, New York, USA
4. Spindler MW (2008) Effects of plastic strain and heat treatment on microstructure and
properties of 316 stainless steel tubing (Personal Communication).
5. Turski M, Smith MC, Bouchard PJ, et al. (2009) Spatially Resolved Materials Property
Data From a Uniaxial Cross-Weld Tensile Test. Journal of Pressure Vessel Technology
131:1–7. doi: 10.1115/1.4000196
6. Lampman S (1997) Weld Integrity and Performance. ASM International
7. (2009) R6 Revision 4 Assessment of the Integrity of Structures containing Defects.
British Energy Generation Limited, Gloucester, UK
8. (2003) R5 Issue 3 Assessment Procedure for High Temperature Response of Structures.
British Energy Generation Limited, Gloucester, UK
9. Cam G, Erim S, Yeni C, Kocak M (1999) Determination of Mechanical and Fracture
Properties of Laser Beam Welded Steel Joints. Welding Research Supplement 78:193–
201.
10. Kartal M, Molak R, Turski M, et al. (2007) Determination of Weld Metal Mechanical
Properties Utilising Novel Tensile Testing Methods. Applied Mechanics and Materials
7-8:127–132.
11. Molak R, Paradowski K, Brynk T, et al. (2009) Measurement of mechanical properties
in a 316L stainless steel welded joint. International Journal of Pressure Vessels and
Piping 86:43–47. doi: 10.1016/j.ijpvp.2008.11.002
12. Malow TR, Koch CC, Miraglia PQ, Murty KL (1998) Compressive mechanical
behavior of nanocrystalline Fe investigated with an automated ball indentation
technique. Materials Science and Engineering: A 252:36–43. doi:
http://dx.doi.org/10.1016/S0921-5093(98)00661-3
13. Haggag FM, Nanstad RK, Hutton JT, et al. (1990) Use of Automated Ball Indentation
to Measure Flow Properties and Estimate Fracture Toughness in Metallic Materials. In:
Braun AA, Ashbaugh NE, Smith FM (eds) Applications of Automation Technology to
Fatigue and Fracture Testing, ASTM 1092. American Society for Testing and Materials,
Philadelphia, pp 188–208
14. Reynolds AP, Duvall F (1999) Digital image correlation for determination of weld and
base metal constitutive behavior. Welding Research Supplement 78:355–360.

27
15. Sutton MA, Orteu JJ, Schreier HW (2009) Image Correlation for Shape, Motion and
Deformation Measurements- Basic Concepts, Theory and Applications. Image
Rochester NY 341. doi: 10.1007/978-0-387-78747-3
16. Lockwood W, Tomaz B, Reynolds A (2002) Mechanical response of friction stir
welded AA2024: experiment and modeling. Materials Science and Engineering A
323:348–353. doi: 10.1016/S0921-5093(01)01385-5
17. Lockwood WD, Reynolds AP (2003) Simulation of the global response of a friction stir
weld using local constitutive behavior. Materials Science and Engineering A 339:35–42.
doi: 10.1016/S0921-5093(02)00116-8
18. Sutton M, Yang B, Reynolds a, Yan J (2004) Banded microstructure in 2024-T351 and
2524-T351 aluminum friction stir weldsPart II. Mechanical characterization. Materials
Science and Engineering A 364:66–74. doi: 10.1016/S0921-5093(03)00533-1
19. Liu S, Chao YJ (2005) Determination of global mechanical response of friction stir
welded plates using local constitutive properties. Modelling and Simulation in Materials
Science and Engineering 13:1–15. doi: 10.1088/0965-0393/13/1/001
20. Genevois C, Deschamps a, Vacher P (2006) Comparative study on local and global
mechanical properties of 2024 T351, 2024 T6 and 5251 O friction stir welds. Materials
Science and Engineering: A 415:162–170. doi: 10.1016/j.msea.2005.09.032
21. Hatamleh O (2008) Effects of peening on mechanical properties in friction stir welded
2195 aluminum alloy joints. Materials Science and Engineering: A 492:168–176. doi:
http://dx.doi.org/10.1016/j.msea.2008.03.017
22. Zadpoor AA, Sinke J, Benedictus R (2008) The effects of friction stir welding on the
mechanical properties and microstructure of 7000 series aluminium tailor-welded
blanks. International Journal of Material Forming 1:1311–1314. doi: 10.1007/s12289-
008-0144-7
23. Brown R, Tang W, Reynolds AP (2009) Multi-pass friction stir welding in alloy 7050-
T7451: Effects on weld response variables and on weld properties. Materials Science
and Engineering A 513–514:115–121. doi: 10.1016/j.msea.2009.01.041
24. Hatamleh O, Mishra RS, Oliveras O (2009) Peening effects on mechanical properties in
friction stir welded AA 2195 at elevated and cryogenic temperatures. Materials Design
30:3165–3173. doi: 10.1016/j.matdes.2008.11.010
25. Sutton MA, Yan JH, Avril S, et al. (2008) Identification of heterogeneous constitutive
parameters in a welded specimen: uniform stress and virtual fields methods for material
property estimation. Experimental Mechanics 48:451–464.

28
26. Sierra G, Wattrisse B, Bordreuil C (2008) Structural Analysis of Steel to Aluminum
Welded Overlap Joint by Digital Image Correlation. Experimental Mechanics 48:213–
223. doi: 10.1007/s11340-007-9112-2
27. Acar M, Gungor S, Ganguly S, et al. (2009) Variation of Mechanical Properties in a
Multi-pass Weld Measured Using Digital Image Correlation. Society of Experimental
Mechanics (SEM) Annual Conference Proceeding
28. Acar M, Gungor S, Bouchard P, Fitzpatrick ME (2010) Effect of prior cold work on the
mechanical properties of weldments. Society of Experimental Mechanics (SEM) Annual
Conference Proceeding
29. Adeeb S, Horsley D, Yan J, et al. (2006) Local stress-strain response of an axial X100
girth weld under tensile loading using digital image correlation. Proceedings of IPC
30. Boyce BL, Reu PL, Robino C V (2006) The constitutive behavior of laser welds in
304L stainless steel determined by digital image correlation. Metallurgical and Materials
Transactions A 37:2481–2492. doi: 10.1007/BF02586221
31. Robino C V., Boyce BL (2008) Constitutive Properties of Dissimilar Metal Laser
Welds. Trends in Welding Research 2008 (ASM International) 610–616.
32. ASTM Standard E8 / E8M -11 (2012) “Standard Test Methods for Tension Testing of
Metallic Materials.”ASTM International, West Conshohocken ,PA
33. Christ BW, Swanson SR (1976) Alignment problems in the tensile test. Journal of
Testing and Evaluation (JTE) 4:405–417.
34. Gray TGF, McCombe A (1992) Influence of specimen dimension and grip in tensile
testing steel to EN 10 002. Ironmaking and Steelmaking 19:402–408.
35. DaVis 7.2 Data Acquisition and Visualization Software.
36. Rodrigues DM, Menezes LF, Loureiro A, Fernandes J V (2004) Numerical study of the
plastic behaviour in tension of welds in high strength steels. International Journal of
Plasticity 20:1–18. doi: 10.1016/S0749-6419(02)00112-2
37. ABAQUS Standard/User’s Manual, Version 6.7.
38. Smith DJ (2003) The influence of prior loading on structural integrity. In: Milne I,
Ritchie R, Karihaloo B (eds) Comprehensive Structural Integrity. Elsevier, London, pp
288–345
39. Smith MC, Bouchard PJ, Turski M, et al. (2012) Accurate prediction of residual stress
in stainless steel welds. Computational Materials Science 54:312–328. doi:
10.1016/j.commatsci.2011.10.024

29
40. Shan X, Davies CM, Wangsdan T, et al. (2009) Thermo-mechanical modelling of a
single-bead-on-plate weld using the finite element method. International Journal of
Pressure Vessels and Piping 86:110–121. doi:
http://dx.doi.org/10.1016/j.ijpvp.2008.11.005
41. Marshall P (1984) Austenitic Stainless Steels: Microstructure and Mechanical
Properties. Elsevier Applied Science Publishers
42. Sylwestrowicz W, Hall EO (1951) The Deformation and Ageing of Mild Steel.
Proceedings of the Physical Society Section B 64:495–502. doi: 10.1088/0370-
1301/64/6/305
43. Petch NJ (1953) The cleavage strength of polycrystals. J Iron Steel Inst 174:8.
Tables
Table 1 Photographs of the tubes and labelling of the test specimens
Pre-strained and welded tubes Degree of
plastic deformation
Label of
tubes
Label of the plain tensile
specimens
Label of the cross-weld
tensile specimens
0% A0 B0, B0-HT C0, C0-HT
10% A10 B10, B10-HT C10, C10-HT
20% A20 B20, B20-HT C20, C20-HT
Table 2 Chemical composition of the stainless steel tubing material (Type 316H) and
the weld material (Type 316L)
Cr Ni Mo Mn Si Co C
316H 16.89 11.25 2.04 1.55 0.53 0.089 0.05
316L 18.38 12.07 2.53 1.61 0.37 - 0.01
Pipes Degree of Plastic
Deformation
0%
10%
15%
20%
25%
Pipes Degree of Plastic
Deformation
0%
10%
15%
20%
25%
Pipes Degree of Plastic
Deformation
0%
10%
15%
20%
25%

30
Figures
Fig. 1 (a) Weld preparation; (b) Micrograph of the weld cross-section.
Fig. 2 The cut position (top), and the dimensions of the cross-weld test specimens (bottom
left) and plain specimens (bottom right). Both types of specimens are 3mm thick. (LD:
longitudinal direction of the tube parallel to the pre-straining direction, HD: hoop direction
of the tube perpendicular to the pre-straining direction, RD (into the page): radial direction
of the tube perpendicular to the pre-straining direction).
31
Fig. 3 Flow chart for the determination of the proof stress distribution from DIC displacement
measurements with Matlab scripts.

32
Fig. 4 (a) Global engineering stress-strain curves of all the specimens obtained by tension
tests with the use of an extensometer; (b) Comparisons of strain values determined by DIC
and extensometer (EXT) for plain specimens. 0.2% and 1% proof stresses determined from
the curves are also tabulated.

33
Fig. 5 Hardness profiles on the as-welded cross-weld specimens C0, C10 and C20 and heat-
treated cross-weld specimens C0-HT, C10-HT and C20-HT.
Fig. 6 Positions of strain gauges (SGs) on the back and front surfaces of cross-weld
specimens.

34
Fig. 7 Stress-strain data measured using strain gauges (SG) and DIC at the weld centre of
cross-weld specimens.
Fig. 8 Stress-strain data measured using strain gauge (SG) and DIC at 6.5mm from the WCL
of cross-weld specimens.

35
Fig. 9 Stress-strain data measured using DIC at 10mm from the WCL of cross-weld
specimens.
Fig. 10 Stress-strain data measured using SGs and DIC at 20mm from the WCL of cross-
weld specimens.

36
Fig. 11 Variation in 0.2% proof stress moving away from the WCL for cross-weld specimens
(derived from SG and DIC data). Solid symbols represent the DIC data. Other symbols at
WCL, 6.5mm and 20mm represent SG data. Open symbols are for the heat treated samples
labelled with HT. 0.2% proof stress obtained from SG is also tabulated for different positions.

37
Fig. 12 Material properties input for FE model. (a) Input stress-strain curves (b) Input yield
stress distribution along the specimen. Note that material properties in HAZ are continuous
and there is no interface between unaffected base metal and HAZ.

38
Fig. 13 Finite element model mesh, element size and type
Fig. 14 The effect of iso-stress assumption (the use of global stress) on the stress-strain curves
obtained from mid-width (filled domain) and averaged-width (unfilled & filled domains in a
row) at 7.75mm away from WCL. Global stress was obtained from the average of axial
stresses across the width (unfilled domains) at 24.5mm away from WCL.

39
Fig. 15 Determination of 0.2% (a) and 1% (b) proof stress distribution along the half length
of the specimen using curves (3) and (4) (see Fig. 14). Solid lines (―) correspond to the input
0.2% and 1% proof stress.

40
Fig. 16 The microstructures of the plain specimens before (B0, B10, B20) and after (B0-HT,
B10-HT, B20-HT) the heat treatment on the RD-LD plane

41
Fig. 17 Multi-material simulation results between WCL and 25mm away in the top half of
the specimen at a global stress of 263, 304, 365, 407 and 440MPa (a) True stress (yy) in
loading direction (y-direction) (b) True stress (xx) in the transverse direction (x-direction).
The domain at the mid-width of 7.75mm is highlighted with a rectangle.