Embed Size (px)
Citation preview
applied sciences
Article
Experimental and Numerical Studies of ControllingThermal Cracks in Mass Concrete Foundation byCirculating Water
Wenchao Liu 1, Wanlin Cao 1,*, Huiqing Yan 2, Tianxiang Ye 2 and Wang Jia 3
1 College of Architecture and Civil Engineering, Beijing University of Technology, Beijing 100124, China;[email protected]
2 China Railway Airport Construction Group Co., Beijing 100093, China; [email protected] (H.Y.);[email protected] (T.Y.)
3 Beijing Jialong Group Co., Beijing 100125, China; [email protected]* Correspondence: [email protected]; Tel.: +86-10-6739-2819
Academic Editor: Andrea PagliettiReceived: 26 January 2016; Accepted: 13 April 2016; Published: 20 April 2016
Abstract: This paper summarizes an engineering experience of solving the problem of thermalcracking in mass concrete by using a large project, Zhongguancun No.1 (Beijing, China), as anexample. A new method is presented for controlling temperature cracks in the mass concrete ofa foundation. The method involves controlled cycles of water circulating between the surface ofmass concrete foundation and the atmospheric environment. The temperature gradient between thesurface and the core of the mass concrete is controlled at a relatively stable state. Water collected fromthe well-points used for dewatering and from rainfall is used as the source for circulating water. Massconcrete of a foundation slab is experimentally investigated through field temperature monitoring.Numerical analyses are performed by developing a finite element model of the foundation withand without water circulation. The calculation parameters are proposed based on the experiment,and finite element analysis software MIDAS/CIVIL is used to calculate the 3D temperature field ofthe mass concrete during the entire process of heat of hydration. The numerical results are in goodagreement with the measured results. The proposed method provides an alternative practical basisfor preventing thermal cracks in mass concrete.
Keywords: circulating water; mass concrete; 3D temperature field; temperature monitoring; simulation
1. Introduction
With the continuous development of high-rise buildings, the height of buildings is constantlyincreasing, thus posing increasing challenges to the foundation of buildings. Generally, a deeperfoundation can provide a better safety factor for the whole building [1]. Thus, in the future, the depthof the building foundation can be predicted to increase. However, increased foundation depth cancause several problems. One such problem is associated with the construction of mass concrete, whichis receiving growing research interest [2–6]. In particular, heat of hydration is a major problem ofmass concrete. When the internal temperature of concrete exceeds a certain limit, it will produce largethermal stress, which will lead to internal premature cracks in concrete [7–9]. Such cracks are known asthermal cracks in construction. The main principle of controlling the thermal cracks in a constructionis either to reduce the production of heat of hydration or to dissipate the heat so as not to accumulateit inside concrete.
At present, the three main methods for controlling construction temperature cracks include:(i) installing a pre-buried cooling water pipe, (ii) covering with a thermal insulation material, and
Appl. Sci. 2016, 6, 110; doi:10.3390/app6040110 www.mdpi.com/journal/applsci
Appl. Sci. 2016, 6, 110 2 of 18
(iii) adding a new material (PCM- Phase Change Material) in concrete. Seo et al. [10] developed avertical pipe cooling method and tested it in a wall-type mass concrete specimen to validate the method.The experimental result showed that the temperature of the concrete specimen with the vertical pipecooling system was 8–14 ˝C lower than that of the control specimen without the vertical pipe coolingsystem. Some construction measures [11,12] have adopted thermal insulation material to covermass concrete in order to control thermal cracks in mass concrete. Some other studies [13–15] haveinvestigated the use of phase change materials (PCM) to limit the rise in temperature of mass concrete.For the pre-buried cooling water pipe method, concrete should be embedded with a large numberof pipelines; the process is complex and costly. If the treatment measure for the permanently buriedsteel pipe is not enough, it will lead to internal defects within a concrete structure. For the method ofcovering with a thermal insulation material, the materials used are not environmentally friendly, andare also unsuitable for the high strength mass concrete that requires a relatively larger cement content.The new materials (PCM materials), because of their relatively immature technology and high cost, arenot widely used. In the meantime, a new technology of circulating water to control the thermal crackingin mass concrete foundation has emerged [16–18]. The circulating water comes from well points usedfor dewatering and from rainfall. Water is stored in a thermostat tank and the initial temperature ofthe water is adjusted to a specified temperature. Water with an appropriate temperature is broughtinto the temperature drop pool lying above the foundation slab. The temperature difference betweenthe surface and the interior (core) of mass concrete is finally achieved by changing the temperatureand the depth of water in the thermostat tank and varying the temperature in the drop pool.
In this paper, an experimental study (temperature monitoring) is performed by utilizing the newtechnology of circulating water in a mass concrete foundation in the construction of “A” and “D” areasof the project—Zhongguancun No. 1 in China (the project has four working areas which are named A,B, C and D). The variation in the internal temperature field of mass concrete is analyzed by using thefinite element software MIDAS/CIVIL to simulate the 3D temperature field. The proposed methodprovides an alternative practical basis for preventing thermal cracks in mass concrete.
2. General Description of Project
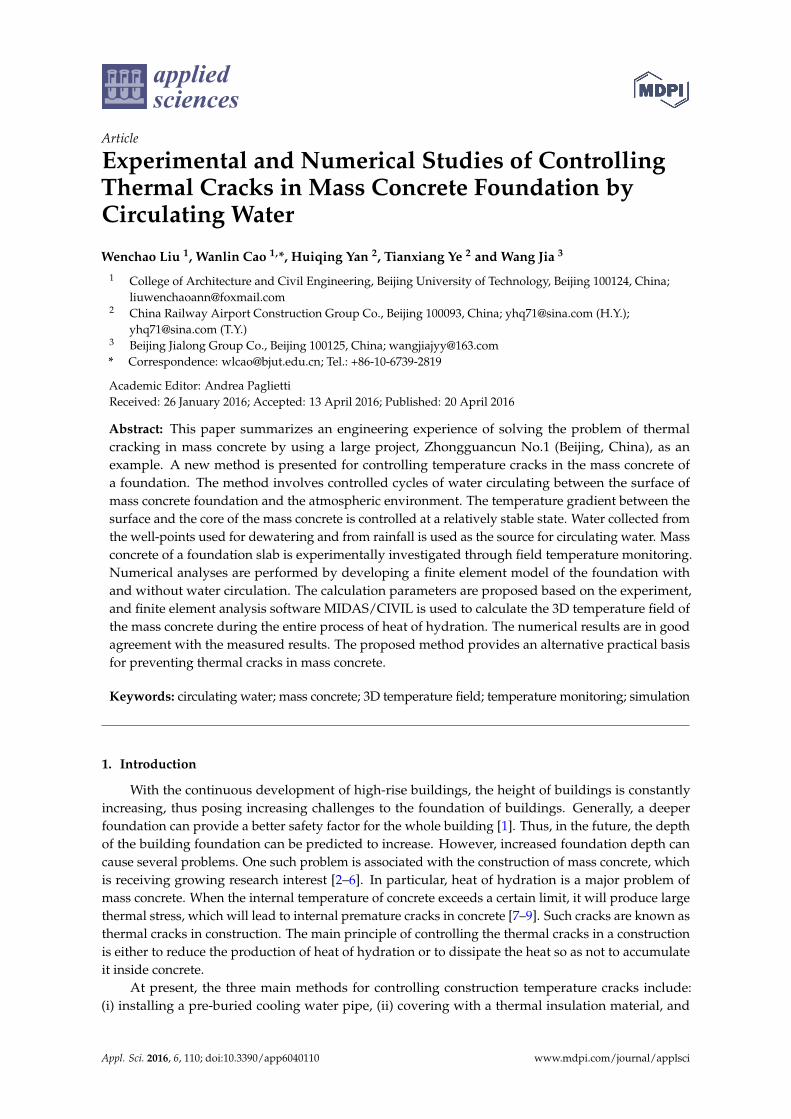
Zhongguancun No. 1 (A and D areas) is located in Yongfeng industrial base, Beijing, China, witha total construction area of 232320 m2. Building structure type of A and D area is core tube structure asshown in Figure 1a. The underground part of A and D areas has three floors. The foundation concreteis standard mass concrete. Construction features are as follows:
(1) Large area: Each block in the area is more than 3000 m2.(2) Thick slab: The thickness of concrete slab is 1.8–2.2 m, and the local set puddle is up to 5.0 m.(3) (i) Ambient temperature of the construction site was relatively higher with the temperature as
high as 38.5 ˝C. Maximum temperature of steel surface was about 55 ˝C; (ii) the amount of eachpour of concrete was 5600–6000 m3. Concrete was C35 (P8) grade and was low-permeability type.Based on these data, the temperature inside the mass concrete would increase due to heat ofhydration and could reach 65–75 ˝C.
Appl. Sci. 2016, 6, 110 3 of 18
(a) (b)
Figure 1. The project site of Zhongguancun. (a) Plan sketch of “A” and “D” areas; (b) Site operation of“A” area.
3. Experimental Technique
3.1. Test Object
The object of this experiment was the foundation slab of the three basement floors at A1-A9/H-Qaxis in the “A” area, as shown in Figure 1b. The concrete slab size was 48 m (width), 48.6 m (length),1.8 m (depth) and the total volume of concrete was 4199 m3. The ambient daily average temperatureduring the construction was 32.5 ˝C and the maximum temperature was 38.5 ˝C.
The grade of mass concrete was C35, and vibrators were used for compaction. The cementstrength grade was P.0 42.5, the water to cement ratio was 0.42, and the sand ratio (the quantity ofsand/the total mass of sand and stone) was 43%. The concrete mix design is detailed in Table 1.
Table 1. Mix design of concrete (kg/m3).
Component Cement Water Medium Sand Crushed Pebble Admixture Fly Ash
Content 280 170 774 1026 8 120
3.2. Technical Scheme
3.2.1. Control Principle
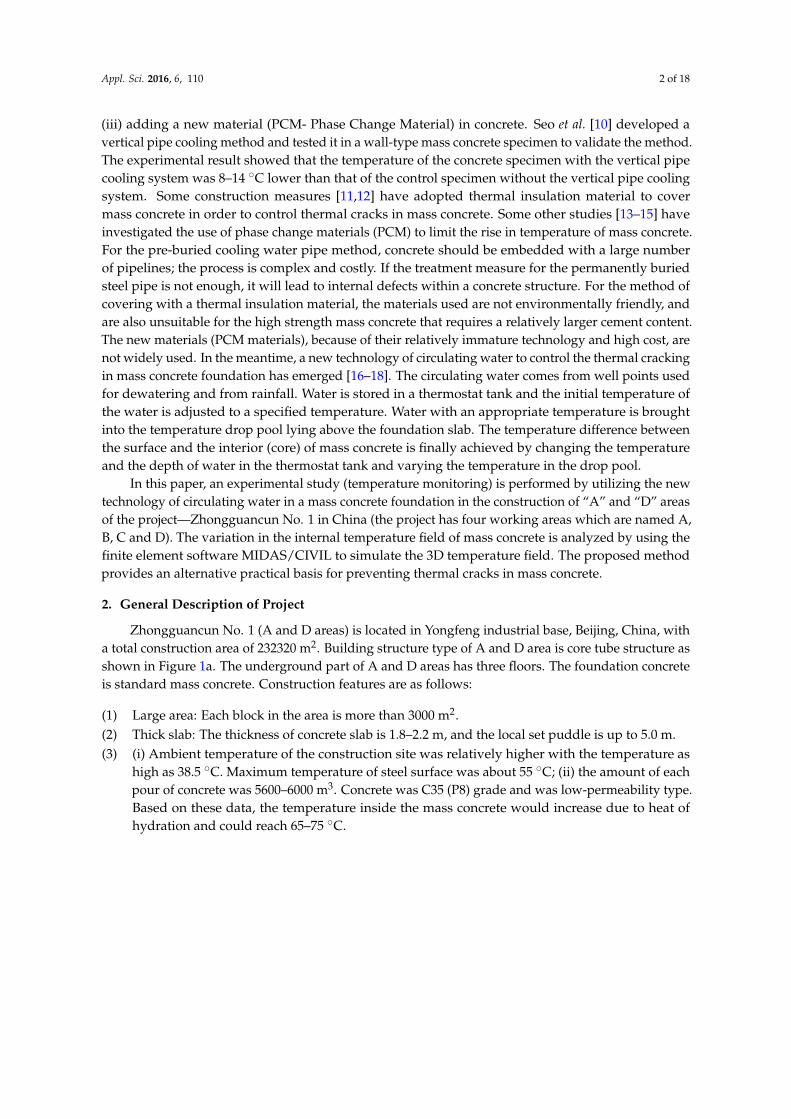
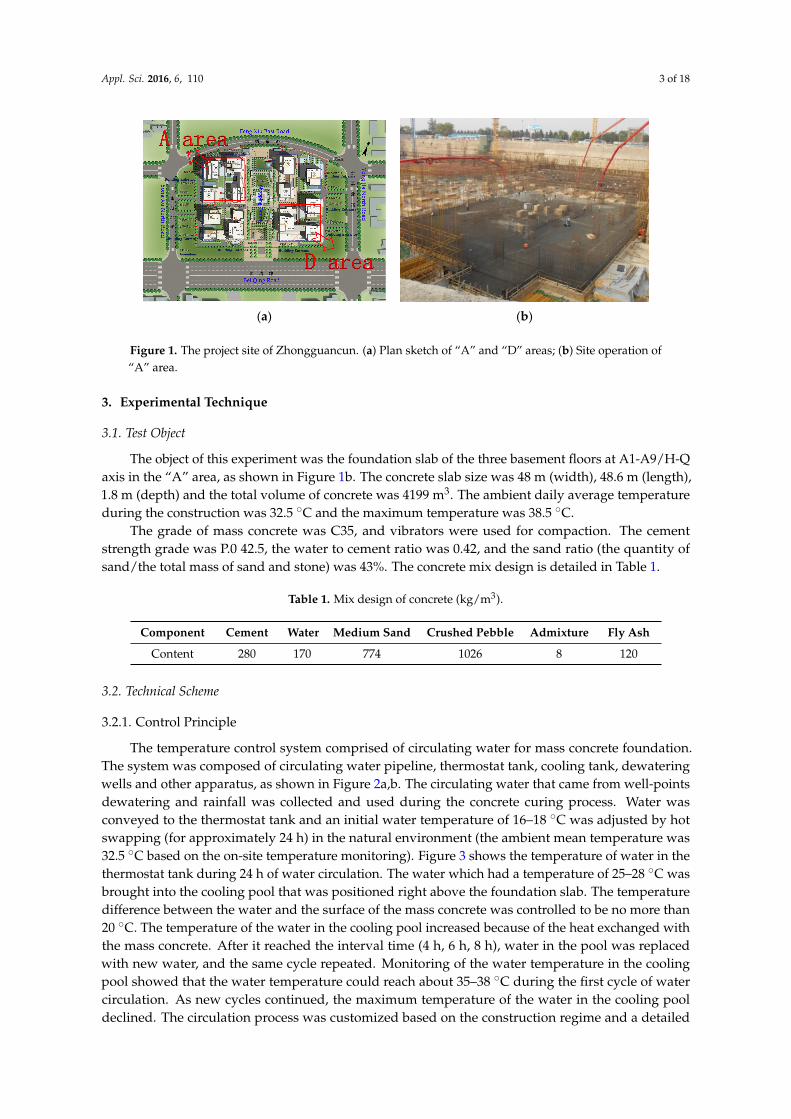
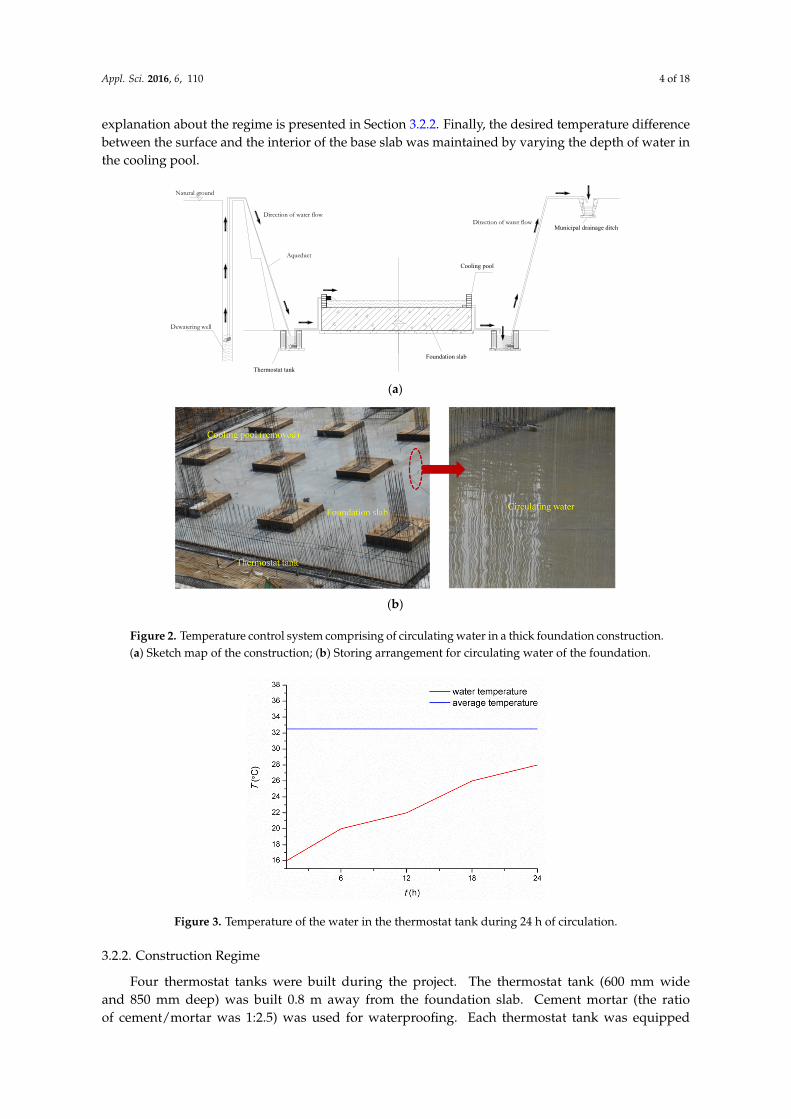
The temperature control system comprised of circulating water for mass concrete foundation.The system was composed of circulating water pipeline, thermostat tank, cooling tank, dewateringwells and other apparatus, as shown in Figure 2a,b. The circulating water that came from well-pointsdewatering and rainfall was collected and used during the concrete curing process. Water wasconveyed to the thermostat tank and an initial water temperature of 16–18 ˝C was adjusted by hotswapping (for approximately 24 h) in the natural environment (the ambient mean temperature was32.5 ˝C based on the on-site temperature monitoring). Figure 3 shows the temperature of water in thethermostat tank during 24 h of water circulation. The water which had a temperature of 25–28 ˝C wasbrought into the cooling pool that was positioned right above the foundation slab. The temperaturedifference between the water and the surface of the mass concrete was controlled to be no more than20 ˝C. The temperature of the water in the cooling pool increased because of the heat exchanged withthe mass concrete. After it reached the interval time (4 h, 6 h, 8 h), water in the pool was replacedwith new water, and the same cycle repeated. Monitoring of the water temperature in the coolingpool showed that the water temperature could reach about 35–38 ˝C during the first cycle of watercirculation. As new cycles continued, the maximum temperature of the water in the cooling pooldeclined. The circulation process was customized based on the construction regime and a detailed
Appl. Sci. 2016, 6, 110 4 of 18
explanation about the regime is presented in Section 3.2.2. Finally, the desired temperature differencebetween the surface and the interior of the base slab was maintained by varying the depth of water inthe cooling pool.
Appl. Sci. 2016, 6, 110 4 of 18
temperature difference between the surface and the interior of the base slab was maintained by varying the depth of water in the cooling pool.
(a)
(b)
Figure 2. Temperature control system comprising of circulating water in a thick foundation construction. (a) Sketch map of the construction; (b) Storing arrangement for circulating water of the foundation.
Figure 3. Temperature of the water in the thermostat tank during 24 h of circulation.
3.2.2. Construction Regime
Four thermostat tanks were built during the project. The thermostat tank (600 mm wide and 850 mm deep) was built 0.8 m away from the foundation slab. Cement mortar (the ratio of cement/mortar was 1:2.5) was used for waterproofing. Each thermostat tank was equipped with a 5.5 kW submersible pump, the caliber was 65 mm, the flow was 36 m3/h, and the lift was 27 m. Circulating water was provided by the dewatering well system as its secondary utilization and the
Natural ground
Direction of water flow
Aqueduct
Dewatering well
Thermostat tank
Direction of water flow
Foundation slab
Cooling pool
Municipal drainage ditch
Figure 2. Temperature control system comprising of circulating water in a thick foundation construction.(a) Sketch map of the construction; (b) Storing arrangement for circulating water of the foundation.
Appl. Sci. 2016, 6, 110 4 of 18
temperature difference between the surface and the interior of the base slab was maintained by varying the depth of water in the cooling pool.
(a)
(b)
Figure 2. Temperature control system comprising of circulating water in a thick foundation construction. (a) Sketch map of the construction; (b) Storing arrangement for circulating water of the foundation.
Figure 3. Temperature of the water in the thermostat tank during 24 h of circulation.
3.2.2. Construction Regime
Four thermostat tanks were built during the project. The thermostat tank (600 mm wide and 850 mm deep) was built 0.8 m away from the foundation slab. Cement mortar (the ratio of cement/mortar was 1:2.5) was used for waterproofing. Each thermostat tank was equipped with a 5.5 kW submersible pump, the caliber was 65 mm, the flow was 36 m3/h, and the lift was 27 m. Circulating water was provided by the dewatering well system as its secondary utilization and the
Natural ground
Direction of water flow
Aqueduct
Dewatering well
Thermostat tank
Direction of water flow
Foundation slab
Cooling pool
Municipal drainage ditch
Figure 3. Temperature of the water in the thermostat tank during 24 h of circulation.
3.2.2. Construction Regime
Four thermostat tanks were built during the project. The thermostat tank (600 mm wideand 850 mm deep) was built 0.8 m away from the foundation slab. Cement mortar (the ratioof cement/mortar was 1:2.5) was used for waterproofing. Each thermostat tank was equipped
Appl. Sci. 2016, 6, 110 5 of 18
with a 5.5 kW submersible pump, the caliber was 65 mm, the flow was 36 m3/h, and the lift was27 m. Circulating water was provided by the dewatering well system as its secondary utilizationand the aqueduct DG-150 (the internal diameter is 150 mm) was used for conveying water to thefoundation slab.
After pouring the mass concrete, the foundation slab was frequently cured by sprinkler and wascovered with plastic sheets. Double layer bags were used to cover the sides of mass concrete forproviding moisture. The cooling pool was built around the slab when the foundation was finished.For the thickness of the mass concrete less than 2 m, the cooling pool was 120 mm wide and 240 mmhigh. For the thickness of the mass concrete greater than 2 m, the cooling pool was 240 mm wide and350 mm high. Cement mortar (the ratio of cement:mortar was 1:2) was used for waterproofing.
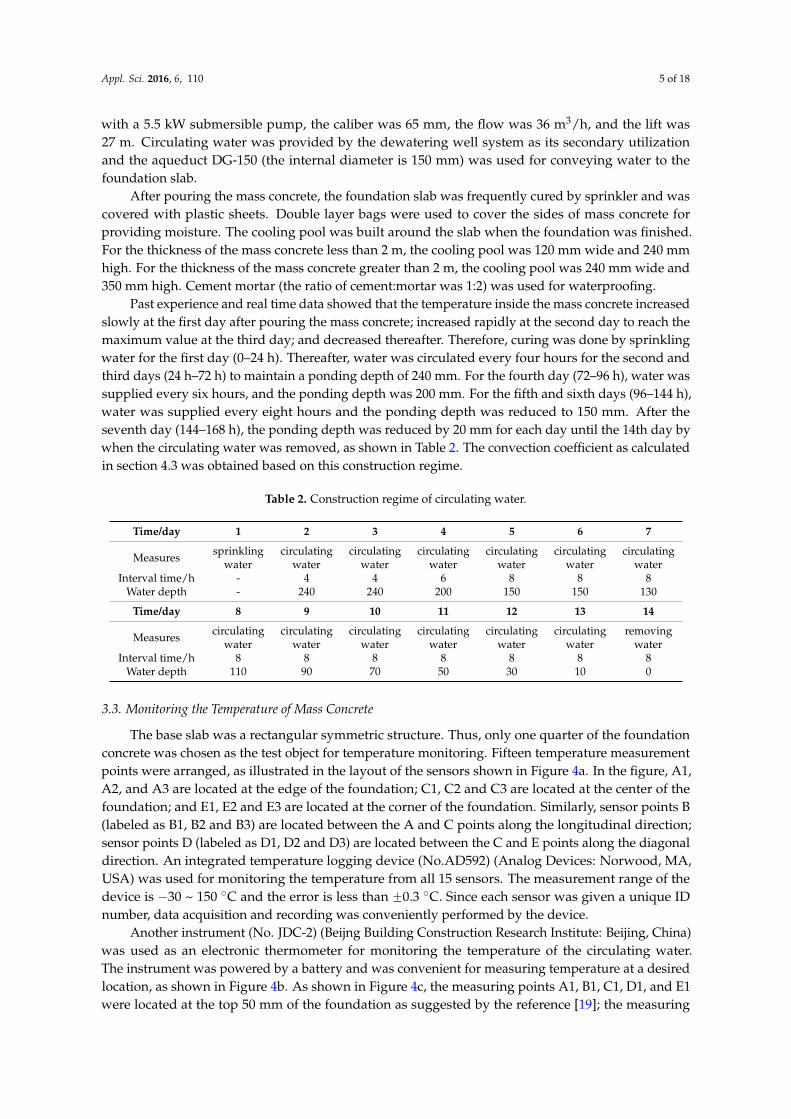
Past experience and real time data showed that the temperature inside the mass concrete increasedslowly at the first day after pouring the mass concrete; increased rapidly at the second day to reach themaximum value at the third day; and decreased thereafter. Therefore, curing was done by sprinklingwater for the first day (0–24 h). Thereafter, water was circulated every four hours for the second andthird days (24 h–72 h) to maintain a ponding depth of 240 mm. For the fourth day (72–96 h), water wassupplied every six hours, and the ponding depth was 200 mm. For the fifth and sixth days (96–144 h),water was supplied every eight hours and the ponding depth was reduced to 150 mm. After theseventh day (144–168 h), the ponding depth was reduced by 20 mm for each day until the 14th day bywhen the circulating water was removed, as shown in Table 2. The convection coefficient as calculatedin section 4.3 was obtained based on this construction regime.
Table 2. Construction regime of circulating water.
Time/day 1 2 3 4 5 6 7
Measures sprinklingwater
circulatingwater
circulatingwater
circulatingwater
circulatingwater
circulatingwater
circulatingwater
Interval time/h - 4 4 6 8 8 8Water depth - 240 240 200 150 150 130
Time/day 8 9 10 11 12 13 14
Measures circulatingwater
circulatingwater
circulatingwater
circulatingwater
circulatingwater
circulatingwater
removingwater
Interval time/h 8 8 8 8 8 8 8Water depth 110 90 70 50 30 10 0
3.3. Monitoring the Temperature of Mass Concrete
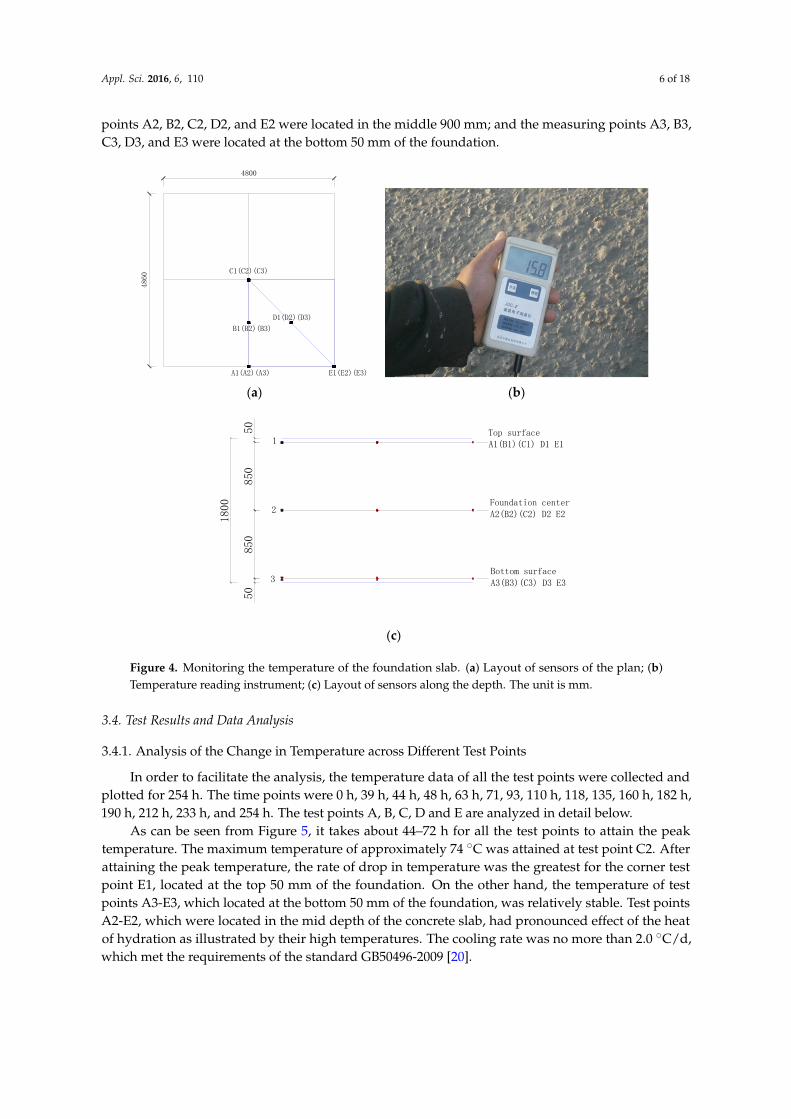
The base slab was a rectangular symmetric structure. Thus, only one quarter of the foundationconcrete was chosen as the test object for temperature monitoring. Fifteen temperature measurementpoints were arranged, as illustrated in the layout of the sensors shown in Figure 4a. In the figure, A1,A2, and A3 are located at the edge of the foundation; C1, C2 and C3 are located at the center of thefoundation; and E1, E2 and E3 are located at the corner of the foundation. Similarly, sensor points B(labeled as B1, B2 and B3) are located between the A and C points along the longitudinal direction;sensor points D (labeled as D1, D2 and D3) are located between the C and E points along the diagonaldirection. An integrated temperature logging device (No.AD592) (Analog Devices: Norwood, MA,USA) was used for monitoring the temperature from all 15 sensors. The measurement range of thedevice is ´30 ~ 150 ˝C and the error is less than ˘0.3 ˝C. Since each sensor was given a unique IDnumber, data acquisition and recording was conveniently performed by the device.
Another instrument (No. JDC-2) (Beijng Building Construction Research Institute: Beijing, China)was used as an electronic thermometer for monitoring the temperature of the circulating water.The instrument was powered by a battery and was convenient for measuring temperature at a desiredlocation, as shown in Figure 4b. As shown in Figure 4c, the measuring points A1, B1, C1, D1, and E1were located at the top 50 mm of the foundation as suggested by the reference [19]; the measuring
Appl. Sci. 2016, 6, 110 6 of 18
points A2, B2, C2, D2, and E2 were located in the middle 900 mm; and the measuring points A3, B3,C3, D3, and E3 were located at the bottom 50 mm of the foundation.Appl. Sci. 2016, 6, 110 6 of 18
(a) (b)
(c)
Figure 4. Monitoring the temperature of the foundation slab. (a) Layout of sensors of the plan; (b) Temperature reading instrument; (c) Layout of sensors along the depth. The unit is mm.
3.4. Test Results and Data Analysis
(1) Analysis of the change in temperature across different test points
In order to facilitate the analysis, the temperature data of all the test points were collected and plotted for 254 h. The time points were 0 h, 39 h, 44 h, 48 h, 63 h, 71, 93, 110 h, 118, 135, 160 h, 182 h, 190 h, 212 h, 233 h, and 254 h. The test points A, B, C, D and E are analyzed in detail below.
As can be seen from Figure 5, it takes about 44–72 h for all the test points to attain the peak temperature. The maximum temperature of approximately 74 °C was attained at test point C2. After attaining the peak temperature, the rate of drop in temperature was the greatest for the corner test point E1, located at the top 50 mm of the foundation. On the other hand, the temperature of test points A3-E3, which located at the bottom 50 mm of the foundation, was relatively stable. Test points A2-E2, which were located in the mid depth of the concrete slab, had pronounced effect of the heat of hydration as illustrated by their high temperatures. The cooling rate was no more than 2.0 °C/d, which met the requirements of the standard GB50496-2009 [20].
A1(A2)(A3)
B1(B2)(B3)
C1(C2)(C3)
D1(D2)(D3)
E1(E2)(E3)
4800
4860
850
5085
050
Top surfaceA1(B1)(C1) D1 E1
Foundation centerA2(B2)(C2) D2 E2
Bottom surfaceA3(B3)(C3) D3 E3
1800
1
2
3
Figure 4. Monitoring the temperature of the foundation slab. (a) Layout of sensors of the plan; (b)Temperature reading instrument; (c) Layout of sensors along the depth. The unit is mm.
3.4. Test Results and Data Analysis
3.4.1. Analysis of the Change in Temperature across Different Test Points
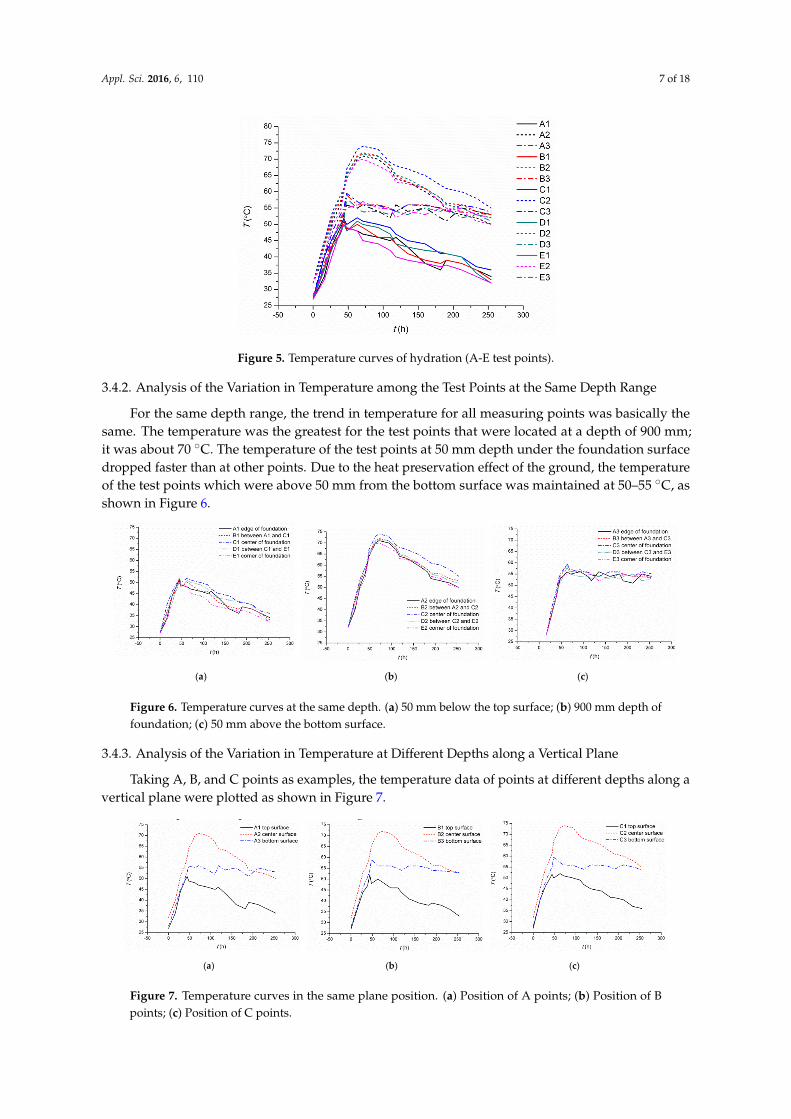
In order to facilitate the analysis, the temperature data of all the test points were collected andplotted for 254 h. The time points were 0 h, 39 h, 44 h, 48 h, 63 h, 71, 93, 110 h, 118, 135, 160 h, 182 h,190 h, 212 h, 233 h, and 254 h. The test points A, B, C, D and E are analyzed in detail below.
As can be seen from Figure 5, it takes about 44–72 h for all the test points to attain the peaktemperature. The maximum temperature of approximately 74 ˝C was attained at test point C2. Afterattaining the peak temperature, the rate of drop in temperature was the greatest for the corner testpoint E1, located at the top 50 mm of the foundation. On the other hand, the temperature of testpoints A3-E3, which located at the bottom 50 mm of the foundation, was relatively stable. Test pointsA2-E2, which were located in the mid depth of the concrete slab, had pronounced effect of the heatof hydration as illustrated by their high temperatures. The cooling rate was no more than 2.0 ˝C/d,which met the requirements of the standard GB50496-2009 [20].
Appl. Sci. 2016, 6, 110 7 of 18Appl. Sci. 2016, 6, 110 7 of 18
Figure 5. Temperature curves of hydration (A-E test points).
(2) Analysis of the variation in temperature among the test points at the same depth range
For the same depth range, the trend in temperature for all measuring points was basically the same. The temperature was the greatest for the test points that were located at a depth of 900 mm; it was about 70 °C. The temperature of the test points at 50 mm depth under the foundation surface dropped faster than at other points. Due to the heat preservation effect of the ground, the temperature of the test points which were above 50 mm from the bottom surface was maintained at 50–55 °C, as shown in Figure 6.
(a) (b) (c)
Figure 6. Temperature curves at the same depth. (a) 50 mm below the top surface; (b) 900 mm depth of foundation; (c) 50 mm above the bottom surface.
(3) Analysis of the variation in temperature at different depths along a vertical plane
Taking A, B, and C points as examples, the temperature data of points at different depths along a vertical plane were plotted as shown in Figure 7.
(a) (b) (c)
Figure 5. Temperature curves of hydration (A-E test points).
3.4.2. Analysis of the Variation in Temperature among the Test Points at the Same Depth Range
For the same depth range, the trend in temperature for all measuring points was basically thesame. The temperature was the greatest for the test points that were located at a depth of 900 mm;it was about 70 ˝C. The temperature of the test points at 50 mm depth under the foundation surfacedropped faster than at other points. Due to the heat preservation effect of the ground, the temperatureof the test points which were above 50 mm from the bottom surface was maintained at 50–55 ˝C, asshown in Figure 6.
Appl. Sci. 2016, 6, 110 7 of 18
Figure 5. Temperature curves of hydration (A-E test points).
(2) Analysis of the variation in temperature among the test points at the same depth range
For the same depth range, the trend in temperature for all measuring points was basically the same. The temperature was the greatest for the test points that were located at a depth of 900 mm; it was about 70 °C. The temperature of the test points at 50 mm depth under the foundation surface dropped faster than at other points. Due to the heat preservation effect of the ground, the temperature of the test points which were above 50 mm from the bottom surface was maintained at 50–55 °C, as shown in Figure 6.
(a) (b) (c)
Figure 6. Temperature curves at the same depth. (a) 50 mm below the top surface; (b) 900 mm depth of foundation; (c) 50 mm above the bottom surface.
(3) Analysis of the variation in temperature at different depths along a vertical plane
Taking A, B, and C points as examples, the temperature data of points at different depths along a vertical plane were plotted as shown in Figure 7.
(a) (b) (c)
Figure 6. Temperature curves at the same depth. (a) 50 mm below the top surface; (b) 900 mm depth offoundation; (c) 50 mm above the bottom surface.
3.4.3. Analysis of the Variation in Temperature at Different Depths along a Vertical Plane
Taking A, B, and C points as examples, the temperature data of points at different depths along avertical plane were plotted as shown in Figure 7.
Appl. Sci. 2016, 6, 110 7 of 18
Figure 5. Temperature curves of hydration (A-E test points).
(2) Analysis of the variation in temperature among the test points at the same depth range
For the same depth range, the trend in temperature for all measuring points was basically the same. The temperature was the greatest for the test points that were located at a depth of 900 mm; it was about 70 °C. The temperature of the test points at 50 mm depth under the foundation surface dropped faster than at other points. Due to the heat preservation effect of the ground, the temperature of the test points which were above 50 mm from the bottom surface was maintained at 50–55 °C, as shown in Figure 6.
(a) (b) (c)
Figure 6. Temperature curves at the same depth. (a) 50 mm below the top surface; (b) 900 mm depth of foundation; (c) 50 mm above the bottom surface.
(3) Analysis of the variation in temperature at different depths along a vertical plane
Taking A, B, and C points as examples, the temperature data of points at different depths along a vertical plane were plotted as shown in Figure 7.
(a) (b) (c)
Figure 7. Temperature curves in the same plane position. (a) Position of A points; (b) Position of Bpoints; (c) Position of C points.
Appl. Sci. 2016, 6, 110 8 of 18
Along a vertical plane, the temperature of the measuring points was markedly different withdepth. Because of a good convection effect, the test points that were located on the surface had thelowest temperature. Due to the heat preservation effect, the temperature of the bottom surface washigher than at the top surface. The central concrete was in a typical scenario of heat of hydration inmass concrete; thus, the temperature here was the highest.
3.4.4. Comparative Analysis on the Temperature of Foundation at the Core and at the Surface
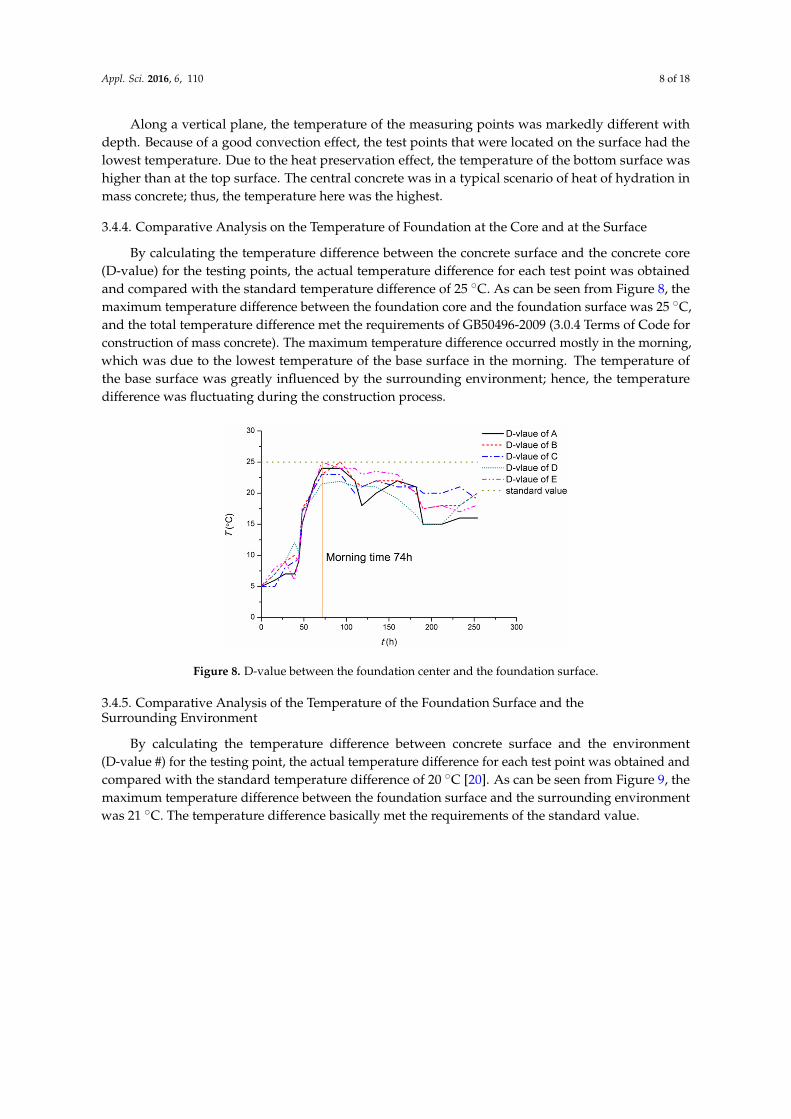
By calculating the temperature difference between the concrete surface and the concrete core(D-value) for the testing points, the actual temperature difference for each test point was obtainedand compared with the standard temperature difference of 25 ˝C. As can be seen from Figure 8, themaximum temperature difference between the foundation core and the foundation surface was 25 ˝C,and the total temperature difference met the requirements of GB50496-2009 (3.0.4 Terms of Code forconstruction of mass concrete). The maximum temperature difference occurred mostly in the morning,which was due to the lowest temperature of the base surface in the morning. The temperature ofthe base surface was greatly influenced by the surrounding environment; hence, the temperaturedifference was fluctuating during the construction process.
Appl. Sci. 2016, 6, 110 8 of 18
Figure 7. Temperature curves in the same plane position. (a) Position of A points; (b) Position of B points; (c) Position of C points.
Along a vertical plane, the temperature of the measuring points was markedly different with depth. Because of a good convection effect, the test points that were located on the surface had the lowest temperature. Due to the heat preservation effect, the temperature of the bottom surface was higher than at the top surface. The central concrete was in a typical scenario of heat of hydration in mass concrete; thus, the temperature here was the highest.
(4) Comparative analysis on the temperature of foundation at the core and at the surface
By calculating the temperature difference between the concrete surface and the concrete core (D-value) for the testing points, the actual temperature difference for each test point was obtained and compared with the standard temperature difference of 25 °C. As can be seen from Figure 8, the maximum temperature difference between the foundation core and the foundation surface was 25 °C, and the total temperature difference met the requirements of GB50496-2009 (3.0.4 Terms of Code for construction of mass concrete). The maximum temperature difference occurred mostly in the morning, which was due to the lowest temperature of the base surface in the morning. The temperature of the base surface was greatly influenced by the surrounding environment; hence, the temperature difference was fluctuating during the construction process.
Figure 8. D-value between the foundation center and the foundation surface.
(5) Comparative analysis of the temperature of the foundation surface and the surrounding environment
By calculating the temperature difference between concrete surface and the environment (D-value #) for the testing point, the actual temperature difference for each test point was obtained and compared with the standard temperature difference of 20 °C [20]. As can be seen from Figure 9, the maximum temperature difference between the foundation surface and the surrounding environment was 21 °C. The temperature difference basically met the requirements of the standard value.
Figure 8. D-value between the foundation center and the foundation surface.
3.4.5. Comparative Analysis of the Temperature of the Foundation Surface and theSurrounding Environment
By calculating the temperature difference between concrete surface and the environment(D-value #) for the testing point, the actual temperature difference for each test point was obtained andcompared with the standard temperature difference of 20 ˝C [20]. As can be seen from Figure 9, themaximum temperature difference between the foundation surface and the surrounding environmentwas 21 ˝C. The temperature difference basically met the requirements of the standard value.

Appl. Sci. 2016, 6, 110 9 of 18Appl. Sci. 2016, 6, 110 9 of 18
Figure 9. D-value between the concrete surface and the surrounding environment.
4. Theoretical Calculation and Analysis
4.1. Thermodynamic Principle
The concrete structure was assumed continuous and homogeneous. Considering an infinitesimal volume within the concrete structure, the net heat (calorie) inflows in the volume along the x, y and z directions are given as:
2
2( )x x dx
Tq q dydz dxdydz
xλ+
∂− =∂
(1)
2
2( )y y dy
Tq q dxdz dxdydz
yλ+
∂− =∂
(2)
2
2( )z z dz
Tq q dxdy dxdydz
zλ+
∂− =∂
(3)
Suppose that the heat produced per unit volume per unit time is Q. The heat emitted by an infinitesimal volume during a unit time is Qdxdydz . During the time dτ , the heat absorbed by the
infinitesimal volume is Tc d dxdydzρ τ
τ∂∂
.
Based on the thermal balance principle, the sum of the heat produced by the interior and the heat inflow is equal to the total absorbed heat as:
2 2 2
2 2 2
T T T TQ dxdydzd c d dxdydz
x y zλ τ ρ τ
τ ∂ ∂ ∂ ∂+ + + = ∂∂ ∂ ∂
(4)
Simplifying Equation (4),
2 2 2
2 2 2
T T T Q T
c cx y z
λρ ρ τ ∂ ∂ ∂ ∂+ + + = ∂∂ ∂ ∂
(5)
Due to the heat of hydration, the rate of temperature rise of concrete under adiabatic temperature condition is given as,
Q Wq
c c
θτ ρ ρ
∂ = =∂
(6)
Hence, Equation (5) could be revised as,
Figure 9. D-value between the concrete surface and the surrounding environment.
4. Theoretical Calculation and Analysis
4.1. Thermodynamic Principle
The concrete structure was assumed continuous and homogeneous. Considering an infinitesimalvolume within the concrete structure, the net heat (calorie) inflows in the volume along the x, y and zdirections are given as:
pqx ´ qx`dxdydzq “ λB2TBx2 dxdydz (1)
pqy ´ qy`dydxdzq “ λB2TBy2 dxdydz (2)
pqz ´ qz`dzdxdyq “ λB2TBz2 dxdydz (3)
Suppose that the heat produced per unit volume per unit time is Q. The heat emitted by aninfinitesimal volume during a unit time is Qdxdydz. During the time dτ, the heat absorbed by theinfinitesimal volume is cρ BT
Bτ dτ dxdydz.Based on the thermal balance principle, the sum of the heat produced by the interior and the heat
inflow is equal to the total absorbed heat as:
„
λ
ˆ
B2TBx2 `
B2TBy2 `
B2TBz2
˙
`Q
dxdydzdτ “ cρBTBτ
dτdxdydz (4)
Simplifying Equation (4),
λ
cρ
ˆ
B2TBx2 `
B2TBy2 `
B2TBz2
˙
`Qcρ“BTBτ
(5)
Due to the heat of hydration, the rate of temperature rise of concrete under adiabatic temperaturecondition is given as,
Bθ
Bτ“
Qcρ“
Wqcρ
(6)
Hence, Equation (5) could be revised as,
λ
cρ
ˆ
B2TBx2 `
B2TBy2 `
B2TBz2
˙
`Bθ
Bτ“BTBτ
(7)

Appl. Sci. 2016, 6, 110 10 of 18
In Equations (6) and (7), θ is the adiabatic temperature rise of concrete, W is the cement content ofconcrete (kg/m3), q is the heat source intensity (heat released by a unit volume of cement at a unittime), c is the specific heat of concrete, ρ is the density of concrete, λ is the thermal conductivity and Tis the transient temperature of concrete.
4.2. Calculation Parameters
According to the weight percentage of each component of concrete, the thermal conductivityλ and the specific heat capacity c of the concrete were estimated. The heat transfer coefficient andspecific heat capacity of different materials were obtained based on the literature [21], and were usedto calculate λ and c by using Equations (8) and (9). Finally, the thermal conductivity and specific heatof concrete were obtained by considering the adjustment coefficient:
λ “ p280ˆ 4.593` 774ˆ 11.099` 1026ˆ 10.467` 170ˆ 2.160q{2250 “ 9.33kJ{pm ¨ h ¨ ˝Cq (8)
c “ 1.05ˆ p280ˆ 0.536` 774ˆ 0.745` 1026ˆ 0.708` 170ˆ 4.187q{2250 “ 1.01kJ{pkg ¨ ˝Cq (9)
According to the concrete mix design, the concrete adiabatic temperature rise θ can be calculatedby Equation (10) as:
θ “QpW ` kFq
cρ“
375ˆ p280` 0.25ˆ 120q1.01ˆ 2401
“ 47.9 ˝C (10)
In Equation (10), ρ is taken as 2401 kg/m3; F is the amount of active admixture in concrete; Q isthe heat of hydration of cement taken as 375 kJ/kg [22]; k is the blending material reduction coefficient,taken as 0.25 for fly ash [22].
4.3. Finite Element Model
The simulation of the 3D temperature field for the entire process of heat of hydration in themass concrete foundation was performed by using the three-dimensional finite element softwareMIDAS/Civil (version 8.0.5). The factors such as the convection condition, the ambient temperature,and the boundary condition of the actual construction process were considered appropriately.
4.3.1. Parameter Definition
The main parameters included elastic modulus, specific heat, and thermal conductivity. As shownin Table 3, two material models were defined as the foundation and the ground (the strength grade ofconcrete is C35).
Table 3. Material properties.
Parameter Specific Heat ckJ{ pkg ¨ ˝Cq
Thermal Conductivityλ kJ{ pm ¨ h ¨ ˝Cq Poisson’s Ratio
Foundation 1.01 9.33 0.2Ground 0.84 7.12 0.2
4.3.2. Building Model
Since the foundation is rectangular, only one quarter was modeled and analyzed [23]. In order todescribe the heat transfer from the foundation to the ground, the ground was modeled as a structurewith a certain specific heat and heat conductivity. Eight-node brick elements were used. The model offoundation concrete was divided into 7670 nodes and 6372 elements. As shown in Figure 10, number1 represents 50 mm below the top surface, number 2 represents the foundation center 900 mm, andnumber 3 represents the 50 mm above the bottom surface of the foundation.

Appl. Sci. 2016, 6, 110 11 of 18
Appl. Sci. 2016, 6, 110 11 of 18
Figure 10, number 1 represents 50 mm below the top surface, number 2 represents the foundation center 900 mm, and number 3 represents the 50 mm above the bottom surface of the foundation.
Figure 10. Model of 1/4 foundation.
4.4. Defining Boundary Conditions
The numerical analysis considered the entire construction as a single process. The initial temperature (casting temperature) was set to 25 °C. The environmental temperature was defined as a constant with a value of 32.5 °C.
Two different convection coefficient functions were set considered for the convection conditions of the top surface and the lateral surface of the mass concrete foundation.
(1) Convective heat transfer coefficient function for the top surface
The convective heat transfer coefficient is defined as the heat transfer capability of an interface between a fluid and a solid surface. The unit of the convective heat transfer coefficient is
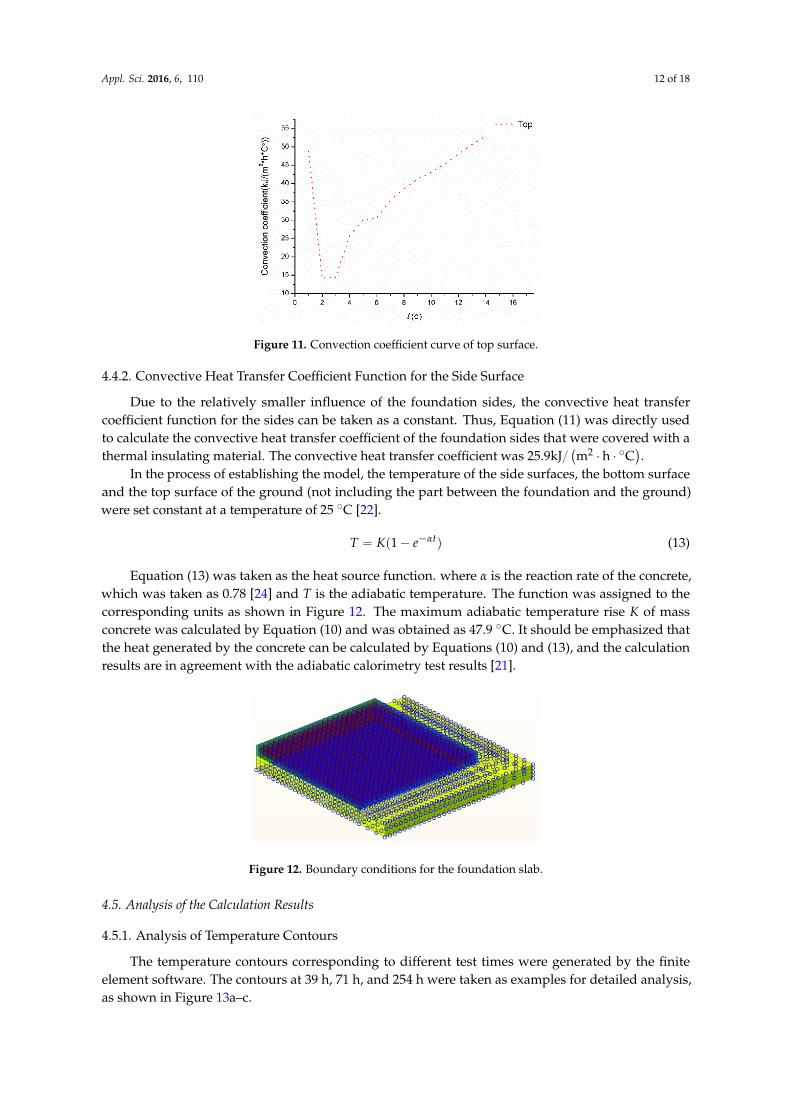
2/kJ m h• •( ℃) in this paper. In order to simplify the circulation process of water, a layer of water was considered as a thermal insulation layer. Based on the literature [22], if a concrete surface has a thermal insulation layer, the heat transfer coefficient of the thermal insulation layer can be considered same as the convective heat transfer coefficient. According to the time and depth of water circulation during the construction process, the convective heat transfer coefficient during the water storing process was calculated by using Equations (11) and (12) as shown below. At the same time, the corresponding enhancement coefficient [22] was considered according to the interval time. The convective heat transfer coefficient of the top surface of the foundation at each step was obtained through an interpolation. A curve was fitted as a function of the top surface temperature as shown in Figure 11.
=23.9 14.5β ν+ (11)
s
1 1
(1/ )+SRβ
β λ= =
i i(h / ) (12)
In Equation (11), ν is the wind speed of air. In Equation (12), sβ is the convective heat transfer coefficient of the top surface of the foundation; sR is the total thermal resistance of the circulating water layer; β is the convective heat transfer coefficient of the air layer and can be calculated by Equation (11); ih is the depth of circulating water; and iλ is the thermal conductivity of circulating water at different depths.
Figure 10. Model of 1/4 foundation.
4.4. Defining Boundary Conditions
The numerical analysis considered the entire construction as a single process. The initialtemperature (casting temperature) was set to 25 ˝C. The environmental temperature was defined as aconstant with a value of 32.5 ˝C.
Two different convection coefficient functions were set considered for the convection conditionsof the top surface and the lateral surface of the mass concrete foundation.
4.4.1. Convective Heat Transfer Coefficient Function for the Top Surface
The convective heat transfer coefficient is defined as the heat transfer capability of an interfacebetween a fluid and a solid surface. The unit of the convective heat transfer coefficient iskJ{
`
m2 ¨ h ¨ ˝C˘
in this paper. In order to simplify the circulation process of water, a layer of waterwas considered as a thermal insulation layer. Based on the literature [22], if a concrete surfacehas a thermal insulation layer, the heat transfer coefficient of the thermal insulation layer can beconsidered same as the convective heat transfer coefficient. According to the time and depth ofwater circulation during the construction process, the convective heat transfer coefficient during thewater storing process was calculated by using Equations (11) and (12) as shown below. At the sametime, the corresponding enhancement coefficient [22] was considered according to the interval time.The convective heat transfer coefficient of the top surface of the foundation at each step was obtainedthrough an interpolation. A curve was fitted as a function of the top surface temperature as shown inFigure 11.
β “ 23.9` 14.5ν (11)
βs “1
RS“
1p1{βq `
ř
phi{λiq(12)
In Equation (11), ν is the wind speed of air. In Equation (12), βs is the convective heat transfercoefficient of the top surface of the foundation; Rs is the total thermal resistance of the circulatingwater layer; β is the convective heat transfer coefficient of the air layer and can be calculated byEquation (11); hi is the depth of circulating water; and λi is the thermal conductivity of circulatingwater at different depths.
Appl. Sci. 2016, 6, 110 12 of 18Appl. Sci. 2016, 6, 110 12 of 18
Figure 11. Convection coefficient curve of top surface.
(2) Convective heat transfer coefficient function for the side surface
Due to the relatively smaller influence of the foundation sides, the convective heat transfer coefficient function for the sides can be taken as a constant. Thus, Equation (11) was directly used to calculate the convective heat transfer coefficient of the foundation sides that were covered with a thermal insulating material. The convective heat transfer coefficient was 225.9 /kJ m h• •( ℃).
In the process of establishing the model, the temperature of the side surfaces, the bottom surface and the top surface of the ground (not including the part between the foundation and the ground) were set constant at a temperature of 25 °C [22].
(1 )tT K e α−= − (13)
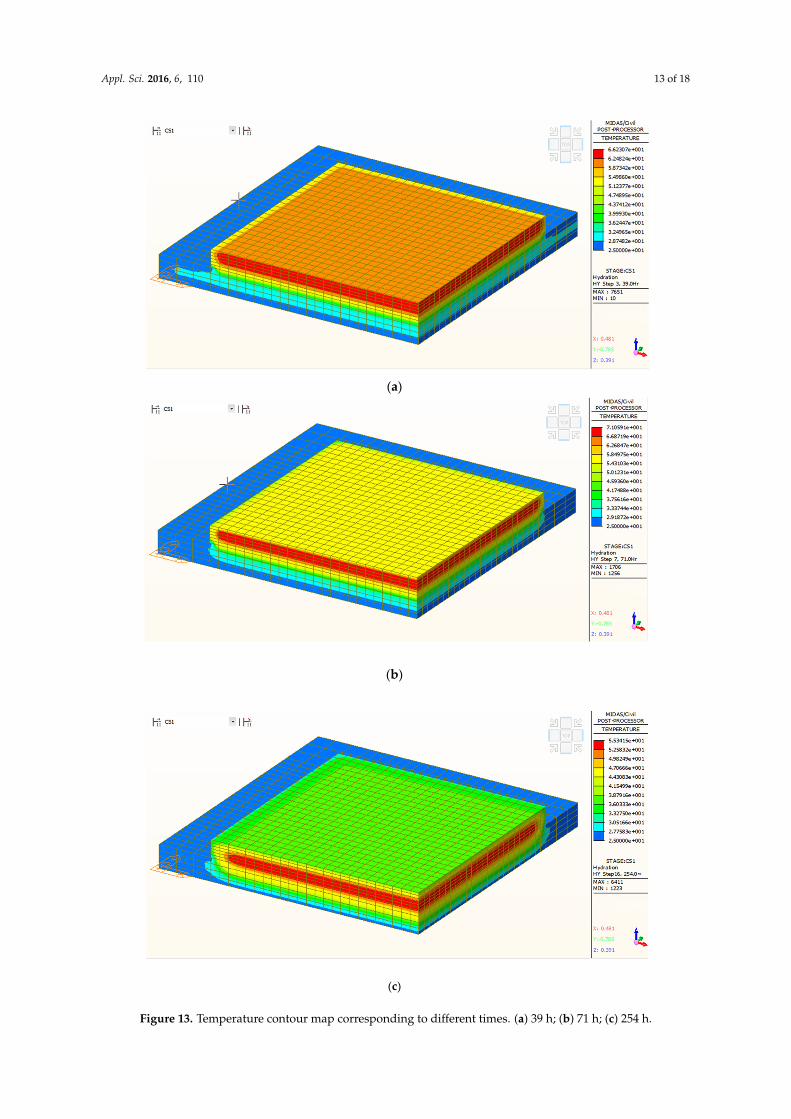
Equation (13) was taken as the heat source function. where α is the reaction rate of the concrete, which was taken as 0.78 [24] and T is the adiabatic temperature. The function was assigned to the corresponding units as shown in Figure 12. The maximum adiabatic temperature rise K of mass concrete was calculated by Equation (10) and was obtained as 47.9 °C. It should be emphasized that the heat generated by the concrete can be calculated by Equations (10) and (13), and the calculation results are in agreement with the adiabatic calorimetry test results [21].
Figure 12. Boundary conditions for the foundation slab.
4.5. Analysis of the Calculation Results
4.5.1. Analysis of Temperature Contours
The temperature contours corresponding to different test times were generated by the finite element software. The contours at 39 h, 71 h, and 254 h were taken as examples for detailed analysis, as shown in Figure 13a–c.
Figure 11. Convection coefficient curve of top surface.
4.4.2. Convective Heat Transfer Coefficient Function for the Side Surface
Due to the relatively smaller influence of the foundation sides, the convective heat transfercoefficient function for the sides can be taken as a constant. Thus, Equation (11) was directly usedto calculate the convective heat transfer coefficient of the foundation sides that were covered with athermal insulating material. The convective heat transfer coefficient was 25.9kJ{
`
m2 ¨ h ¨ ˝C˘
.In the process of establishing the model, the temperature of the side surfaces, the bottom surface
and the top surface of the ground (not including the part between the foundation and the ground)were set constant at a temperature of 25 ˝C [22].
T “ Kp1´ e´αtq (13)
Equation (13) was taken as the heat source function. where α is the reaction rate of the concrete,which was taken as 0.78 [24] and T is the adiabatic temperature. The function was assigned to thecorresponding units as shown in Figure 12. The maximum adiabatic temperature rise K of massconcrete was calculated by Equation (10) and was obtained as 47.9 ˝C. It should be emphasized thatthe heat generated by the concrete can be calculated by Equations (10) and (13), and the calculationresults are in agreement with the adiabatic calorimetry test results [21].
Appl. Sci. 2016, 6, 110 12 of 18
Figure 11. Convection coefficient curve of top surface.
(2) Convective heat transfer coefficient function for the side surface
Due to the relatively smaller influence of the foundation sides, the convective heat transfer coefficient function for the sides can be taken as a constant. Thus, Equation (11) was directly used to calculate the convective heat transfer coefficient of the foundation sides that were covered with a thermal insulating material. The convective heat transfer coefficient was 225.9 /kJ m h• •( ℃).
In the process of establishing the model, the temperature of the side surfaces, the bottom surface and the top surface of the ground (not including the part between the foundation and the ground) were set constant at a temperature of 25 °C [22].
(1 )tT K e α−= − (13)
Equation (13) was taken as the heat source function. where α is the reaction rate of the concrete, which was taken as 0.78 [24] and T is the adiabatic temperature. The function was assigned to the corresponding units as shown in Figure 12. The maximum adiabatic temperature rise K of mass concrete was calculated by Equation (10) and was obtained as 47.9 °C. It should be emphasized that the heat generated by the concrete can be calculated by Equations (10) and (13), and the calculation results are in agreement with the adiabatic calorimetry test results [21].
Figure 12. Boundary conditions for the foundation slab.
4.5. Analysis of the Calculation Results
4.5.1. Analysis of Temperature Contours
The temperature contours corresponding to different test times were generated by the finite element software. The contours at 39 h, 71 h, and 254 h were taken as examples for detailed analysis, as shown in Figure 13a–c.
Figure 12. Boundary conditions for the foundation slab.
4.5. Analysis of the Calculation Results
4.5.1. Analysis of Temperature Contours
The temperature contours corresponding to different test times were generated by the finiteelement software. The contours at 39 h, 71 h, and 254 h were taken as examples for detailed analysis,as shown in Figure 13a–c.
Appl. Sci. 2016, 6, 110 13 of 18
Appl. Sci. 2016, 6, 110 13 of 18
(a)
(b)
(c)
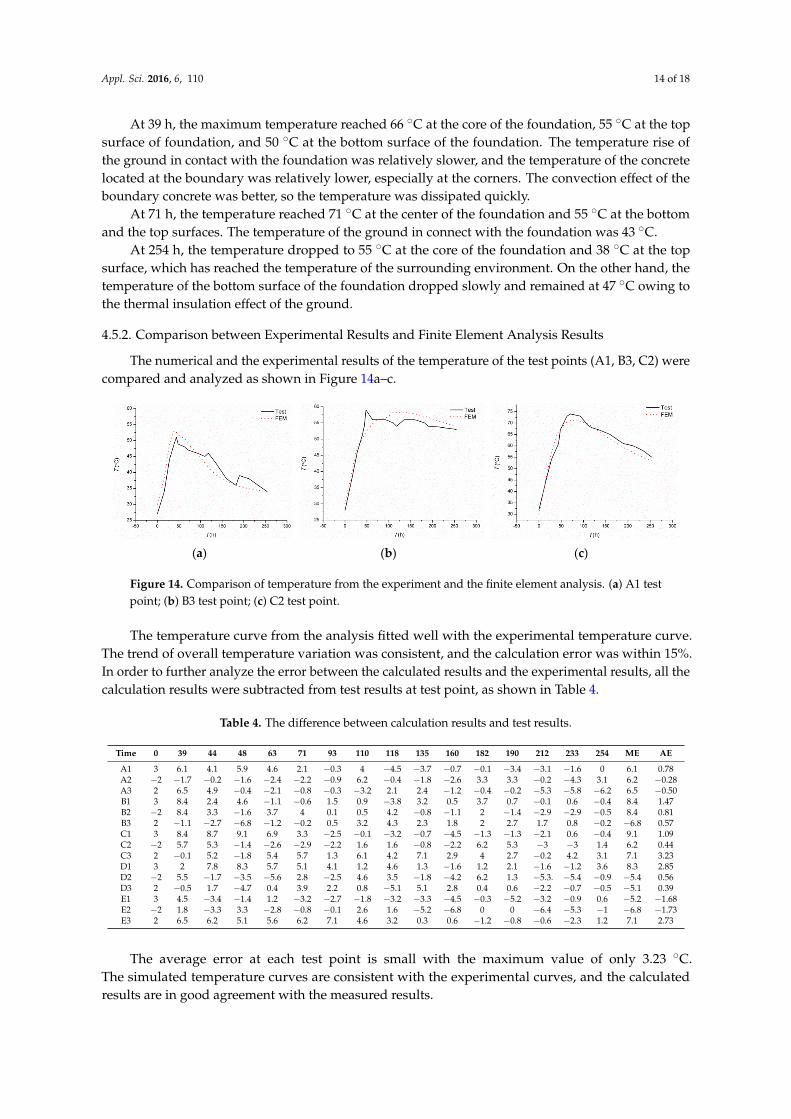
Figure 13. Temperature contour map corresponding to different times. (a) 39 h; (b) 71 h; (c) 254 h. Figure 13. Temperature contour map corresponding to different times. (a) 39 h; (b) 71 h; (c) 254 h.
Appl. Sci. 2016, 6, 110 14 of 18
At 39 h, the maximum temperature reached 66 ˝C at the core of the foundation, 55 ˝C at the topsurface of foundation, and 50 ˝C at the bottom surface of the foundation. The temperature rise ofthe ground in contact with the foundation was relatively slower, and the temperature of the concretelocated at the boundary was relatively lower, especially at the corners. The convection effect of theboundary concrete was better, so the temperature was dissipated quickly.
At 71 h, the temperature reached 71 ˝C at the center of the foundation and 55 ˝C at the bottomand the top surfaces. The temperature of the ground in connect with the foundation was 43 ˝C.
At 254 h, the temperature dropped to 55 ˝C at the core of the foundation and 38 ˝C at the topsurface, which has reached the temperature of the surrounding environment. On the other hand, thetemperature of the bottom surface of the foundation dropped slowly and remained at 47 ˝C owing tothe thermal insulation effect of the ground.
4.5.2. Comparison between Experimental Results and Finite Element Analysis Results
The numerical and the experimental results of the temperature of the test points (A1, B3, C2) werecompared and analyzed as shown in Figure 14a–c.
Appl. Sci. 2016, 6, 110 14 of 18
At 39 h, the maximum temperature reached 66 °C at the core of the foundation, 55 °C at the top surface of foundation, and 50 °C at the bottom surface of the foundation. The temperature rise of the ground in contact with the foundation was relatively slower, and the temperature of the concrete located at the boundary was relatively lower, especially at the corners. The convection effect of the boundary concrete was better, so the temperature was dissipated quickly.
At 71 h, the temperature reached 71 °C at the center of the foundation and 55 °C at the bottom and the top surfaces. The temperature of the ground in connect with the foundation was 43 °C.
At 254 h, the temperature dropped to 55 °C at the core of the foundation and 38 °C at the top surface, which has reached the temperature of the surrounding environment. On the other hand, the temperature of the bottom surface of the foundation dropped slowly and remained at 47 °C owing to the thermal insulation effect of the ground.
4.5.2. Comparison between Experimental Results and Finite Element Analysis Results
The numerical and the experimental results of the temperature of the test points (A1, B3, C2) were compared and analyzed as shown in Figure 14a–c.
(a) (b) (c)
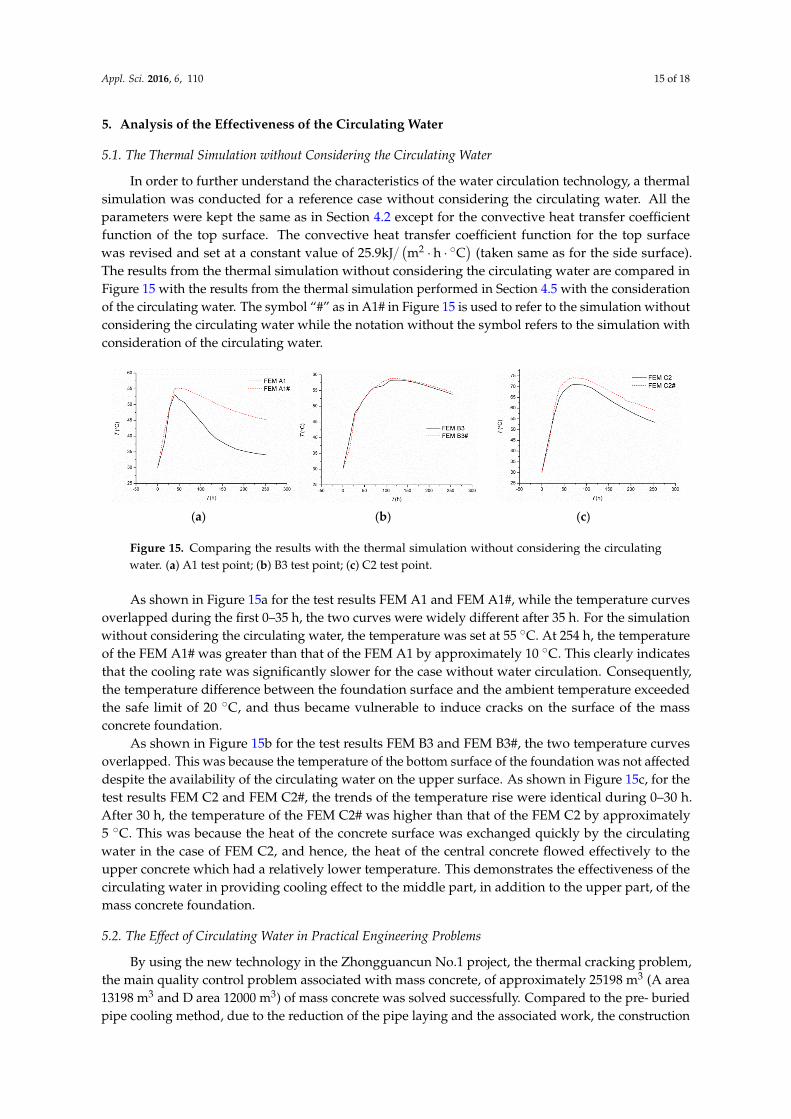
Figure 14. Comparison of temperature from the experiment and the finite element analysis. (a) A1 test point; (b) B3 test point; (c) C2 test point.
The temperature curve from the analysis fitted well with the experimental temperature curve. The trend of overall temperature variation was consistent, and the calculation error was within 15%. In order to further analyze the error between the calculated results and the experimental results, all the calculation results were subtracted from test results at test point, as shown in Table 4.
Table 4. The difference between calculation results and test results.
Time 0 39 44 48 63 71 93 110 118 135 160 182 190 212 233 254 ME AE
A1 3 6.1 4.1 5.9 4.6 2.1 −0.3 4 −4.5 −3.7 −0.7 −0.1 −3.4 −3.1 −1.6 0 6.1 0.78
A2 −2 −1.7 −0.2 −1.6 −2.4 −2.2 −0.9 6.2 −0.4 −1.8 −2.6 3.3 3.3 −0.2 −4.3 3.1 6.2 −0.28
A3 2 6.5 4.9 −0.4 −2.1 −0.8 −0.3 −3.2 2.1 2.4 −1.2 −0.4 −0.2 −5.3 −5.8 −6.2 6.5 −0.50
B1 3 8.4 2.4 4.6 −1.1 −0.6 1.5 0.9 −3.8 3.2 0.5 3.7 0.7 −0.1 0.6 −0.4 8.4 1.47
B2 −2 8.4 3.3 −1.6 3.7 4 0.1 0.5 4.2 −0.8 −1.1 2 −1.4 −2.9 −2.9 −0.5 8.4 0.81
B3 2 −1.1 −2.7 −6.8 −1.2 −0.2 0.5 3.2 4.3 2.3 1.8 2 2.7 1.7 0.8 −0.2 −6.8 0.57
C1 3 8.4 8.7 9.1 6.9 3.3 −2.5 −0.1 −3.2 −0.7 −4.5 −1.3 −1.3 −2.1 0.6 −0.4 9.1 1.09
C2 −2 5.7 5.3 −1.4 −2.6 −2.9 −2.2 1.6 1.6 −0.8 −2.2 6.2 5.3 −3 −3 1.4 6.2 0.44
C3 2 −0.1 5.2 −1.8 5.4 5.7 1.3 6.1 4.2 7.1 2.9 4 2.7 −0.2 4.2 3.1 7.1 3.23
D1 3 2 7.8 8.3 5.7 5.1 4.1 1.2 4.6 1.3 −1.6 1.2 2.1 −1.6 −1.2 3.6 8.3 2.85
D2 −2 5.5 −1.7 −3.5 −5.6 2.8 −2.5 4.6 3.5 −1.8 −4.2 6.2 1.3 −5.3. −5.4 −0.9 −5.4 0.56
D3 2 −0.5 1.7 −4.7 0.4 3.9 2.2 0.8 −5.1 5.1 2.8 0.4 0.6 −2.2 −0.7 −0.5 −5.1 0.39
E1 3 4.5 −3.4 −1.4 1.2 −3.2 −2.7 −1.8 −3.2 −3.3 −4.5 −0.3 −5.2 −3.2 −0.9 0.6 −5.2 −1.68
E2 −2 1.8 −3.3 3.3 −2.8 −0.8 −0.1 2.6 1.6 −5.2 −6.8 0 0 −6.4 −5.3 −1 −6.8 −1.73
E3 2 6.5 6.2 5.1 5.6 6.2 7.1 4.6 3.2 0.3 0.6 −1.2 −0.8 −0.6 −2.3 1.2 7.1 2.73
Figure 14. Comparison of temperature from the experiment and the finite element analysis. (a) A1 testpoint; (b) B3 test point; (c) C2 test point.
The temperature curve from the analysis fitted well with the experimental temperature curve.The trend of overall temperature variation was consistent, and the calculation error was within 15%.In order to further analyze the error between the calculated results and the experimental results, all thecalculation results were subtracted from test results at test point, as shown in Table 4.
Table 4. The difference between calculation results and test results.
Time 0 39 44 48 63 71 93 110 118 135 160 182 190 212 233 254 ME AE
A1 3 6.1 4.1 5.9 4.6 2.1 ´0.3 4 ´4.5 ´3.7 ´0.7 ´0.1 ´3.4 ´3.1 ´1.6 0 6.1 0.78A2 ´2 ´1.7 ´0.2 ´1.6 ´2.4 ´2.2 ´0.9 6.2 ´0.4 ´1.8 ´2.6 3.3 3.3 ´0.2 ´4.3 3.1 6.2 ´0.28A3 2 6.5 4.9 ´0.4 ´2.1 ´0.8 ´0.3 ´3.2 2.1 2.4 ´1.2 ´0.4 ´0.2 ´5.3 ´5.8 ´6.2 6.5 ´0.50B1 3 8.4 2.4 4.6 ´1.1 ´0.6 1.5 0.9 ´3.8 3.2 0.5 3.7 0.7 ´0.1 0.6 ´0.4 8.4 1.47B2 ´2 8.4 3.3 ´1.6 3.7 4 0.1 0.5 4.2 ´0.8 ´1.1 2 ´1.4 ´2.9 ´2.9 ´0.5 8.4 0.81B3 2 ´1.1 ´2.7 ´6.8 ´1.2 ´0.2 0.5 3.2 4.3 2.3 1.8 2 2.7 1.7 0.8 ´0.2 ´6.8 0.57C1 3 8.4 8.7 9.1 6.9 3.3 ´2.5 ´0.1 ´3.2 ´0.7 ´4.5 ´1.3 ´1.3 ´2.1 0.6 ´0.4 9.1 1.09C2 ´2 5.7 5.3 ´1.4 ´2.6 ´2.9 ´2.2 1.6 1.6 ´0.8 ´2.2 6.2 5.3 ´3 ´3 1.4 6.2 0.44C3 2 ´0.1 5.2 ´1.8 5.4 5.7 1.3 6.1 4.2 7.1 2.9 4 2.7 ´0.2 4.2 3.1 7.1 3.23D1 3 2 7.8 8.3 5.7 5.1 4.1 1.2 4.6 1.3 ´1.6 1.2 2.1 ´1.6 ´1.2 3.6 8.3 2.85D2 ´2 5.5 ´1.7 ´3.5 ´5.6 2.8 ´2.5 4.6 3.5 ´1.8 ´4.2 6.2 1.3 ´5.3. ´5.4 ´0.9 ´5.4 0.56D3 2 ´0.5 1.7 ´4.7 0.4 3.9 2.2 0.8 ´5.1 5.1 2.8 0.4 0.6 ´2.2 ´0.7 ´0.5 ´5.1 0.39E1 3 4.5 ´3.4 ´1.4 1.2 ´3.2 ´2.7 ´1.8 ´3.2 ´3.3 ´4.5 ´0.3 ´5.2 ´3.2 ´0.9 0.6 ´5.2 ´1.68E2 ´2 1.8 ´3.3 3.3 ´2.8 ´0.8 ´0.1 2.6 1.6 ´5.2 ´6.8 0 0 ´6.4 ´5.3 ´1 ´6.8 ´1.73E3 2 6.5 6.2 5.1 5.6 6.2 7.1 4.6 3.2 0.3 0.6 ´1.2 ´0.8 ´0.6 ´2.3 1.2 7.1 2.73
The average error at each test point is small with the maximum value of only 3.23 ˝C.The simulated temperature curves are consistent with the experimental curves, and the calculatedresults are in good agreement with the measured results.
Appl. Sci. 2016, 6, 110 15 of 18
5. Analysis of the Effectiveness of the Circulating Water
5.1. The Thermal Simulation without Considering the Circulating Water
In order to further understand the characteristics of the water circulation technology, a thermalsimulation was conducted for a reference case without considering the circulating water. All theparameters were kept the same as in Section 4.2 except for the convective heat transfer coefficientfunction of the top surface. The convective heat transfer coefficient function for the top surfacewas revised and set at a constant value of 25.9kJ{
`
m2 ¨ h ¨ ˝C˘
(taken same as for the side surface).The results from the thermal simulation without considering the circulating water are compared inFigure 15 with the results from the thermal simulation performed in Section 4.5 with the considerationof the circulating water. The symbol “#” as in A1# in Figure 15 is used to refer to the simulation withoutconsidering the circulating water while the notation without the symbol refers to the simulation withconsideration of the circulating water.
Appl. Sci. 2016, 6, 110 15 of 18
The average error at each test point is small with the maximum value of only 3.23 °C. The simulated temperature curves are consistent with the experimental curves, and the calculated results are in good agreement with the measured results.
5. Analysis of the Effectiveness of the Circulating Water
5.1. The Thermal Simulation without Considering the Circulating Water
In order to further understand the characteristics of the water circulation technology, a thermal simulation was conducted for a reference case without considering the circulating water. All the parameters were kept the same as in Section 4.2 except for the convective heat transfer coefficient function of the top surface. The convective heat transfer coefficient function for the top surface was revised and set at a constant value of 225.9 /kJ m h• •( ℃) (taken same as for the side surface). The results from the thermal simulation without considering the circulating water are compared in Figure 15 with the results from the thermal simulation performed in Section 4.5 with the consideration of the circulating water. The symbol “#” as in A1# in Figure 15 is used to refer to the simulation without considering the circulating water while the notation without the symbol refers to the simulation with consideration of the circulating water.
(a) (b) (c)
Figure 15. Comparing the results with the thermal simulation without considering the circulating water. (a) A1 test point; (b) B3 test point; (c) C2 test point.
As shown in Figure 15a for the test results FEM A1 and FEM A1#, while the temperature curves overlapped during the first 0–35 h, the two curves were widely different after 35 h. For the simulation without considering the circulating water, the temperature was set at 55 °C. At 254 h, the temperature of the FEM A1# was greater than that of the FEM A1 by approximately 10 °C. This clearly indicates that the cooling rate was significantly slower for the case without water circulation. Consequently, the temperature difference between the foundation surface and the ambient temperature exceeded the safe limit of 20 °C, and thus became vulnerable to induce cracks on the surface of the mass concrete foundation.
As shown in Figure 15b for the test results FEM B3 and FEM B3#, the two temperature curves overlapped. This was because the temperature of the bottom surface of the foundation was not affected despite the availability of the circulating water on the upper surface. As shown in Figure 15c, for the test results FEM C2 and FEM C2#, the trends of the temperature rise were identical during 0–30 h. After 30 h, the temperature of the FEM C2# was higher than that of the FEM C2 by approximately 5 °C. This was because the heat of the concrete surface was exchanged quickly by the circulating water in the case of FEM C2, and hence, the heat of the central concrete flowed effectively to the upper concrete which had a relatively lower temperature. This demonstrates the effectiveness of the circulating water in providing cooling effect to the middle part, in addition to the upper part, of the mass concrete foundation.
5.2. The Effect of Circulating Water in Practical Engineering Problems
By using the new technology in the Zhongguancun No.1 project, the thermal cracking problem, the main quality control problem associated with mass concrete, of approximately 25198 m3 (A area
Figure 15. Comparing the results with the thermal simulation without considering the circulatingwater. (a) A1 test point; (b) B3 test point; (c) C2 test point.
As shown in Figure 15a for the test results FEM A1 and FEM A1#, while the temperature curvesoverlapped during the first 0–35 h, the two curves were widely different after 35 h. For the simulationwithout considering the circulating water, the temperature was set at 55 ˝C. At 254 h, the temperatureof the FEM A1# was greater than that of the FEM A1 by approximately 10 ˝C. This clearly indicatesthat the cooling rate was significantly slower for the case without water circulation. Consequently,the temperature difference between the foundation surface and the ambient temperature exceededthe safe limit of 20 ˝C, and thus became vulnerable to induce cracks on the surface of the massconcrete foundation.
As shown in Figure 15b for the test results FEM B3 and FEM B3#, the two temperature curvesoverlapped. This was because the temperature of the bottom surface of the foundation was not affecteddespite the availability of the circulating water on the upper surface. As shown in Figure 15c, for thetest results FEM C2 and FEM C2#, the trends of the temperature rise were identical during 0–30 h.After 30 h, the temperature of the FEM C2# was higher than that of the FEM C2 by approximately5 ˝C. This was because the heat of the concrete surface was exchanged quickly by the circulatingwater in the case of FEM C2, and hence, the heat of the central concrete flowed effectively to theupper concrete which had a relatively lower temperature. This demonstrates the effectiveness of thecirculating water in providing cooling effect to the middle part, in addition to the upper part, of themass concrete foundation.
5.2. The Effect of Circulating Water in Practical Engineering Problems
By using the new technology in the Zhongguancun No.1 project, the thermal cracking problem,the main quality control problem associated with mass concrete, of approximately 25198 m3 (A area13198 m3 and D area 12000 m3) of mass concrete was solved successfully. Compared to the pre- buriedpipe cooling method, due to the reduction of the pipe laying and the associated work, the construction
Appl. Sci. 2016, 6, 110 16 of 18
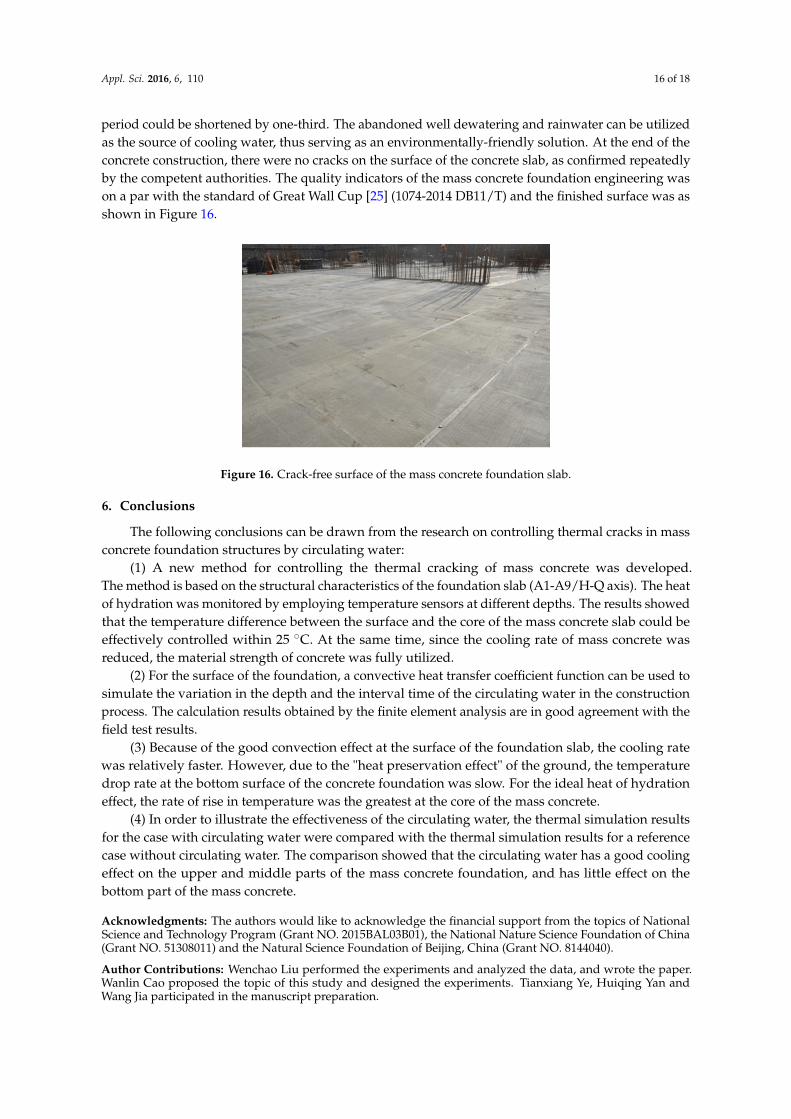
period could be shortened by one-third. The abandoned well dewatering and rainwater can be utilizedas the source of cooling water, thus serving as an environmentally-friendly solution. At the end of theconcrete construction, there were no cracks on the surface of the concrete slab, as confirmed repeatedlyby the competent authorities. The quality indicators of the mass concrete foundation engineering wason a par with the standard of Great Wall Cup [25] (1074-2014 DB11/T) and the finished surface was asshown in Figure 16.
Appl. Sci. 2016, 6, 110 16 of 18
13198 m3 and D area 12000 m3) of mass concrete was solved successfully. Compared to the pre- buried pipe cooling method, due to the reduction of the pipe laying and the associated work, the construction period could be shortened by one-third. The abandoned well dewatering and rainwater can be utilized as the source of cooling water, thus serving as an environmentally-friendly solution. At the end of the concrete construction, there were no cracks on the surface of the concrete slab, as confirmed repeatedly by the competent authorities. The quality indicators of the mass concrete foundation engineering was on a par with the standard of Great Wall Cup [25] (1074-2014 DB11/T) and the finished surface was as shown in Figure 16.
Figure 16. Crack-free surface of the mass concrete foundation slab.
6. Conclusions
The following conclusions can be drawn from the research on controlling thermal cracks in mass concrete foundation structures by circulating water:
(1) A new method for controlling the thermal cracking of mass concrete was developed. The method is based on the structural characteristics of the foundation slab (A1-A9/H-Q axis). The heat of hydration was monitored by employing temperature sensors at different depths. The results showed that the temperature difference between the surface and the core of the mass concrete slab could be effectively controlled within 25 °C. At the same time, since the cooling rate of mass concrete was reduced, the material strength of concrete was fully utilized.
(2) For the surface of the foundation, a convective heat transfer coefficient function can be used to simulate the variation in the depth and the interval time of the circulating water in the construction process. The calculation results obtained by the finite element analysis are in good agreement with the field test results.
(3) Because of the good convection effect at the surface of the foundation slab, the cooling rate was relatively faster. However, due to the "heat preservation effect" of the ground, the temperature drop rate at the bottom surface of the concrete foundation was slow. For the ideal heat of hydration effect, the rate of rise in temperature was the greatest at the core of the mass concrete.
(4) In order to illustrate the effectiveness of the circulating water, the thermal simulation results for the case with circulating water were compared with the thermal simulation results for a reference case without circulating water. The comparison showed that the circulating water has a good cooling effect on the upper and middle parts of the mass concrete foundation, and has little effect on the bottom part of the mass concrete.
Acknowledgments: The authors would like to acknowledge the financial support from the topics of National Science and Technology Program (Grant NO. 2015BAL03B01), the National Nature Science Foundation of China (Grant NO.51308011) and the Natural Science Foundation of Beijing, China (Grant NO. 8144040).
Author Contributions: Wenchao Liu performed the experiments and analyzed the data, and wrote the paper. Wanlin Cao proposed the topic of this study and designed the experiments. Tianxiang Ye, Huiqing Yan and Wang Jia participated in the manuscript preparation.
Figure 16. Crack-free surface of the mass concrete foundation slab.
6. Conclusions
The following conclusions can be drawn from the research on controlling thermal cracks in massconcrete foundation structures by circulating water:
(1) A new method for controlling the thermal cracking of mass concrete was developed.The method is based on the structural characteristics of the foundation slab (A1-A9/H-Q axis). The heatof hydration was monitored by employing temperature sensors at different depths. The results showedthat the temperature difference between the surface and the core of the mass concrete slab could beeffectively controlled within 25 ˝C. At the same time, since the cooling rate of mass concrete wasreduced, the material strength of concrete was fully utilized.
(2) For the surface of the foundation, a convective heat transfer coefficient function can be used tosimulate the variation in the depth and the interval time of the circulating water in the constructionprocess. The calculation results obtained by the finite element analysis are in good agreement with thefield test results.
(3) Because of the good convection effect at the surface of the foundation slab, the cooling ratewas relatively faster. However, due to the "heat preservation effect" of the ground, the temperaturedrop rate at the bottom surface of the concrete foundation was slow. For the ideal heat of hydrationeffect, the rate of rise in temperature was the greatest at the core of the mass concrete.
(4) In order to illustrate the effectiveness of the circulating water, the thermal simulation resultsfor the case with circulating water were compared with the thermal simulation results for a referencecase without circulating water. The comparison showed that the circulating water has a good coolingeffect on the upper and middle parts of the mass concrete foundation, and has little effect on thebottom part of the mass concrete.
Acknowledgments: The authors would like to acknowledge the financial support from the topics of NationalScience and Technology Program (Grant NO. 2015BAL03B01), the National Nature Science Foundation of China(Grant NO. 51308011) and the Natural Science Foundation of Beijing, China (Grant NO. 8144040).
Author Contributions: Wenchao Liu performed the experiments and analyzed the data, and wrote the paper.Wanlin Cao proposed the topic of this study and designed the experiments. Tianxiang Ye, Huiqing Yan andWang Jia participated in the manuscript preparation.
Appl. Sci. 2016, 6, 110 17 of 18
Conflicts of Interest: The authors declare that there is no conflict of interests regarding the publication ofthis paper.
Abbreviations
The following abbreviations are used in this manuscript:
PCM Phase change materialD-vaule The temperature difference between concrete surface and concrete centerD-vaule # The temperature difference between concrete surface and the environmentME Maximum errorAE Average error
References
1. Code for Design of Building Foundation; GB 50007–2011; Standard Press of China: Beijing, China, 2011.2. Bobko, C.R.; Zadeh, V.Z.; Seracino, R. Improved Schmidt Method for Predicting Temperature Development
in Mass Concrete. ACI Mater. J. 2015, 112, 579–586. [CrossRef]3. Da Silva, W.R.L.; Smilauer, V.; Stemberk, P. Upscaling semi-adiabatic measurements for simulating
temperature evolution of mass concrete structures. Mater. Struct. 2015, 48, 1031–1041. [CrossRef]4. Lee, M.H.; Khil, B.S.; Yun, H.D. Influence of cement type on heat of hydration and temperature rise of the
mass concrete. Indian J. Eng. Mater. Sci. 2014, 21, 536–524.5. Schindler, A.K.; Keith, K.P. Behavior of high-volume fly ash concrete in mass concrete applications.
In Proceedings of the 1st International Conference on Construction Materials and Structures, Johannesburg,South Africa, 24–26 November 2014; pp. 268–275.
6. Lee, M.H.; Chae, Y.S.; Khil, B.S. Influence of Casting Temperature on the Heat of Hydration in Mass ConcreteFoundation with Ternary Cements. In Proceedings of the 2nd International Conference on SustainableEnergy and Environmental Engineering (ICSEEE), Shenzhen, China, 28–29 December 2013; pp. 478–481.
7. Heap, M.J.; Lavallée, Y.; Laumann, A. The influence of thermal-stressing (up to 1000 ˝C) on the physical,mechanical, and chemical properties of siliceous-aggregate, high-strength concrete. Constr. Build. Mater.2013, 42, 248–265. [CrossRef]
8. Conceicao, J.; Faria, R.; Azenha, M. Early-age behaviour of the concrete surrounding a turbine spiral case:Monitoring and thermo-mechanical modelling. Eng. Sturct. 2014, 81, 327–340. [CrossRef]
9. Nagy, A. Thermally induced softening and cracking in concrete with minimal reinforcement. Mater. Struct.1997, 30, 527–532. [CrossRef]
10. Seo, T.-S.; Kim, S.-S.; Lim, C.-K. Experimental Study on Hydration Heat Control of Mass Concrete by VerticalPipe Cooling Method. J. Asian Archit. Build. Eng. 2015, 14, 657–662. [CrossRef]
11. Zhu, J.; Zhang, Y.B.; Du, X.F. Study on Mass Concrete Construction Technology of Raft Foundation in YantaiOcean Development Center. In Proceedings of the 4th International Conference on Structures and BuildingMaterials (ICSBM), Guangzhou, China, 28–29 March 2014; pp. 1421–1425.
12. Hou, Y.N. On the control and measures to deal with crack in mass concrete. Master’s Theses, ShandongUniversity, Shandong, China, April 2007. (In Chinese)
13. Qian, C.X.; Gao, G.B.; He, Z.H. Feasibility Research of Using Phase Change Materials to Reduce the InnerTemperature Rise of Mass Concrete. J. WuHan Univ. Technol.-Mater. Sci. Ed. 2015, 30, 989–994. [CrossRef]
14. Kim, Y.-R.; Khil, B.-S.; Jang, S.-J. Effect of barium-based phase change material (PCM) to control the heat ofhydration on the mechanical properties of mass concrete. Thermochim. Acta 2015, 613, 100–107. [CrossRef]
15. Choi, W.-C.; Khil, B.-S.; Chae, Y.-S. Feasibility of Using Phase Change Materials to Control the Heat ofHydration in Massive Concrete Structures. Sci. World J. 2014, 2014. [CrossRef] [PubMed]
16. Ye, T.X.; Yan, H.Q.; Sun, M.H. Patent Search and Analysis of SIPO, A system for controlling cracksof mass concrete foundation by circulating water, China, ZL201420816500.8. Available online:http://www.pss-system.gov.cn/sipopublicsearch/search/searchHomeIndex.shtml (accessed on 17 June2015). (In Chinese)
Appl. Sci. 2016, 6, 110 18 of 18
17. Sun, M.H.; Jia, W.; Cao, W.L. Patent Search and Analysis of SIPO, A cooling tank forcontrolling cracks of mass concrete by circulating water, China ZL201420816495.0. Available online:http://www.pss-system.gov.cn/sipopublicsearch/search/searchHomeIndex.shtml (accessed on 17 June2015). (In Chinese)
18. Ye, T.X.; Yan, H.Q.; Sun, M.H. Patent Search and Analysis of SIPO, A cooling system forcontrolling cracks of mass concrete by circulating water, China, ZL201420816497.X. Available online:http://www.pss-system.gov.cn/sipopublicsearch/search/searchHomeIndex.shtml (accessed on 17 June2015). (In Chinese)
19. Gong, J.; Li, H.W. Crack Control of Mass Concrete Construction. Constr. Technol. 2012, 41, 28–32. (In Chinese)20. Code for Construction of Mass Concrete; GB50496–2009; Standard Press of China: Beijing, China, 2009.21. Zhu, B.F. Temperature Stress and Temperature Control of Mass Concrete; China Electric Power Pres: Beijing,
China, 1999.22. Ge, J.Y. Guide for Use of Midas Civil Bridge Engineering Software; People's Communications Press: Beijing,
China, 2013.23. Lu, E.X. Analysis and controlling of hydration hear temperature in mass concrete pile cap. Master’s Theses,
Hunan University, Hunan, China, 2007. (In Chinese)24. Ma, K.S.; Tang, J.X. 3D finite element analysis of the transient temperature field of mass concrete. Henan Build.
Mater. 2001, 3, 36–37. (In Chinese)25. The Specification of Building structure-Quality Evaluation for the Great Wall Cup; 1074–2014 DB11/T; Standards
Press of Beijing: Beijing, China, 2014.
© 2016 by the authors; licensee MDPI, Basel, Switzerland. This article is an open accessarticle distributed under the terms and conditions of the Creative Commons Attribution(CC-BY) license (http://creativecommons.org/licenses/by/4.0/).