Embed Size (px)
Citation preview

Research ArticleExperimental and Numerical Investigations of Pressure Field ofCurved Shell Structure Subjected to Interior Blast
Jialu Ma 1 Feng Fan2 Lingxin Zhang1 Chengqing Wu3 and Xudong Zhi 2
1Institute of Engineering Mechanics China Earthquake Administration Harbin 150080 China2School of Civil Engineering Harbin Institute of Technology Harbin 150090 China3School of Civil and Environmental Engineering University of Technology Sydney Ultimo NSW 2007 Australia
Correspondence should be addressed to Xudong Zhi zhixudonghiteducn
Received 25 April 2019 Revised 9 July 2019 Accepted 22 July 2019 Published 21 August 2019
Academic Editor Stefano Manzoni
Copyright copy 2019 JialuMa et alis is an open access article distributed under the Creative Commons Attribution License whichpermits unrestricted use distribution and reproduction in any medium provided the original work is properly cited
A terrorist attack on a long-span spatial structure would cause horrible results erefore it is important to determine thecharacteristics of blast pressure fields to protect such structures In this study fully confined blast loading tests were conductedusing a rigid curved shell model which had an inner space similar to that of a reticulated dome Four different scenarios werecarried out to record the blast loading on five typical positions e blast pressure-time data were compared and analyzed Inaddition a suitable numerical simulation method was proposed for the issues involved in interior blast loading is numericalmodel was verified by comparing with the test data A parametrical analysis of the interior blast simulations was conducted basedon this numerical method e blast loading values at specific positions were obtained with the key parameters varied within areasonable scope e blast loading from blast tests and simulations were presented On this basis the interior blast loading couldconveniently be predicted by using the method and data in this paper which could be used in the protective design of otherreticulated domes
1 Introduction
Long-span spatial structures with graceful configurations arealways considered to be city landmarks A terrorist attack onsuch a structure would not only cause a huge economic lossbut would also cause many injuries erefore it is im-portant to consider blast protective measures during thestructural design period
Over the last century numerous studies have beenperformed on blast loadingeUS army presented themostauthoritative guideline (UFC 3-340-02) [1] which wasimproved based on TM5-1300 It includes many blast issueswith multiple situations regarding different structural typesand shapes e UFC guideline systemically presents figuresand tables that can be used for predicting the blast loading insome typical situations However the UFC guideline lacksinformation about special cases which should be studiedwith extra specialized research using blast tests and nu-merical simulations Wu and Hao conducted a series of blasttests with different explosive parameters [2ndash5] Yang et al
and Bao et al used many detailed features to compare thedifference between TNT explosives and combustible gas[6 7] e blast propagation and reflection in a complicatedcommunity was simulated with LS-DYNA by Li and Shi[8ndash11] Some studies relating to long-span spatial structureswere also conducted by Gao andWang using fluid-structureinteraction (FSI) methods [12] e exterior blast loadingand failure of reticulated domes were studied by Xudonget al and Zhi et al [13 14] Ma et al had investigated theblast distribution numerically [15 16] and the failure modesand failure mechanisms were developed [17 18] Howeverthe blast loading on a long-span spatial structure is not clearand verified in the existing references which is important forthe protective design of structures
In this study single-layer reticulated domes which arethe most common type of long-span spatial structures weretaken as examples to investigate the pressure field distri-butions when subjected to an interior blast A series of blasttests to examine the pressure distribution in a curved shellwere designed and performed e blast loading values on
HindawiShock and VibrationVolume 2019 Article ID 9674274 16 pageshttpsdoiorg10115520199674274
five points which represented the typical positions of thereticulated domes were recorded with different TNTequivalences In addition suitable finite element (FE)models were set up Blast tests that included the detonationpropagation and reflection were simulated and verified bycomparing the results to the recorded test data for thecorresponding positions Based on the numerical models aparameter analysis was conducted to calculate the blastloading values of some standard cases which could con-veniently be used to estimate the blast loading values atspecific positions for similar domes subjected to an interiorblast
2 Setup of Blast Tests
To investigate the interior blast loading of the reticulateddomes a series of blast tests were conducted According theconclusions in reference [15] the blast loading obtainedfrom the rigid model could be used when investigating theblast issues related to the large-scaled distances involved inlong-span spatial structures us a fully confined curvedsteel shell model was used to simulate the inside environ-ment of a reticulated dome and some pressure gauges wereplaced on the model to record the pressure-time history dataat five typical positions
An almost rigid steel shell with a 1m span was designedas shown in Figure 1 e steel model had a thickness of003m and its rise-span ratio was 15 In addition thesubstructure wall was also considered in the rigid shellmodele total height of the curved shell model was 057mwhich included a 02m roof rise and a 037m support wall asshown in Figure 2 TNT explosives were detonated in thecenter of the model at ground level during the tests PCBpressure gauges (PCB102B04 and PCB102B06) were usedwhich had maximum measurement ranges of 3450 kPa and6900 kPa respectively In addition the model had five holesfor installing the pressure gauges e P-3 gauge was in-stalled in the middle with the other gauges installed sym-metrically ese were used to compare and verify therecords for the quartile and corner positions e ignitiondevice (WY2) and monitor (DH5927) were used to detonatethe explosive and record the pressure data respectively
e curved shell model was composed of three partsincluding the top rigid shell basement plate and connectionsystem as shown in Figure 3 During the tests the model wasnearly airtight because of the weight of the top shell Inaddition the 28 high-strength bolts in the connection systemcould sustain no less than approximately 504MPa of dy-namic action With the goal of maintaining the original blastloading distribution the inside surface of the top model waspolished and painted before the tests e TNT and ex-ploders were placed at the center of the basement plate todetonate during the experiments Moreover a replaceable10mm thick steel sheet was located under the explosives tokeep the connected surface flat before each test
e weights of the TNT explosives from the laboratorywere 200 g and 400 g which had to be cut to a suitable weightfor each test It was difficult to reshape the TNT into ahemispherical shape erefore a TNT cube was used
instead After the TNT and exploder were prepared andplaced all of the gauges were checked and calibrated beforethe testse exploder was electrically detonated by theWY2ignition device which could also trigger the monitoringsystem at the same time e final preparation of thepressure measurement tests is shown in Figure 4
3 Blast Loading Data from Tests
For the blast tests the scaled distance is defined in thefollowing equation [19]
Figure 1 Design model of curved shell structure
R725 200
370
1000
88deg
22deg
Figure 2 Model dimensions and gauge positions (units mm)
Figure 3 Test model components
2 Shock and Vibration
Z R
W13(1)
where R is the stand-off distance andW is the TNTexplosiveequivalent
Within the scope of an interior blast occurring in a spatialstructure it is difficult for a person to carry a large equivalenceof explosives past security checks erefore the pressuremeasurement tests only focused on large-scaled distancecases which involved values larger than 2mkg13 in thiswork us a series of blast tests were conducted with fourscenarios and different TNT equivalences 8 g 13 g 18 g and23 g It should be noted that the exploder was also consideredto be 3 g of TNT in the total equivalences listed in Table 1
During the tests there were no obviously differentphenomena observed from outside of the model with theexception of the volume values for the explosion sounds Inaddition it is known that blast actions vanish in very shortperiods e relatively long-period quasistatic gas pressureswere quite different from the shock waves as shown inFigure 5 Even within the real situations of spatial structuresthe gas would gradually be vented from the doors andwindows erefore the shock period was more meaningfulin this research During the blast recording time of the teststhere was almost no visible smoke leakage which showedthat the model was airtight during the blast monitoringperiod is meant the shock pressure data could be treatedas an ideal fully confined blast process without leakageHowever it was still difficult to watch the phenomena of theshock waves propagating inside the rigid shell model eevolution of the blast loading could generally be deducedfrom the data recorded by the five pressure gauges In thefollowing subsections the test data are analyzed and com-pared by scenario
31 Scenario T1 In scenario T1 the total TNT equivalenceincluding the exploder was 8 g e scaled distance was2850mkg13 which resulted in a relatively small blast loade test data are plotted in Figure 6 With the exception ofP3 the pressure measurements were all less than 300 kPae first peak overpressure was 24152 kPa from P5 emaximum overpressure was approximately 12MPa from P3at the apex of the model which was mainly caused by themultiple reflections of the shock waves
e evolution of the pressure fields inside the curvedshell model could generally be deduced from the gauge datae pressure time history curve of P3 (Figure 6(e)) showsthat the shock wave first reached and crashed against the topsurface of the model after the detonation en the reflected
waves went downward and impacted the basement plane ofthe model e secondary reflected waves turned aroundquickly and hit the top surface again is might be one ofthe reasons that the tremendous shock was detected at P3the other reasons will be explained in Section 41
e data from the other gauges (Figure 6) illustrated thatthe shock waves reflected over and over inside the curvedshell modele peak values of the subsequent peaks at thesefour gauges were basically on the same level as the first peakoverpressures When some reflected waves converged to-gether much larger reflected waves were formed during thetests which were less than 300 kPa is means for thesecentral blast scenarios that the middle span of a reticulateddome could easily suffer from much more severe blast ac-tions than those at the other positions on the roof
Moreover it should be noted that the gauges were pair-arranged symmetrically except for P3 on the apex of themodel However the data from the corresponding positionswere not absolutely identical e main reasons are as fol-lows On one hand the placements of the TNTcharges werenot on the ideal central spot of themodel On the other handit was impossible to record the same data using differentsensors as if recording the same input with a high-frequencysignal ere were also complicated blast wave fields withmany sensitive factors
32 ScenarioT2 ree tests were conducted for scenario T2However because of spoilage during the TNT cuttingprocess one of the TNT charges was 1 g smaller than theothers erefore its results were not compared with thoseof the other two tests which are presented separately in thefollowing subsection
Figure 7 shows the overpressure data of the first twogroups for scenario T2 with 10 g of TNTeir general trendsare similar but there are some small differences in the details
Figure 4 Test model for interior blast loading
Table 1 Scheme of blast test of curved shell structure
Scenario TNT(g)
TNTequivalences
(g)
Repeattimes
Scaled distance(mkg13)
T1 5 8 1 2850T2 10 13 3 2424T3 15 18 1 2175T4 20 23 4 2004
t
Pg
P
Figure 5 Gas pressure of confined blast loading (from UFC)
Shock and Vibration 3
A comparison shows that the overpressure values fromscenario T2 are evidently larger than those from scenario T1e overpressure curves could be used to deduce that thepropagation process of the blast field was similar to that forscenario T1 Because strong collisions of the shock wavesoccurred during the tests some relatively large peaks wereformed e maximum overpressure was almost 3MPa from
P3 For the first overpressure peaks P1 had the maximumvalue of 7599 kPa as shown in Figure 7(a)
In addition the test data with 12 g of TNTare plotted inFigure 8 which shows that the overpressure values areobviously smaller than the data for the other two groupsemaximum value decreased to 15MPa at P3 with that at P1reduced to 05MPa In addition with the TNT equivalences
200
150
100
50
0
ndash50
Ove
rpre
ssur
e (kP
a)
80 2 4Time (ms)
6
T1-1-P1
(a)
400
300
200
100
0
Ove
rpre
ssur
e (kP
a)
80 2 4Time (ms)
6
T1-1-P5
(b)
300
200
100
0
Ove
rpre
ssur
e (kP
a)
80 2 4Time (ms)
6
T1-1-P2
(c)
300
200
100
0
Ove
rpre
ssur
e (kP
a)
80 2 4Time (ms)
6
T1-1-P4
(d)
1200
800
400
0
Ove
rpre
ssur
e (kP
a)
80 2 4Time (ms)
6
T1-1-P3
(e)
Figure 6 Experiment data from scenario T1 (8 g) (a) Test data from P1 (b) Test data from P5 (c) Test data from P2 (d) Test data from P4(e) Test data from P3
4 Shock and Vibration
1000
800
600
400
200
0
Ove
rpre
ssur
e (kP
a)
0 10864Time (ms)
2
T2-1-P1T2-2-P1
(a)
800
600
400
200
0
Ove
rpre
ssur
e (kP
a)
0 10864Time (ms)
2
T2-1-P5T2-2-P5
(b)
800
600
400
200
0
Ove
rpre
ssur
e (kP
a)
0 10864Time (ms)
2
T2-1-P1T2-2-P1
(c)
600
400
200
0
Ove
rpre
ssur
e (kP
a)
0 10864Time (ms)
2
T2-1-P4T2-2-P4
(d)
3000
2000
1000
0
Ove
rpre
ssur
e (kP
a)
0 10864Time (ms)
2
T2-1-P3T2-2-P3
(e)
Figure 7 Experiment data from scenario T2 (13 g TNT) (a) Test data from P1 (b) Test data from P5 (c) Test data from P2 (d) Test datafrom P4 (e) Test data from P3
Shock and Vibration 5
600O
verp
ress
ure (
kPa) 400
200
0
0 2 4 6 8 10
T2-3-P1
Time (ms)
(a)
800
Ove
rpre
ssur
e (kP
a)
400
600
200
0
0 2 4 6 8 10
T2-3-P5
Time (ms)
(b)
500
Ove
rpre
ssur
e (kP
a)
250
0
0 2 4 6 8 10
T2-3-P2
Time (ms)
(c)
500
Ove
rpre
ssur
e (kP
a)
250
0
0 2 4 6 8 10
T2-3-P4
Time (ms)
(d)
1800
Ove
rpre
ssur
e (kP
a) 1200
600
0
0 2 4 6 8 10
T2-3-P3
Time (ms)
(e)
Figure 8 Experiment data from scenario T2 (12 g TNT) (a) Test data from P1 (b) Test data from P5 (c) Test data from P2 (d) Test datafrom P4 (e) Test data from P3
6 Shock and Vibration
declining the durations of the blast pulses were much longerthan those in the other two tests for which the maximumone was almost 1ms long
33 Scenario T3 With the TNT equivalences increasingonly one experiment was conducted with 18 g because of theoperation restrictions of the blast tests e gauge dataplotted in Figure 9 shows that the first peak value from P3has obviously increased to 100025 kPa which is almost onthe same level as the second and third peaks Moreover thedurations are much shorter than the above data with only047ms for P3 almost half that of the durations of the abovetests is means that the waves reflected from differentdirections were coincidently superimposed together whichcould still be recognized as a slight time delay on therecorded curve In addition in this scenario the maximumfirst peak value is 100242 kPa from P1 which is slightlylarger than that of P3
34 Scenario T4 Four blast tests were conducted with sce-nario T4 However the explosives were not detonated com-pletely Some black explosive residue was left on the basementplane when the shell model was removed after the tests asshown in Figure 10Moreover the records from these two testsshow distinctly lower values than the others us they weretreated as valid data but are not presented in this paper
e overpressure curves in Figure 11 show that goodagreement was achieved between the other two tests es-pecially on the arrival time of the peak overpressures with aslight difference in the values e maximum first peak valueof 135536 kPa came from P5
35 Summary of Test Data In this subsection the above testdata are compared quantificationally Complicated propa-gations and reflections of the blast waves occurred duringthe interior blast tests erefore the maximum peak valuesfrom the tests are important but there is no meaning to acomparison with other test data is is because sometimestwo or more reflected waves merged together coincidentallywhich resulted in the maximum reflected value Howeverthe first peak pressure values from the tests could carry moreuseful information directly All of the first peak overpressuredata from each scenario are listed in Table 2
With an increase in the TNT equivalence the peakpressure values rapidly increased However with this generaltrend the record of 100025 kPa for scenario T3 from P3 isspecial because it is obviously larger than those of scenarioT4 Table 3 lists the impulses of the first 5ms blast loadingdata e increasing trends are much more obvious in thesedata and could explain the abnormal value for scenario T3e abnormal value could be related to two reflected peaksmerging coincidently and being recognized as one
4 Numerical Model and Verification
It should be noted that although the general trends for theoverpressure curves are consistent for the same scenario the
peak values are not identical e main reasons for thesedifferences are related to the TNT equivalences and posi-tions e blast propagation and reflection from an interiorsurface is a complicated process A tiny variation should leadto an evident difference in the results However it would beimpossible to see what happened inside the shell model evenif high-speed cameras were used because of the fireball andsmoke during the blast tests A numerical simulation is thebest way to determine what occurs inside the shell modeland it could be repeated many times with different scenarioswithout the high costs of blast tests
e blast propagation medium should be modelled innumerical simulation studies However three-dimensionalmodels are extraordinarily large is not only makes themtime-consuming to utilize but also lowers the precisionbecause of the computing power limitation which is notsuitable for a parametric analysis
Consequently a simplified method is proposed in thispaper based on the features of this problem e inner spaceof the rigid shell model is symmetric with a central axis asshown in Figure 12(a) In addition the explosives are det-onated in the center at ground level in all the scenariosreferenced above e three-dimensional model could besimplified into a two-dimensional model using theAUTODYN software package [20] as shown inFigure 12(b)
Euler elements were adopted to set up the numericalmodel A three-dimensional model could be obtained byrotating the two-dimensional model around the symmetryaxis e other boundaries were all rigid to consider therestriction of the 30mm steel shell In addition to simulatethe detonation platform in the middle of the basement plane(Figure 13) the unused elements in AUTODYN wereadopted to refine the rigid boundaries
e JonesndashWilkinsndashLee (JWL) equation of state wasused to simulate the TNT detonation process which isexpressed as follows [20]
p C1 1 minusω
r1v1113888 1113889e
minus r1v+ C2 1 minus
ωr2v
1113888 1113889eminus r2v
+ωe
v (2)
where C1 r1 C2 r2 ω and v are constants with the specificvalues listed in Table 4
e ideal gas equation of state was used to simulate thepropagationmedium of air [20] which could be expressed asthe GayndashLussac equation
p (c minus 1)ρe (3)
where ρ is the density of air and c is a constant equal to 14e four scenarios of the blast tests were simulated using
the parameters and model above Good agreement wasfound in comparisons Taking scenario T2 and T4 as ex-amples comparisons of the results of the tests and numericalsimulations are presented in the following subsections
41 Simulation of Scenario T2 Taking the simulation ofscenario T2 as an example the detonation and propagationprocesses are shown in Figure 14 It can be seen that the TNTdetonated in the center of the shell and the spherical shock
Shock and Vibration 7
waves quickly swelled as shown in Figures 14(a) and 14(b)e blast first crashed into and reflected of the side wall ofthe shell and then reached the top of the roof (Figure 14(c))
Reflected waves were generated and continually propagatedto different positions At the same time the first shock wavedirectly generated from the TNTalso arrived at the junction
1500
1000
Ove
rpre
ssur
e (kP
a)
500
0
0 2 4Time (ms)
T3-1-P1
6 8 10
(a)
1000
750
Ove
rpre
ssur
e (kP
a)
500
250
0
0 2 4Time (ms)
T3-1-P5
6 8 10
(b)
1000
750
Ove
rpre
ssur
e (kP
a)
500
250
0
0 2 4Time (ms)
6 8 10
T3-1-P2
(c)
800
600O
verp
ress
ure (
kPa)
400
200
0
0 2 4Time (ms)
T3-1-P4
6 8 10
(d)
1500
1000
Ove
rpre
ssur
e (kP
a)
500
0
0 2 4Time (ms)
6 8 10
T3-1-P3
(e)
Figure 9 Experiment data from scenario T3 (15 g TNT) (a) Test data from P1 (b) Test data from P5 (c) Test data from P2 (d) Test datafrom P4 (e) Test data from P3
8 Shock and Vibration
Figure 10 Residue from TNT after explosion
1500
Ove
rpre
ssur
e (kP
a) 1000
500
0
T4-1-P1T4-2-P1
0 2 4Time (ms)
6 8 10
(a)
2000
Ove
rpre
ssur
e (kP
a)1000
0
T4-1-P5T4-2-P5
0 2 4Time (ms)
6 8 10
(b)
1200
Ove
rpre
ssur
e (kP
a) 800
400
0
T4-1-P2T4-2-P2
0 2 4Time (ms)
6 8 10
(c)
1500
Ove
rpre
ssur
e (kP
a) 1000
500
0
T4-1-P4T4-2-P4
0 2 4Time (ms)
6 8 10
(d)
Figure 11 Continued
Shock and Vibration 9
1600
Ove
rpre
ssur
e (kP
a)
800
0
T4-1-P3T4-2-P3
0 2 4Time (ms)
6 8 10
(e)
Figure 11 Experiment data from scenario T4 (20 g TNT) (a) Test data from P1 (b) Test data from P5 (c) Test data from P2 (d) Test datafrom P4 (e) Test data from P3
Table 2 First peak overpressure from each scenario (units kPa)
5 g 10 g 15 g 20 gP1 15246 48238 7599 100242 117022 12272P2 18669 43345 31723 68277 53488 79232P3 14585 39675 34227 100025 76232 51853P4 23029 45164 28589 60837 99237 98889P5 24152 59155 66072 92886 115599 135536
Table 3 Impulse from each scenario (units kPamiddotms)
5 g 10 g 15 g 20 gP1 20581 54615 76882 97187 96160 117649P2 25659 48807 74981 84514 89015 125248P3 35598 84561 80316 83344 98025 57318P4 19163 49313 67097 84610 87514 187352P5 22632 53091 74777 87152 93315 119269
VoidAIRTNT
y
x
z
(a)
VoidAIRTNT
(b)
Figure 12 Simplified model for blast loading in curved shell structures (a) 3D numerical model and (b) 2D simplified numerical model
10 Shock and Vibration
VoidAIRTNT
y
x
z
Figure 13 Equivalent 3D model with detonation platform
Pressure (kPa)1796e + 03
1617e + 03
1439e + 03
1260e + 03
1081e + 03
9023e + 02
7235e + 02
5448e + 02
3660e + 02
1873e + 02
8527e + 00
(a)
Pressure (kPa)5174e + 02
4657e + 02
4140e + 02
3623e + 02
3105e + 02
2588e + 02
2071e + 02
1553e + 02
1036e + 02
5188e + 01
1496e ndash 01
(b)Pressure (kPa)
8541e + 02
7718e + 02
6895e + 02
6073e + 02
5250e + 02
4427e + 02
3604e + 02
2781e + 02
1959e + 02
1136e + 02
3129e + 01
(c)
1061e + 03
9589e + 02
8566e + 02
7543e + 02
6519e + 02
5496e + 02
4473e + 02
3450e + 02
2427e + 02
1404e + 02
3808e + 01
Pressure (kPa)
(d)
Figure 14 Continued
Table 4 Parameters of TNT
C1 (GPa) C2 (GPa) r1 r2 ω v (ms)374 375 415 090 035 6930
Shock and Vibration 11
between the roof and wall ese waves merged together andformed a new reflected wave (Figure 14(d)) is new re-flected wave rushed downward (Figures 14(e) and 14(f) andencountered a wave reflected from the ground whichgenerated the largest peak pressure on the top of the shell atposition P3 as shown in Figures 14(g) and 14(h))
e overpressure data from the specific positions of thegauges were output and plotted in the same figure tocompare with the test data in Figure 15 e overpressurecurves are plotted with solid lines with dashed lines used forthe impulses which were obtained by the integral of theoverpressure data In addition the black and red linesrepresent the test data and the blue lines are the simulationresults
From Figure 15 the simulation results are consistentwith the test data from the blast tests Especially for the firstreflected peak both the arrival times and shapes are the sameas those of the gauge recordings e subsequent reflected
peaks of the numerical simulations are slightly smaller thanthose of the tests while the arrival times of the subsequentpeaks are close to those of the tests is is mainly becausethe JWL equation of state cannot account for the energy ofthe afterburning effect [21 22] which involves a series ofcomplicated chemical reactions including some additionalcombustion processes of C CO H2 and so on Moreoverthe afterburning process occurred after the detonationwhich means the first values of reflected peaks were notaffected
42 Simulationof ScenarioT4 In comparison to the test dataof scenario T4 the simulation results had good agreementwith P1 and P5 As shown in Figure 16(a) the simulationcould well demonstrate the features of the whole trend peakreflected values impulses and arrival times for the firstreflected wave However the results of comparisons for
Pressure (kPa)6299e + 02
5732e + 02
5165e + 02
4597e + 02
4030e + 02
3463e + 02
2896e + 02
2329e + 02
1761e + 02
1194e + 02
6268e + 01
(e)
Pressure (kPa)1186e + 03
1075e + 03
9628e + 02
8510e + 02
7392e + 02
6274e + 02
5156e + 02
4038e + 02
2920e + 02
1802e + 02
6836e + 01
(f )Pressure (kPa)
6120e + 02
5588e + 02
5057e + 02
4525e + 02
3994e + 02
3463e + 02
2931e + 02
2400e + 02
1869e + 02
1337e + 02
8060e + 01
(g)
Pressure (kPa)1228e + 03
1113e + 03
9989e + 02
8844e + 02
7698e + 02
6553e + 02
5408e + 02
4262e + 02
3117e + 02
1971e + 02
8258e + 01
(h)
Figure 14 Evolution of pressure field in curved structure (a) 01ms (b) 03ms (c) 05ms (d) 07ms (e) 10ms (f ) 12ms (g) 14ms(h) 16ms
12 Shock and Vibration
positions P2 and P4 were not as good (Figure 16(b)) On theone hand the results of the test data had a distinct differencewith the recording from P2 obviously smaller than that ofP4 On the other hand there was a double peak for the firstreflected peak of P2 is might have been caused by theoriginal fixed position of the TNT which was quite sensitiveto the pressure fields Because the positions of P1 and P5were much further away the asymmetrical effects were notas obvious From Figure 16(c) it can be seen that the testdata are slightly smaller than the data of the simulations forthe first reflected peak as well as for the second oneHowever the general trends are quite similar
In addition it should be noted that the explosives used inthe numerical simulations had hemispherical shapes becauseof the limitations of the 2D model However TNT cubeswere used in the blast tests because these were much easierto cute effects of charge shapes are mainly reflected in thenear field of blast e study in this paper focused on the
interior blast loading of large-span spatial structures ofwhich the cases in this study are relating to far-field issueserefore in order to simplify the simulation procedure thehemispherical TNT was used From the comparison resultsit also illustrates that the effect of the TNT shape is not veryimportant with a relatively large-scaled distance
From the above comparisons of the simulation and testresults for two scenarios it can be determined that thenumerical simulation methods and parameters in AUTO-DYN are suitable for considering this interior blast problemand could be used for predicting the blast field in a shellstructure
5 Prediction from Parameter Analysis
e previously discussed blast tests and numerical simula-tions showed that the prediction process for blast loading iscomplicated making it inconvenient for engineers during
Ove
rpre
ssur
e (kP
a)
800
400
0
400
200
0
0 1 2 3
Impu
lse (k
Pamiddotm
s)
P-1P-5G-1
P-1P-5G-1
Time (ms)
(a)
Ove
rpre
ssur
e (kP
a)
800
400
0
Impu
lse (k
Pamiddotm
s)
400
200
0
0 1Time (ms)
2 3
P-2P-4G-2
(b)
Ove
rpre
ssur
e (kP
a)
2400
1600
800
0Im
pulse
(kPa
middotms)400
600
200
0
0 1 2 3
P-3G-3P-G-
Time (ms)
(c)
Figure 15 Comparisons between test data and numerical simulation data for scenario T2 Comparison between (a) test and simulation(P1 amp P5) (b) test and simulation (P2 amp P4) and (c) test and simulation (P3)
Shock and Vibration 13
the design period However most reticulated domes havesimilar interior spaces enclosed with a roof system supportwalls and a ground floor which means the blast loadingdistributions follow similar rules erefore based on thesimilarity law a detonation would generate self-similar blastwaves on the same-scaled distance within geometricallysimilar environments which represents a much simpler wayto obtain the blast field is means as shown in Figure 17that two spherical charges would generate blast loads withcertain relations which include the same peak pressures Inaddition both the impulses and durations differ by a factorof k where k is a constant based on the relationship betweenthe dimensions of the two charges Consequently the blastloading of a long-spatial structure could be deduced from asimilar small model based on the similarity law [23]
A system parametrical analysis was conducted with a10m span model According the convergence analysis inreference [16] 300-element in the radial direction of themodel is a suitable meshing scheme for this probleme 2D
model in the following sections includes more than01million Euler cells which are ranging from 6mm to16mm
By analyzing the distribution rules of blast loading threekey parameters varying rise-span ratio fL height-span ratioHL and scaled distance Z were distinguished as the mostinfluential ones e blast loading on the interior surfacesfrom parametrical analysis of the model are listed inTables 5ndash7
1600 800
600
400
200
0
1200
800
Ove
rpre
ssur
e (kP
a)
400
0
Impu
lse (k
Pamiddotm
s)
0 1Time (ms)
2 3
P-1P-5G-1
(a)
1200
800
Ove
rpre
ssur
e (kP
a)
600
400
200
0
Impu
lse (k
Pamiddotm
s)
400
0
0 1Time (ms)
2 3
P-2P-4G-2
(b)
Impu
lse (k
Pamiddotm
s)
1200
800
400
0
2400
1600
Ove
rpre
ssur
e (kP
a)
800
0
0 1Time (ms)
2
P-3G-3
(c)
Figure 16 Comparisons between test data and numerical simulation data of scenario T4 Comparison between (a) test and simulation(P1 amp P5) (b) test and simulation (P2 amp P4) and (c) test and simulation (P3)
d
kd
R
P I
kI
kta
taP
kR
Figure 17 Similarity law of blast
14 Shock and Vibration
is study is aimed on dealing with the blast loading for awider scope of spatial structures of which the specificintershapes are various erefore a series of simulationswere conducted for those typical intershapes of spatialstructures in Tables 5ndash7 By using the method proposed inreference [16] the data obtained from the standard modelscould be used to deduce similar blast distributions for large-span structures erefore the blast loads of other issuescould be predicted quickly with these similar data withoutexecuting blast tests and simulations e predicted blastloading could be used as the suggestion for structural design
6 Conclusions
Confined blast tests were conducted with an almost rigidcurved shell model to determine the blast pressure fieldswithin a reticulated dome e blast data of the pressure-time histories were recorded using PCB gauges at five typicalpositions Four scenarios with different TNT equivalenceswere used and the pressure fields in the curved shell modelwere compared e overpressures and impulses of the firstpeak for each scenario were compared and studied eresults showed that the first peaks had obvious regularitywhen the TNT equivalence was changed whereas the sub-sequent blast loading peaks did not which was caused by thecomplicated evolution process for the shock wave fields inthe confined blast In addition a simplified method for thenumerical simulation of blast loading was introduced eblast scenarios were simulated and verified using the testdata e dynamic evolution of the blast propagation andreflection processes was effectively explored by the nu-merical simulations with the contour plots observed indetail using AUTODYN Finally a parameter analysis of theblast loading was conducted with some key parametersvaried within a reasonable scope Based on these results theinterior blast loading at the important positions of other
reticulated domes could conveniently be predicted using theexisting data which could be used in the protective designand rapid assessment of the reticulated domes
Data Availability
e data used to support the findings of this study areavailable from the corresponding author upon request
Conflicts of Interest
e authors declare that they have no conflicts of interest
Acknowledgments
e research presented in this paper was jointly supportedby the National Natural Science Foundation of China (grantno 51708521) and Foundation of Key Laboratory ofStructures Dynamic Behavior and Control (Ministry ofEducation) in Harbin Institute of Technology of China(grant no HITCE201803) e first author would also like toexpress the sincere acknowledgements to Prof YadongZhang and Hengbo Xiang for their suggestions and help onthe blast tests
References
[1] UFC 3-340-02 Structures to Resist the Effects of AccidentalExplosions UFC Departments of the Army the Navy and theAir Force Las Vegas NV USA 2008
[2] Y Hu C Wu M Lukaszewicz J Dragos J Ren andM Haskett ldquoCharacteristics of confined blast loading inunvented structuresrdquo International Journal of ProtectiveStructures vol 2 no 1 pp 21ndash43 2011
[3] C Wu M Lukaszewicz K Schebella and L AntanovskiildquoExperimental and numerical investigation of confined
Table 5 Results of parameter analysis with different scaled distances
Z (mmiddotkgminus 13)23 25 29 4 5
I (kPamiddotms) P (kPa) I (kPamiddotms) P (kPa) I (kPamiddotms) P (kPa) I (kPamiddotms) P (kPa) I (kPamiddotms) P (kPa)Top 10175 7504 8354 5909 5717 3829 2769 1810 1655 1111Corner 6893 7137 5665 5696 3844 3775 1727 1789 973 1100
Table 6 Results of parameter analysis with different rise-span ratios
fL0 0125 02 025 05
I (kPamiddotms) P (kPa) I (kPamiddotms) P (kPa) I (kPamiddotms) P (kPa) I (kPamiddotms) P (kPa) I (kPamiddotms) P (kPa)Top 7185 4674 6464 3868 5717 3829 5384 3970 5227 3876Corner 2969 3993 3595 3981 3844 3775 4170 3780 5265 3955
Table 7 Results of parameter analysis with different height-span ratios
HL04 045 05 055 06
I (kPamiddotms) P (kPa) I (kPamiddotms) P (kPa) I (kPamiddotms) P (kPa) I (kPamiddotms) P (kPa) I (kPamiddotms) P (kPa)Top 3453 2535 4580 3104 5717 3829 6808 3985 8138 4745Corner 2491 3752 3280 3814 3844 3775 4690 3771 5648 3802
Shock and Vibration 15
explosion in a blast chamberrdquo Journal of Loss Prevention in theProcess Industries vol 26 no 4 pp 737ndash750 2013
[4] C Wu G Fattori A Whittaker and D J Oehlers ldquoIn-vestigation of air-blast effects from spherical-and cylindrical-shaped chargesrdquo International Journal of Protective Struc-tures vol 1 no 3 pp 345ndash362 2010
[5] C Wu and H Hao ldquoModeling of simultaneous groundshock and airblast pressure on nearby structures fromsurface explosionsrdquo International Journal of Impact Engi-neering vol 31 no 6 pp 699ndash717 2005
[6] S Yang Q Fang Y Zhang et al ldquoA numerical method ofcalculating the consequence of heterogeneous mixed vaporcloud explosionrdquo Natural Gas Industry vol 34 pp 155ndash1612014 in Chinese
[7] Q Bao Q Fang Y Zhang L Chen S Yang and Z Li ldquoEffectsof gas concentration and venting pressure on overpressuretransients during vented explosion of methane-air mixturesrdquoFuel vol 175 pp 40ndash48 2016
[8] Z Li Y Shi and H Zhou ldquoPropagation law and overpressureload of blast wave in urban compels environmentrdquo Engi-neering Mechanics vol 26 pp 178ndash183 2009
[9] Y Shi Z Li and H Hao ldquoMesh size effect in numericalsimulation of blast wave propagation and interaction withstructuresrdquo Transactions of Tianjin University vol 14 no 6pp 396ndash402 2008
[10] Y Shi Z-X Li and H Hao ldquoA new method for progressivecollapse analysis of RC frames under blast loadingrdquo Engi-neering Structures vol 32 no 6 pp 1691ndash1703 2010
[11] Y Shi H Hao and Z Li ldquoNumerical simulation of blast waveinteraction with structure columnsrdquo Shock Waves vol 17no 1-2 pp 111ndash123 2007
[12] X Gao and S Wang ldquoDeflection of architectural laminatedglasses under static and explosive loadsrdquo Journal of theChinese Ceramic Society vol 36 pp 1477ndash1483 2008
[13] Z Xudong Q Shaobo F Feng and Z Ximei ldquoExperimentaland numerical investigations of a single-layer reticulateddome subjected to external blast loadingrdquo EngineeringStructures vol 176 pp 103ndash114 2018
[14] X-B Zhi S-B Qi and F Fan ldquoTemporal and spatial pressuredistribution characteristics of hemispherical shell structuresubjected to external explosionrdquo in-Walled Structuresvol 137 pp 472ndash486 2019
[15] J Ma Z Xudong and F Fan e Study on Loading Field ofInner Blast inside the Shells e 13rd IASS ConferenceShenzhen China 2010 in Chinese
[16] J L Ma C Q Wu X D Zhi and F Fan ldquoPrediction ofconfined blast loading in single-layer lattice shellsrdquo Advancesin Structural Engineering vol 17 no 7 pp 1029ndash1043 2014
[17] J Ma F Fan C Wu and X Zhi ldquoCounter-intuitive collapseof single-layer reticulated domes subject to interior blastloadingrdquo in-Walled Structures vol 96 pp 130ndash138 2015
[18] J Ma F Fan L Zhang CWu and X Zhi ldquoFailure modes andfailure mechanisms of single-layer reticulated domes sub-jected to interior blastsrdquo in-Walled Structures vol 132pp 208ndash216 2018
[19] W E Baker Explosions in Air University of Texas PressAustin TX USA 1973
[20] Century Dynamics AUTODYN eory Manual RevisionVol 4 Century Dynamics Concord CA USA 2005
[21] I Edri V R Feldgun Y S Karinski and D Z YankelevskyldquoAfterburning aspects in an internal TNT explosionrdquo In-ternational Journal of Protective Structures vol 4 no 1pp 97ndash116 2013
[22] I Edri V R Feldgun Y S Karinski and D Z YankelevskyldquoOn blast pressure analysis due to a partially confined ex-plosion III Afterburning effectrdquo International Journal ofProtective Structures vol 3 no 3 pp 311ndash331 2012
[23] J Henrych e Dynamics of Explosion and its Use ElsevierScientific Pub Co Amsterdam Netherlands 1979
16 Shock and Vibration
International Journal of
AerospaceEngineeringHindawiwwwhindawicom Volume 2018
RoboticsJournal of
Hindawiwwwhindawicom Volume 2018
Hindawiwwwhindawicom Volume 2018
Active and Passive Electronic Components
VLSI Design
Hindawiwwwhindawicom Volume 2018
Hindawiwwwhindawicom Volume 2018
Shock and Vibration
Hindawiwwwhindawicom Volume 2018
Civil EngineeringAdvances in
Acoustics and VibrationAdvances in
Hindawiwwwhindawicom Volume 2018
Hindawiwwwhindawicom Volume 2018
Electrical and Computer Engineering
Journal of
Advances inOptoElectronics
Hindawiwwwhindawicom
Volume 2018
Hindawi Publishing Corporation httpwwwhindawicom Volume 2013Hindawiwwwhindawicom
The Scientific World Journal
Volume 2018
Control Scienceand Engineering
Journal of
Hindawiwwwhindawicom Volume 2018
Hindawiwwwhindawicom
Journal ofEngineeringVolume 2018
SensorsJournal of
Hindawiwwwhindawicom Volume 2018
International Journal of
RotatingMachinery
Hindawiwwwhindawicom Volume 2018
Modelling ampSimulationin EngineeringHindawiwwwhindawicom Volume 2018
Hindawiwwwhindawicom Volume 2018
Chemical EngineeringInternational Journal of Antennas and
Propagation
International Journal of
Hindawiwwwhindawicom Volume 2018
Hindawiwwwhindawicom Volume 2018
Navigation and Observation
International Journal of
Hindawi
wwwhindawicom Volume 2018
Advances in
Multimedia
Submit your manuscripts atwwwhindawicom
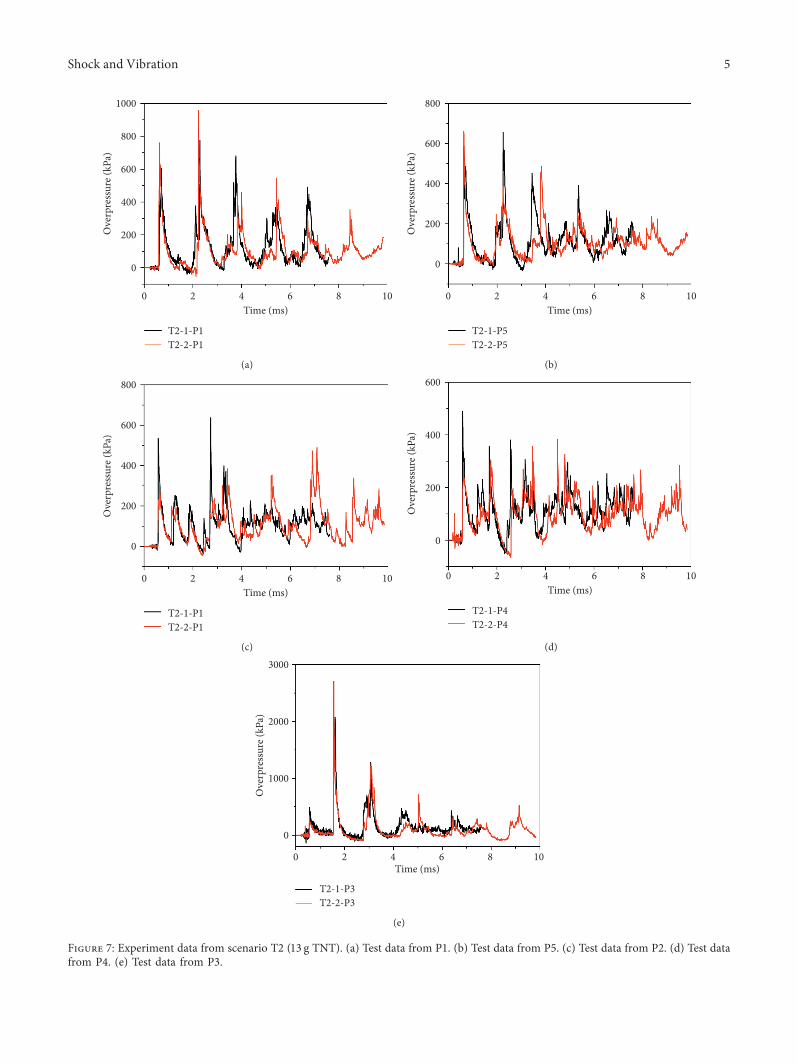
1000
800
600
400
200
0
Ove
rpre
ssur
e (kP
a)
0 10864Time (ms)
2
T2-1-P1T2-2-P1
(a)
800
600
400
200
0
Ove
rpre
ssur
e (kP
a)
0 10864Time (ms)
2
T2-1-P5T2-2-P5
(b)
800
600
400
200
0
Ove
rpre
ssur
e (kP
a)
0 10864Time (ms)
2
T2-1-P1T2-2-P1
(c)
600
400
200
0
Ove
rpre
ssur
e (kP
a)
0 10864Time (ms)
2
T2-1-P4T2-2-P4
(d)
3000
2000
1000
0
Ove
rpre
ssur
e (kP
a)
0 10864Time (ms)
2
T2-1-P3T2-2-P3
(e)
Figure 7 Experiment data from scenario T2 (13 g TNT) (a) Test data from P1 (b) Test data from P5 (c) Test data from P2 (d) Test datafrom P4 (e) Test data from P3
Shock and Vibration 5
600O
verp
ress
ure (
kPa) 400
200
0
0 2 4 6 8 10
T2-3-P1
Time (ms)
(a)
800
Ove
rpre
ssur
e (kP
a)
400
600
200
0
0 2 4 6 8 10
T2-3-P5
Time (ms)
(b)
500
Ove
rpre
ssur
e (kP
a)
250
0
0 2 4 6 8 10
T2-3-P2
Time (ms)
(c)
500
Ove
rpre
ssur
e (kP
a)
250
0
0 2 4 6 8 10
T2-3-P4
Time (ms)
(d)
1800
Ove
rpre
ssur
e (kP
a) 1200
600
0
0 2 4 6 8 10
T2-3-P3
Time (ms)
(e)
Figure 8 Experiment data from scenario T2 (12 g TNT) (a) Test data from P1 (b) Test data from P5 (c) Test data from P2 (d) Test datafrom P4 (e) Test data from P3
6 Shock and Vibration
declining the durations of the blast pulses were much longerthan those in the other two tests for which the maximumone was almost 1ms long
33 Scenario T3 With the TNT equivalences increasingonly one experiment was conducted with 18 g because of theoperation restrictions of the blast tests e gauge dataplotted in Figure 9 shows that the first peak value from P3has obviously increased to 100025 kPa which is almost onthe same level as the second and third peaks Moreover thedurations are much shorter than the above data with only047ms for P3 almost half that of the durations of the abovetests is means that the waves reflected from differentdirections were coincidently superimposed together whichcould still be recognized as a slight time delay on therecorded curve In addition in this scenario the maximumfirst peak value is 100242 kPa from P1 which is slightlylarger than that of P3
34 Scenario T4 Four blast tests were conducted with sce-nario T4 However the explosives were not detonated com-pletely Some black explosive residue was left on the basementplane when the shell model was removed after the tests asshown in Figure 10Moreover the records from these two testsshow distinctly lower values than the others us they weretreated as valid data but are not presented in this paper
e overpressure curves in Figure 11 show that goodagreement was achieved between the other two tests es-pecially on the arrival time of the peak overpressures with aslight difference in the values e maximum first peak valueof 135536 kPa came from P5
35 Summary of Test Data In this subsection the above testdata are compared quantificationally Complicated propa-gations and reflections of the blast waves occurred duringthe interior blast tests erefore the maximum peak valuesfrom the tests are important but there is no meaning to acomparison with other test data is is because sometimestwo or more reflected waves merged together coincidentallywhich resulted in the maximum reflected value Howeverthe first peak pressure values from the tests could carry moreuseful information directly All of the first peak overpressuredata from each scenario are listed in Table 2
With an increase in the TNT equivalence the peakpressure values rapidly increased However with this generaltrend the record of 100025 kPa for scenario T3 from P3 isspecial because it is obviously larger than those of scenarioT4 Table 3 lists the impulses of the first 5ms blast loadingdata e increasing trends are much more obvious in thesedata and could explain the abnormal value for scenario T3e abnormal value could be related to two reflected peaksmerging coincidently and being recognized as one
4 Numerical Model and Verification
It should be noted that although the general trends for theoverpressure curves are consistent for the same scenario the
peak values are not identical e main reasons for thesedifferences are related to the TNT equivalences and posi-tions e blast propagation and reflection from an interiorsurface is a complicated process A tiny variation should leadto an evident difference in the results However it would beimpossible to see what happened inside the shell model evenif high-speed cameras were used because of the fireball andsmoke during the blast tests A numerical simulation is thebest way to determine what occurs inside the shell modeland it could be repeated many times with different scenarioswithout the high costs of blast tests
e blast propagation medium should be modelled innumerical simulation studies However three-dimensionalmodels are extraordinarily large is not only makes themtime-consuming to utilize but also lowers the precisionbecause of the computing power limitation which is notsuitable for a parametric analysis
Consequently a simplified method is proposed in thispaper based on the features of this problem e inner spaceof the rigid shell model is symmetric with a central axis asshown in Figure 12(a) In addition the explosives are det-onated in the center at ground level in all the scenariosreferenced above e three-dimensional model could besimplified into a two-dimensional model using theAUTODYN software package [20] as shown inFigure 12(b)
Euler elements were adopted to set up the numericalmodel A three-dimensional model could be obtained byrotating the two-dimensional model around the symmetryaxis e other boundaries were all rigid to consider therestriction of the 30mm steel shell In addition to simulatethe detonation platform in the middle of the basement plane(Figure 13) the unused elements in AUTODYN wereadopted to refine the rigid boundaries
e JonesndashWilkinsndashLee (JWL) equation of state wasused to simulate the TNT detonation process which isexpressed as follows [20]
p C1 1 minusω
r1v1113888 1113889e
minus r1v+ C2 1 minus
ωr2v
1113888 1113889eminus r2v
+ωe
v (2)
where C1 r1 C2 r2 ω and v are constants with the specificvalues listed in Table 4
e ideal gas equation of state was used to simulate thepropagationmedium of air [20] which could be expressed asthe GayndashLussac equation
p (c minus 1)ρe (3)
where ρ is the density of air and c is a constant equal to 14e four scenarios of the blast tests were simulated using
the parameters and model above Good agreement wasfound in comparisons Taking scenario T2 and T4 as ex-amples comparisons of the results of the tests and numericalsimulations are presented in the following subsections
41 Simulation of Scenario T2 Taking the simulation ofscenario T2 as an example the detonation and propagationprocesses are shown in Figure 14 It can be seen that the TNTdetonated in the center of the shell and the spherical shock
Shock and Vibration 7
waves quickly swelled as shown in Figures 14(a) and 14(b)e blast first crashed into and reflected of the side wall ofthe shell and then reached the top of the roof (Figure 14(c))
Reflected waves were generated and continually propagatedto different positions At the same time the first shock wavedirectly generated from the TNTalso arrived at the junction
1500
1000
Ove
rpre
ssur
e (kP
a)
500
0
0 2 4Time (ms)
T3-1-P1
6 8 10
(a)
1000
750
Ove
rpre
ssur
e (kP
a)
500
250
0
0 2 4Time (ms)
T3-1-P5
6 8 10
(b)
1000
750
Ove
rpre
ssur
e (kP
a)
500
250
0
0 2 4Time (ms)
6 8 10
T3-1-P2
(c)
800
600O
verp
ress
ure (
kPa)
400
200
0
0 2 4Time (ms)
T3-1-P4
6 8 10
(d)
1500
1000
Ove
rpre
ssur
e (kP
a)
500
0
0 2 4Time (ms)
6 8 10
T3-1-P3
(e)
Figure 9 Experiment data from scenario T3 (15 g TNT) (a) Test data from P1 (b) Test data from P5 (c) Test data from P2 (d) Test datafrom P4 (e) Test data from P3
8 Shock and Vibration
Figure 10 Residue from TNT after explosion
1500
Ove
rpre
ssur
e (kP
a) 1000
500
0
T4-1-P1T4-2-P1
0 2 4Time (ms)
6 8 10
(a)
2000
Ove
rpre
ssur
e (kP
a)1000
0
T4-1-P5T4-2-P5
0 2 4Time (ms)
6 8 10
(b)
1200
Ove
rpre
ssur
e (kP
a) 800
400
0
T4-1-P2T4-2-P2
0 2 4Time (ms)
6 8 10
(c)
1500
Ove
rpre
ssur
e (kP
a) 1000
500
0
T4-1-P4T4-2-P4
0 2 4Time (ms)
6 8 10
(d)
Figure 11 Continued
Shock and Vibration 9
1600
Ove
rpre
ssur
e (kP
a)
800
0
T4-1-P3T4-2-P3
0 2 4Time (ms)
6 8 10
(e)
Figure 11 Experiment data from scenario T4 (20 g TNT) (a) Test data from P1 (b) Test data from P5 (c) Test data from P2 (d) Test datafrom P4 (e) Test data from P3
Table 2 First peak overpressure from each scenario (units kPa)
5 g 10 g 15 g 20 gP1 15246 48238 7599 100242 117022 12272P2 18669 43345 31723 68277 53488 79232P3 14585 39675 34227 100025 76232 51853P4 23029 45164 28589 60837 99237 98889P5 24152 59155 66072 92886 115599 135536
Table 3 Impulse from each scenario (units kPamiddotms)
5 g 10 g 15 g 20 gP1 20581 54615 76882 97187 96160 117649P2 25659 48807 74981 84514 89015 125248P3 35598 84561 80316 83344 98025 57318P4 19163 49313 67097 84610 87514 187352P5 22632 53091 74777 87152 93315 119269
VoidAIRTNT
y
x
z
(a)
VoidAIRTNT
(b)
Figure 12 Simplified model for blast loading in curved shell structures (a) 3D numerical model and (b) 2D simplified numerical model
10 Shock and Vibration
VoidAIRTNT
y
x
z
Figure 13 Equivalent 3D model with detonation platform
Pressure (kPa)1796e + 03
1617e + 03
1439e + 03
1260e + 03
1081e + 03
9023e + 02
7235e + 02
5448e + 02
3660e + 02
1873e + 02
8527e + 00
(a)
Pressure (kPa)5174e + 02
4657e + 02
4140e + 02
3623e + 02
3105e + 02
2588e + 02
2071e + 02
1553e + 02
1036e + 02
5188e + 01
1496e ndash 01
(b)Pressure (kPa)
8541e + 02
7718e + 02
6895e + 02
6073e + 02
5250e + 02
4427e + 02
3604e + 02
2781e + 02
1959e + 02
1136e + 02
3129e + 01
(c)
1061e + 03
9589e + 02
8566e + 02
7543e + 02
6519e + 02
5496e + 02
4473e + 02
3450e + 02
2427e + 02
1404e + 02
3808e + 01
Pressure (kPa)
(d)
Figure 14 Continued
Table 4 Parameters of TNT
C1 (GPa) C2 (GPa) r1 r2 ω v (ms)374 375 415 090 035 6930
Shock and Vibration 11
between the roof and wall ese waves merged together andformed a new reflected wave (Figure 14(d)) is new re-flected wave rushed downward (Figures 14(e) and 14(f) andencountered a wave reflected from the ground whichgenerated the largest peak pressure on the top of the shell atposition P3 as shown in Figures 14(g) and 14(h))
e overpressure data from the specific positions of thegauges were output and plotted in the same figure tocompare with the test data in Figure 15 e overpressurecurves are plotted with solid lines with dashed lines used forthe impulses which were obtained by the integral of theoverpressure data In addition the black and red linesrepresent the test data and the blue lines are the simulationresults
From Figure 15 the simulation results are consistentwith the test data from the blast tests Especially for the firstreflected peak both the arrival times and shapes are the sameas those of the gauge recordings e subsequent reflected
peaks of the numerical simulations are slightly smaller thanthose of the tests while the arrival times of the subsequentpeaks are close to those of the tests is is mainly becausethe JWL equation of state cannot account for the energy ofthe afterburning effect [21 22] which involves a series ofcomplicated chemical reactions including some additionalcombustion processes of C CO H2 and so on Moreoverthe afterburning process occurred after the detonationwhich means the first values of reflected peaks were notaffected
42 Simulationof ScenarioT4 In comparison to the test dataof scenario T4 the simulation results had good agreementwith P1 and P5 As shown in Figure 16(a) the simulationcould well demonstrate the features of the whole trend peakreflected values impulses and arrival times for the firstreflected wave However the results of comparisons for
Pressure (kPa)6299e + 02
5732e + 02
5165e + 02
4597e + 02
4030e + 02
3463e + 02
2896e + 02
2329e + 02
1761e + 02
1194e + 02
6268e + 01
(e)
Pressure (kPa)1186e + 03
1075e + 03
9628e + 02
8510e + 02
7392e + 02
6274e + 02
5156e + 02
4038e + 02
2920e + 02
1802e + 02
6836e + 01
(f )Pressure (kPa)
6120e + 02
5588e + 02
5057e + 02
4525e + 02
3994e + 02
3463e + 02
2931e + 02
2400e + 02
1869e + 02
1337e + 02
8060e + 01
(g)
Pressure (kPa)1228e + 03
1113e + 03
9989e + 02
8844e + 02
7698e + 02
6553e + 02
5408e + 02
4262e + 02
3117e + 02
1971e + 02
8258e + 01
(h)
Figure 14 Evolution of pressure field in curved structure (a) 01ms (b) 03ms (c) 05ms (d) 07ms (e) 10ms (f ) 12ms (g) 14ms(h) 16ms
12 Shock and Vibration
positions P2 and P4 were not as good (Figure 16(b)) On theone hand the results of the test data had a distinct differencewith the recording from P2 obviously smaller than that ofP4 On the other hand there was a double peak for the firstreflected peak of P2 is might have been caused by theoriginal fixed position of the TNT which was quite sensitiveto the pressure fields Because the positions of P1 and P5were much further away the asymmetrical effects were notas obvious From Figure 16(c) it can be seen that the testdata are slightly smaller than the data of the simulations forthe first reflected peak as well as for the second oneHowever the general trends are quite similar
In addition it should be noted that the explosives used inthe numerical simulations had hemispherical shapes becauseof the limitations of the 2D model However TNT cubeswere used in the blast tests because these were much easierto cute effects of charge shapes are mainly reflected in thenear field of blast e study in this paper focused on the
interior blast loading of large-span spatial structures ofwhich the cases in this study are relating to far-field issueserefore in order to simplify the simulation procedure thehemispherical TNT was used From the comparison resultsit also illustrates that the effect of the TNT shape is not veryimportant with a relatively large-scaled distance
From the above comparisons of the simulation and testresults for two scenarios it can be determined that thenumerical simulation methods and parameters in AUTO-DYN are suitable for considering this interior blast problemand could be used for predicting the blast field in a shellstructure
5 Prediction from Parameter Analysis
e previously discussed blast tests and numerical simula-tions showed that the prediction process for blast loading iscomplicated making it inconvenient for engineers during
Ove
rpre
ssur
e (kP
a)
800
400
0
400
200
0
0 1 2 3
Impu
lse (k
Pamiddotm
s)
P-1P-5G-1
P-1P-5G-1
Time (ms)
(a)
Ove
rpre
ssur
e (kP
a)
800
400
0
Impu
lse (k
Pamiddotm
s)
400
200
0
0 1Time (ms)
2 3
P-2P-4G-2
(b)
Ove
rpre
ssur
e (kP
a)
2400
1600
800
0Im
pulse
(kPa
middotms)400
600
200
0
0 1 2 3
P-3G-3P-G-
Time (ms)
(c)
Figure 15 Comparisons between test data and numerical simulation data for scenario T2 Comparison between (a) test and simulation(P1 amp P5) (b) test and simulation (P2 amp P4) and (c) test and simulation (P3)
Shock and Vibration 13
the design period However most reticulated domes havesimilar interior spaces enclosed with a roof system supportwalls and a ground floor which means the blast loadingdistributions follow similar rules erefore based on thesimilarity law a detonation would generate self-similar blastwaves on the same-scaled distance within geometricallysimilar environments which represents a much simpler wayto obtain the blast field is means as shown in Figure 17that two spherical charges would generate blast loads withcertain relations which include the same peak pressures Inaddition both the impulses and durations differ by a factorof k where k is a constant based on the relationship betweenthe dimensions of the two charges Consequently the blastloading of a long-spatial structure could be deduced from asimilar small model based on the similarity law [23]
A system parametrical analysis was conducted with a10m span model According the convergence analysis inreference [16] 300-element in the radial direction of themodel is a suitable meshing scheme for this probleme 2D
model in the following sections includes more than01million Euler cells which are ranging from 6mm to16mm
By analyzing the distribution rules of blast loading threekey parameters varying rise-span ratio fL height-span ratioHL and scaled distance Z were distinguished as the mostinfluential ones e blast loading on the interior surfacesfrom parametrical analysis of the model are listed inTables 5ndash7
1600 800
600
400
200
0
1200
800
Ove
rpre
ssur
e (kP
a)
400
0
Impu
lse (k
Pamiddotm
s)
0 1Time (ms)
2 3
P-1P-5G-1
(a)
1200
800
Ove
rpre
ssur
e (kP
a)
600
400
200
0
Impu
lse (k
Pamiddotm
s)
400
0
0 1Time (ms)
2 3
P-2P-4G-2
(b)
Impu
lse (k
Pamiddotm
s)
1200
800
400
0
2400
1600
Ove
rpre
ssur
e (kP
a)
800
0
0 1Time (ms)
2
P-3G-3
(c)
Figure 16 Comparisons between test data and numerical simulation data of scenario T4 Comparison between (a) test and simulation(P1 amp P5) (b) test and simulation (P2 amp P4) and (c) test and simulation (P3)
d
kd
R
P I
kI
kta
taP
kR
Figure 17 Similarity law of blast
14 Shock and Vibration
is study is aimed on dealing with the blast loading for awider scope of spatial structures of which the specificintershapes are various erefore a series of simulationswere conducted for those typical intershapes of spatialstructures in Tables 5ndash7 By using the method proposed inreference [16] the data obtained from the standard modelscould be used to deduce similar blast distributions for large-span structures erefore the blast loads of other issuescould be predicted quickly with these similar data withoutexecuting blast tests and simulations e predicted blastloading could be used as the suggestion for structural design
6 Conclusions
Confined blast tests were conducted with an almost rigidcurved shell model to determine the blast pressure fieldswithin a reticulated dome e blast data of the pressure-time histories were recorded using PCB gauges at five typicalpositions Four scenarios with different TNT equivalenceswere used and the pressure fields in the curved shell modelwere compared e overpressures and impulses of the firstpeak for each scenario were compared and studied eresults showed that the first peaks had obvious regularitywhen the TNT equivalence was changed whereas the sub-sequent blast loading peaks did not which was caused by thecomplicated evolution process for the shock wave fields inthe confined blast In addition a simplified method for thenumerical simulation of blast loading was introduced eblast scenarios were simulated and verified using the testdata e dynamic evolution of the blast propagation andreflection processes was effectively explored by the nu-merical simulations with the contour plots observed indetail using AUTODYN Finally a parameter analysis of theblast loading was conducted with some key parametersvaried within a reasonable scope Based on these results theinterior blast loading at the important positions of other
reticulated domes could conveniently be predicted using theexisting data which could be used in the protective designand rapid assessment of the reticulated domes
Data Availability
e data used to support the findings of this study areavailable from the corresponding author upon request
Conflicts of Interest
e authors declare that they have no conflicts of interest
Acknowledgments
e research presented in this paper was jointly supportedby the National Natural Science Foundation of China (grantno 51708521) and Foundation of Key Laboratory ofStructures Dynamic Behavior and Control (Ministry ofEducation) in Harbin Institute of Technology of China(grant no HITCE201803) e first author would also like toexpress the sincere acknowledgements to Prof YadongZhang and Hengbo Xiang for their suggestions and help onthe blast tests
References
[1] UFC 3-340-02 Structures to Resist the Effects of AccidentalExplosions UFC Departments of the Army the Navy and theAir Force Las Vegas NV USA 2008
[2] Y Hu C Wu M Lukaszewicz J Dragos J Ren andM Haskett ldquoCharacteristics of confined blast loading inunvented structuresrdquo International Journal of ProtectiveStructures vol 2 no 1 pp 21ndash43 2011
[3] C Wu M Lukaszewicz K Schebella and L AntanovskiildquoExperimental and numerical investigation of confined
Table 5 Results of parameter analysis with different scaled distances
Z (mmiddotkgminus 13)23 25 29 4 5
I (kPamiddotms) P (kPa) I (kPamiddotms) P (kPa) I (kPamiddotms) P (kPa) I (kPamiddotms) P (kPa) I (kPamiddotms) P (kPa)Top 10175 7504 8354 5909 5717 3829 2769 1810 1655 1111Corner 6893 7137 5665 5696 3844 3775 1727 1789 973 1100
Table 6 Results of parameter analysis with different rise-span ratios
fL0 0125 02 025 05
I (kPamiddotms) P (kPa) I (kPamiddotms) P (kPa) I (kPamiddotms) P (kPa) I (kPamiddotms) P (kPa) I (kPamiddotms) P (kPa)Top 7185 4674 6464 3868 5717 3829 5384 3970 5227 3876Corner 2969 3993 3595 3981 3844 3775 4170 3780 5265 3955
Table 7 Results of parameter analysis with different height-span ratios
HL04 045 05 055 06
I (kPamiddotms) P (kPa) I (kPamiddotms) P (kPa) I (kPamiddotms) P (kPa) I (kPamiddotms) P (kPa) I (kPamiddotms) P (kPa)Top 3453 2535 4580 3104 5717 3829 6808 3985 8138 4745Corner 2491 3752 3280 3814 3844 3775 4690 3771 5648 3802
Shock and Vibration 15
explosion in a blast chamberrdquo Journal of Loss Prevention in theProcess Industries vol 26 no 4 pp 737ndash750 2013
[4] C Wu G Fattori A Whittaker and D J Oehlers ldquoIn-vestigation of air-blast effects from spherical-and cylindrical-shaped chargesrdquo International Journal of Protective Struc-tures vol 1 no 3 pp 345ndash362 2010
[5] C Wu and H Hao ldquoModeling of simultaneous groundshock and airblast pressure on nearby structures fromsurface explosionsrdquo International Journal of Impact Engi-neering vol 31 no 6 pp 699ndash717 2005
[6] S Yang Q Fang Y Zhang et al ldquoA numerical method ofcalculating the consequence of heterogeneous mixed vaporcloud explosionrdquo Natural Gas Industry vol 34 pp 155ndash1612014 in Chinese
[7] Q Bao Q Fang Y Zhang L Chen S Yang and Z Li ldquoEffectsof gas concentration and venting pressure on overpressuretransients during vented explosion of methane-air mixturesrdquoFuel vol 175 pp 40ndash48 2016
[8] Z Li Y Shi and H Zhou ldquoPropagation law and overpressureload of blast wave in urban compels environmentrdquo Engi-neering Mechanics vol 26 pp 178ndash183 2009
[9] Y Shi Z Li and H Hao ldquoMesh size effect in numericalsimulation of blast wave propagation and interaction withstructuresrdquo Transactions of Tianjin University vol 14 no 6pp 396ndash402 2008
[10] Y Shi Z-X Li and H Hao ldquoA new method for progressivecollapse analysis of RC frames under blast loadingrdquo Engi-neering Structures vol 32 no 6 pp 1691ndash1703 2010
[11] Y Shi H Hao and Z Li ldquoNumerical simulation of blast waveinteraction with structure columnsrdquo Shock Waves vol 17no 1-2 pp 111ndash123 2007
[12] X Gao and S Wang ldquoDeflection of architectural laminatedglasses under static and explosive loadsrdquo Journal of theChinese Ceramic Society vol 36 pp 1477ndash1483 2008
[13] Z Xudong Q Shaobo F Feng and Z Ximei ldquoExperimentaland numerical investigations of a single-layer reticulateddome subjected to external blast loadingrdquo EngineeringStructures vol 176 pp 103ndash114 2018
[14] X-B Zhi S-B Qi and F Fan ldquoTemporal and spatial pressuredistribution characteristics of hemispherical shell structuresubjected to external explosionrdquo in-Walled Structuresvol 137 pp 472ndash486 2019
[15] J Ma Z Xudong and F Fan e Study on Loading Field ofInner Blast inside the Shells e 13rd IASS ConferenceShenzhen China 2010 in Chinese
[16] J L Ma C Q Wu X D Zhi and F Fan ldquoPrediction ofconfined blast loading in single-layer lattice shellsrdquo Advancesin Structural Engineering vol 17 no 7 pp 1029ndash1043 2014
[17] J Ma F Fan C Wu and X Zhi ldquoCounter-intuitive collapseof single-layer reticulated domes subject to interior blastloadingrdquo in-Walled Structures vol 96 pp 130ndash138 2015
[18] J Ma F Fan L Zhang CWu and X Zhi ldquoFailure modes andfailure mechanisms of single-layer reticulated domes sub-jected to interior blastsrdquo in-Walled Structures vol 132pp 208ndash216 2018
[19] W E Baker Explosions in Air University of Texas PressAustin TX USA 1973
[20] Century Dynamics AUTODYN eory Manual RevisionVol 4 Century Dynamics Concord CA USA 2005
[21] I Edri V R Feldgun Y S Karinski and D Z YankelevskyldquoAfterburning aspects in an internal TNT explosionrdquo In-ternational Journal of Protective Structures vol 4 no 1pp 97ndash116 2013
[22] I Edri V R Feldgun Y S Karinski and D Z YankelevskyldquoOn blast pressure analysis due to a partially confined ex-plosion III Afterburning effectrdquo International Journal ofProtective Structures vol 3 no 3 pp 311ndash331 2012
[23] J Henrych e Dynamics of Explosion and its Use ElsevierScientific Pub Co Amsterdam Netherlands 1979
16 Shock and Vibration
International Journal of
AerospaceEngineeringHindawiwwwhindawicom Volume 2018
RoboticsJournal of
Hindawiwwwhindawicom Volume 2018
Hindawiwwwhindawicom Volume 2018
Active and Passive Electronic Components
VLSI Design
Hindawiwwwhindawicom Volume 2018
Hindawiwwwhindawicom Volume 2018
Shock and Vibration
Hindawiwwwhindawicom Volume 2018
Civil EngineeringAdvances in
Acoustics and VibrationAdvances in
Hindawiwwwhindawicom Volume 2018
Hindawiwwwhindawicom Volume 2018
Electrical and Computer Engineering
Journal of
Advances inOptoElectronics
Hindawiwwwhindawicom
Volume 2018
Hindawi Publishing Corporation httpwwwhindawicom Volume 2013Hindawiwwwhindawicom
The Scientific World Journal
Volume 2018
Control Scienceand Engineering
Journal of
Hindawiwwwhindawicom Volume 2018
Hindawiwwwhindawicom
Journal ofEngineeringVolume 2018
SensorsJournal of
Hindawiwwwhindawicom Volume 2018
International Journal of
RotatingMachinery
Hindawiwwwhindawicom Volume 2018
Modelling ampSimulationin EngineeringHindawiwwwhindawicom Volume 2018
Hindawiwwwhindawicom Volume 2018
Chemical EngineeringInternational Journal of Antennas and
Propagation
International Journal of
Hindawiwwwhindawicom Volume 2018
Hindawiwwwhindawicom Volume 2018
Navigation and Observation
International Journal of
Hindawi
wwwhindawicom Volume 2018
Advances in
Multimedia
Submit your manuscripts atwwwhindawicom

600O
verp
ress
ure (
kPa) 400
200
0
0 2 4 6 8 10
T2-3-P1
Time (ms)
(a)
800
Ove
rpre
ssur
e (kP
a)
400
600
200
0
0 2 4 6 8 10
T2-3-P5
Time (ms)
(b)
500
Ove
rpre
ssur
e (kP
a)
250
0
0 2 4 6 8 10
T2-3-P2
Time (ms)
(c)
500
Ove
rpre
ssur
e (kP
a)
250
0
0 2 4 6 8 10
T2-3-P4
Time (ms)
(d)
1800
Ove
rpre
ssur
e (kP
a) 1200
600
0
0 2 4 6 8 10
T2-3-P3
Time (ms)
(e)
Figure 8 Experiment data from scenario T2 (12 g TNT) (a) Test data from P1 (b) Test data from P5 (c) Test data from P2 (d) Test datafrom P4 (e) Test data from P3
6 Shock and Vibration
declining the durations of the blast pulses were much longerthan those in the other two tests for which the maximumone was almost 1ms long
33 Scenario T3 With the TNT equivalences increasingonly one experiment was conducted with 18 g because of theoperation restrictions of the blast tests e gauge dataplotted in Figure 9 shows that the first peak value from P3has obviously increased to 100025 kPa which is almost onthe same level as the second and third peaks Moreover thedurations are much shorter than the above data with only047ms for P3 almost half that of the durations of the abovetests is means that the waves reflected from differentdirections were coincidently superimposed together whichcould still be recognized as a slight time delay on therecorded curve In addition in this scenario the maximumfirst peak value is 100242 kPa from P1 which is slightlylarger than that of P3
34 Scenario T4 Four blast tests were conducted with sce-nario T4 However the explosives were not detonated com-pletely Some black explosive residue was left on the basementplane when the shell model was removed after the tests asshown in Figure 10Moreover the records from these two testsshow distinctly lower values than the others us they weretreated as valid data but are not presented in this paper
e overpressure curves in Figure 11 show that goodagreement was achieved between the other two tests es-pecially on the arrival time of the peak overpressures with aslight difference in the values e maximum first peak valueof 135536 kPa came from P5
35 Summary of Test Data In this subsection the above testdata are compared quantificationally Complicated propa-gations and reflections of the blast waves occurred duringthe interior blast tests erefore the maximum peak valuesfrom the tests are important but there is no meaning to acomparison with other test data is is because sometimestwo or more reflected waves merged together coincidentallywhich resulted in the maximum reflected value Howeverthe first peak pressure values from the tests could carry moreuseful information directly All of the first peak overpressuredata from each scenario are listed in Table 2
With an increase in the TNT equivalence the peakpressure values rapidly increased However with this generaltrend the record of 100025 kPa for scenario T3 from P3 isspecial because it is obviously larger than those of scenarioT4 Table 3 lists the impulses of the first 5ms blast loadingdata e increasing trends are much more obvious in thesedata and could explain the abnormal value for scenario T3e abnormal value could be related to two reflected peaksmerging coincidently and being recognized as one
4 Numerical Model and Verification
It should be noted that although the general trends for theoverpressure curves are consistent for the same scenario the
peak values are not identical e main reasons for thesedifferences are related to the TNT equivalences and posi-tions e blast propagation and reflection from an interiorsurface is a complicated process A tiny variation should leadto an evident difference in the results However it would beimpossible to see what happened inside the shell model evenif high-speed cameras were used because of the fireball andsmoke during the blast tests A numerical simulation is thebest way to determine what occurs inside the shell modeland it could be repeated many times with different scenarioswithout the high costs of blast tests
e blast propagation medium should be modelled innumerical simulation studies However three-dimensionalmodels are extraordinarily large is not only makes themtime-consuming to utilize but also lowers the precisionbecause of the computing power limitation which is notsuitable for a parametric analysis
Consequently a simplified method is proposed in thispaper based on the features of this problem e inner spaceof the rigid shell model is symmetric with a central axis asshown in Figure 12(a) In addition the explosives are det-onated in the center at ground level in all the scenariosreferenced above e three-dimensional model could besimplified into a two-dimensional model using theAUTODYN software package [20] as shown inFigure 12(b)
Euler elements were adopted to set up the numericalmodel A three-dimensional model could be obtained byrotating the two-dimensional model around the symmetryaxis e other boundaries were all rigid to consider therestriction of the 30mm steel shell In addition to simulatethe detonation platform in the middle of the basement plane(Figure 13) the unused elements in AUTODYN wereadopted to refine the rigid boundaries
e JonesndashWilkinsndashLee (JWL) equation of state wasused to simulate the TNT detonation process which isexpressed as follows [20]
p C1 1 minusω
r1v1113888 1113889e
minus r1v+ C2 1 minus
ωr2v
1113888 1113889eminus r2v
+ωe
v (2)
where C1 r1 C2 r2 ω and v are constants with the specificvalues listed in Table 4
e ideal gas equation of state was used to simulate thepropagationmedium of air [20] which could be expressed asthe GayndashLussac equation
p (c minus 1)ρe (3)
where ρ is the density of air and c is a constant equal to 14e four scenarios of the blast tests were simulated using
the parameters and model above Good agreement wasfound in comparisons Taking scenario T2 and T4 as ex-amples comparisons of the results of the tests and numericalsimulations are presented in the following subsections
41 Simulation of Scenario T2 Taking the simulation ofscenario T2 as an example the detonation and propagationprocesses are shown in Figure 14 It can be seen that the TNTdetonated in the center of the shell and the spherical shock
Shock and Vibration 7
waves quickly swelled as shown in Figures 14(a) and 14(b)e blast first crashed into and reflected of the side wall ofthe shell and then reached the top of the roof (Figure 14(c))
Reflected waves were generated and continually propagatedto different positions At the same time the first shock wavedirectly generated from the TNTalso arrived at the junction
1500
1000
Ove
rpre
ssur
e (kP
a)
500
0
0 2 4Time (ms)
T3-1-P1
6 8 10
(a)
1000
750
Ove
rpre
ssur
e (kP
a)
500
250
0
0 2 4Time (ms)
T3-1-P5
6 8 10
(b)
1000
750
Ove
rpre
ssur
e (kP
a)
500
250
0
0 2 4Time (ms)
6 8 10
T3-1-P2
(c)
800
600O
verp
ress
ure (
kPa)
400
200
0
0 2 4Time (ms)
T3-1-P4
6 8 10
(d)
1500
1000
Ove
rpre
ssur
e (kP
a)
500
0
0 2 4Time (ms)
6 8 10
T3-1-P3
(e)
Figure 9 Experiment data from scenario T3 (15 g TNT) (a) Test data from P1 (b) Test data from P5 (c) Test data from P2 (d) Test datafrom P4 (e) Test data from P3
8 Shock and Vibration
Figure 10 Residue from TNT after explosion
1500
Ove
rpre
ssur
e (kP
a) 1000
500
0
T4-1-P1T4-2-P1
0 2 4Time (ms)
6 8 10
(a)
2000
Ove
rpre
ssur
e (kP
a)1000
0
T4-1-P5T4-2-P5
0 2 4Time (ms)
6 8 10
(b)
1200
Ove
rpre
ssur
e (kP
a) 800
400
0
T4-1-P2T4-2-P2
0 2 4Time (ms)
6 8 10
(c)
1500
Ove
rpre
ssur
e (kP
a) 1000
500
0
T4-1-P4T4-2-P4
0 2 4Time (ms)
6 8 10
(d)
Figure 11 Continued
Shock and Vibration 9
1600
Ove
rpre
ssur
e (kP
a)
800
0
T4-1-P3T4-2-P3
0 2 4Time (ms)
6 8 10
(e)
Figure 11 Experiment data from scenario T4 (20 g TNT) (a) Test data from P1 (b) Test data from P5 (c) Test data from P2 (d) Test datafrom P4 (e) Test data from P3
Table 2 First peak overpressure from each scenario (units kPa)
5 g 10 g 15 g 20 gP1 15246 48238 7599 100242 117022 12272P2 18669 43345 31723 68277 53488 79232P3 14585 39675 34227 100025 76232 51853P4 23029 45164 28589 60837 99237 98889P5 24152 59155 66072 92886 115599 135536
Table 3 Impulse from each scenario (units kPamiddotms)
5 g 10 g 15 g 20 gP1 20581 54615 76882 97187 96160 117649P2 25659 48807 74981 84514 89015 125248P3 35598 84561 80316 83344 98025 57318P4 19163 49313 67097 84610 87514 187352P5 22632 53091 74777 87152 93315 119269
VoidAIRTNT
y
x
z
(a)
VoidAIRTNT
(b)
Figure 12 Simplified model for blast loading in curved shell structures (a) 3D numerical model and (b) 2D simplified numerical model
10 Shock and Vibration
VoidAIRTNT
y
x
z
Figure 13 Equivalent 3D model with detonation platform
Pressure (kPa)1796e + 03
1617e + 03
1439e + 03
1260e + 03
1081e + 03
9023e + 02
7235e + 02
5448e + 02
3660e + 02
1873e + 02
8527e + 00
(a)
Pressure (kPa)5174e + 02
4657e + 02
4140e + 02
3623e + 02
3105e + 02
2588e + 02
2071e + 02
1553e + 02
1036e + 02
5188e + 01
1496e ndash 01
(b)Pressure (kPa)
8541e + 02
7718e + 02
6895e + 02
6073e + 02
5250e + 02
4427e + 02
3604e + 02
2781e + 02
1959e + 02
1136e + 02
3129e + 01
(c)
1061e + 03
9589e + 02
8566e + 02
7543e + 02
6519e + 02
5496e + 02
4473e + 02
3450e + 02
2427e + 02
1404e + 02
3808e + 01
Pressure (kPa)
(d)
Figure 14 Continued
Table 4 Parameters of TNT
C1 (GPa) C2 (GPa) r1 r2 ω v (ms)374 375 415 090 035 6930
Shock and Vibration 11
between the roof and wall ese waves merged together andformed a new reflected wave (Figure 14(d)) is new re-flected wave rushed downward (Figures 14(e) and 14(f) andencountered a wave reflected from the ground whichgenerated the largest peak pressure on the top of the shell atposition P3 as shown in Figures 14(g) and 14(h))
e overpressure data from the specific positions of thegauges were output and plotted in the same figure tocompare with the test data in Figure 15 e overpressurecurves are plotted with solid lines with dashed lines used forthe impulses which were obtained by the integral of theoverpressure data In addition the black and red linesrepresent the test data and the blue lines are the simulationresults
From Figure 15 the simulation results are consistentwith the test data from the blast tests Especially for the firstreflected peak both the arrival times and shapes are the sameas those of the gauge recordings e subsequent reflected
peaks of the numerical simulations are slightly smaller thanthose of the tests while the arrival times of the subsequentpeaks are close to those of the tests is is mainly becausethe JWL equation of state cannot account for the energy ofthe afterburning effect [21 22] which involves a series ofcomplicated chemical reactions including some additionalcombustion processes of C CO H2 and so on Moreoverthe afterburning process occurred after the detonationwhich means the first values of reflected peaks were notaffected
42 Simulationof ScenarioT4 In comparison to the test dataof scenario T4 the simulation results had good agreementwith P1 and P5 As shown in Figure 16(a) the simulationcould well demonstrate the features of the whole trend peakreflected values impulses and arrival times for the firstreflected wave However the results of comparisons for
Pressure (kPa)6299e + 02
5732e + 02
5165e + 02
4597e + 02
4030e + 02
3463e + 02
2896e + 02
2329e + 02
1761e + 02
1194e + 02
6268e + 01
(e)
Pressure (kPa)1186e + 03
1075e + 03
9628e + 02
8510e + 02
7392e + 02
6274e + 02
5156e + 02
4038e + 02
2920e + 02
1802e + 02
6836e + 01
(f )Pressure (kPa)
6120e + 02
5588e + 02
5057e + 02
4525e + 02
3994e + 02
3463e + 02
2931e + 02
2400e + 02
1869e + 02
1337e + 02
8060e + 01
(g)
Pressure (kPa)1228e + 03
1113e + 03
9989e + 02
8844e + 02
7698e + 02
6553e + 02
5408e + 02
4262e + 02
3117e + 02
1971e + 02
8258e + 01
(h)
Figure 14 Evolution of pressure field in curved structure (a) 01ms (b) 03ms (c) 05ms (d) 07ms (e) 10ms (f ) 12ms (g) 14ms(h) 16ms
12 Shock and Vibration
positions P2 and P4 were not as good (Figure 16(b)) On theone hand the results of the test data had a distinct differencewith the recording from P2 obviously smaller than that ofP4 On the other hand there was a double peak for the firstreflected peak of P2 is might have been caused by theoriginal fixed position of the TNT which was quite sensitiveto the pressure fields Because the positions of P1 and P5were much further away the asymmetrical effects were notas obvious From Figure 16(c) it can be seen that the testdata are slightly smaller than the data of the simulations forthe first reflected peak as well as for the second oneHowever the general trends are quite similar
In addition it should be noted that the explosives used inthe numerical simulations had hemispherical shapes becauseof the limitations of the 2D model However TNT cubeswere used in the blast tests because these were much easierto cute effects of charge shapes are mainly reflected in thenear field of blast e study in this paper focused on the
interior blast loading of large-span spatial structures ofwhich the cases in this study are relating to far-field issueserefore in order to simplify the simulation procedure thehemispherical TNT was used From the comparison resultsit also illustrates that the effect of the TNT shape is not veryimportant with a relatively large-scaled distance
From the above comparisons of the simulation and testresults for two scenarios it can be determined that thenumerical simulation methods and parameters in AUTO-DYN are suitable for considering this interior blast problemand could be used for predicting the blast field in a shellstructure
5 Prediction from Parameter Analysis
e previously discussed blast tests and numerical simula-tions showed that the prediction process for blast loading iscomplicated making it inconvenient for engineers during
Ove
rpre
ssur
e (kP
a)
800
400
0
400
200
0
0 1 2 3
Impu
lse (k
Pamiddotm
s)
P-1P-5G-1
P-1P-5G-1
Time (ms)
(a)
Ove
rpre
ssur
e (kP
a)
800
400
0
Impu
lse (k
Pamiddotm
s)
400
200
0
0 1Time (ms)
2 3
P-2P-4G-2
(b)
Ove
rpre
ssur
e (kP
a)
2400
1600
800
0Im
pulse
(kPa
middotms)400
600
200
0
0 1 2 3
P-3G-3P-G-
Time (ms)
(c)
Figure 15 Comparisons between test data and numerical simulation data for scenario T2 Comparison between (a) test and simulation(P1 amp P5) (b) test and simulation (P2 amp P4) and (c) test and simulation (P3)
Shock and Vibration 13
the design period However most reticulated domes havesimilar interior spaces enclosed with a roof system supportwalls and a ground floor which means the blast loadingdistributions follow similar rules erefore based on thesimilarity law a detonation would generate self-similar blastwaves on the same-scaled distance within geometricallysimilar environments which represents a much simpler wayto obtain the blast field is means as shown in Figure 17that two spherical charges would generate blast loads withcertain relations which include the same peak pressures Inaddition both the impulses and durations differ by a factorof k where k is a constant based on the relationship betweenthe dimensions of the two charges Consequently the blastloading of a long-spatial structure could be deduced from asimilar small model based on the similarity law [23]
A system parametrical analysis was conducted with a10m span model According the convergence analysis inreference [16] 300-element in the radial direction of themodel is a suitable meshing scheme for this probleme 2D
model in the following sections includes more than01million Euler cells which are ranging from 6mm to16mm
By analyzing the distribution rules of blast loading threekey parameters varying rise-span ratio fL height-span ratioHL and scaled distance Z were distinguished as the mostinfluential ones e blast loading on the interior surfacesfrom parametrical analysis of the model are listed inTables 5ndash7
1600 800
600
400
200
0
1200
800
Ove
rpre
ssur
e (kP
a)
400
0
Impu
lse (k
Pamiddotm
s)
0 1Time (ms)
2 3
P-1P-5G-1
(a)
1200
800
Ove
rpre
ssur
e (kP
a)
600
400
200
0
Impu
lse (k
Pamiddotm
s)
400
0
0 1Time (ms)
2 3
P-2P-4G-2
(b)
Impu
lse (k
Pamiddotm
s)
1200
800
400
0
2400
1600
Ove
rpre
ssur
e (kP
a)
800
0
0 1Time (ms)
2
P-3G-3
(c)
Figure 16 Comparisons between test data and numerical simulation data of scenario T4 Comparison between (a) test and simulation(P1 amp P5) (b) test and simulation (P2 amp P4) and (c) test and simulation (P3)
d
kd
R
P I
kI
kta
taP
kR
Figure 17 Similarity law of blast
14 Shock and Vibration
is study is aimed on dealing with the blast loading for awider scope of spatial structures of which the specificintershapes are various erefore a series of simulationswere conducted for those typical intershapes of spatialstructures in Tables 5ndash7 By using the method proposed inreference [16] the data obtained from the standard modelscould be used to deduce similar blast distributions for large-span structures erefore the blast loads of other issuescould be predicted quickly with these similar data withoutexecuting blast tests and simulations e predicted blastloading could be used as the suggestion for structural design
6 Conclusions
Confined blast tests were conducted with an almost rigidcurved shell model to determine the blast pressure fieldswithin a reticulated dome e blast data of the pressure-time histories were recorded using PCB gauges at five typicalpositions Four scenarios with different TNT equivalenceswere used and the pressure fields in the curved shell modelwere compared e overpressures and impulses of the firstpeak for each scenario were compared and studied eresults showed that the first peaks had obvious regularitywhen the TNT equivalence was changed whereas the sub-sequent blast loading peaks did not which was caused by thecomplicated evolution process for the shock wave fields inthe confined blast In addition a simplified method for thenumerical simulation of blast loading was introduced eblast scenarios were simulated and verified using the testdata e dynamic evolution of the blast propagation andreflection processes was effectively explored by the nu-merical simulations with the contour plots observed indetail using AUTODYN Finally a parameter analysis of theblast loading was conducted with some key parametersvaried within a reasonable scope Based on these results theinterior blast loading at the important positions of other
reticulated domes could conveniently be predicted using theexisting data which could be used in the protective designand rapid assessment of the reticulated domes
Data Availability
e data used to support the findings of this study areavailable from the corresponding author upon request
Conflicts of Interest
e authors declare that they have no conflicts of interest
Acknowledgments
e research presented in this paper was jointly supportedby the National Natural Science Foundation of China (grantno 51708521) and Foundation of Key Laboratory ofStructures Dynamic Behavior and Control (Ministry ofEducation) in Harbin Institute of Technology of China(grant no HITCE201803) e first author would also like toexpress the sincere acknowledgements to Prof YadongZhang and Hengbo Xiang for their suggestions and help onthe blast tests
References
[1] UFC 3-340-02 Structures to Resist the Effects of AccidentalExplosions UFC Departments of the Army the Navy and theAir Force Las Vegas NV USA 2008
[2] Y Hu C Wu M Lukaszewicz J Dragos J Ren andM Haskett ldquoCharacteristics of confined blast loading inunvented structuresrdquo International Journal of ProtectiveStructures vol 2 no 1 pp 21ndash43 2011
[3] C Wu M Lukaszewicz K Schebella and L AntanovskiildquoExperimental and numerical investigation of confined
Table 5 Results of parameter analysis with different scaled distances
Z (mmiddotkgminus 13)23 25 29 4 5
I (kPamiddotms) P (kPa) I (kPamiddotms) P (kPa) I (kPamiddotms) P (kPa) I (kPamiddotms) P (kPa) I (kPamiddotms) P (kPa)Top 10175 7504 8354 5909 5717 3829 2769 1810 1655 1111Corner 6893 7137 5665 5696 3844 3775 1727 1789 973 1100
Table 6 Results of parameter analysis with different rise-span ratios
fL0 0125 02 025 05
I (kPamiddotms) P (kPa) I (kPamiddotms) P (kPa) I (kPamiddotms) P (kPa) I (kPamiddotms) P (kPa) I (kPamiddotms) P (kPa)Top 7185 4674 6464 3868 5717 3829 5384 3970 5227 3876Corner 2969 3993 3595 3981 3844 3775 4170 3780 5265 3955
Table 7 Results of parameter analysis with different height-span ratios
HL04 045 05 055 06
I (kPamiddotms) P (kPa) I (kPamiddotms) P (kPa) I (kPamiddotms) P (kPa) I (kPamiddotms) P (kPa) I (kPamiddotms) P (kPa)Top 3453 2535 4580 3104 5717 3829 6808 3985 8138 4745Corner 2491 3752 3280 3814 3844 3775 4690 3771 5648 3802
Shock and Vibration 15
explosion in a blast chamberrdquo Journal of Loss Prevention in theProcess Industries vol 26 no 4 pp 737ndash750 2013
[4] C Wu G Fattori A Whittaker and D J Oehlers ldquoIn-vestigation of air-blast effects from spherical-and cylindrical-shaped chargesrdquo International Journal of Protective Struc-tures vol 1 no 3 pp 345ndash362 2010
[5] C Wu and H Hao ldquoModeling of simultaneous groundshock and airblast pressure on nearby structures fromsurface explosionsrdquo International Journal of Impact Engi-neering vol 31 no 6 pp 699ndash717 2005
[6] S Yang Q Fang Y Zhang et al ldquoA numerical method ofcalculating the consequence of heterogeneous mixed vaporcloud explosionrdquo Natural Gas Industry vol 34 pp 155ndash1612014 in Chinese
[7] Q Bao Q Fang Y Zhang L Chen S Yang and Z Li ldquoEffectsof gas concentration and venting pressure on overpressuretransients during vented explosion of methane-air mixturesrdquoFuel vol 175 pp 40ndash48 2016
[8] Z Li Y Shi and H Zhou ldquoPropagation law and overpressureload of blast wave in urban compels environmentrdquo Engi-neering Mechanics vol 26 pp 178ndash183 2009
[9] Y Shi Z Li and H Hao ldquoMesh size effect in numericalsimulation of blast wave propagation and interaction withstructuresrdquo Transactions of Tianjin University vol 14 no 6pp 396ndash402 2008
[10] Y Shi Z-X Li and H Hao ldquoA new method for progressivecollapse analysis of RC frames under blast loadingrdquo Engi-neering Structures vol 32 no 6 pp 1691ndash1703 2010
[11] Y Shi H Hao and Z Li ldquoNumerical simulation of blast waveinteraction with structure columnsrdquo Shock Waves vol 17no 1-2 pp 111ndash123 2007
[12] X Gao and S Wang ldquoDeflection of architectural laminatedglasses under static and explosive loadsrdquo Journal of theChinese Ceramic Society vol 36 pp 1477ndash1483 2008
[13] Z Xudong Q Shaobo F Feng and Z Ximei ldquoExperimentaland numerical investigations of a single-layer reticulateddome subjected to external blast loadingrdquo EngineeringStructures vol 176 pp 103ndash114 2018
[14] X-B Zhi S-B Qi and F Fan ldquoTemporal and spatial pressuredistribution characteristics of hemispherical shell structuresubjected to external explosionrdquo in-Walled Structuresvol 137 pp 472ndash486 2019
[15] J Ma Z Xudong and F Fan e Study on Loading Field ofInner Blast inside the Shells e 13rd IASS ConferenceShenzhen China 2010 in Chinese
[16] J L Ma C Q Wu X D Zhi and F Fan ldquoPrediction ofconfined blast loading in single-layer lattice shellsrdquo Advancesin Structural Engineering vol 17 no 7 pp 1029ndash1043 2014
[17] J Ma F Fan C Wu and X Zhi ldquoCounter-intuitive collapseof single-layer reticulated domes subject to interior blastloadingrdquo in-Walled Structures vol 96 pp 130ndash138 2015
[18] J Ma F Fan L Zhang CWu and X Zhi ldquoFailure modes andfailure mechanisms of single-layer reticulated domes sub-jected to interior blastsrdquo in-Walled Structures vol 132pp 208ndash216 2018
[19] W E Baker Explosions in Air University of Texas PressAustin TX USA 1973
[20] Century Dynamics AUTODYN eory Manual RevisionVol 4 Century Dynamics Concord CA USA 2005
[21] I Edri V R Feldgun Y S Karinski and D Z YankelevskyldquoAfterburning aspects in an internal TNT explosionrdquo In-ternational Journal of Protective Structures vol 4 no 1pp 97ndash116 2013
[22] I Edri V R Feldgun Y S Karinski and D Z YankelevskyldquoOn blast pressure analysis due to a partially confined ex-plosion III Afterburning effectrdquo International Journal ofProtective Structures vol 3 no 3 pp 311ndash331 2012
[23] J Henrych e Dynamics of Explosion and its Use ElsevierScientific Pub Co Amsterdam Netherlands 1979
16 Shock and Vibration
International Journal of
AerospaceEngineeringHindawiwwwhindawicom Volume 2018
RoboticsJournal of
Hindawiwwwhindawicom Volume 2018
Hindawiwwwhindawicom Volume 2018
Active and Passive Electronic Components
VLSI Design
Hindawiwwwhindawicom Volume 2018
Hindawiwwwhindawicom Volume 2018
Shock and Vibration
Hindawiwwwhindawicom Volume 2018
Civil EngineeringAdvances in
Acoustics and VibrationAdvances in
Hindawiwwwhindawicom Volume 2018
Hindawiwwwhindawicom Volume 2018
Electrical and Computer Engineering
Journal of
Advances inOptoElectronics
Hindawiwwwhindawicom
Volume 2018
Hindawi Publishing Corporation httpwwwhindawicom Volume 2013Hindawiwwwhindawicom
The Scientific World Journal
Volume 2018
Control Scienceand Engineering
Journal of
Hindawiwwwhindawicom Volume 2018
Hindawiwwwhindawicom
Journal ofEngineeringVolume 2018
SensorsJournal of
Hindawiwwwhindawicom Volume 2018
International Journal of
RotatingMachinery
Hindawiwwwhindawicom Volume 2018
Modelling ampSimulationin EngineeringHindawiwwwhindawicom Volume 2018
Hindawiwwwhindawicom Volume 2018
Chemical EngineeringInternational Journal of Antennas and
Propagation
International Journal of
Hindawiwwwhindawicom Volume 2018
Hindawiwwwhindawicom Volume 2018
Navigation and Observation
International Journal of
Hindawi
wwwhindawicom Volume 2018
Advances in
Multimedia
Submit your manuscripts atwwwhindawicom

1600
Ove
rpre
ssur
e (kP
a)
800
0
T4-1-P3T4-2-P3
0 2 4Time (ms)
6 8 10
(e)
Figure 11 Experiment data from scenario T4 (20 g TNT) (a) Test data from P1 (b) Test data from P5 (c) Test data from P2 (d) Test datafrom P4 (e) Test data from P3
Table 2 First peak overpressure from each scenario (units kPa)
5 g 10 g 15 g 20 gP1 15246 48238 7599 100242 117022 12272P2 18669 43345 31723 68277 53488 79232P3 14585 39675 34227 100025 76232 51853P4 23029 45164 28589 60837 99237 98889P5 24152 59155 66072 92886 115599 135536
Table 3 Impulse from each scenario (units kPamiddotms)
5 g 10 g 15 g 20 gP1 20581 54615 76882 97187 96160 117649P2 25659 48807 74981 84514 89015 125248P3 35598 84561 80316 83344 98025 57318P4 19163 49313 67097 84610 87514 187352P5 22632 53091 74777 87152 93315 119269
VoidAIRTNT
y
x
z
(a)
VoidAIRTNT
(b)
Figure 12 Simplified model for blast loading in curved shell structures (a) 3D numerical model and (b) 2D simplified numerical model
10 Shock and Vibration
VoidAIRTNT
y
x
z
Figure 13 Equivalent 3D model with detonation platform
Pressure (kPa)1796e + 03
1617e + 03
1439e + 03
1260e + 03
1081e + 03
9023e + 02
7235e + 02
5448e + 02
3660e + 02
1873e + 02
8527e + 00
(a)
Pressure (kPa)5174e + 02
4657e + 02
4140e + 02
3623e + 02
3105e + 02
2588e + 02
2071e + 02
1553e + 02
1036e + 02
5188e + 01
1496e ndash 01
(b)Pressure (kPa)
8541e + 02
7718e + 02
6895e + 02
6073e + 02
5250e + 02
4427e + 02
3604e + 02
2781e + 02
1959e + 02
1136e + 02
3129e + 01
(c)
1061e + 03
9589e + 02
8566e + 02
7543e + 02
6519e + 02
5496e + 02
4473e + 02
3450e + 02
2427e + 02
1404e + 02
3808e + 01
Pressure (kPa)
(d)
Figure 14 Continued
Table 4 Parameters of TNT
C1 (GPa) C2 (GPa) r1 r2 ω v (ms)374 375 415 090 035 6930
Shock and Vibration 11
between the roof and wall ese waves merged together andformed a new reflected wave (Figure 14(d)) is new re-flected wave rushed downward (Figures 14(e) and 14(f) andencountered a wave reflected from the ground whichgenerated the largest peak pressure on the top of the shell atposition P3 as shown in Figures 14(g) and 14(h))
e overpressure data from the specific positions of thegauges were output and plotted in the same figure tocompare with the test data in Figure 15 e overpressurecurves are plotted with solid lines with dashed lines used forthe impulses which were obtained by the integral of theoverpressure data In addition the black and red linesrepresent the test data and the blue lines are the simulationresults
From Figure 15 the simulation results are consistentwith the test data from the blast tests Especially for the firstreflected peak both the arrival times and shapes are the sameas those of the gauge recordings e subsequent reflected
peaks of the numerical simulations are slightly smaller thanthose of the tests while the arrival times of the subsequentpeaks are close to those of the tests is is mainly becausethe JWL equation of state cannot account for the energy ofthe afterburning effect [21 22] which involves a series ofcomplicated chemical reactions including some additionalcombustion processes of C CO H2 and so on Moreoverthe afterburning process occurred after the detonationwhich means the first values of reflected peaks were notaffected
42 Simulationof ScenarioT4 In comparison to the test dataof scenario T4 the simulation results had good agreementwith P1 and P5 As shown in Figure 16(a) the simulationcould well demonstrate the features of the whole trend peakreflected values impulses and arrival times for the firstreflected wave However the results of comparisons for
Pressure (kPa)6299e + 02
5732e + 02
5165e + 02
4597e + 02
4030e + 02
3463e + 02
2896e + 02
2329e + 02
1761e + 02
1194e + 02
6268e + 01
(e)
Pressure (kPa)1186e + 03
1075e + 03
9628e + 02
8510e + 02
7392e + 02
6274e + 02
5156e + 02
4038e + 02
2920e + 02
1802e + 02
6836e + 01
(f )Pressure (kPa)
6120e + 02
5588e + 02
5057e + 02
4525e + 02
3994e + 02
3463e + 02
2931e + 02
2400e + 02
1869e + 02
1337e + 02
8060e + 01
(g)
Pressure (kPa)1228e + 03
1113e + 03
9989e + 02
8844e + 02
7698e + 02
6553e + 02
5408e + 02
4262e + 02
3117e + 02
1971e + 02
8258e + 01
(h)
Figure 14 Evolution of pressure field in curved structure (a) 01ms (b) 03ms (c) 05ms (d) 07ms (e) 10ms (f ) 12ms (g) 14ms(h) 16ms
12 Shock and Vibration
positions P2 and P4 were not as good (Figure 16(b)) On theone hand the results of the test data had a distinct differencewith the recording from P2 obviously smaller than that ofP4 On the other hand there was a double peak for the firstreflected peak of P2 is might have been caused by theoriginal fixed position of the TNT which was quite sensitiveto the pressure fields Because the positions of P1 and P5were much further away the asymmetrical effects were notas obvious From Figure 16(c) it can be seen that the testdata are slightly smaller than the data of the simulations forthe first reflected peak as well as for the second oneHowever the general trends are quite similar
In addition it should be noted that the explosives used inthe numerical simulations had hemispherical shapes becauseof the limitations of the 2D model However TNT cubeswere used in the blast tests because these were much easierto cute effects of charge shapes are mainly reflected in thenear field of blast e study in this paper focused on the
interior blast loading of large-span spatial structures ofwhich the cases in this study are relating to far-field issueserefore in order to simplify the simulation procedure thehemispherical TNT was used From the comparison resultsit also illustrates that the effect of the TNT shape is not veryimportant with a relatively large-scaled distance
From the above comparisons of the simulation and testresults for two scenarios it can be determined that thenumerical simulation methods and parameters in AUTO-DYN are suitable for considering this interior blast problemand could be used for predicting the blast field in a shellstructure
5 Prediction from Parameter Analysis
e previously discussed blast tests and numerical simula-tions showed that the prediction process for blast loading iscomplicated making it inconvenient for engineers during
Ove
rpre
ssur
e (kP
a)
800
400
0
400
200
0
0 1 2 3
Impu
lse (k
Pamiddotm
s)
P-1P-5G-1
P-1P-5G-1
Time (ms)
(a)
Ove
rpre
ssur
e (kP
a)
800
400
0
Impu
lse (k
Pamiddotm
s)
400
200
0
0 1Time (ms)
2 3
P-2P-4G-2
(b)
Ove
rpre
ssur
e (kP
a)
2400
1600
800
0Im
pulse
(kPa
middotms)400
600
200
0
0 1 2 3
P-3G-3P-G-
Time (ms)
(c)
Figure 15 Comparisons between test data and numerical simulation data for scenario T2 Comparison between (a) test and simulation(P1 amp P5) (b) test and simulation (P2 amp P4) and (c) test and simulation (P3)
Shock and Vibration 13
the design period However most reticulated domes havesimilar interior spaces enclosed with a roof system supportwalls and a ground floor which means the blast loadingdistributions follow similar rules erefore based on thesimilarity law a detonation would generate self-similar blastwaves on the same-scaled distance within geometricallysimilar environments which represents a much simpler wayto obtain the blast field is means as shown in Figure 17that two spherical charges would generate blast loads withcertain relations which include the same peak pressures Inaddition both the impulses and durations differ by a factorof k where k is a constant based on the relationship betweenthe dimensions of the two charges Consequently the blastloading of a long-spatial structure could be deduced from asimilar small model based on the similarity law [23]
A system parametrical analysis was conducted with a10m span model According the convergence analysis inreference [16] 300-element in the radial direction of themodel is a suitable meshing scheme for this probleme 2D
model in the following sections includes more than01million Euler cells which are ranging from 6mm to16mm
By analyzing the distribution rules of blast loading threekey parameters varying rise-span ratio fL height-span ratioHL and scaled distance Z were distinguished as the mostinfluential ones e blast loading on the interior surfacesfrom parametrical analysis of the model are listed inTables 5ndash7
1600 800
600
400
200
0
1200
800
Ove
rpre
ssur
e (kP
a)
400
0
Impu
lse (k
Pamiddotm
s)
0 1Time (ms)
2 3
P-1P-5G-1
(a)
1200
800
Ove
rpre
ssur
e (kP
a)
600
400
200
0
Impu
lse (k
Pamiddotm
s)
400
0
0 1Time (ms)
2 3
P-2P-4G-2
(b)
Impu
lse (k
Pamiddotm
s)
1200
800
400
0
2400
1600
Ove
rpre
ssur
e (kP
a)
800
0
0 1Time (ms)
2
P-3G-3
(c)
Figure 16 Comparisons between test data and numerical simulation data of scenario T4 Comparison between (a) test and simulation(P1 amp P5) (b) test and simulation (P2 amp P4) and (c) test and simulation (P3)
d
kd
R
P I
kI
kta
taP
kR
Figure 17 Similarity law of blast
14 Shock and Vibration
is study is aimed on dealing with the blast loading for awider scope of spatial structures of which the specificintershapes are various erefore a series of simulationswere conducted for those typical intershapes of spatialstructures in Tables 5ndash7 By using the method proposed inreference [16] the data obtained from the standard modelscould be used to deduce similar blast distributions for large-span structures erefore the blast loads of other issuescould be predicted quickly with these similar data withoutexecuting blast tests and simulations e predicted blastloading could be used as the suggestion for structural design
6 Conclusions
Confined blast tests were conducted with an almost rigidcurved shell model to determine the blast pressure fieldswithin a reticulated dome e blast data of the pressure-time histories were recorded using PCB gauges at five typicalpositions Four scenarios with different TNT equivalenceswere used and the pressure fields in the curved shell modelwere compared e overpressures and impulses of the firstpeak for each scenario were compared and studied eresults showed that the first peaks had obvious regularitywhen the TNT equivalence was changed whereas the sub-sequent blast loading peaks did not which was caused by thecomplicated evolution process for the shock wave fields inthe confined blast In addition a simplified method for thenumerical simulation of blast loading was introduced eblast scenarios were simulated and verified using the testdata e dynamic evolution of the blast propagation andreflection processes was effectively explored by the nu-merical simulations with the contour plots observed indetail using AUTODYN Finally a parameter analysis of theblast loading was conducted with some key parametersvaried within a reasonable scope Based on these results theinterior blast loading at the important positions of other
reticulated domes could conveniently be predicted using theexisting data which could be used in the protective designand rapid assessment of the reticulated domes
Data Availability
e data used to support the findings of this study areavailable from the corresponding author upon request
Conflicts of Interest
e authors declare that they have no conflicts of interest
Acknowledgments
e research presented in this paper was jointly supportedby the National Natural Science Foundation of China (grantno 51708521) and Foundation of Key Laboratory ofStructures Dynamic Behavior and Control (Ministry ofEducation) in Harbin Institute of Technology of China(grant no HITCE201803) e first author would also like toexpress the sincere acknowledgements to Prof YadongZhang and Hengbo Xiang for their suggestions and help onthe blast tests
References
[1] UFC 3-340-02 Structures to Resist the Effects of AccidentalExplosions UFC Departments of the Army the Navy and theAir Force Las Vegas NV USA 2008
[2] Y Hu C Wu M Lukaszewicz J Dragos J Ren andM Haskett ldquoCharacteristics of confined blast loading inunvented structuresrdquo International Journal of ProtectiveStructures vol 2 no 1 pp 21ndash43 2011
[3] C Wu M Lukaszewicz K Schebella and L AntanovskiildquoExperimental and numerical investigation of confined
Table 5 Results of parameter analysis with different scaled distances
Z (mmiddotkgminus 13)23 25 29 4 5
I (kPamiddotms) P (kPa) I (kPamiddotms) P (kPa) I (kPamiddotms) P (kPa) I (kPamiddotms) P (kPa) I (kPamiddotms) P (kPa)Top 10175 7504 8354 5909 5717 3829 2769 1810 1655 1111Corner 6893 7137 5665 5696 3844 3775 1727 1789 973 1100
Table 6 Results of parameter analysis with different rise-span ratios
fL0 0125 02 025 05
I (kPamiddotms) P (kPa) I (kPamiddotms) P (kPa) I (kPamiddotms) P (kPa) I (kPamiddotms) P (kPa) I (kPamiddotms) P (kPa)Top 7185 4674 6464 3868 5717 3829 5384 3970 5227 3876Corner 2969 3993 3595 3981 3844 3775 4170 3780 5265 3955
Table 7 Results of parameter analysis with different height-span ratios
HL04 045 05 055 06
I (kPamiddotms) P (kPa) I (kPamiddotms) P (kPa) I (kPamiddotms) P (kPa) I (kPamiddotms) P (kPa) I (kPamiddotms) P (kPa)Top 3453 2535 4580 3104 5717 3829 6808 3985 8138 4745Corner 2491 3752 3280 3814 3844 3775 4690 3771 5648 3802
Shock and Vibration 15
explosion in a blast chamberrdquo Journal of Loss Prevention in theProcess Industries vol 26 no 4 pp 737ndash750 2013
[4] C Wu G Fattori A Whittaker and D J Oehlers ldquoIn-vestigation of air-blast effects from spherical-and cylindrical-shaped chargesrdquo International Journal of Protective Struc-tures vol 1 no 3 pp 345ndash362 2010
[5] C Wu and H Hao ldquoModeling of simultaneous groundshock and airblast pressure on nearby structures fromsurface explosionsrdquo International Journal of Impact Engi-neering vol 31 no 6 pp 699ndash717 2005
[6] S Yang Q Fang Y Zhang et al ldquoA numerical method ofcalculating the consequence of heterogeneous mixed vaporcloud explosionrdquo Natural Gas Industry vol 34 pp 155ndash1612014 in Chinese
[7] Q Bao Q Fang Y Zhang L Chen S Yang and Z Li ldquoEffectsof gas concentration and venting pressure on overpressuretransients during vented explosion of methane-air mixturesrdquoFuel vol 175 pp 40ndash48 2016
[8] Z Li Y Shi and H Zhou ldquoPropagation law and overpressureload of blast wave in urban compels environmentrdquo Engi-neering Mechanics vol 26 pp 178ndash183 2009
[9] Y Shi Z Li and H Hao ldquoMesh size effect in numericalsimulation of blast wave propagation and interaction withstructuresrdquo Transactions of Tianjin University vol 14 no 6pp 396ndash402 2008
[10] Y Shi Z-X Li and H Hao ldquoA new method for progressivecollapse analysis of RC frames under blast loadingrdquo Engi-neering Structures vol 32 no 6 pp 1691ndash1703 2010
[11] Y Shi H Hao and Z Li ldquoNumerical simulation of blast waveinteraction with structure columnsrdquo Shock Waves vol 17no 1-2 pp 111ndash123 2007
[12] X Gao and S Wang ldquoDeflection of architectural laminatedglasses under static and explosive loadsrdquo Journal of theChinese Ceramic Society vol 36 pp 1477ndash1483 2008
[13] Z Xudong Q Shaobo F Feng and Z Ximei ldquoExperimentaland numerical investigations of a single-layer reticulateddome subjected to external blast loadingrdquo EngineeringStructures vol 176 pp 103ndash114 2018
[14] X-B Zhi S-B Qi and F Fan ldquoTemporal and spatial pressuredistribution characteristics of hemispherical shell structuresubjected to external explosionrdquo in-Walled Structuresvol 137 pp 472ndash486 2019
[15] J Ma Z Xudong and F Fan e Study on Loading Field ofInner Blast inside the Shells e 13rd IASS ConferenceShenzhen China 2010 in Chinese
[16] J L Ma C Q Wu X D Zhi and F Fan ldquoPrediction ofconfined blast loading in single-layer lattice shellsrdquo Advancesin Structural Engineering vol 17 no 7 pp 1029ndash1043 2014
[17] J Ma F Fan C Wu and X Zhi ldquoCounter-intuitive collapseof single-layer reticulated domes subject to interior blastloadingrdquo in-Walled Structures vol 96 pp 130ndash138 2015
[18] J Ma F Fan L Zhang CWu and X Zhi ldquoFailure modes andfailure mechanisms of single-layer reticulated domes sub-jected to interior blastsrdquo in-Walled Structures vol 132pp 208ndash216 2018
[19] W E Baker Explosions in Air University of Texas PressAustin TX USA 1973
[20] Century Dynamics AUTODYN eory Manual RevisionVol 4 Century Dynamics Concord CA USA 2005
[21] I Edri V R Feldgun Y S Karinski and D Z YankelevskyldquoAfterburning aspects in an internal TNT explosionrdquo In-ternational Journal of Protective Structures vol 4 no 1pp 97ndash116 2013
[22] I Edri V R Feldgun Y S Karinski and D Z YankelevskyldquoOn blast pressure analysis due to a partially confined ex-plosion III Afterburning effectrdquo International Journal ofProtective Structures vol 3 no 3 pp 311ndash331 2012
[23] J Henrych e Dynamics of Explosion and its Use ElsevierScientific Pub Co Amsterdam Netherlands 1979
16 Shock and Vibration
International Journal of
AerospaceEngineeringHindawiwwwhindawicom Volume 2018
RoboticsJournal of
Hindawiwwwhindawicom Volume 2018
Hindawiwwwhindawicom Volume 2018
Active and Passive Electronic Components
VLSI Design
Hindawiwwwhindawicom Volume 2018
Hindawiwwwhindawicom Volume 2018
Shock and Vibration
Hindawiwwwhindawicom Volume 2018
Civil EngineeringAdvances in
Acoustics and VibrationAdvances in
Hindawiwwwhindawicom Volume 2018
Hindawiwwwhindawicom Volume 2018
Electrical and Computer Engineering
Journal of
Advances inOptoElectronics
Hindawiwwwhindawicom
Volume 2018
Hindawi Publishing Corporation httpwwwhindawicom Volume 2013Hindawiwwwhindawicom
The Scientific World Journal
Volume 2018
Control Scienceand Engineering
Journal of
Hindawiwwwhindawicom Volume 2018
Hindawiwwwhindawicom
Journal ofEngineeringVolume 2018
SensorsJournal of
Hindawiwwwhindawicom Volume 2018
International Journal of
RotatingMachinery
Hindawiwwwhindawicom Volume 2018
Modelling ampSimulationin EngineeringHindawiwwwhindawicom Volume 2018
Hindawiwwwhindawicom Volume 2018
Chemical EngineeringInternational Journal of Antennas and
Propagation
International Journal of
Hindawiwwwhindawicom Volume 2018
Hindawiwwwhindawicom Volume 2018
Navigation and Observation
International Journal of
Hindawi
wwwhindawicom Volume 2018
Advances in
Multimedia
Submit your manuscripts atwwwhindawicom

International Journal of
AerospaceEngineeringHindawiwwwhindawicom Volume 2018
RoboticsJournal of
Hindawiwwwhindawicom Volume 2018
Hindawiwwwhindawicom Volume 2018
Active and Passive Electronic Components
VLSI Design
Hindawiwwwhindawicom Volume 2018
Hindawiwwwhindawicom Volume 2018
Shock and Vibration
Hindawiwwwhindawicom Volume 2018
Civil EngineeringAdvances in
Acoustics and VibrationAdvances in
Hindawiwwwhindawicom Volume 2018
Hindawiwwwhindawicom Volume 2018
Electrical and Computer Engineering
Journal of
Advances inOptoElectronics
Hindawiwwwhindawicom
Volume 2018
Hindawi Publishing Corporation httpwwwhindawicom Volume 2013Hindawiwwwhindawicom
The Scientific World Journal
Volume 2018
Control Scienceand Engineering
Journal of
Hindawiwwwhindawicom Volume 2018
Hindawiwwwhindawicom
Journal ofEngineeringVolume 2018
SensorsJournal of
Hindawiwwwhindawicom Volume 2018
International Journal of
RotatingMachinery
Hindawiwwwhindawicom Volume 2018
Modelling ampSimulationin EngineeringHindawiwwwhindawicom Volume 2018
Hindawiwwwhindawicom Volume 2018
Chemical EngineeringInternational Journal of Antennas and
Propagation
International Journal of
Hindawiwwwhindawicom Volume 2018
Hindawiwwwhindawicom Volume 2018
Navigation and Observation
International Journal of
Hindawi
wwwhindawicom Volume 2018
Advances in
Multimedia
Submit your manuscripts atwwwhindawicom