Embed Size (px)
DESCRIPTION
Experimental and numerical investigation of photovoltaic solar modules (PVSMs) performance via continuous water cooling technique (CCT) and intermittent water cooling techniques (ICT) has been investigated in present work. A New cooling technique had submitted for the (PVSM) as compared to previous works. In addition to analyze the enhancement for (PVSMs) temperature, cooling rate, output power, output energy, fill factor, and electrical efficiency. Experimental data were tabulated of (PVSMs) for both cooling techniques. A mathematical model for (PVSMs) were formulated. MATLAB code has been developed and written to solve mathematical model.
Citation preview
http://www.iaeme.com/IJMET/index.asp 87 [email protected]
International Journal of Mechanical Engineering and Technology (IJMET) Volume 6, Issue 7, Jul 2015, pp. 87-98, Article ID: IJMET_06_07_011
Available online at
http://www.iaeme.com/IJMET/issues.asp?JTypeIJMET&VType=6&IType=7
ISSN Print: 0976-6340 and ISSN Online: 0976-6359
© IAEME Publication
___________________________________________________________________________
EXPERIMENTAL AND NUMERICAL
INVESTIGATION OF PHOTO-VOLTAIC
MODULE PERFORMANCE VIA
CONTINUOUS AND INTERMITTENT
WATER COOLING TECHNIQUES
Ali M. Rasham, Hussein K. Jobair and Akram A. Abood Alkhazzar
Department of Energy Engineering / College of Engineering University of Baghdad
ABSTRACT
Experimental and numerical investigation of photovoltaic solar modules
(PVSMs) performance via continuous water cooling technique (CCT) and
intermittent water cooling techniques (ICT) has been investigated in present
work. A New cooling technique had submitted for the (PVSM) as compared to
previous works. In addition to analyze the enhancement for (PVSMs)
temperature, cooling rate, output power, output energy, fill factor, and
electrical efficiency. Experimental data were tabulated of (PVSMs) for both
cooling techniques. A mathematical model for (PVSMs) were formulated.
MATLAB code has been developed and written to solve mathematical model.
Numerical integration of (1/3) Simpson's rule was used to estimate the energy
enhancement. The average values of cooling rate for (ICT), and (CCT) were
(3.4804 ℃ ��� )⁄ and (3.1617 ℃ ��� )⁄ respectively, than for non-cooling
(PVSM). the enhancement of the output power, fill factor, electrical efficiency
for (ICT), and (CCT) were (7.349 %) and (5.587 %), (6.313 %) and (2.630 %),
(8.389 %) and (6.826 %) respectively, than for non-cooling (PVSM). The energy
enhancement for (ICT) was (6. 308 %) for current work. By contrast, there were
losses in energy for (CCT). Consequently, According to the obtained results,
the enhancement for all parameters mentioned above were the better for (ICT)
than for (CCT).
Key words: Optimisation of Solar Cells, Film Cooling, Cooling System of
Solar Cells, Increasing Efficiency of Photovoltaic, Performance Enhancement
of PV Solar Cells.
Cite this Article: Rasham, A. M., Jobair, H. K. and Alkhazzar, A. A. A.
Experimental and Numerical Investigation of Photo-Voltaic Module
Performance via Continuous and Intermittent Water Cooling Techniques.
International Journal of Mechanical Engineering and Technology, 6(7), 2015,
Ali M. Rasham, Hussein K. Jobair and Akram A. Abood Alkhazzar
http://www.iaeme.com/IJMET/index.asp 88 [email protected]
pp. 87-98.
http://www.iaeme.com/IJMET/issues.asp?JTypeIJMET&VType=6&IType=7
_____________________________________________________________________
1. INTRODUCTION
Iraq was began to use renewable energy resources especially, with the successive
depletion of conventional resources. The burning of conventional fossil fuels leads to
atmosphere Pollution. In Iraq, abundance of land and sunny weather made it a good
resource for solar energy applications. Consequently, renewable energy systems has
become a good alternative way to facing this crisis. Solar photovoltaic systems have
solution for the energy demand, which converts solar radiation into direct current
electricity using semiconductors that display the Photovoltaic effect. Obviously, in
order to decrease the cost of photovoltaic production, increasing the efficiency and
collecting more energy had been focused. For that, the emphatic efforts are being
made in this field. Even though, the efficiency of the photovoltaic system is low and
is affected by solar radiation, temperature, dust, wind velocity, and humidity, the solar
photovoltaic market grows a rapid rate. The majority of a previous researches used the
(CCT) cooling system. In this paper, a comparison between the (CCT) and (ICT) has
been investigated. The main aims were to submit a new cooling technique for the
(PVSM), enhance output power, output energy, Fill factor, and efficiency. Indeed, the
water used as a practical coolant for solar panels. Salih Mohammed Salih, etc., [1]
presented experimentally the Performance enhancement of PV array based on water
spraying technique. The economical results were achieved as result of the power
saving increases 7w/degree at midday. Jothi Prakash k, etc., [2] analyzed the
optimisation of solar PV panel output: a viable and cost effective solution. The
cooling rate for the solar cells is 2.3 ℃/min based on the concerned operating
conditions, which means that the cooling system will be operated each time for 10
min, in order to decrease the module temperature by 7℃. Abdelrahman, M, etc., [3]
offered the experimental investigation of different cooling methods for photovoltaic
module. The results show that the daily output power of the PV cooling module
increased up to 22 %, 29.8% and 35% for film cooling, back cooling and combined
film back cooling module, respectively compared to non-cooling module. L.
Dorobanțu, etc., [4] investigated the experimental assessment of PV Panels front
water cooling strategy. The open voltage of the panels is increasing when its
temperature decreasing and due to the lower operating temperature, its life cycle
could be increased. Loredana Dorobanţu, etc., [5] studied the Increasing the
efficiency of photovoltaic panels through cooling water film. For mono-crystalline
silicon cells, the reduced power is (0.4% /°C). Due to the front water cooling of the panel,
the electrical yield has return a plus of about 9.5%. Ana-Maria Croitoru, etc., [6]
reviewed the water cooling of photovoltaic panels from passive house located inside
the university Politehnica of Bucharest. This article has attempted to present a way to
increase the efficiency of photovoltaic panels. It is a water cooling system, which
functions as a heat exchanger. With this system the panel's temperature decreases, so
the electricity production is increased. T. Chinamhora, [7] introduced the PV Panel
Cooling System for Malaysia Climate Conditions. During clear days, the cooling
system increases the electrical efficiency by around 10-22% whereas during cloudy
days, the cooling system decreases the electrical efficiency by 3-20%. K.A.
Moharram, etc., [8] researched the Enhancing the performance of photovoltaic panels
by water cooling. Based on the heating and cooling rate models, it is found that the
PV panels yield the highest output energy if cooling of the panels starts when the
Experimental and Numerical Investigation of Photo
Continuous and Intermittent Water Cooling Techniques
http://www.iaeme.com/IJMET/index.asp
temperature of the PV panels reaches a
temperature between the out
cooling. Stefan Krauter, [
water flow over the front of photovoltaic panels.
clean, and reduces reflection by
the electrical yield can return a surplus of 10.3%; a net
even when accounting for power needed to run the pump.
proposed Modelling and Analysis of
water in order to cool the panel while the latter uses air as the coolant. The results of
the project showed that the most efficient and promising system is the water cooled
photovoltaic.
2. METHODOLOGY
The increasing in the ambient temperature at which PV systems work, had adversely
effect on the PV module efficiency.
method to reduce the PV temperatures and to enhance the PV performance. In this
paper, the (CCT) and (ICT)
2.1. Experimental Equipment
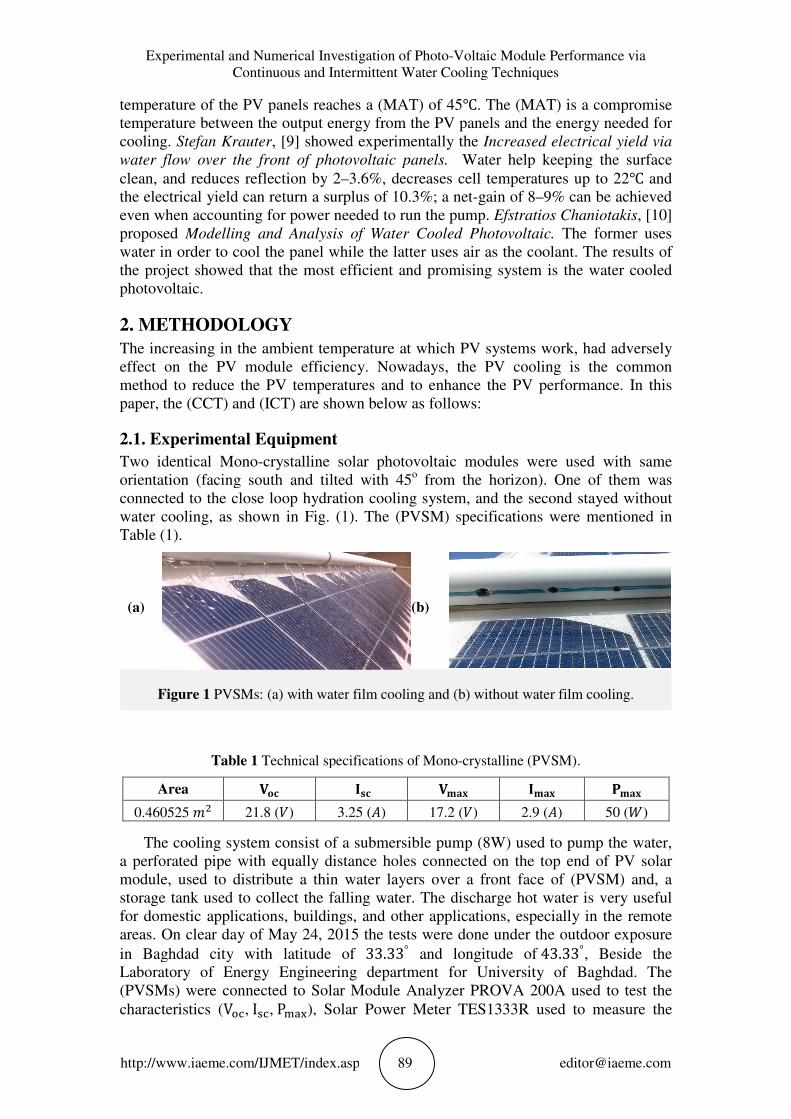
Two identical Mono-crystalline solar photovoltaic modules were used with same
orientation (facing south and tilted with 45
connected to the close loop hydration cooling system, and the second stayed
water cooling, as shown in Fig
Table (1).
(a)
Figure 1 PVSMs: (a) with water
Table 1 Technical specifications of Mono
Area �
0.460525 �� 21.8 (�
The cooling system consist of a
a perforated pipe with equally distance holes
module, used to distribute a thin water layers over a front face of
storage tank used to collect the falling wate
for domestic applications, buildings, and other applications,
areas. On clear day of May 24, 2015 the tests were done under the outdoor exposure
in Baghdad city with latitude of
Laboratory of Energy Engineering
(PVSMs) were connected to Solar Module Analyzer PROVA 200A used to test the
characteristics (V��,I��,P���
Experimental and Numerical Investigation of Photo-Voltaic Module Performance via
Continuous and Intermittent Water Cooling Techniques
ET/index.asp 89 [email protected]
temperature of the PV panels reaches a (MAT) of 45�. The (MAT) is a compromise
output energy from the PV panels and the energy needed for
[9] showed experimentally the Increased electrical yield via
water flow over the front of photovoltaic panels. Water help keeping the surface
reduces reflection by 2–3.6%, decreases cell temperatures up to 22
the electrical yield can return a surplus of 10.3%; a net-gain of 8–9% can be achieved
even when accounting for power needed to run the pump. Efstratios Chaniotakis
Modelling and Analysis of Water Cooled Photovoltaic. The former uses
water in order to cool the panel while the latter uses air as the coolant. The results of
the project showed that the most efficient and promising system is the water cooled
METHODOLOGY
ambient temperature at which PV systems work, had adversely
PV module efficiency. Nowadays, the PV cooling is the common
method to reduce the PV temperatures and to enhance the PV performance. In this
paper, the (CCT) and (ICT) are shown below as follows:
Experimental Equipment
crystalline solar photovoltaic modules were used with same
orientation (facing south and tilted with 45o from the horizon). One of them was
connected to the close loop hydration cooling system, and the second stayed
, as shown in Fig. (1). The (PVSM) specifications were mentioned in
(b)
(a) with water film cooling and (b) without water film cooling.
Technical specifications of Mono-crystalline (PVSM)
�� ���� ����
�) 3.25 (�) 17.2 (�) 2.9 (�)
The cooling system consist of a submersible pump (8W) used to pump the water,
a perforated pipe with equally distance holes connected on the top end of
, used to distribute a thin water layers over a front face of (
storage tank used to collect the falling water. The discharge hot water is very useful
for domestic applications, buildings, and other applications, especially in the remote
May 24, 2015 the tests were done under the outdoor exposure
in Baghdad city with latitude of 33.33° and longitude of43.33Energy Engineering department for University of Baghdad. The
connected to Solar Module Analyzer PROVA 200A used to test the
���), Solar Power Meter TES1333R used to measure the
Voltaic Module Performance via
is a compromise
panels and the energy needed for
Increased electrical yield via
help keeping the surface
3.6%, decreases cell temperatures up to 22� and
9% can be achieved
Efstratios Chaniotakis, [10]
The former uses
water in order to cool the panel while the latter uses air as the coolant. The results of
the project showed that the most efficient and promising system is the water cooled
ambient temperature at which PV systems work, had adversely
Nowadays, the PV cooling is the common
method to reduce the PV temperatures and to enhance the PV performance. In this
crystalline solar photovoltaic modules were used with same
from the horizon). One of them was
connected to the close loop hydration cooling system, and the second stayed without
were mentioned in
film cooling and (b) without water film cooling.
PVSM).
���
50 (!)
W) used to pump the water,
connected on the top end of PV solar
(PVSM) and, a
The discharge hot water is very useful
especially in the remote
May 24, 2015 the tests were done under the outdoor exposure
33°, Beside the
University of Baghdad. The
connected to Solar Module Analyzer PROVA 200A used to test the
), Solar Power Meter TES1333R used to measure the
Ali M. Rasham, Hussein K.
http://www.iaeme.com/IJMET/index.asp
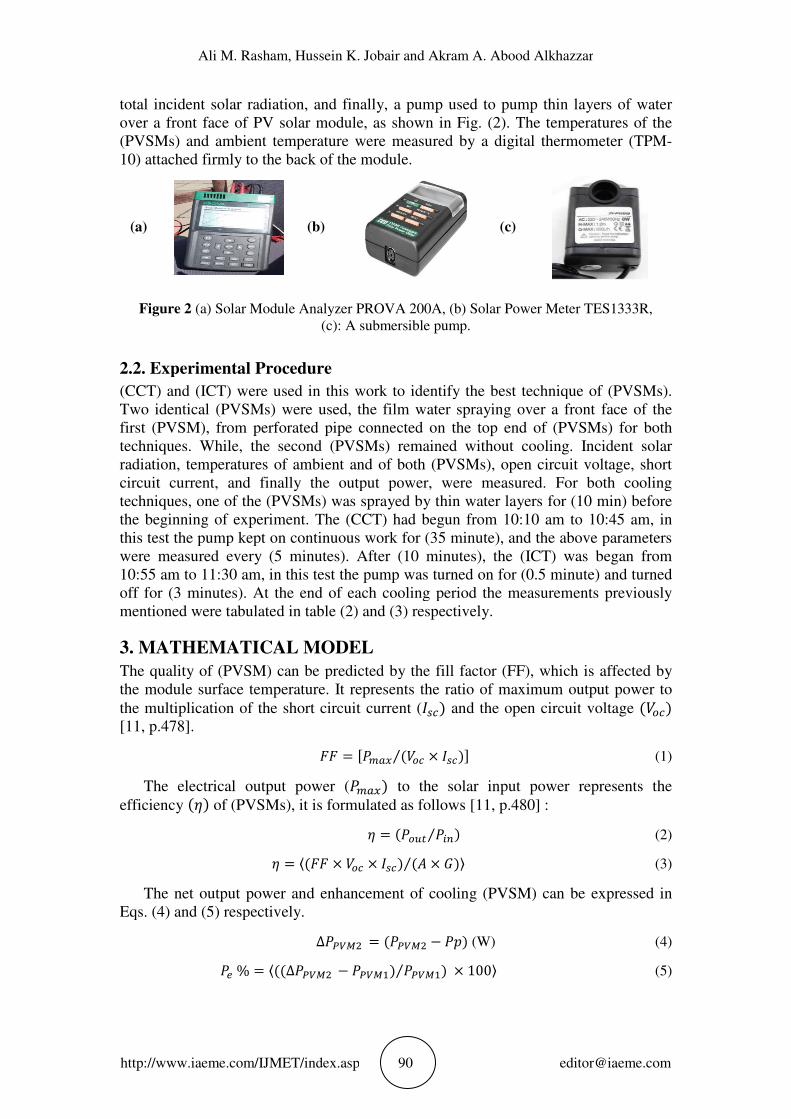
total incident solar radiation, and finally, a pump used to pump thin layers of water
over a front face of PV solar module
(PVSMs) and ambient temperature
10) attached firmly to the back of the module.
(a)
Figure 2 (a) Solar Module Analyzer PROVA 200A, (b) Solar Power Meter TES1333R,
2.2. Experimental Procedure
(CCT) and (ICT) were used in this work to identify the best technique
Two identical (PVSMs) were used, the film water spraying over a front face of the
first (PVSM), from perforated pipe
techniques. While, the second
radiation, temperatures of ambient and of both
circuit current, and finally the output power, were measured.
techniques, one of the (PVSMs)
the beginning of experiment.
this test the pump kept on continuous work for (35 minute), and the above parameters
were measured every (5 minutes).
10:55 am to 11:30 am, in this test the pump was turned on for (0.5 minute) and turned
off for (3 minutes). At the end of each cooling period the measurement
mentioned were tabulated in table
3. MATHEMATICAL MODEL
The quality of (PVSM) can be predicted by the fill factor (FF), which is affected by
the module surface temperature. It represents the ratio of maximum output power to
the multiplication of the short circuit curre
[11, p.478].
The electrical output power (
efficiency "#� of (PVSMs)
# $
The net output power and enhancement of
Eqs. (4) and (5) respectively.
%&% $ ⟨""Δ
Ali M. Rasham, Hussein K. Jobair and Akram A. Abood Alkhazzar
ET/index.asp 90 [email protected]
total incident solar radiation, and finally, a pump used to pump thin layers of water
PV solar module, as shown in Fig. (2). The temperature
PVSMs) and ambient temperature were measured by a digital thermometer (TPM
10) attached firmly to the back of the module.
(b)
(c)
(a) Solar Module Analyzer PROVA 200A, (b) Solar Power Meter TES1333R,
(c): A submersible pump.
Experimental Procedure
were used in this work to identify the best technique
were used, the film water spraying over a front face of the
, from perforated pipe connected on the top end of (PVSMs)
. While, the second (PVSMs) remained without cooling.
radiation, temperatures of ambient and of both (PVSMs), open circuit voltage, short
and finally the output power, were measured. For both cooling
PVSMs) was sprayed by thin water layers for (10 min) before
the beginning of experiment. The (CCT) had begun from 10:10 am to 10:45 am, in
this test the pump kept on continuous work for (35 minute), and the above parameters
were measured every (5 minutes). After (10 minutes), the (ICT) was began from
10:55 am to 11:30 am, in this test the pump was turned on for (0.5 minute) and turned
off for (3 minutes). At the end of each cooling period the measurement
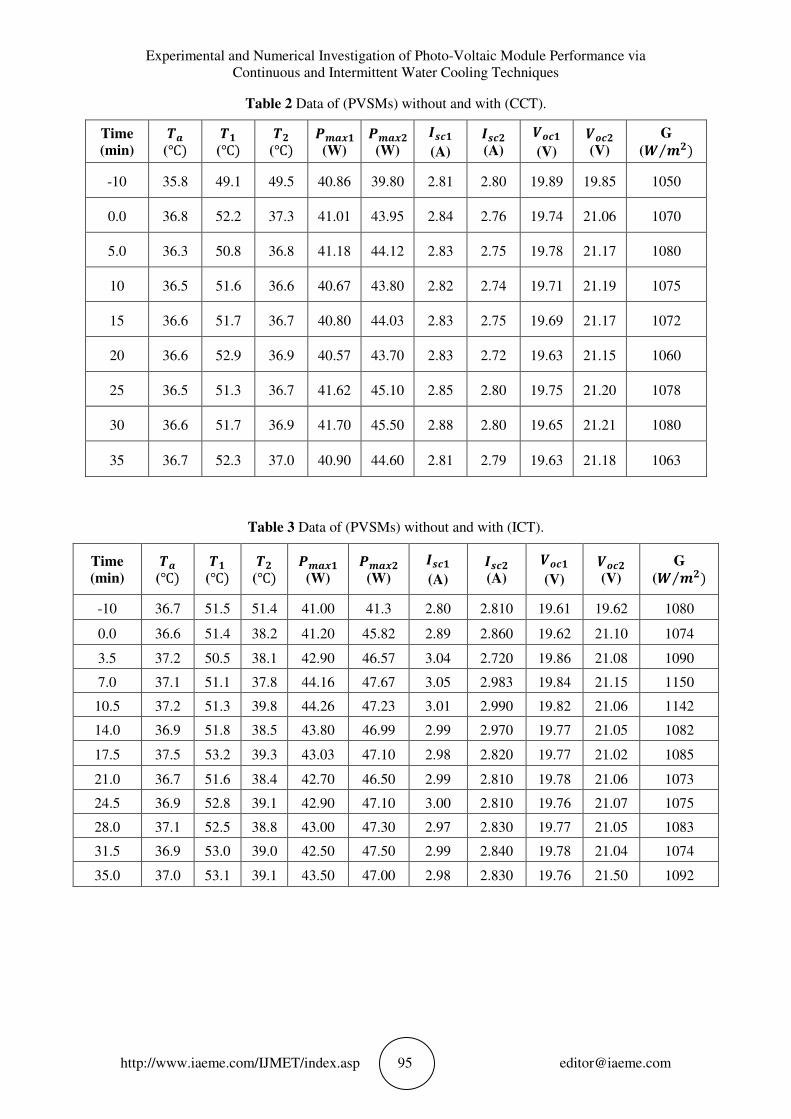
mentioned were tabulated in table (2) and (3) respectively.
MATHEMATICAL MODEL
The quality of (PVSM) can be predicted by the fill factor (FF), which is affected by
the module surface temperature. It represents the ratio of maximum output power to
the multiplication of the short circuit current (*+,� and the open circuit voltage
-- $ .%/01 "�2, 3 *+,⁄ �4
The electrical output power (%/01� to the solar input power represents the
(PVSMs), it is formulated as follows [11, p.480] :
# $ "%256 %78⁄ �
$ ⟨"-- 3 �2, 3 *+,� "� 3 9�⁄ ⟩
The net output power and enhancement of cooling (PVSM) can be expressed in
Eqs. (4) and (5) respectively.
Δ%;<=� $ "%;<=� > %?� (W)
Δ%;<=� > %;<=@� %;<=@⁄ �3 100⟩
and Akram A. Abood Alkhazzar
total incident solar radiation, and finally, a pump used to pump thin layers of water
The temperatures of the
by a digital thermometer (TPM-
(a) Solar Module Analyzer PROVA 200A, (b) Solar Power Meter TES1333R,
were used in this work to identify the best technique of (PVSMs).
were used, the film water spraying over a front face of the
(PVSMs) for both
. Incident solar
open circuit voltage, short
For both cooling
was sprayed by thin water layers for (10 min) before
begun from 10:10 am to 10:45 am, in
this test the pump kept on continuous work for (35 minute), and the above parameters
was began from
10:55 am to 11:30 am, in this test the pump was turned on for (0.5 minute) and turned
off for (3 minutes). At the end of each cooling period the measurements previously
The quality of (PVSM) can be predicted by the fill factor (FF), which is affected by
the module surface temperature. It represents the ratio of maximum output power to
and the open circuit voltage "�2,�
(1)
to the solar input power represents the
(2)
(3)
can be expressed in
(4)
(5)
Experimental and Numerical Investigation of Photo-Voltaic Module Performance via
Continuous and Intermittent Water Cooling Techniques
http://www.iaeme.com/IJMET/index.asp 91 [email protected]
The energy of (PVSMs) and the pump energy can be written as in Eqs. (6) and (7)
respectively.
C;<= $ .DEFDG�HFEIℎFKGELF"%MNFE > I��F�4 (J) (6)
C? $ "%OPI�"J� (7)
Also, the pump energy was considered from the pump power multiplied by
operation time for both cooling techniques. The net energy of cooling (PVSM) was
represented the difference between the energy of cooling (PVSM) and pump energy,
which can be written as:
ΔC;<=� $ "C;<=� > C?�"J� (8)
The enhancement in energy, fill factor, and electrical efficiency for both (PVSMs)
can be written as respectively:
C&% $ ⟨""ΔC;<=� > C;<=@� C;<=@⁄ �3 100⟩ (9)
--&% $ ⟨""--;<=� > --;<=@� --;<=@⁄ �3 100⟩ (10)
#&% $ ⟨""#;<=� > #;<=@ #;<=@⁄ �3 100⟩ (11)
Finally, the cooling rate of cooling (PVSM) is represents the rate of the
temperature difference between both (PVSMs) with and without water cooling, and it
can be formulated as:
RS $ ⟨"HT I/⁄ �⟩"� min�⁄ (12)
4. NUMERICAL ANALYSIS
The numerical technique used to simulate the behavior of (PVSMs). Computer code
for MATLAB software has been developed and written to solve mathematical model.
The electrical output energy can be estimated from the power-time curve, which was
represented the area under the curve. A numerical integration of "1/3� Simpson's rule
was used to estimate the energy of (PVSMs). The least-squares regression of curve
fitting was used in this analysis which is the most common technique of finding the
best fit to experimental data.
5. RESULTS AND DISCUSSION
Experimental and numerical investigation of Mono-crystalline (PVSMs) via (CCT)
and (ICT) at Baghdad climate conditions has been analyzed in this work. At both
techniques, one of the (PVSMs) was sprayed by thin film water layers which was
used as antireflection material in addition to using it as coolant fluid and as cleaning
material from dust and others, while the second (PVSM) was remained without
cooling. A comparison was made between cooling and non-cooling (PVSM) at both
techniques, in order to knowledge whether the best performance had. As renewable
energy resources are stochastic quantities. Consequently, they are fluctuated randomly
with time. The behavior of (PVSMs) temperature, cooling rate, output power, Fill
factor, and electrical efficiency will be discussed in this section. In general, the
enhancement of cooling (PVSM) parameters mentioned above was pluperfect in
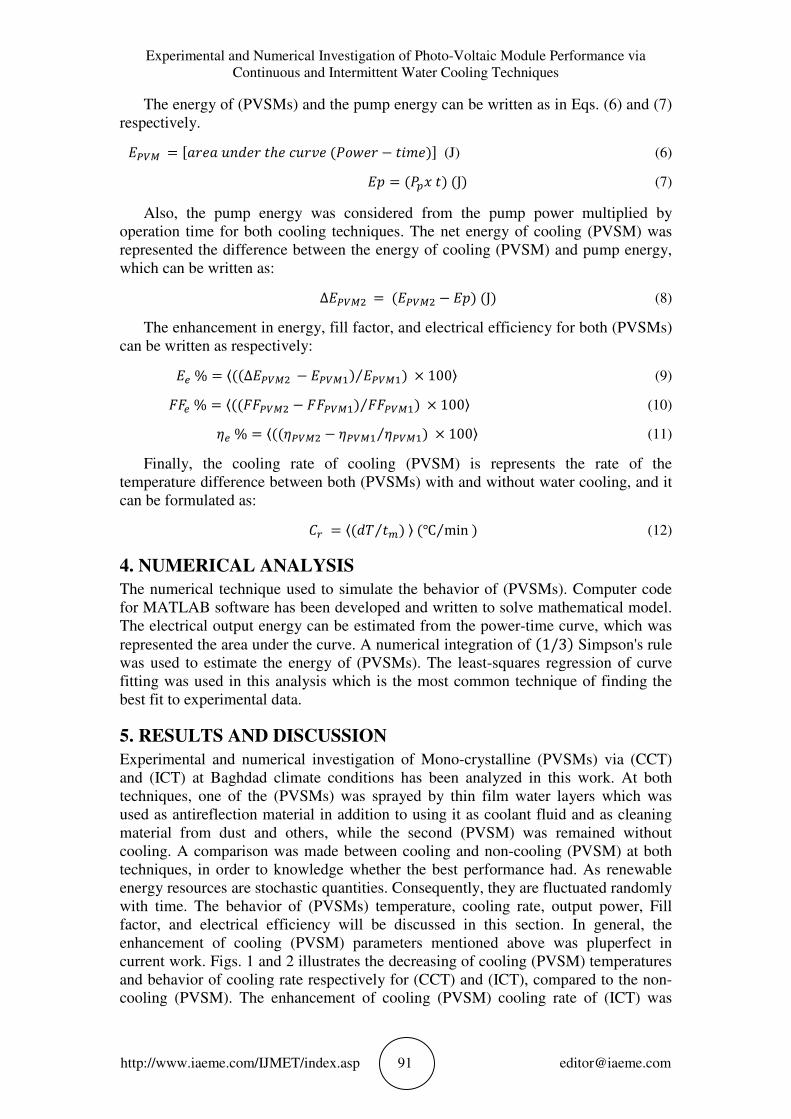
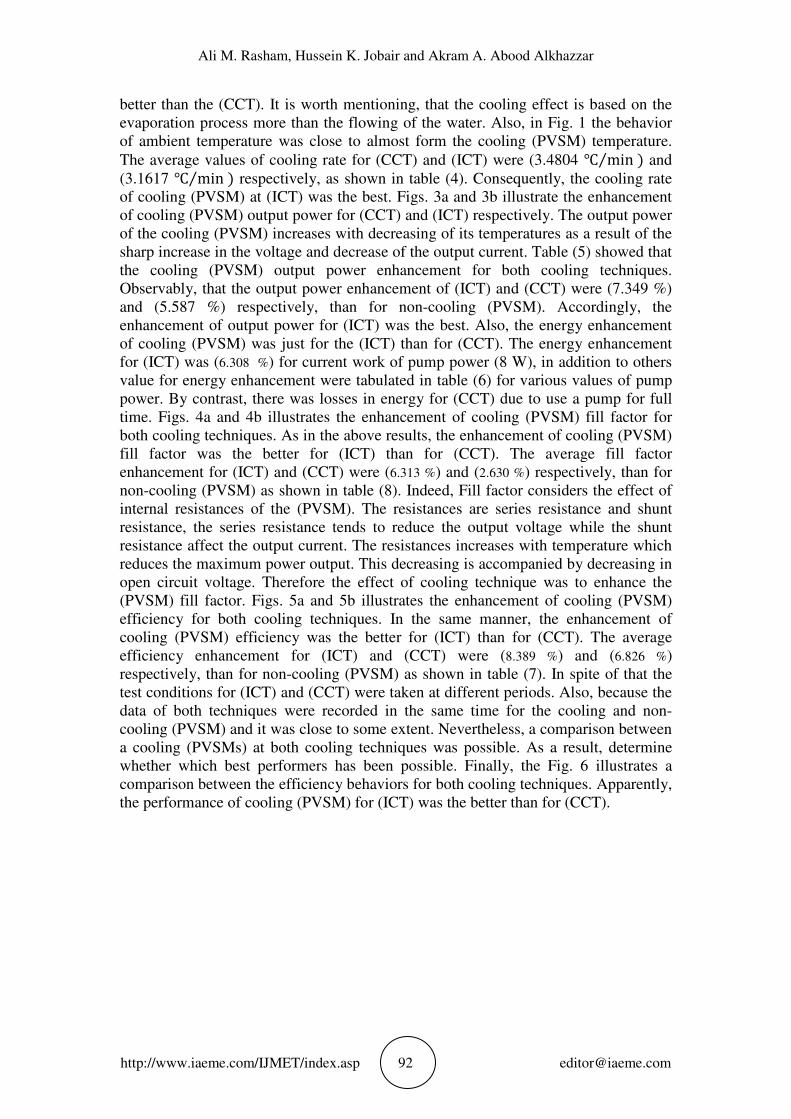
current work. Figs. 1 and 2 illustrates the decreasing of cooling (PVSM) temperatures
and behavior of cooling rate respectively for (CCT) and (ICT), compared to the non-
cooling (PVSM). The enhancement of cooling (PVSM) cooling rate of (ICT) was
Ali M. Rasham, Hussein K. Jobair and Akram A. Abood Alkhazzar
http://www.iaeme.com/IJMET/index.asp 92 [email protected]
better than the (CCT). It is worth mentioning, that the cooling effect is based on the
evaporation process more than the flowing of the water. Also, in Fig. 1 the behavior
of ambient temperature was close to almost form the cooling (PVSM) temperature.
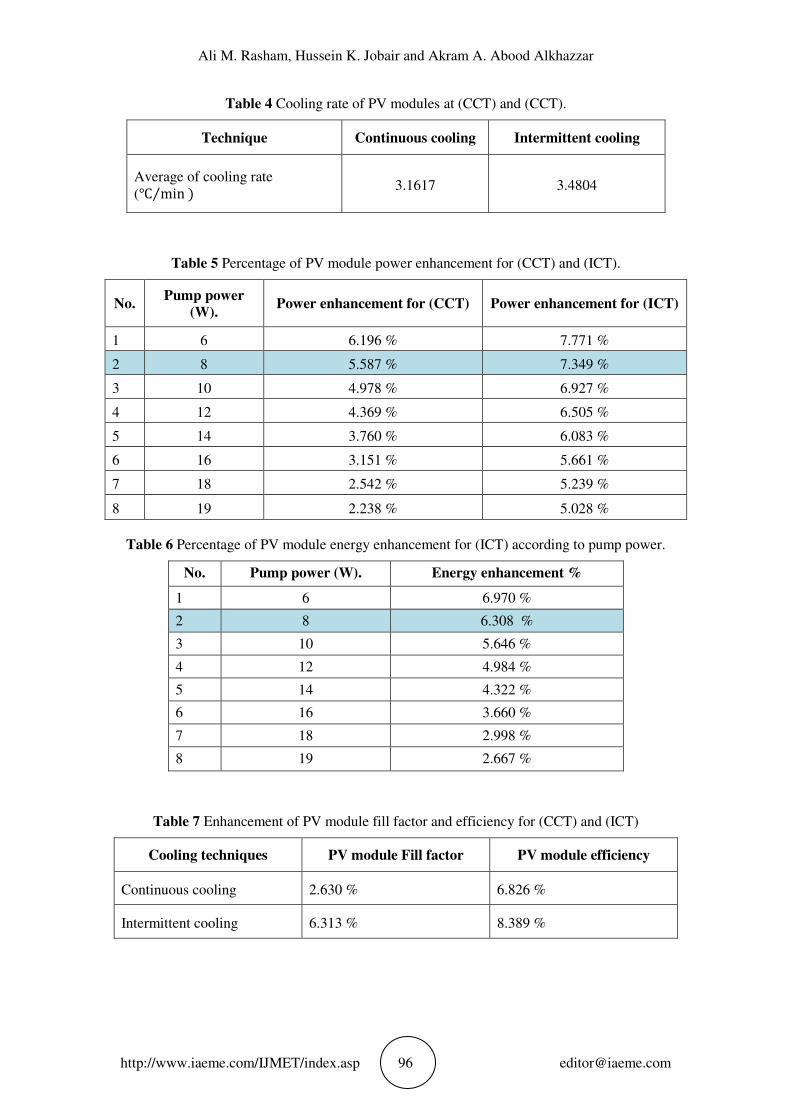
The average values of cooling rate for (CCT) and (ICT) were (3.4804 � min�⁄ and
(3.1617 � min�⁄ respectively, as shown in table (4). Consequently, the cooling rate
of cooling (PVSM) at (ICT) was the best. Figs. 3a and 3b illustrate the enhancement
of cooling (PVSM) output power for (CCT) and (ICT) respectively. The output power
of the cooling (PVSM) increases with decreasing of its temperatures as a result of the
sharp increase in the voltage and decrease of the output current. Table (5) showed that
the cooling (PVSM) output power enhancement for both cooling techniques.
Observably, that the output power enhancement of (ICT) and (CCT) were (7.349 %)
and (5.587 %) respectively, than for non-cooling (PVSM). Accordingly, the
enhancement of output power for (ICT) was the best. Also, the energy enhancement
of cooling (PVSM) was just for the (ICT) than for (CCT). The energy enhancement
for (ICT) was (6. 308 %) for current work of pump power (8 W), in addition to others
value for energy enhancement were tabulated in table (6) for various values of pump
power. By contrast, there was losses in energy for (CCT) due to use a pump for full
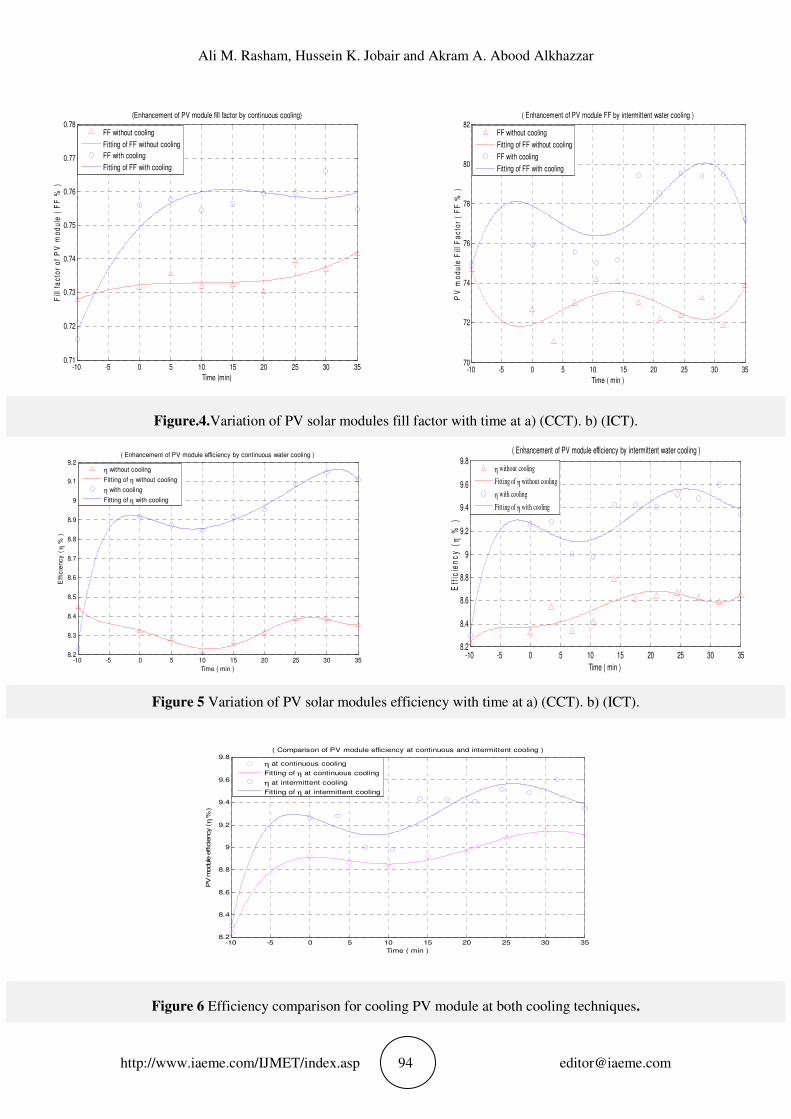
time. Figs. 4a and 4b illustrates the enhancement of cooling (PVSM) fill factor for
both cooling techniques. As in the above results, the enhancement of cooling (PVSM)
fill factor was the better for (ICT) than for (CCT). The average fill factor
enhancement for (ICT) and (CCT) were (6.313 %) and (2.630 %) respectively, than for
non-cooling (PVSM) as shown in table (8). Indeed, Fill factor considers the effect of
internal resistances of the (PVSM). The resistances are series resistance and shunt
resistance, the series resistance tends to reduce the output voltage while the shunt
resistance affect the output current. The resistances increases with temperature which
reduces the maximum power output. This decreasing is accompanied by decreasing in
open circuit voltage. Therefore the effect of cooling technique was to enhance the
(PVSM) fill factor. Figs. 5a and 5b illustrates the enhancement of cooling (PVSM)
efficiency for both cooling techniques. In the same manner, the enhancement of
cooling (PVSM) efficiency was the better for (ICT) than for (CCT). The average
efficiency enhancement for (ICT) and (CCT) were (8.389 %) and (6.826 %)
respectively, than for non-cooling (PVSM) as shown in table (7). In spite of that the
test conditions for (ICT) and (CCT) were taken at different periods. Also, because the
data of both techniques were recorded in the same time for the cooling and non-
cooling (PVSM) and it was close to some extent. Nevertheless, a comparison between
a cooling (PVSMs) at both cooling techniques was possible. As a result, determine
whether which best performers has been possible. Finally, the Fig. 6 illustrates a
comparison between the efficiency behaviors for both cooling techniques. Apparently,
the performance of cooling (PVSM) for (ICT) was the better than for (CCT).
Experimental and Numerical Investigation of Photo-Voltaic Module Performance via
Continuous and Intermittent Water Cooling Techniques
http://www.iaeme.com/IJMET/index.asp 93 [email protected]
Figure. 1 Variation of ambient and PV solar modules temperatures with time at a) (CCT). b) (ICT).
Figure 2 Cooling rate of cooling PV solar module at a) (CCT). b) (ICT).
Figure.3. Variation of PV solar modules output power with time at a) (CCT). b) (ICT).
-10 -5 0 5 10 15 20 25 30 3534
36
38
40
42
44
46
48
50
52
54
Time ( min )
Te
mp
era
ture
( o
C)
( Bahavior of ambient and PV modules temperatures for continuous cooling with time )
PV module temperature without cooling
Fitting of PV module temperature without cooling
PV module temperature with cooling
Fitting of PV module temperature with cooling
Ambient temperature
Fitting of ambient temperature
-10 -5 0 5 10 15 20 25 30 3536
38
40
42
44
46
48
50
52
54
Time (min )
Te
mp
era
ture
( o
C)
( Bahvior of ambient and PV module temperaturesfor intermittent cooling technique with time )
PV module temperature without cooling
Fitting of PV module temperature without cooling
PV module temperature with cooling
Fitting of PV module temperature with cooling
Ambient temperature
Fitting of Ambient temperature
-10 -5 0 5 10 15 20 25 30 3539
40
41
42
43
44
45
46
Time (min)
PV
mo
du
le o
utp
ut
po
we
r (W
)
( Enhancement of PV module output power by continuous water cooling )
Pout without cooling
Fitting of Pout without cooling
Pout with cooling
Fitting of Pout with cooling
-10 -5 0 5 10 15 20 25 30 3540
41
42
43
44
45
46
47
48( Enhancement of PV module output power by intermittent water cooling )
Time ( min )
PV
mo
du
le o
utp
ut
po
we
r (
W)
Pout without cooling
Fitting of Pout without cooling
Pout with cooling
Fitting of Pout with cooling
Ali M. Rasham, Hussein K. Jobair and Akram A. Abood Alkhazzar
http://www.iaeme.com/IJMET/index.asp 94 [email protected]
Figure.4.Variation of PV solar modules fill factor with time at a) (CCT). b) (ICT).
Figure 5 Variation of PV solar modules efficiency with time at a) (CCT). b) (ICT).
Figure 6 Efficiency comparison for cooling PV module at both cooling techniques.
-10 -5 0 5 10 15 20 25 30 350.71
0.72
0.73
0.74
0.75
0.76
0.77
0.78
Time (min)
Fill
fa
cto
r o
f P
V m
od
ule
( F
F %
)
(Enhancement of PV module fill factor by continuous cooling)
FF without cooling
Fitting of FF without cooling
FF with cooling
Fitting of FF with cooling
-10 -5 0 5 10 15 20 25 30 3570
72
74
76
78
80
82( Enhancement of PV module FF by intermittent water cooling )
Time ( min )
PV
mo
du
le F
ill F
ac
tor
( F
F %
)
FF without cooling
Fitting of FF without cooling
FF with cooling
Fitting of FF with cooling
-10 -5 0 5 10 15 20 25 30 358.2
8.3
8.4
8.5
8.6
8.7
8.8
8.9
9
9.1
9.2
Time ( min )
Eff
icie
nc
y (
η %
)
( Enhancement of PV module efficiency by continuous water cooling )
η without cooling
Fitting of η without cooling
η with cooling
Fitting of η with cooling
-10 -5 0 5 10 15 20 25 30 358.2
8.4
8.6
8.8
9
9.2
9.4
9.6
9.8
Time ( min )
Eff
icie
nc
y (
η %
) ( Enhancement of PV module efficiency by intermittent water cooling )
η without cooling
Fitting of η without cooling
η with cooling
Fitting of η with cooling
-10 -5 0 5 10 15 20 25 30 358.2
8.4
8.6
8.8
9
9.2
9.4
9.6
9.8( Comparison of PV module efficiency at continuous and intermittent cooling )
Time ( min )
PV m
odule
effic
iency ( η
% )
η at continuous cooling
Fitting of η at continuous cooling
η at intermittent cooling
Fitting of η at intermittent cooling
Experimental and Numerical Investigation of Photo-Voltaic Module Performance via
Continuous and Intermittent Water Cooling Techniques
http://www.iaeme.com/IJMET/index.asp 95 [email protected]
Table 2 Data of (PVSMs) without and with (CCT).
Time
(min)
YZ
(�� Y[
(�� Y\
(�� ]^Z_[
(W)
]^Z_\
(W)
`ab[
(A)
`ab\
(A)
cdb[
(V)
cdb\
(V)
G
(e ^\⁄ �
-10 35.8 49.1 49.5 40.86 39.80 2.81 2.80 19.89 19.85 1050
0.0 36.8 52.2 37.3 41.01 43.95 2.84 2.76 19.74 21.06 1070
5.0 36.3 50.8 36.8 41.18 44.12 2.83 2.75 19.78 21.17 1080
10 36.5 51.6 36.6 40.67 43.80 2.82 2.74 19.71 21.19 1075
15 36.6 51.7 36.7 40.80 44.03 2.83 2.75 19.69 21.17 1072
20 36.6 52.9 36.9 40.57 43.70 2.83 2.72 19.63 21.15 1060
25 36.5 51.3 36.7 41.62 45.10 2.85 2.80 19.75 21.20 1078
30 36.6 51.7 36.9 41.70 45.50 2.88 2.80 19.65 21.21 1080
35 36.7 52.3 37.0 40.90 44.60 2.81 2.79 19.63 21.18 1063
Table 3 Data of (PVSMs) without and with (ICT).
Time
(min)
YZ
(�� Y[
(�� Y\
(�� ]^Z_[
(W)
]^Z_\
(W)
`ab[
(A)
`ab\
(A)
cdb[
(V)
cdb\
(V)
G
(e ^\⁄ �
-10 36.7 51.5 51.4 41.00 41.3 2.80 2.810 19.61 19.62 1080
0.0 36.6 51.4 38.2 41.20 45.82 2.89 2.860 19.62 21.10 1074
3.5 37.2 50.5 38.1 42.90 46.57 3.04 2.720 19.86 21.08 1090
7.0 37.1 51.1 37.8 44.16 47.67 3.05 2.983 19.84 21.15 1150
10.5 37.2 51.3 39.8 44.26 47.23 3.01 2.990 19.82 21.06 1142
14.0 36.9 51.8 38.5 43.80 46.99 2.99 2.970 19.77 21.05 1082
17.5 37.5 53.2 39.3 43.03 47.10 2.98 2.820 19.77 21.02 1085
21.0 36.7 51.6 38.4 42.70 46.50 2.99 2.810 19.78 21.06 1073
24.5 36.9 52.8 39.1 42.90 47.10 3.00 2.810 19.76 21.07 1075
28.0 37.1 52.5 38.8 43.00 47.30 2.97 2.830 19.77 21.05 1083
31.5 36.9 53.0 39.0 42.50 47.50 2.99 2.840 19.78 21.04 1074
35.0 37.0 53.1 39.1 43.50 47.00 2.98 2.830 19.76 21.50 1092
Ali M. Rasham, Hussein K. Jobair and Akram A. Abood Alkhazzar
http://www.iaeme.com/IJMET/index.asp 96 [email protected]
Table 4 Cooling rate of PV modules at (CCT) and (CCT).
Technique Continuous cooling Intermittent cooling
Average of cooling rate
(� min�⁄ 3.1617 3.4804
Table 5 Percentage of PV module power enhancement for (CCT) and (ICT).
No. Pump power
(W). Power enhancement for (CCT) Power enhancement for (ICT)
1 6 6.196 % 7.771 %
2 8 5.587 % 7.349 %
3 10 4.978 % 6.927 %
4 12 4.369 % 6.505 %
5 14 3.760 % 6.083 %
6 16 3.151 % 5.661 %
7 18 2.542 % 5.239 %
8 19 2.238 % 5.028 %
Table 6 Percentage of PV module energy enhancement for (ICT) according to pump power.
No. Pump power (W). Energy enhancement %
1 6 6.970 %
2 8 6. 308 %
3 10 5.646 %
4 12 4.984 %
5 14 4.322 %
6 16 3.660 %
7 18 2.998 %
8 19 2.667 %
Table 7 Enhancement of PV module fill factor and efficiency for (CCT) and (ICT)
Cooling techniques PV module Fill factor PV module efficiency
Continuous cooling 2.630 % 6.826 %
Intermittent cooling 6.313 % 8.389 %
Experimental and Numerical Investigation of Photo-Voltaic Module Performance via
Continuous and Intermittent Water Cooling Techniques
http://www.iaeme.com/IJMET/index.asp 97 [email protected]
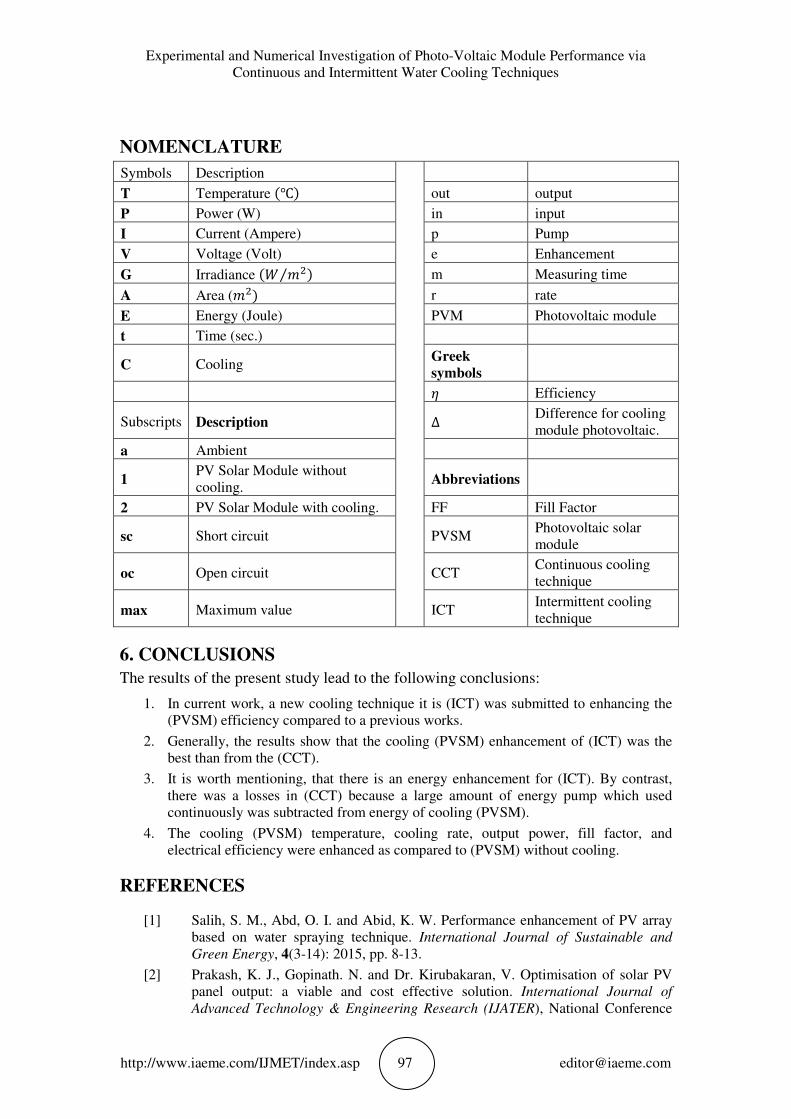
NOMENCLATURE
Symbols Description
T Temperature "�� out output
P Power (W) in input
I Current (Ampere) p Pump
V Voltage (Volt) e Enhancement
G Irradiance "! ��⁄ � m Measuring time
A Area (��� r rate
E Energy (Joule) PVM Photovoltaic module
t Time (sec.)
C Cooling Greek
symbols
# Efficiency
Subscripts Description ∆ Difference for cooling
module photovoltaic.
a Ambient
1 PV Solar Module without
cooling. Abbreviations
2 PV Solar Module with cooling. FF Fill Factor
sc Short circuit PVSM Photovoltaic solar
module
oc Open circuit CCT Continuous cooling
technique
max Maximum value ICT Intermittent cooling
technique
6. CONCLUSIONS
The results of the present study lead to the following conclusions:
1. In current work, a new cooling technique it is (ICT) was submitted to enhancing the
(PVSM) efficiency compared to a previous works.
2. Generally, the results show that the cooling (PVSM) enhancement of (ICT) was the
best than from the (CCT).
3. It is worth mentioning, that there is an energy enhancement for (ICT). By contrast,
there was a losses in (CCT) because a large amount of energy pump which used
continuously was subtracted from energy of cooling (PVSM).
4. The cooling (PVSM) temperature, cooling rate, output power, fill factor, and
electrical efficiency were enhanced as compared to (PVSM) without cooling.
REFERENCES
[1] Salih, S. M., Abd, O. I. and Abid, K. W. Performance enhancement of PV array
based on water spraying technique. International Journal of Sustainable and
Green Energy, 4(3-14): 2015, pp. 8-13.
[2] Prakash, K. J., Gopinath. N. and Dr. Kirubakaran, V. Optimisation of solar PV
panel output: a viable and cost effective solution. International Journal of
Advanced Technology & Engineering Research (IJATER), National Conference
Ali M. Rasham, Hussein K. Jobair and Akram A. Abood Alkhazzar
http://www.iaeme.com/IJMET/index.asp 98 [email protected]
on Renewable Energy Innovations for Rural Development, ISSN No: 2250-3536,
2014.
[3] Abdelrahman, M., Eliwa, A. and Abdellatif, O. E. Experimental Investigation of
Different Cooling Methods for Photovoltaic Module. Joint Propulsion
Conferences, 11th International Energy Conversion Engineering Conference, July
14-17, 2013, San Jose, CA.
[4] Dorobanțu, L., Popescu, M. O., Popescu, C. L. and Crăciunescu, A. Experimental
Assessment of PV Panels Front Water Cooling Strategy. International Conference
on Renewable Energies and Power Quality (ICREPQ’13), Bilbao , Spain, 20th to
22th March, 2013, ISSN 2172-038 X, No.11, March 2013.
[5] Dorobanţu, L. and Popescu, M. O. Increasing the efficiency of photovoltaic
panels through cooling water film. U.P.B. Sci. Bull., Series C, 75(4), 2013,. ISSN
2286-3540.
[6] Croitoru, A. -M. and Badea, A. Water cooling of photovoltaic panels from
passive house located inside the university Politehnica of Bucharest. U.P.B. Sci.
Bull., Series C, 75(3), 2013, ISSN 2286-3540.
[7] Chinamhora, T., Cheng, G. and Tham, Y. and Irshad, W. PV Panel Cooling
System for Malaysia Climate Conditions. Proceeding of international Conference
on Energy and sustainability – 2013, NED University of Engineering &
Technology, Karachi, Pakistan.
[8] Moharram, K. A., Abd-Elhady, M. S., Kandil, H. A. and El-Sherif, H. Enhancing
the performance of photovoltaic panels by water cooling. Ain Shams Engineering
Journal, 4, 2013, pp. 869–877.
[9] Krauter, S. Increased electrical yield via water flow over the front of photovoltaic
panels. Solar Energy Materials & Solar Cells, 82, 2004, pp. 131–137.
[10] Chaniotakis, E. Modelling and Analysis of Water Cooled Photovoltaic. Thesis,
MSc Energy Systems and the Environment 2001. Department of Mechanical
Engineering, University of Strathclyde.
[11] Kalogirou, S. A. Solar Energy Engineering Processes and Systems. Copyright ©
2009, Elsevier.