Embed Size (px)
Citation preview
Experimental and numerical investigationof 2D sloshing: scenarios near the critical filling depth
A. Colagrossi∗ F. Palladino∗ M. Greco∗
[email protected] [email protected] [email protected]
C. Lugni∗ O. M. Faltinsen∗∗
[email protected] [email protected]
∗ INSEAN, Italian Ship Model Basin, Roma – Italy.∗∗ Centre for Ships and Ocean Structures, NTNU, Trondheim – Norway.
Sloshing is an important issue for LNG tanks and in general when partially filled tanks are on-board of a vessel. Thisresonance phenomenon may be connected with complex motions of the filled liquid that can couple with the ship motionsand can represent a danger for the tank strucure and for the stability of the ship. In this context, it is very important toidentify the possible scenarios associated with the sloshing. Present analysis is a part of the research activities reported inColagrossi et al. (2004) and Lugni et al. (2005) and uses both 2D sloshing experiments performed in a rectangular tankL = H = 1 m long and b = 0.1 m wide (see left sketch in figure 1), and the 2D SPH solver (Colagrossi and Landrini 2003and Colagrossi 2005). In particular it is the logical continuation of the experimental investigation presented in Colagrossiet al. (2004). There, sloshing phenomena in the case of filling depth h/L = 0.35, i.e. slightly higher than the critical valueh/L = 0.337 (Faltinsen et al. 2000), were investigated. By varying the excitation period T of the sinusoidal horizontalmotion of the tank, and by increasing its amplitude of oscillation, some peculiar phenomena were observed for T near thelinear sloshing natural period T1, i.e. an asymmetric behavior of the wave elevation along the tank, as well as alternationof the breaking phenomenon at the two tank sides. Such phenomena are connected with important water-wall interactionsand with the vortex generation consequent to the post breaking phenomena. Because of their complex features, theycan not be predicted by potential-flow models. Further, to our knowledge no documentation of them is available in theliterature.
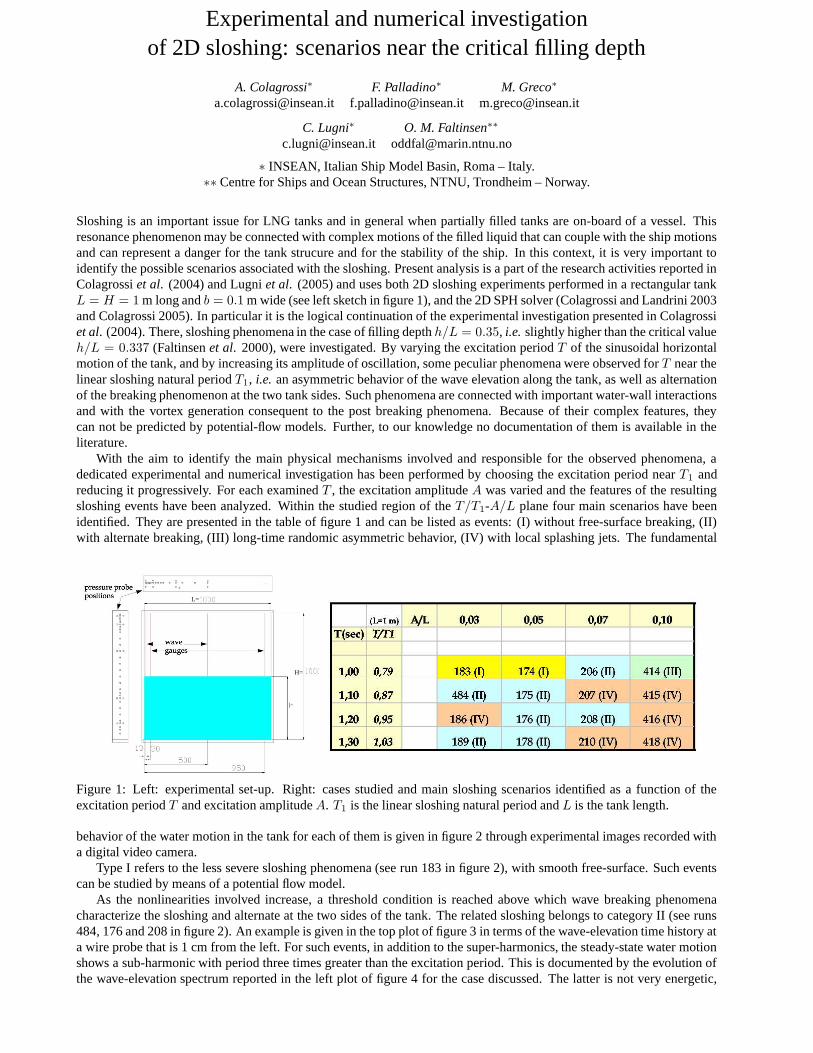
With the aim to identify the main physical mechanisms involved and responsible for the observed phenomena, adedicated experimental and numerical investigation has been performed by choosing the excitation period near T1 andreducing it progressively. For each examined T , the excitation amplitude A was varied and the features of the resultingsloshing events have been analyzed. Within the studied region of the T/T1-A/L plane four main scenarios have beenidentified. They are presented in the table of figure 1 and can be listed as events: (I) without free-surface breaking, (II)with alternate breaking, (III) long-time randomic asymmetric behavior, (IV) with local splashing jets. The fundamental
H=
L=
Figure 1: Left: experimental set-up. Right: cases studied and main sloshing scenarios identified as a function of theexcitation period T and excitation amplitude A. T1 is the linear sloshing natural period and L is the tank length.
behavior of the water motion in the tank for each of them is given in figure 2 through experimental images recorded witha digital video camera.
Type I refers to the less severe sloshing phenomena (see run 183 in figure 2), with smooth free-surface. Such eventscan be studied by means of a potential flow model.
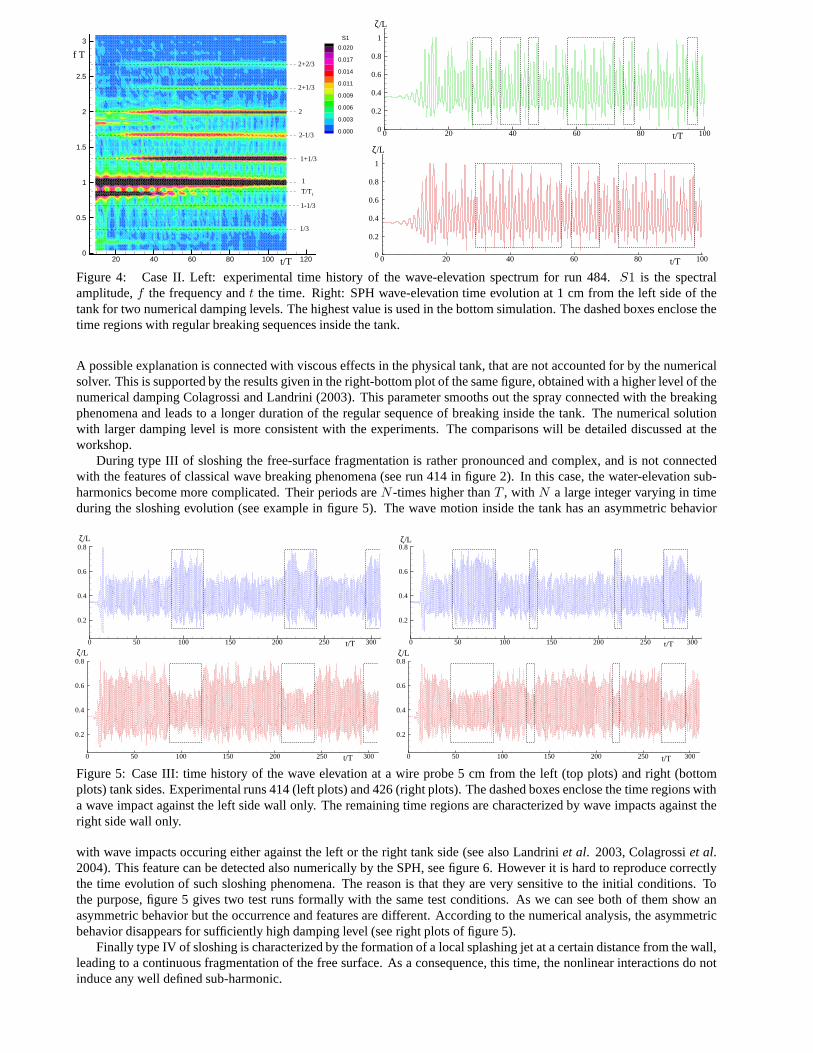
As the nonlinearities involved increase, a threshold condition is reached above which wave breaking phenomenacharacterize the sloshing and alternate at the two sides of the tank. The related sloshing belongs to category II (see runs484, 176 and 208 in figure 2). An example is given in the top plot of figure 3 in terms of the wave-elevation time history ata wire probe that is 1 cm from the left. For such events, in addition to the super-harmonics, the steady-state water motionshows a sub-harmonic with period three times greater than the excitation period. This is documented by the evolution ofthe wave-elevation spectrum reported in the left plot of figure 4 for the case discussed. The latter is not very energetic,
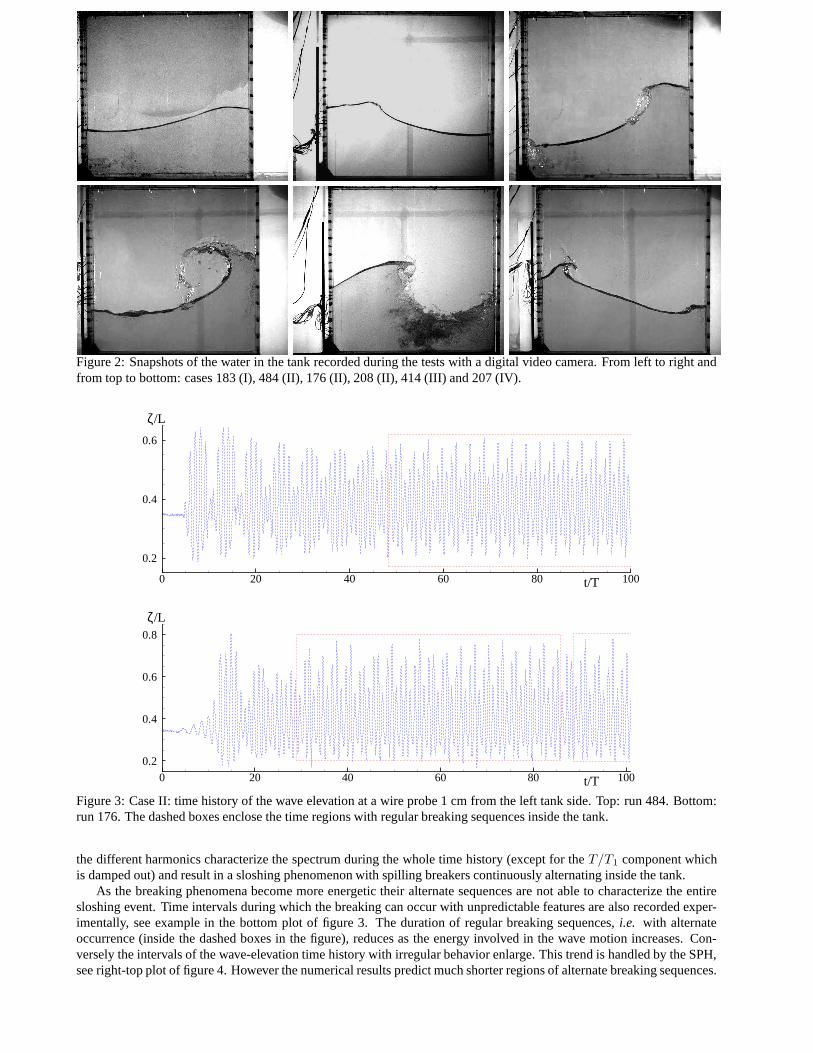
Figure 2: Snapshots of the water in the tank recorded during the tests with a digital video camera. From left to right andfrom top to bottom: cases 183 (I), 484 (II), 176 (II), 208 (II), 414 (III) and 207 (IV).
0 20 40 60 80 100
0.2
0.4
0.6
t/T
ζ/L
0 20 40 60 80 100
0.2
0.4
0.6
0.8
t/T
ζ/L
Figure 3: Case II: time history of the wave elevation at a wire probe 1 cm from the left tank side. Top: run 484. Bottom:run 176. The dashed boxes enclose the time regions with regular breaking sequences inside the tank.
the different harmonics characterize the spectrum during the whole time history (except for the T/T1 component whichis damped out) and result in a sloshing phenomenon with spilling breakers continuously alternating inside the tank.
As the breaking phenomena become more energetic their alternate sequences are not able to characterize the entiresloshing event. Time intervals during which the breaking can occur with unpredictable features are also recorded exper-imentally, see example in the bottom plot of figure 3. The duration of regular breaking sequences, i.e. with alternateoccurrence (inside the dashed boxes in the figure), reduces as the energy involved in the wave motion increases. Con-versely the intervals of the wave-elevation time history with irregular behavior enlarge. This trend is handled by the SPH,see right-top plot of figure 4. However the numerical results predict much shorter regions of alternate breaking sequences.
20 40 60 80 100 1200
0.5
1
1.5
2
2.5
3 S1
0.020
0.017
0.014
0.011
0.009
0.006
0.003
0.000
f T
t/T
1-1/3
1/3
1
2
2+2/3
1+1/3
2-1/3
T/T1
2+1/3
0 20 40 60 80 1000
0.2
0.4
0.6
0.8
1
t/T
ζ/L
0 20 40 60 80 1000
0.2
0.4
0.6
0.8
1
t/T
ζ/L
Figure 4: Case II. Left: experimental time history of the wave-elevation spectrum for run 484. S1 is the spectralamplitude, f the frequency and t the time. Right: SPH wave-elevation time evolution at 1 cm from the left side of thetank for two numerical damping levels. The highest value is used in the bottom simulation. The dashed boxes enclose thetime regions with regular breaking sequences inside the tank.
A possible explanation is connected with viscous effects in the physical tank, that are not accounted for by the numericalsolver. This is supported by the results given in the right-bottom plot of the same figure, obtained with a higher level of thenumerical damping Colagrossi and Landrini (2003). This parameter smooths out the spray connected with the breakingphenomena and leads to a longer duration of the regular sequence of breaking inside the tank. The numerical solutionwith larger damping level is more consistent with the experiments. The comparisons will be detailed discussed at theworkshop.
During type III of sloshing the free-surface fragmentation is rather pronounced and complex, and is not connectedwith the features of classical wave breaking phenomena (see run 414 in figure 2). In this case, the water-elevation sub-harmonics become more complicated. Their periods are N -times higher than T , with N a large integer varying in timeduring the sloshing evolution (see example in figure 5). The wave motion inside the tank has an asymmetric behavior
0 50 100 150 200 250 300
0.2
0.4
0.6
0.8
t/T
ζ/L
0 50 100 150 200 250 300
0.2
0.4
0.6
0.8
t/T
ζ/L0 50 100 150 200 250 300
0.2
0.4
0.6
0.8
t/T
ζ/L
0 50 100 150 200 250 300
0.2
0.4
0.6
0.8
t/T
ζ/L
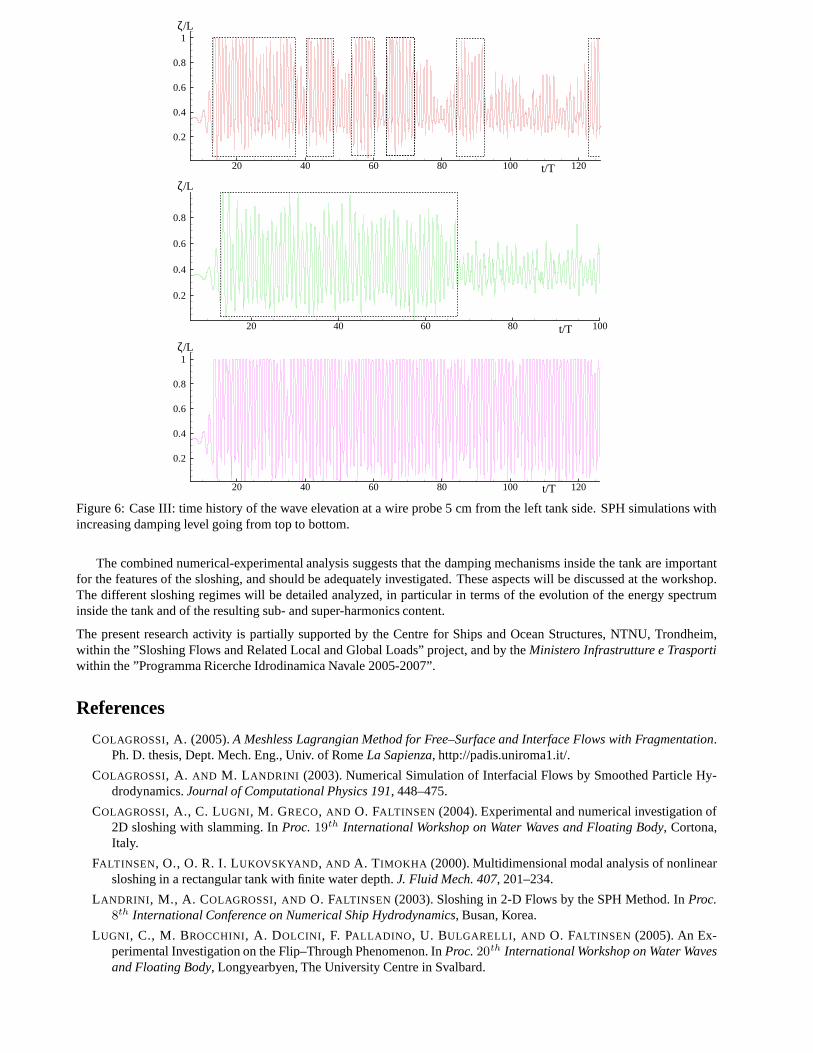
Figure 5: Case III: time history of the wave elevation at a wire probe 5 cm from the left (top plots) and right (bottomplots) tank sides. Experimental runs 414 (left plots) and 426 (right plots). The dashed boxes enclose the time regions witha wave impact against the left side wall only. The remaining time regions are characterized by wave impacts against theright side wall only.
with wave impacts occuring either against the left or the right tank side (see also Landrini et al. 2003, Colagrossi et al.2004). This feature can be detected also numerically by the SPH, see figure 6. However it is hard to reproduce correctlythe time evolution of such sloshing phenomena. The reason is that they are very sensitive to the initial conditions. Tothe purpose, figure 5 gives two test runs formally with the same test conditions. As we can see both of them show anasymmetric behavior but the occurrence and features are different. According to the numerical analysis, the asymmetricbehavior disappears for sufficiently high damping level (see right plots of figure 5).
Finally type IV of sloshing is characterized by the formation of a local splashing jet at a certain distance from the wall,leading to a continuous fragmentation of the free surface. As a consequence, this time, the nonlinear interactions do notinduce any well defined sub-harmonic.
20 40 60 80 100 120
0.2
0.4
0.6
0.8
1
t/T
ζ/L
20 40 60 80 100
0.2
0.4
0.6
0.8
t/T
ζ/L
20 40 60 80 100 120
0.2
0.4
0.6
0.8
1
t/T
ζ/L
Figure 6: Case III: time history of the wave elevation at a wire probe 5 cm from the left tank side. SPH simulations withincreasing damping level going from top to bottom.
The combined numerical-experimental analysis suggests that the damping mechanisms inside the tank are importantfor the features of the sloshing, and should be adequately investigated. These aspects will be discussed at the workshop.The different sloshing regimes will be detailed analyzed, in particular in terms of the evolution of the energy spectruminside the tank and of the resulting sub- and super-harmonics content.
The present research activity is partially supported by the Centre for Ships and Ocean Structures, NTNU, Trondheim,within the ”Sloshing Flows and Related Local and Global Loads” project, and by the Ministero Infrastrutture e Trasportiwithin the ”Programma Ricerche Idrodinamica Navale 2005-2007”.
References
COLAGROSSI, A. (2005). A Meshless Lagrangian Method for Free–Surface and Interface Flows with Fragmentation.Ph. D. thesis, Dept. Mech. Eng., Univ. of Rome La Sapienza, http://padis.uniroma1.it/.
COLAGROSSI, A. AND M. LANDRINI (2003). Numerical Simulation of Interfacial Flows by Smoothed Particle Hy-drodynamics. Journal of Computational Physics 191, 448–475.
COLAGROSSI, A., C. LUGNI, M. GRECO, AND O. FALTINSEN (2004). Experimental and numerical investigation of2D sloshing with slamming. In Proc. 19
th International Workshop on Water Waves and Floating Body, Cortona,Italy.
FALTINSEN, O., O. R. I. LUKOVSKYAND, AND A. TIMOKHA (2000). Multidimensional modal analysis of nonlinearsloshing in a rectangular tank with finite water depth. J. Fluid Mech. 407, 201–234.
LANDRINI, M., A. COLAGROSSI, AND O. FALTINSEN (2003). Sloshing in 2-D Flows by the SPH Method. In Proc.8
th International Conference on Numerical Ship Hydrodynamics, Busan, Korea.
LUGNI, C., M. BROCCHINI, A. DOLCINI, F. PALLADINO, U. BULGARELLI, AND O. FALTINSEN (2005). An Ex-perimental Investigation on the Flip–Through Phenomenon. In Proc. 20
th International Workshop on Water Wavesand Floating Body, Longyearbyen, The University Centre in Svalbard.
Colagrossi, A., Palladino, F., Greco, M., Lugni, C., Faltinsen, O. M.
‘Experimental and numerical investigation of 2D sloshing: scenarios near
the critical filling depth’
Discusser - M. Longuet-Higgins:
The triple instability that you have observed is similar to that found when steep waves are reflected
from a vertical barrier; see Longuet-Higgins, M.S. and Drazen, D. (2002) ’ On steep gravity waves
meeting a vertical wall’, Journal of Fluid Mechanics, 466, 305-318. Above a certain incident-wave
steepness the rate of growth is almost a constant, independent of the steepness.
Reply:
Thank you for the useful suggestion. Your paper is extremely interesting to highlight some physical
mechanisms involved in. In our experiments we observed some preliminary similarity with the period
tripling phenomenon observed by Jiang and Perlin (JFM 98). Nevertheless, as in your experiment
the mechanism we used to obtain the quasi-standing waves is a consequence of the reflection of the
progressive waves from the end wall of the tank. Then the sentences highlighted in your investigation
could be confirmed from our studies, and even in this sense we will address our research. Thank you
again!
![Sloshing motion in excited tanks - context/Earthcontextearth.com/wp-content/uploads/2016/07/JCP04.pdf · Sloshing motion in excited tanks ... [35] modelled inviscid sloshing motion](https://img.pdfslide.us/doc/110x75/5a78985e7f8b9aa2448e4299/sloshing-motion-in-excited-tanks-context-motion-in-excited-tanks-35-modelled.jpg)