Embed Size (px)
Citation preview

American Institute of Aeronautics and Astronautics
1
Experimental and Computational Studies of Mixing in
Supersonic Flow
Ross A. Burns1, Heeseok Koo
2, Noel T. Clemens
3, and Venkat Raman
4
Center for Aeromechanics Research
Department of Aerospace Engineering and Engineering Mechanics
The University of Texas at Austin
Austin, TX 78712
A preliminary combined experimental and computational investigation is conducted on
the mixing characteristics of a strut-based hypermixer in a Mach 3 freestream. The
hypermixing flow-field is generated by an injection pylon with expansive wedges to enhance
the streamwise vorticity. Two different scalar visualization techniques are used to examine
the underlying mixing processes. Planar laser scattering of condensed carbon dioxide gas is
used to visualize the freestream flow, whereas two-photon planar laser-induced fluorescence
(PLIF) of krypton gas is used to mark the injected jet fluid. The experimental results are
compared directly to a large-eddy simulation (LES) of the same flow-field. The results
obtained are complimentary because the experimental data can aid in the validation of LES
models, and the simulations provide information about the thermodynamic property
variations that affect the interpretation of the krypton PLIF signal.
Nomenclature
A = Einstein A coefficient
a = laser beam diameter
d = injection jet diameter
= laser pulse energy
F = temporal profile of laser pulse
h = hypermixer base height
= Planck constant over 2π
k = Boltzmann constant
ni = number density of species i
no = total number density
Po = stagnation pressure
Q = electronic quenching
Sf = fluorescence signal
To = stagnation temperature
µi = reduced mass of species i
σi = quenching cross-section of species i
( ) = two-photon absorption cross-section
χi = mole fraction of species i
1 Graduate Research Assistant, Department of Aerospace Engineering and Engineering Mechanics, The University
of Texas at Austin. 2 Researcher, Department of Aerospace Engineering and Engineering Mechanics, The University of Texas at Austin.
3 Professor, Department of Aerospace Engineering and Engineering Mechanics, The University of Texas at Austin.
4 Associate Professor, Department of Aerospace Engineering and Engineering Mechanics, The University of Texas
at Austin.
American Institute of Aeronautics and Astronautics
2
I. Introduction
At the high Mach number associated with hypersonic flight, allowing the airflow to remain supersonic
within the combustor of a scramjet is essential to prevent excessive mechanical loading as well as chemical changes
to the air such as dissociation that would be detrimental to combustion efficiency. At supersonic velocities, the
residence times needed to accommodate proper mixing of the air and fuel would necessitate extended combustors,
which are undesirable in consideration of vehicle size and weight constraints [1,2].
One mixing enhancement strategy that has shown potential for use in scramjet engines is known as a pylon or
strut injector with trailing-edge ramps, also known as a hypermixer. Fuel is injected from a strut spanning the
airflow in the combustor. Unlike a wall-based injector, which injects fuel transversely to the flow, the fuel
introduced by the hypermixer is injected parallel or nearly parallel to the freestream and mixing is achieved by
intense vorticity generated at the trailing edge of the hypermixer [3,4]. In supersonic flow, the vorticity is enhanced
by the use of compressive and expansive surfaces to create strong pressure gradients.
Studies to this point have been concerned primarily with the mixing enhancement induced by the hypermixer [3-
13]. Doster et al. [3,4] have performed complimentary experimental and computational studies on three primary
hypermixing geometries with upstream scalar injection including a base supersonic wake, an alternating ramp mixer,
and an alternating wedge mixer. The use of planar laser-induced fluorescence of nitric oxide and Raman
spectroscopy allowed for visualization of the mixing processes as it progressed downstream. Results indicate
enhanced mixing in the near-field with the ramp and wedge injectors, while the far-field mixing was found to be
similar in all cases. Simulations performed in Fluent agreed well with the experimental data. References 5, 6, and 7
have studied the mixing characteristics of various geometries with inline fuel injection, including a supersonic base-
flow wake, castellated mixers, and combinations of compressive and expansive surfaces using NO-PLIF. The
mixers with compression ramps were found to have a much greater impact on the mixing due to large streamwise
vortices that increase the interfacial area between fuel-lean and fuel-rich regions. Others have considered the
impact that the addition of the strut has had in terms of pressure losses within a model combustor. Gruenig et al. [8]
studied four different strut geometries that included full- and partial-span struts injecting fuel at angles oblique to the
flow. The four different geometries were found to have considerably different impacts on the upper and lower wall
pressure distributions.
The current joint study seeks to investigate the mixing characteristics of the flow downstream of the strut-based
hypermixer through experimental and computational means. A hypermixer featuring a central castellation with
expansive wedges was selected as it was shown to have the most significant impact on the flow-field [5-7], and
poses complex interactions to challenge the LES models. Laser-based diagnostic techniques were employed to
study the mixing characteristics of the flow-field. Planar laser scattering of CO2 gas was used to visualize
freestream flow structures and enabled visualization of the entrainment of freestream fluid within the wake structure.
Multiple cross-stream planes were imaged to get a sense of the three-dimensionality of the flow-field. Two-photon
planar laser-induced fluorescence of krypton gas was used to visualize the injected gas as it mixed. The
experimental data are compared to a large-eddy simulation (LES) of the same flow-field. The development of
accurate subfilter models for complex compressible viscous flows coupled with scalar mixing is crucial to future
engine design and optimization. This preliminary combined experimental-computational study has as its ultimate
goal the improvement of such models and a better understanding of the mixing process.
II. Experimental Program
A. Experimental Facility
Experiments were conducted in the Mach 3 wind tunnel housed in the Flow-field Imaging Lab at The University
of Texas at Austin. The wind tunnel is designed with a full-span splitter plate built into the nozzle to allow for wake
formation in the test section; the splitter plate thickness, h, is 6.35 mm. The test section has cross-sectional
dimensions of 50.8 mm by 50.8 mm. The tunnel is supplied by a 7 m3 storage tank held at 10 atm and exhausts to a
20 m3 vacuum tank evacuated to 60 Torr. Typical operation uses a plenum pressure (Po) of 135 kPa and a stagnation
temperature (To) of 300K. The test section has an S1-fused silica ceiling window and two acrylic side windows to
provide optical access for the laser diagnostic techniques used.
American Institute of Aeronautics and Astronautics
3
B. Hypermixer Model
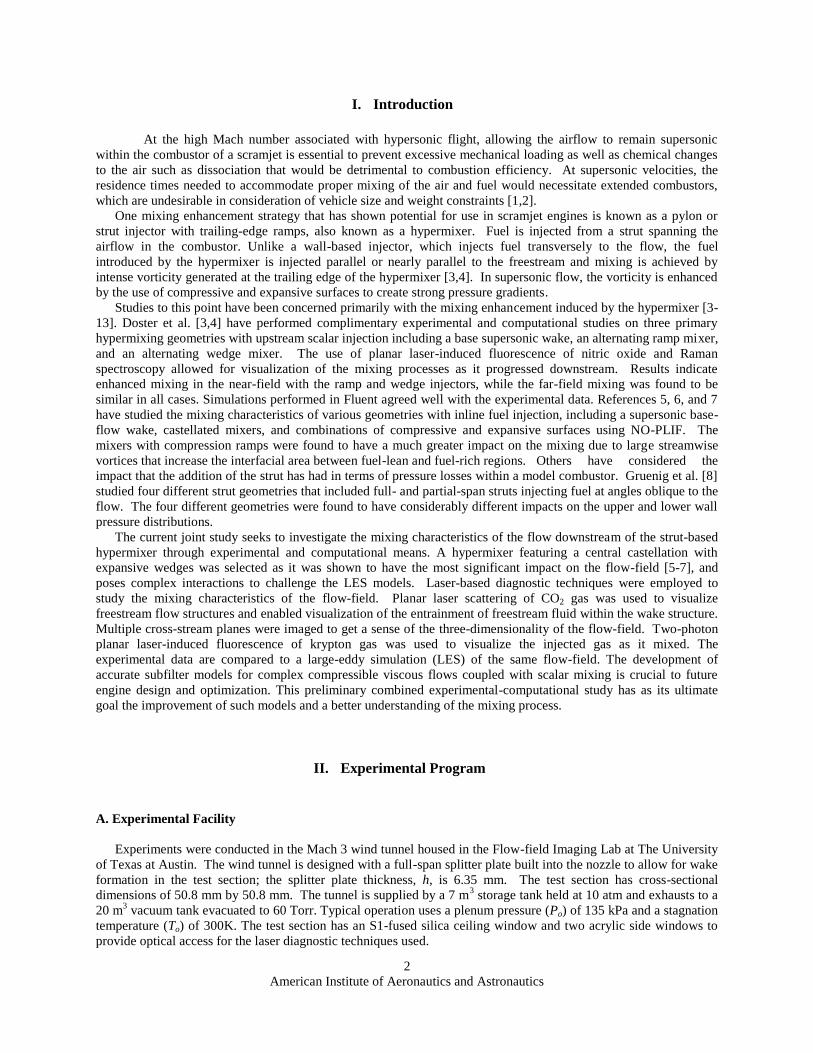
The hypermixer was built into a splitter plate that divides the test section of the Mach 3 wind tunnel.
Interchangeable attachments to the end of the splitter plate allow for variation of the geometry being studied. Figure
1 shows the layout of the splitter plate and hypermixer model with respect to the test section. The mixer used in this
study is depicted in Fig. 2. The design is a castellated base flanked by two expansion wedges with a 10° half angle.
The hypermixer was equipped with a single fuel-injection port of diameter (d ) equal to 3.175 mm. The jet is
injected downstream, parallel to the freestream direction. The jet flow rate could be pulsed by using a fast response
solenoid valve with control module (Parker-Hannifin Iota One). Pulsing of the jet flow rate was desirable because in
some cases krypton gas was used and pulsing enabled us to reduce the amount of this expensive gas that was used.
Figure 1: Layout of Mach 3 test section and hypermixer model
Figure 2: Hypermixer model
C. Planar Laser Scattering (PLS)
Planar laser scattering of carbon dioxide condensate was used to visualize the freestream flow, wave structures,
and the mixing of the freestream fluid with the wake or jet fluid. In this technique, CO2 gas was injected into the
freestream air upstream of the plenum at a rate of 150 slpm. As the gas expanded through the supersonic nozzle, the
carbon dioxide gas condensed into a fine fog, providing an excellent medium for light scattering. In regions of
higher temperature, such as boundary layers or recirculation regions, the condensed fog re-evaporates, and thus no
scattering occurs in these regions.
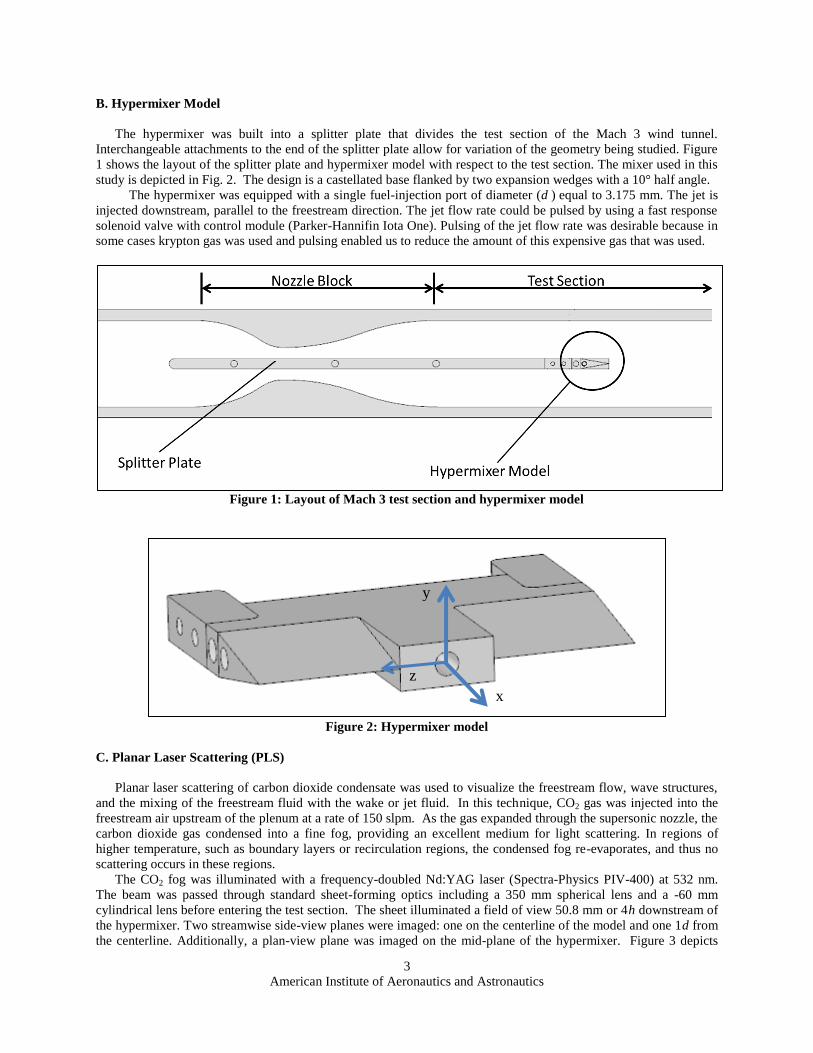
The CO2 fog was illuminated with a frequency-doubled Nd:YAG laser (Spectra-Physics PIV-400) at 532 nm.
The beam was passed through standard sheet-forming optics including a 350 mm spherical lens and a -60 mm
cylindrical lens before entering the test section. The sheet illuminated a field of view 50.8 mm or 4h downstream of
the hypermixer. Two streamwise side-view planes were imaged: one on the centerline of the model and one 1d from
the centerline. Additionally, a plan-view plane was imaged on the mid-plane of the hypermixer. Figure 3 depicts
x
y
z
American Institute of Aeronautics and Astronautics
4
these different fields of view. The scattered light was imaged with a back-illuminated CCD camera (PixelVision
SV512V1) at 0.85 Hz using a 105 mm Nikon lens at f/2.8 for the side-views and a 50 mm Nikon lens at f/2.4 for the
plan-views.
For the cases investigated with jet injection, argon gas was used as the jet fluid with a stagnation pressure of 282
Torr. Fuel was delivered in 90 millisecond bursts synced with the camera trigger. The duration of the burst was
sufficient for the jet to reach a quasi-steady state by the time the laser pulse illuminated the flow.
Figure 3: Fields of view for PLS experiment; (a) Side-view and (b) plan-view
D. Krypton Planar Laser-Induced Fluorescence (Kr PLIF)
Planar Laser-Induced fluorescence of krypton (Kr) gas was used to visualize the mixing of the jet fluid. The
technique involves the excitation of the 5p[3/2]2 4p6
1S0 transition of krypton. Excitation is achieved by using
two-photon absorption of 214.7 nm laser light. The fluorescence signal is collected from two lines centered at 760
and 819 nm.
The 214.7 nm laser beam was created through a wave mixing process. An Nd:YAG-pumped dye laser
(Lumonics HyperDye 300) was used to produce a beam at 544 nm. This dye laser operated with fluorescein 548 dye
doped with sodium hydroxide in a 2:1 ratio (2 moles of NaOH for every mole of dye) to shift the peak output
wavelength to a slightly higher frequency. Simultaneously, a frequency-tripled Nd:YAG laser (Spectra Physics
GCR-150) was used to produce a beam at 354.7 nm. The two beams were combined in a β-barium borate (BBO)
crystal housed in an Inrad Autotracker II. The 214.7 nm beam was separated using a fused silica Pellin-Broca prism.
The beam was then passed through standard sheet forming optics including a 300 mm spherical lens and a -75 mm
cylindrical lens, allowing for a relatively uniform sheet 13 mm or 2h wide. Approximately 5 mJ/pulse was used to
excite the krypton gas.
The fuel-injection port of the hypermixer model was supplied with pure krypton gas through the same solenoid
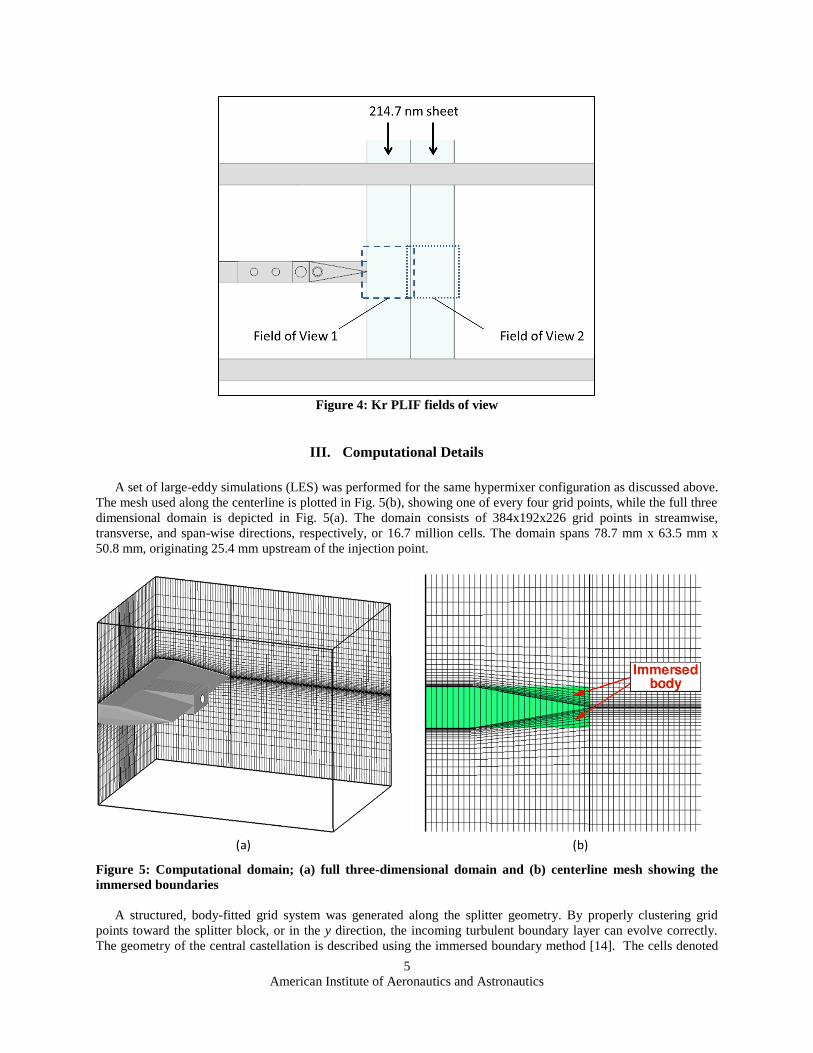
valve used in the PLS experiments described above. Two side-view (x-y) field of view were used: one that spanned
the range of x = 0 to 2h and another further downstream (x = 2h to 4h). Two side-view fields of view were used: one
on the spanwise centerline (z = 0) and the other at z = 1d. Figure 4 shows these fields of view. All imaging was
done using a back-illuminated CCD camera (PixelVision SV512V1) with a 50 mm Canon lens at f/1.2 with two
extension tubes totaling 18 mm. The camera trigger was synced with the pulsed valve.
American Institute of Aeronautics and Astronautics
5
Figure 4: Kr PLIF fields of view
III. Computational Details
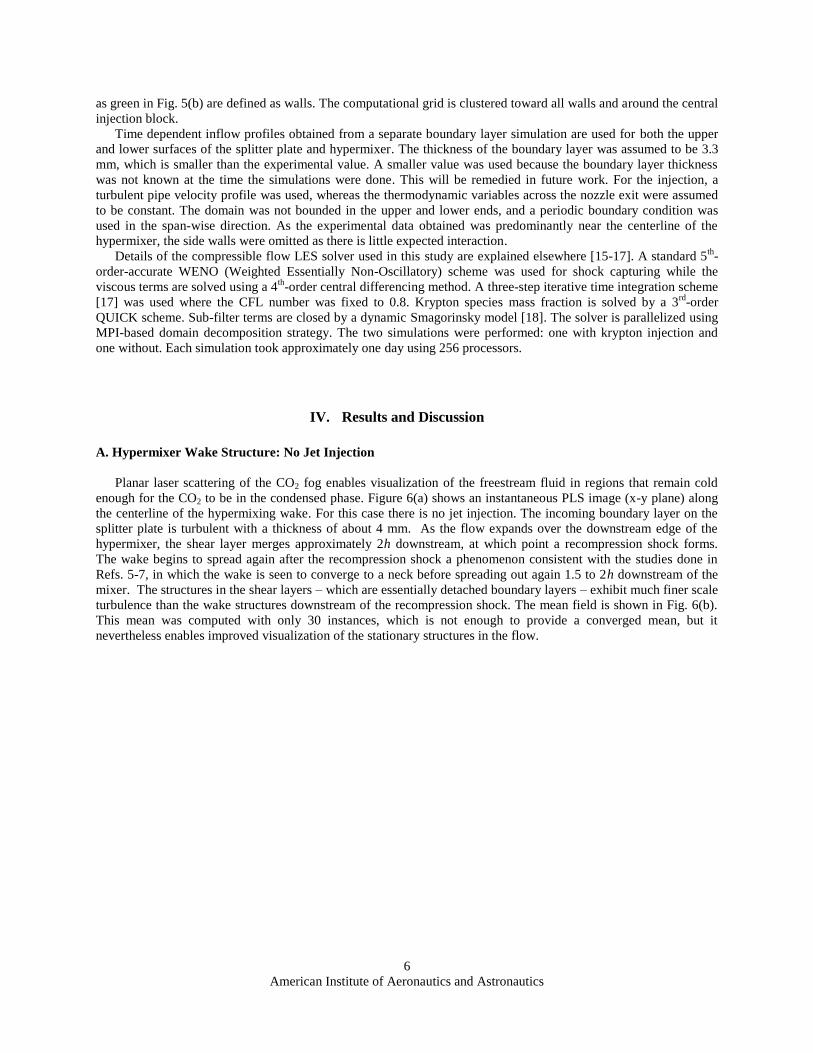
A set of large-eddy simulations (LES) was performed for the same hypermixer configuration as discussed above.
The mesh used along the centerline is plotted in Fig. 5(b), showing one of every four grid points, while the full three
dimensional domain is depicted in Fig. 5(a). The domain consists of 384x192x226 grid points in streamwise,
transverse, and span-wise directions, respectively, or 16.7 million cells. The domain spans 78.7 mm x 63.5 mm x
50.8 mm, originating 25.4 mm upstream of the injection point.
Figure 5: Computational domain; (a) full three-dimensional domain and (b) centerline mesh showing the
immersed boundaries
A structured, body-fitted grid system was generated along the splitter geometry. By properly clustering grid
points toward the splitter block, or in the y direction, the incoming turbulent boundary layer can evolve correctly.
The geometry of the central castellation is described using the immersed boundary method [14]. The cells denoted
American Institute of Aeronautics and Astronautics
6
as green in Fig. 5(b) are defined as walls. The computational grid is clustered toward all walls and around the central
injection block.
Time dependent inflow profiles obtained from a separate boundary layer simulation are used for both the upper
and lower surfaces of the splitter plate and hypermixer. The thickness of the boundary layer was assumed to be 3.3
mm, which is smaller than the experimental value. A smaller value was used because the boundary layer thickness
was not known at the time the simulations were done. This will be remedied in future work. For the injection, a
turbulent pipe velocity profile was used, whereas the thermodynamic variables across the nozzle exit were assumed
to be constant. The domain was not bounded in the upper and lower ends, and a periodic boundary condition was
used in the span-wise direction. As the experimental data obtained was predominantly near the centerline of the
hypermixer, the side walls were omitted as there is little expected interaction.
Details of the compressible flow LES solver used in this study are explained elsewhere [15-17]. A standard 5th
-
order-accurate WENO (Weighted Essentially Non-Oscillatory) scheme was used for shock capturing while the
viscous terms are solved using a 4th
-order central differencing method. A three-step iterative time integration scheme
[17] was used where the CFL number was fixed to 0.8. Krypton species mass fraction is solved by a 3rd
-order
QUICK scheme. Sub-filter terms are closed by a dynamic Smagorinsky model [18]. The solver is parallelized using
MPI-based domain decomposition strategy. The two simulations were performed: one with krypton injection and
one without. Each simulation took approximately one day using 256 processors.
IV. Results and Discussion
A. Hypermixer Wake Structure: No Jet Injection
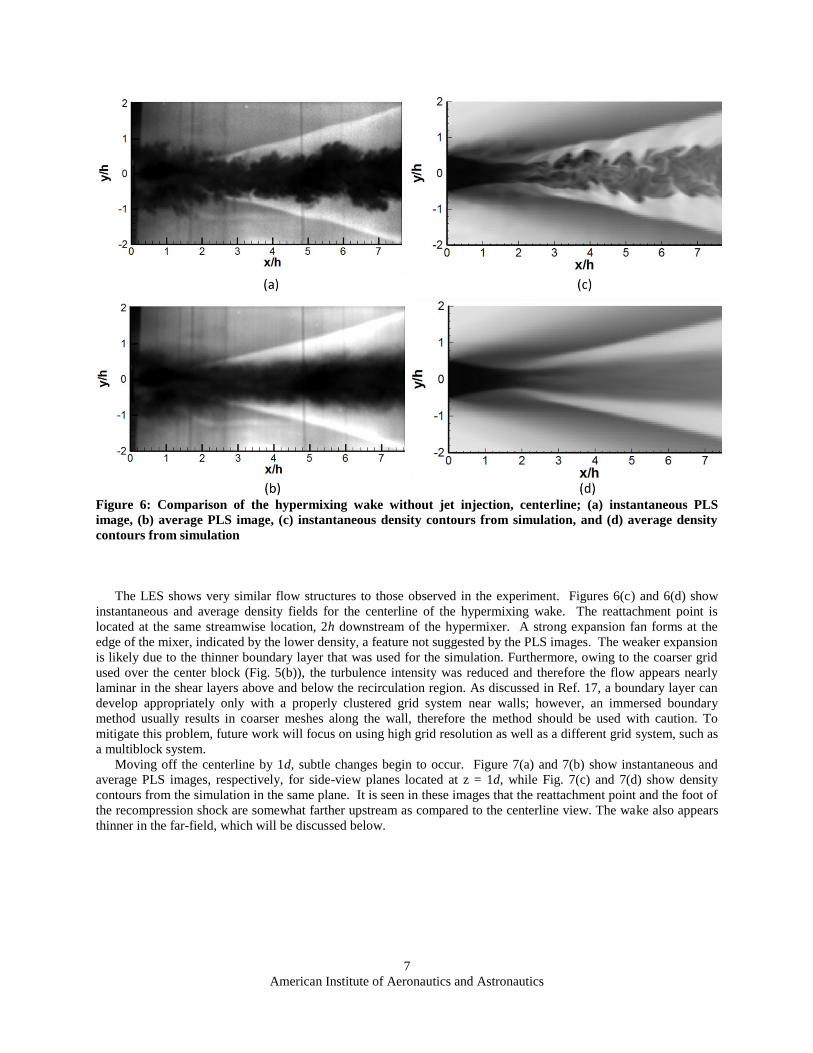
Planar laser scattering of the CO2 fog enables visualization of the freestream fluid in regions that remain cold
enough for the CO2 to be in the condensed phase. Figure 6(a) shows an instantaneous PLS image (x-y plane) along
the centerline of the hypermixing wake. For this case there is no jet injection. The incoming boundary layer on the
splitter plate is turbulent with a thickness of about 4 mm. As the flow expands over the downstream edge of the
hypermixer, the shear layer merges approximately 2h downstream, at which point a recompression shock forms.
The wake begins to spread again after the recompression shock a phenomenon consistent with the studies done in
Refs. 5-7, in which the wake is seen to converge to a neck before spreading out again 1.5 to 2h downstream of the
mixer. The structures in the shear layers – which are essentially detached boundary layers – exhibit much finer scale
turbulence than the wake structures downstream of the recompression shock. The mean field is shown in Fig. 6(b).
This mean was computed with only 30 instances, which is not enough to provide a converged mean, but it
nevertheless enables improved visualization of the stationary structures in the flow.
American Institute of Aeronautics and Astronautics
7
Figure 6: Comparison of the hypermixing wake without jet injection, centerline; (a) instantaneous PLS
image, (b) average PLS image, (c) instantaneous density contours from simulation, and (d) average density
contours from simulation
The LES shows very similar flow structures to those observed in the experiment. Figures 6(c) and 6(d) show
instantaneous and average density fields for the centerline of the hypermixing wake. The reattachment point is
located at the same streamwise location, 2h downstream of the hypermixer. A strong expansion fan forms at the
edge of the mixer, indicated by the lower density, a feature not suggested by the PLS images. The weaker expansion
is likely due to the thinner boundary layer that was used for the simulation. Furthermore, owing to the coarser grid
used over the center block (Fig. 5(b)), the turbulence intensity was reduced and therefore the flow appears nearly
laminar in the shear layers above and below the recirculation region. As discussed in Ref. 17, a boundary layer can
develop appropriately only with a properly clustered grid system near walls; however, an immersed boundary
method usually results in coarser meshes along the wall, therefore the method should be used with caution. To
mitigate this problem, future work will focus on using high grid resolution as well as a different grid system, such as
a multiblock system.
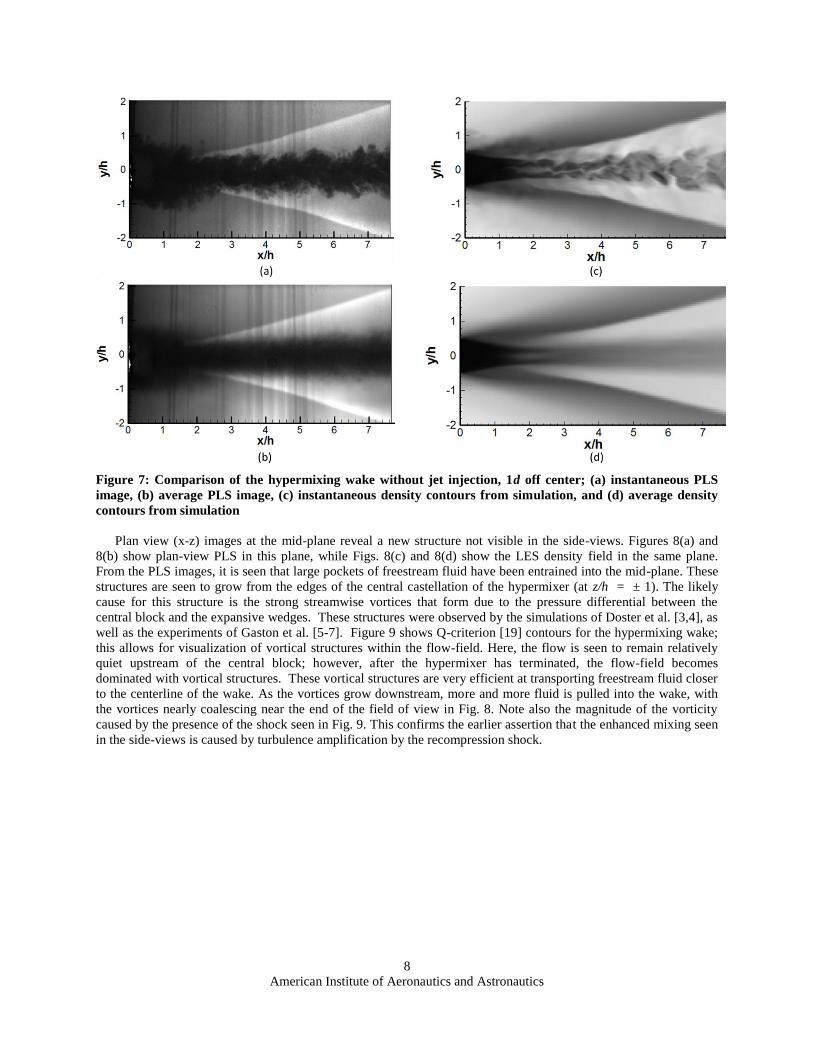
Moving off the centerline by 1d, subtle changes begin to occur. Figure 7(a) and 7(b) show instantaneous and
average PLS images, respectively, for side-view planes located at z = 1d, while Fig. 7(c) and 7(d) show density
contours from the simulation in the same plane. It is seen in these images that the reattachment point and the foot of
the recompression shock are somewhat farther upstream as compared to the centerline view. The wake also appears
thinner in the far-field, which will be discussed below.
American Institute of Aeronautics and Astronautics
8
Figure 7: Comparison of the hypermixing wake without jet injection, 1d off center; (a) instantaneous PLS
image, (b) average PLS image, (c) instantaneous density contours from simulation, and (d) average density
contours from simulation
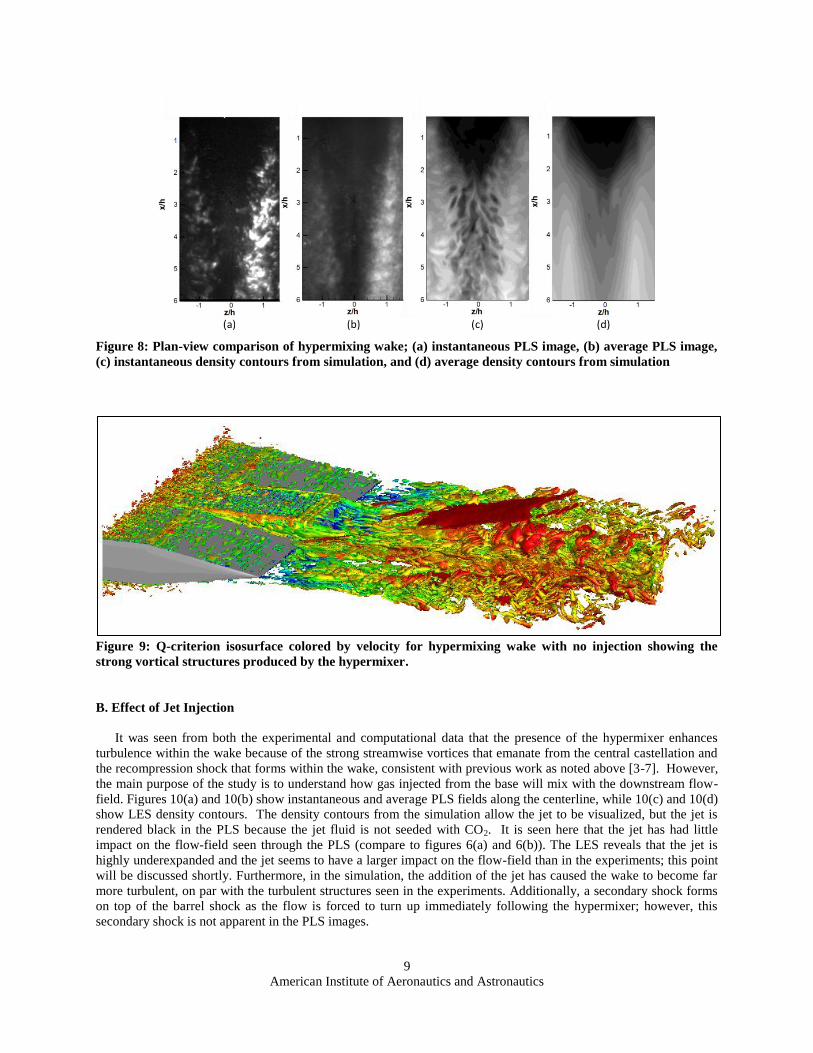
Plan view (x-z) images at the mid-plane reveal a new structure not visible in the side-views. Figures 8(a) and
8(b) show plan-view PLS in this plane, while Figs. 8(c) and 8(d) show the LES density field in the same plane.
From the PLS images, it is seen that large pockets of freestream fluid have been entrained into the mid-plane. These
structures are seen to grow from the edges of the central castellation of the hypermixer (at z/h = ± 1). The likely
cause for this structure is the strong streamwise vortices that form due to the pressure differential between the
central block and the expansive wedges. These structures were observed by the simulations of Doster et al. [3,4], as
well as the experiments of Gaston et al. [5-7]. Figure 9 shows Q-criterion [19] contours for the hypermixing wake;
this allows for visualization of vortical structures within the flow-field. Here, the flow is seen to remain relatively
quiet upstream of the central block; however, after the hypermixer has terminated, the flow-field becomes
dominated with vortical structures. These vortical structures are very efficient at transporting freestream fluid closer
to the centerline of the wake. As the vortices grow downstream, more and more fluid is pulled into the wake, with
the vortices nearly coalescing near the end of the field of view in Fig. 8. Note also the magnitude of the vorticity
caused by the presence of the shock seen in Fig. 9. This confirms the earlier assertion that the enhanced mixing seen
in the side-views is caused by turbulence amplification by the recompression shock.
American Institute of Aeronautics and Astronautics
9
Figure 8: Plan-view comparison of hypermixing wake; (a) instantaneous PLS image, (b) average PLS image,
(c) instantaneous density contours from simulation, and (d) average density contours from simulation
Figure 9: Q-criterion isosurface colored by velocity for hypermixing wake with no injection showing the
strong vortical structures produced by the hypermixer.
B. Effect of Jet Injection
It was seen from both the experimental and computational data that the presence of the hypermixer enhances
turbulence within the wake because of the strong streamwise vortices that emanate from the central castellation and
the recompression shock that forms within the wake, consistent with previous work as noted above [3-7]. However,
the main purpose of the study is to understand how gas injected from the base will mix with the downstream flow-
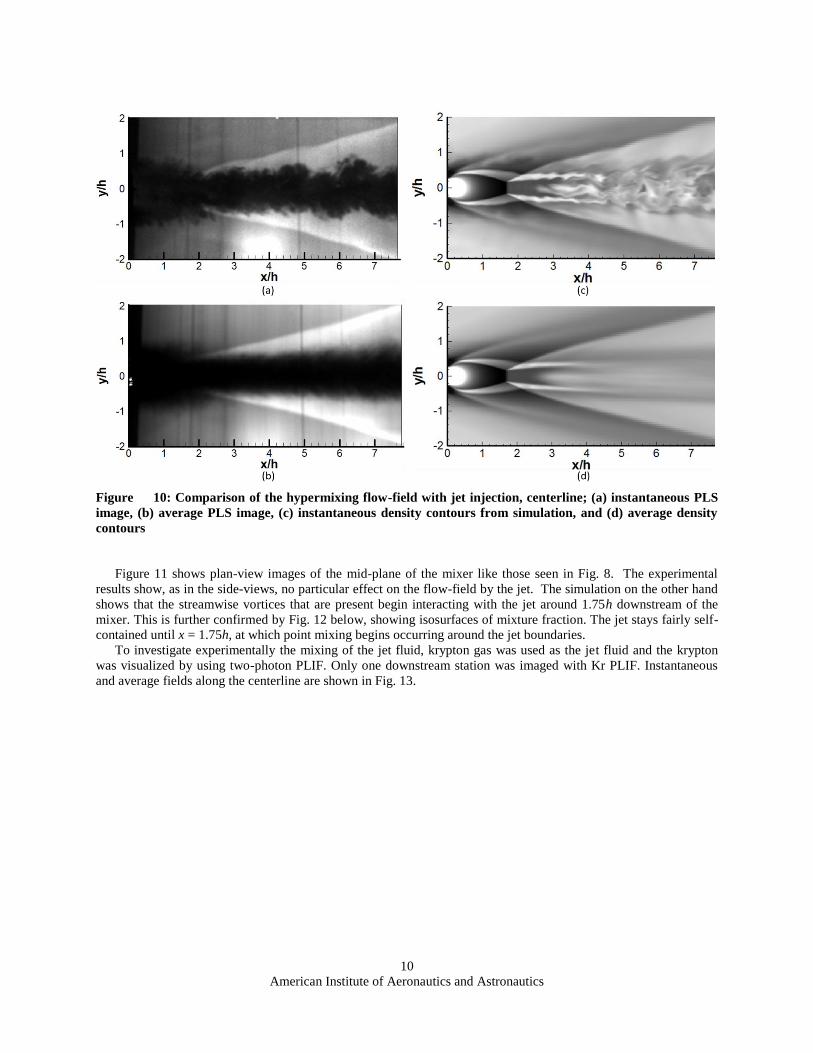
field. Figures 10(a) and 10(b) show instantaneous and average PLS fields along the centerline, while 10(c) and 10(d)
show LES density contours. The density contours from the simulation allow the jet to be visualized, but the jet is
rendered black in the PLS because the jet fluid is not seeded with CO2. It is seen here that the jet has had little
impact on the flow-field seen through the PLS (compare to figures 6(a) and 6(b)). The LES reveals that the jet is
highly underexpanded and the jet seems to have a larger impact on the flow-field than in the experiments; this point
will be discussed shortly. Furthermore, in the simulation, the addition of the jet has caused the wake to become far
more turbulent, on par with the turbulent structures seen in the experiments. Additionally, a secondary shock forms
on top of the barrel shock as the flow is forced to turn up immediately following the hypermixer; however, this
secondary shock is not apparent in the PLS images.
American Institute of Aeronautics and Astronautics
10
Figure 10: Comparison of the hypermixing flow-field with jet injection, centerline; (a) instantaneous PLS
image, (b) average PLS image, (c) instantaneous density contours from simulation, and (d) average density
contours
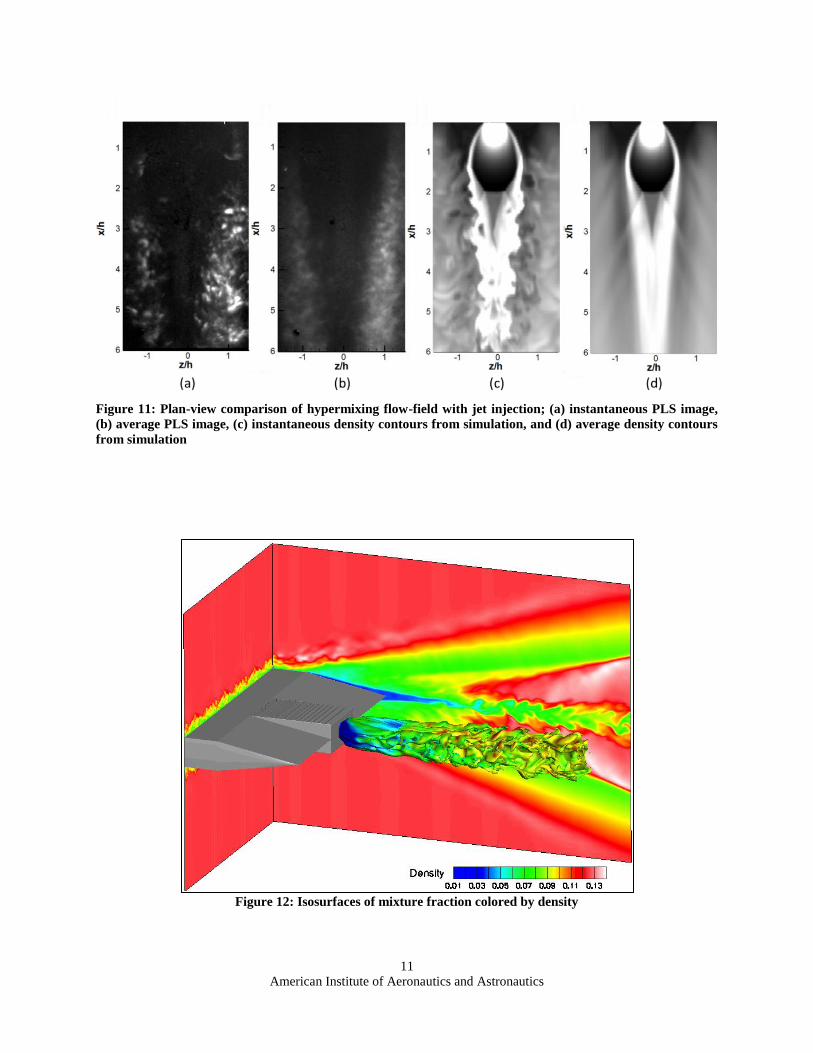
Figure 11 shows plan-view images of the mid-plane of the mixer like those seen in Fig. 8. The experimental
results show, as in the side-views, no particular effect on the flow-field by the jet. The simulation on the other hand
shows that the streamwise vortices that are present begin interacting with the jet around 1.75h downstream of the
mixer. This is further confirmed by Fig. 12 below, showing isosurfaces of mixture fraction. The jet stays fairly self-
contained until x = 1.75h, at which point mixing begins occurring around the jet boundaries.
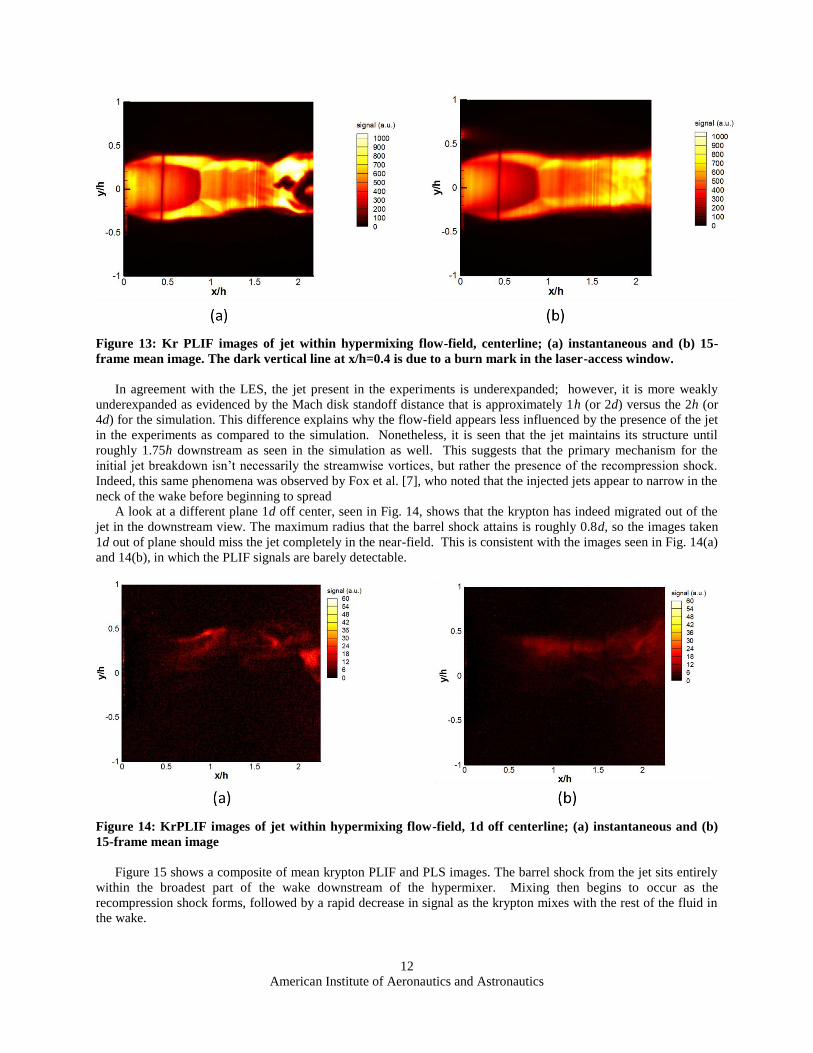
To investigate experimentally the mixing of the jet fluid, krypton gas was used as the jet fluid and the krypton
was visualized by using two-photon PLIF. Only one downstream station was imaged with Kr PLIF. Instantaneous
and average fields along the centerline are shown in Fig. 13.
American Institute of Aeronautics and Astronautics
11
Figure 11: Plan-view comparison of hypermixing flow-field with jet injection; (a) instantaneous PLS image,
(b) average PLS image, (c) instantaneous density contours from simulation, and (d) average density contours
from simulation
Figure 12: Isosurfaces of mixture fraction colored by density
American Institute of Aeronautics and Astronautics
12
Figure 13: Kr PLIF images of jet within hypermixing flow-field, centerline; (a) instantaneous and (b) 15-
frame mean image. The dark vertical line at x/h=0.4 is due to a burn mark in the laser-access window.
In agreement with the LES, the jet present in the experiments is underexpanded; however, it is more weakly
underexpanded as evidenced by the Mach disk standoff distance that is approximately 1h (or 2d) versus the 2h (or
4d) for the simulation. This difference explains why the flow-field appears less influenced by the presence of the jet
in the experiments as compared to the simulation. Nonetheless, it is seen that the jet maintains its structure until
roughly 1.75h downstream as seen in the simulation as well. This suggests that the primary mechanism for the
initial jet breakdown isn’t necessarily the streamwise vortices, but rather the presence of the recompression shock.
Indeed, this same phenomena was observed by Fox et al. [7], who noted that the injected jets appear to narrow in the
neck of the wake before beginning to spread
A look at a different plane 1d off center, seen in Fig. 14, shows that the krypton has indeed migrated out of the
jet in the downstream view. The maximum radius that the barrel shock attains is roughly 0.8d, so the images taken
1d out of plane should miss the jet completely in the near-field. This is consistent with the images seen in Fig. 14(a)
and 14(b), in which the PLIF signals are barely detectable.
Figure 14: KrPLIF images of jet within hypermixing flow-field, 1d off centerline; (a) instantaneous and (b)
15-frame mean image
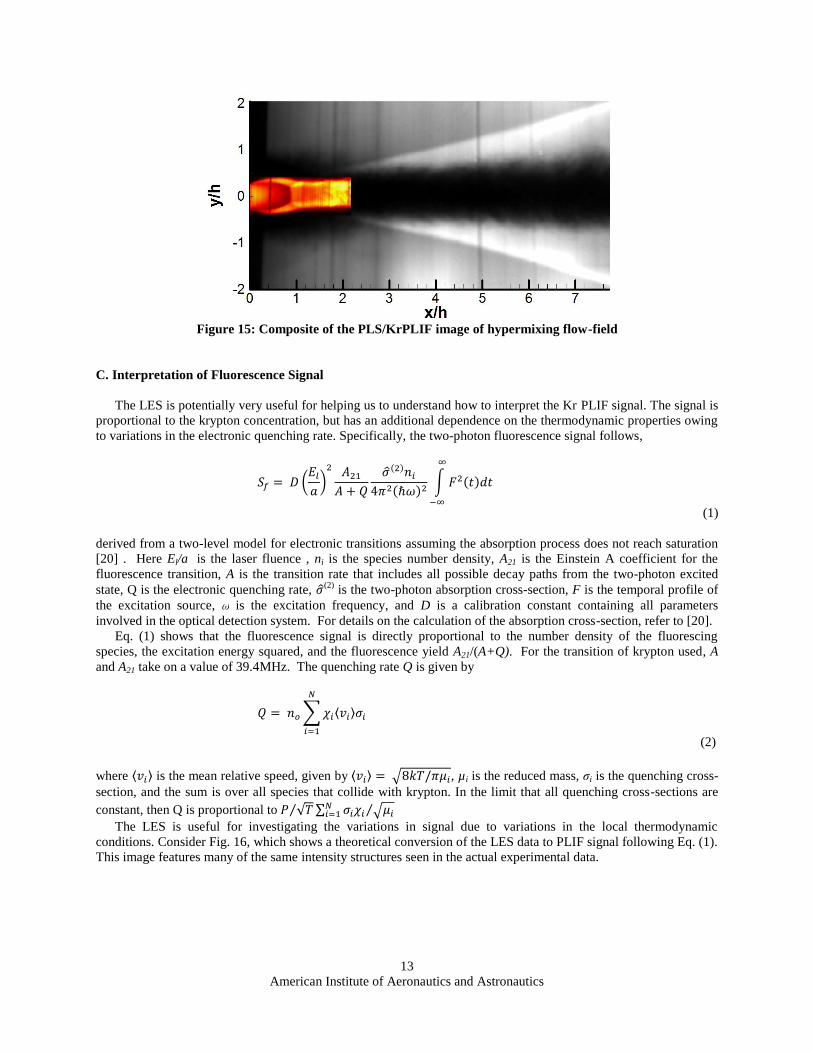
Figure 15 shows a composite of mean krypton PLIF and PLS images. The barrel shock from the jet sits entirely
within the broadest part of the wake downstream of the hypermixer. Mixing then begins to occur as the
recompression shock forms, followed by a rapid decrease in signal as the krypton mixes with the rest of the fluid in
the wake.
American Institute of Aeronautics and Astronautics
13
Figure 15: Composite of the PLS/KrPLIF image of hypermixing flow-field
C. Interpretation of Fluorescence Signal
The LES is potentially very useful for helping us to understand how to interpret the Kr PLIF signal. The signal is
proportional to the krypton concentration, but has an additional dependence on the thermodynamic properties owing
to variations in the electronic quenching rate. Specifically, the two-photon fluorescence signal follows,
( )
( ) ( )
∫ ( )
(1)
derived from a two-level model for electronic transitions assuming the absorption process does not reach saturation
[20] . Here El/a is the laser fluence , ni is the species number density, A21 is the Einstein A coefficient for the
fluorescence transition, A is the transition rate that includes all possible decay paths from the two-photon excited
state, Q is the electronic quenching rate, (2) is the two-photon absorption cross-section, F is the temporal profile of
the excitation source, ω is the excitation frequency, and D is a calibration constant containing all parameters
involved in the optical detection system. For details on the calculation of the absorption cross-section, refer to [20].
Eq. (1) shows that the fluorescence signal is directly proportional to the number density of the fluorescing
species, the excitation energy squared, and the fluorescence yield A21/(A+Q). For the transition of krypton used, A
and A21 take on a value of 39.4MHz. The quenching rate Q is given by
∑ ⟨ ⟩
(2)
where ⟨ ⟩ is the mean relative speed, given by ⟨ ⟩ √ , µi is the reduced mass, σi is the quenching cross-
section, and the sum is over all species that collide with krypton. In the limit that all quenching cross-sections are
constant, then Q is proportional to √ ⁄ ∑ √ ⁄
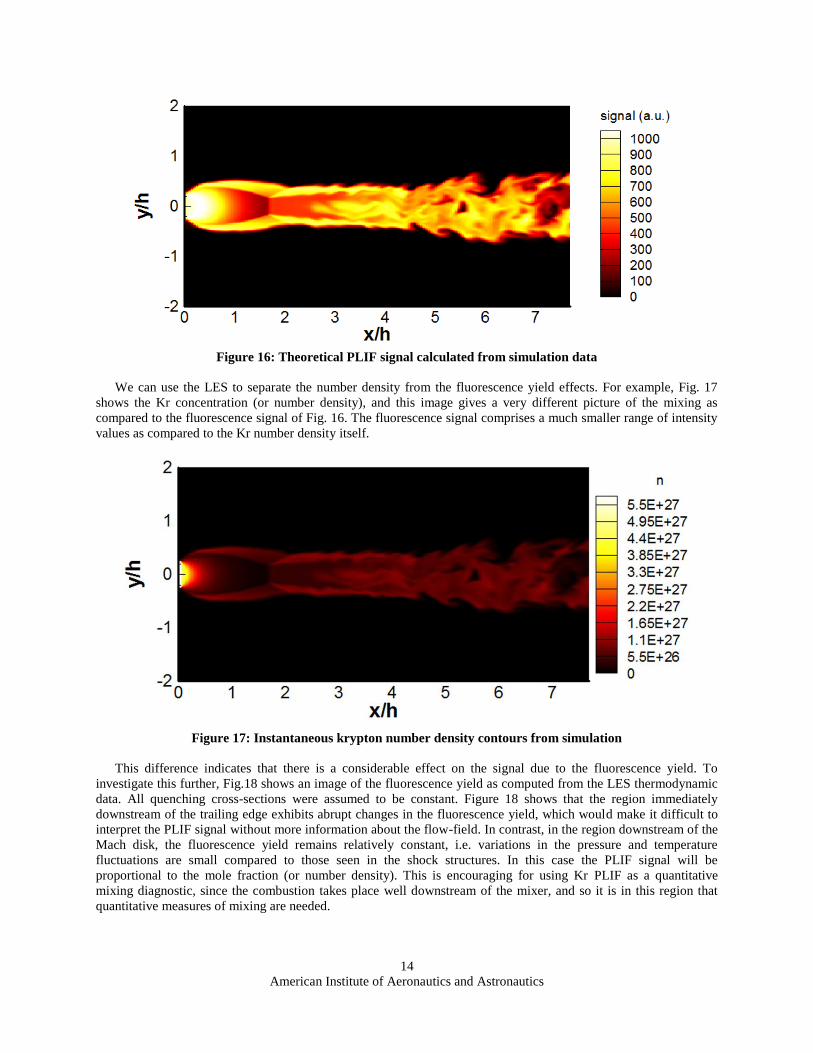
The LES is useful for investigating the variations in signal due to variations in the local thermodynamic
conditions. Consider Fig. 16, which shows a theoretical conversion of the LES data to PLIF signal following Eq. (1).
This image features many of the same intensity structures seen in the actual experimental data.
American Institute of Aeronautics and Astronautics
14
Figure 16: Theoretical PLIF signal calculated from simulation data
We can use the LES to separate the number density from the fluorescence yield effects. For example, Fig. 17
shows the Kr concentration (or number density), and this image gives a very different picture of the mixing as
compared to the fluorescence signal of Fig. 16. The fluorescence signal comprises a much smaller range of intensity
values as compared to the Kr number density itself.
Figure 17: Instantaneous krypton number density contours from simulation
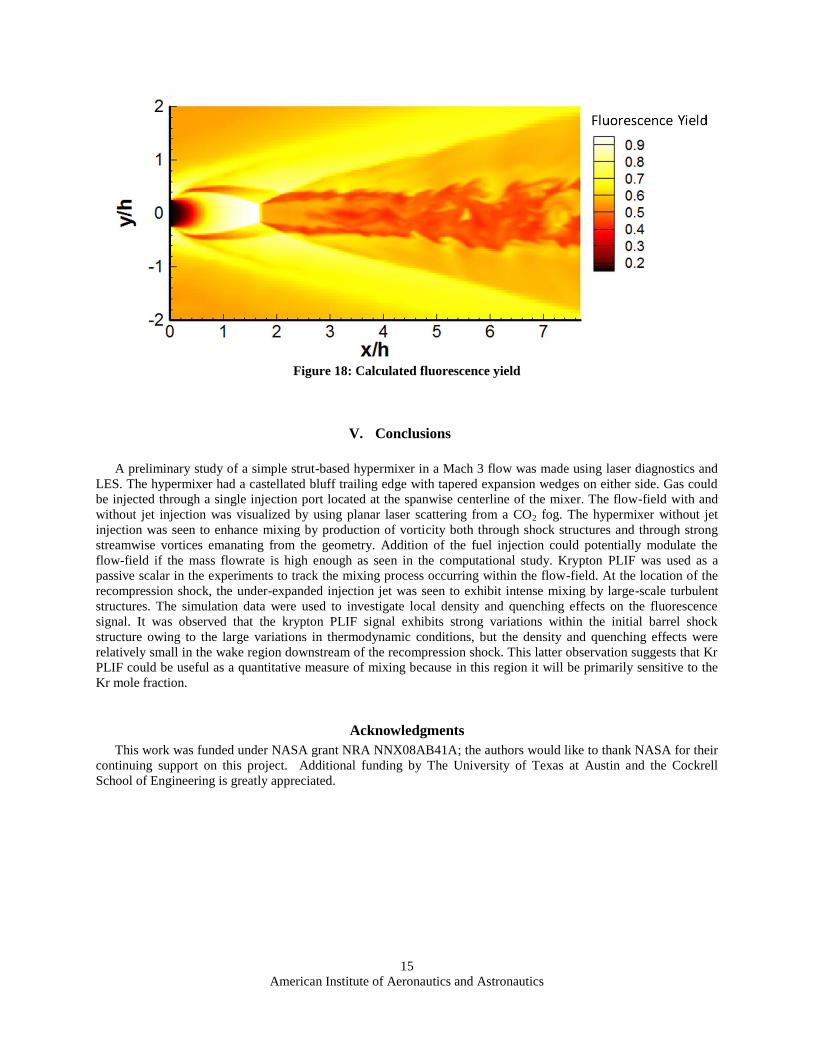
This difference indicates that there is a considerable effect on the signal due to the fluorescence yield. To
investigate this further, Fig.18 shows an image of the fluorescence yield as computed from the LES thermodynamic
data. All quenching cross-sections were assumed to be constant. Figure 18 shows that the region immediately
downstream of the trailing edge exhibits abrupt changes in the fluorescence yield, which would make it difficult to
interpret the PLIF signal without more information about the flow-field. In contrast, in the region downstream of the
Mach disk, the fluorescence yield remains relatively constant, i.e. variations in the pressure and temperature
fluctuations are small compared to those seen in the shock structures. In this case the PLIF signal will be
proportional to the mole fraction (or number density). This is encouraging for using Kr PLIF as a quantitative
mixing diagnostic, since the combustion takes place well downstream of the mixer, and so it is in this region that
quantitative measures of mixing are needed.
American Institute of Aeronautics and Astronautics
15
Figure 18: Calculated fluorescence yield
V. Conclusions
A preliminary study of a simple strut-based hypermixer in a Mach 3 flow was made using laser diagnostics and
LES. The hypermixer had a castellated bluff trailing edge with tapered expansion wedges on either side. Gas could
be injected through a single injection port located at the spanwise centerline of the mixer. The flow-field with and
without jet injection was visualized by using planar laser scattering from a CO2 fog. The hypermixer without jet
injection was seen to enhance mixing by production of vorticity both through shock structures and through strong
streamwise vortices emanating from the geometry. Addition of the fuel injection could potentially modulate the
flow-field if the mass flowrate is high enough as seen in the computational study. Krypton PLIF was used as a
passive scalar in the experiments to track the mixing process occurring within the flow-field. At the location of the
recompression shock, the under-expanded injection jet was seen to exhibit intense mixing by large-scale turbulent
structures. The simulation data were used to investigate local density and quenching effects on the fluorescence
signal. It was observed that the krypton PLIF signal exhibits strong variations within the initial barrel shock
structure owing to the large variations in thermodynamic conditions, but the density and quenching effects were
relatively small in the wake region downstream of the recompression shock. This latter observation suggests that Kr
PLIF could be useful as a quantitative measure of mixing because in this region it will be primarily sensitive to the
Kr mole fraction.
Acknowledgments
This work was funded under NASA grant NRA NNX08AB41A; the authors would like to thank NASA for their
continuing support on this project. Additional funding by The University of Texas at Austin and the Cockrell
School of Engineering is greatly appreciated.
American Institute of Aeronautics and Astronautics
16
References
1Gruber, M.R., Baurle, R.A, Mathur, T., and Hsu, K.Y., “Fundamental Studies of Cavity Based Flame Holder Concepts for
Supersonic Combustors”, Journal of Propulsion and Power, Vol. 17, No.1, Jan-Feb 2001. 2Drummond, J.P., Diskin, G.S., and Cutler, A.D., “Fuel-Air Mixing and Combustion in Scramjets,” 38th AIAA Joint
Propulsion Conference and Exhibit, AIAA-2002-3878. 3Doster, J.C., King, P.I., Gruber, M.R., Carter, C.D., Ryan, M.D., and Hsu, K.Y., “Experimental Investigation of Air and
Methane Injection from In-stream Fueling Pylons,” 44th AIAA Joint Propulsion Conference and Exhibit, AIAA-2008-4501. 4Doster, J.C., King, P.I., Gruber, M.R., and Maple, R.C., “Pylon Fuel Injector Design for a Scramjet Combustor,” 43rd AIAA
Joint Propulsion Conference and Exhibit, AIAA-2007-5404. 5Gaston, M.J., Houwing, A.F.P., Mudford, N.R., Danehy, P.M., and Fox, J.S., “Fluorescence Imaging of Mixing Flow-fields
and Comparisons with Computations Fluid Dynamic Simulations,” Shock Waves, Vol. 12, 2002. 6Fox, J.S. Houwing, A.F.P., Danehy, P.M., Gaston. M.J., Mudford,N.R., and Gai, S.L.,“Mole-Fraction-Sensitive Imaging of
Hypermixing Shear Layers,” Journal of Propulsion and Power, Vol. 17, No. 2, 2001. 7Fox, J.S., Gaston M.J., Houwing, A.F.P., Danehy, P.M., Mudford, N.R., and Gai, S.L., “Instantaneous Mole-Fraction PLIF
Imaging of Mixing Layers Behind Hypermixing Injectors,” 37th AIAA Aerospace Sciences Meeting, AIAA-99-0774. 8Gruenig, C., Avrashkov, V., and Mayinger, F., “Fuel Injection into a Supersonic Airflow by Means of Pylons,” Journal of
Propulsion and Power, Vol. 16, No. 1, 2000. 9Desikan, S.L.N. and Kurian, J., “Mixing Studies in Supersonic Flow Employing Strut Based Hypermixers,” 41st AIAA Joint
Propulsion Conference and Exhibit, AIAA-2005-3643. 10Haubelt, L.C., King, P.I., Gruber, M.R., Carter, C.D., and Hsu, K.Y., “Performance of Pylons Upstream of a Cavity-Based
Flameholder in Non-Reacting Supersonic Flow,” 42nd AIAA Joint Propulsion Conference and Exhibit, AIAA-2006-4679. 11Goro, M., Domuro, T., Murakami, A., Shinozaki, N., Nakamura, A., Murayama, M. and Ohwaki, K., “Ignition and
Combustion Performance of a Scramjet Combustor with a Fuel Injection Strut,” Proceedings of 11th International
Symposium on Air Breathing Engines, Vol. 1, 1993. 12Curran, E.T., Heiser, W.H., and Pratt, D.T., “Fluid Phenomena in Scramjet Combustion Systems,” Annual Review Fluid
Mechanics, Vol. 28, 1996. 13O’Byrne,S., Doolan, M., Olsen, S.R., and Houwing, A.F.P., “Measurement and Imaging of Supersonic Combustion in a
Model Scramjet Engine,” Shock Waves, Vol. 9, 1999. 14Ghias, R., Mittal, R., and Dong, H., “A Sharp Interface Immersed Boundary Method for Compressible Viscous Flows,”
Journal of Computational Physics, Vol. 225, 1997. 15Koo, H., and Raman, V., “Large-Eddy Simulation of a Supersonic Inlet-Isolator,” in preparation. 16Koo, H., and Raman, V., “Detailed Numerical Simulations of a Supersonic Inlet-Isolator,” Sixth International Symposium
on Turbulence and Shear Flow Phenomena, 2009 17Koo, H., “Large-Eddy Simulations of Scramjet Engines,” PhD thesis, The University of Texas at Austin, 2011. 18Ghosal, S., Lund, T. S., Moin, P., and Akselvoll, K., “A dynamic localization model for Large- Eddy
Simulation of Turbulent Flows,” Journal of Fluid Mechanics, Vol. 286, 1995. 19Jeong, J., and Hussain, F., “On the Identification of a Vortex,” Journal of Fluid Mechanics, Vol. 285, 1995. 20Eichhorn, C., Löhle, S., Bode, M., Fritzsche, and Auweter-Kurtz, M., “Measurement of Two-Photon Absorption Cross-
Section in Neutral Xenon: First Results,” 40th AIAA Plasmadynamics and Lasers Conference, AIAA-2009-4227.


![AC 2012-3936: INSTRUMENTATION FOR AN EMBEDDED …...integrated design environment[3] (IDE) for HCS12 microcontroller[4] system design, (b) Mathworks" MATLAB! and SIMULINK! for data](https://img.pdfslide.us/doc/110x75/5e703584b163577aad52de4a/ac-2012-3936-instrumentation-for-an-embedded-integrated-design-environment3.jpg)