Embed Size (px)
Citation preview
1
Experimental and Computational Investigations on Strain Rate Sensitivity and
Deformation Behavior of Bulk Materials Made of Epoxy Resin Structural
Adhesive
Takeshi Iwamoto*+, Toshimasa Nagai**, Toshiyuki Sawa*
* Graduate School of Engineering, Hiroshima University, Japan
** Kobe Shipyard and Machinery Works, Mitsubishi Heavy Industries, Ltd., Japan
Abstract
The deformation behavior and strain rate sensitivity of an epoxy resin structural adhesive and a
CTBN (carboxyl-terminated butadiene-acrylonitrile) - modified epoxy resin adhesive are experimentally investigated
using an INSTRON-type material testing machine and a split Hopkinson pressure bar apparatus. The experimental
results show some fundamental features of a typical compressive stress-strain behavior of amorphous glassy polymers
with linear elastic and nonlinear inelastic deformation stages. In the inelastic deformation, a peak stress and a
strain-softening stage after the peak can be observed in the entire range of strain rate from 10-4 to 103 s-1. In addition, it
can be found that the relationship between the peak stress and strain rate on a semi-logarithmic plot is linear in the range
of low strain rate. However, the slope of the curve changes at a high strain rate, and the nonlinear behavior of the peak
stress can be obtained against the strain rate. In order to describe such a nonlinear peak stress - strain rate relationship
and the deformation behavior of the structural adhesives in a wide range of strain rate on the basis of the experimental
results, a plastic shear strain rate is formulated. Then, a three - dimensional constitutive model is derived based on a four
- elements model with an elastic series element by considering the adhesive to be a glassy polymer. The plastic
deformation rate tensor is expressed by the effective stress, which is the difference between the total stress and back
stress, and the plastic shear strain rate proposed here. The stress tensor can be obtained by solving nonlinear
2
simultaneous equation. The formulated constitutive model is implemented into the commercial FE code,
ABAQUS/Explicit, and then a computational simulation is performed. As a result, the validity of the proposed model is
shown by comparing the experimental result.
Key Words: Structural Adhesive, Impact Deformation Behavior, Constitutive Equation, Split Hopkinson Pressure Bar,
Finite Element Method
Abbreviated title: Strain Rate Sensitivity of Bulk Epoxy Resin Structural Adhesive
+Postal address: 1-4-1 Kagamiyama, Higashi-Hiroshima, Hiroshima, 739 - 8527 Japan
Tel: +81-824-24-7576, Fax.: +81-824-22-7193
E-mail: [email protected]
3
1. INTRODUCTION
With the development of polymer science in recent years, the use of adhesive bonding has been
expanding in mechanical structures and electronic devices (Fay, 2005). In accordance with a demand for these usages, it
is very important to increase its performance against deformation and their adhesive strength. To improve the
performance, fundamental research work based on polymer science and engineering is necessary, as well as applied
research work such as the evaluation of adhesive joint strength (Yokoyama and Shimizu, 1998; Sato and Ikegami, 1999,
2001).
In automobiles and other transportation industries, the use of adhesive bonding for important parts
is being actively considered to decrease carbon emission and to realize a lightweight structure. In such a case, a detailed
study of the stress distribution in such adhesive joints under impact loading is essential since the adhesive joints undergo
impact loading (Yokoyama and Shimizu, 1998; Sato and Ikegami, 1999, 2001). In an adhesive joint, there are three
fracture modes namely the interfacial fracture from the interface between an adhesive and adherend, the cohesive
fracture in the adhesive and a mixed fracture as a combination of these fractures. There are many reports that the mixed
fracture mode is dominant under an impact load (Yokoyama and Shimizu, 1998; Sato and Ikegami, 1999) and an
evaluation of the deformation behavior of its bulk materials, which becomes part of the fracture behavior in the adhesive
joint, will be crucial. Consequently, there have been some research works on the deformation behavior of bulk adhesive
material (Yu et al., 2001; Goglio et al., 2008), but it is difficult to conclude whether the elasto-viscoplastic deformation
behavior of the polymers was sufficiently considered.
The adhesive after solidification is a polymeric material such as a polycarbonate (PC) and poly
methyl methacrylate (PMMA). For amorphous polymers other than the adhesives, a variety of fundamental studies can
be found, such as on the rapid increase of yield stress at very high strain rate and it has been known to show a nonlinear
behavior against increasing strain rate (Mulliken and Boyce, 2006; Nishida et al., 2009). This is believed to be due to a
secondary relaxation. Generally speaking, the material hardens and becomes brittle owing to this relaxation (Hutchinson,
1973). For the mechanism behind the secondary relaxation, Jones (1985) proposed a theory of structural change caused
by a flip rotation of the phenyl ring in the main molecular chain for a bisphenol A - PC. Ree and Eyring (1955)
4
formulated a relationship between the stress and strain rate for a polymer, using a hyperbolic sine function and proposed
to represent the total stress as the sum of the stress in each relaxation process. By adding the effect of temperature on
yield stress to this theory, Bauwens (1972) explained changes in the yield stress and loss tangent within the range of
temperature and strain rate at which secondary relaxation occurs. Mulliken and Boyce (2006) formulated a
three-dimensional constitutive model for secondary relaxation by embedding the previously proposed model, which can
express the strain softening behavior of polymers, into the five-elements parallel model, and then tried to explain the
nonlinear relationship between the yield stress and strain rate of PC obtained in experiments. However, the formulation
of the plastic shear strain rate was used in different forms of the high-precision formulation by Argon (1973), and it can
be said that such a theoretical basis is poor.
In this study, a bulk specimen made of two types of commercial epoxy resin structural adhesives
is manufactured after solidification. Using this specimen, a compressive test using an INSTRON-type material testing
machine and a split Hopkinson pressure bar method (Kolsky, 1949; Nemat-Nasser et al., 1991;Yokoyama and Shimizu,
1998; Sato and Ikegami, 1999, 2001; Nakai and Yokoyama, 2008) is carried out to investigate the stress - strain curve in
a wide range of strain rate. After that, the nonlinear relationship between the yield stress and strain rate is shown. Since it
is assumed that the yield stress at a high strain rate is dominated by secondary relaxation and the mechanism of this
secondary relaxation is the presence of rotational degrees of freedom, on the basis of Jones' explanation (Jones, 1985),
the plastic shear strain rate for the secondary relaxation is formulated on the basis of an expansion of Argon's formalism
(Argon, 1973) using an idea presented by Li and Gilman (1970). In addition, total shear stress is expressed using the
parallel two-elements model, as was done by Ree and Eyring (1955), with the proposed model and using the
generalized model of Argon's formula (Argon, 1973; Boyce et al., 1988).
Taking into account that the amorphous glassy polymer after solidification of the adhesive, a rate
form of the three-dimensional constitutive equation is formulated on the basis of a four-elements model including an
elastic series element. First, the plastic deformation rate tensor for each relaxation process is formulated by using the
effective stress, which represents the difference between total stress, back stress and the stress at each relaxation process,
and the formulated plastic shear strain rate. The back stress, which represents the resistance against the orientation of the
5
molecular chain network, can be calculated using a previously proposed model (Haward and Thackray, 1968; Boyce et
al., 1988; Arruda and Boyce, 1991; Tomita, 2000). Under the assumption that the plastic deformation rate tensors in
individual relaxation processes are the same, a nonlinear simultaneous equation for the stress tensor in each relaxation
process can be obtained. When a generalized Hooke's law is included, the rate form of a three-dimensional constitutive
equation can be derived. The proposed constitutive equation is implemented into the commercial finite element code
ABAQUS / Explicit and then a finite element simulation is performed. Finally, the validity of the formulated model is
shown by comparison with the experimental result.
2. EXPERIMENTAL PROCEDURES
2.1 Preparation of Specimen
The structural adhesives used in this study are an epoxy resin thermosetting adhesive
(Scotch-Weld 1838 by 3M, hereafter abbreviated to SW1838) and a CTBN-modified epoxy resin adhesive (DP-460 by
3M). Here, CTBN stands for carboxyl-terminated butadiene-acrylonitrile rubber, and the ductile phase is formed by a
microscopic phase separation of CTBN incorporated into the epoxy structural adhesive during solidification to provide
toughness and ductility. Actually, this adhesive is superior in ductility and toughness compared with SW1838 from the
catalog. The appropriate weights of base and accelerator resins are mixed and injected into a clear syringe (PSY - 10E
manufactured by Musashi Engineering, Inc.). After a defoaming procedure of the syringe filled of adhesive using the
defoaming machine (THINKY Corporation, AR-100), the syringe is placed into a vacuum desiccator and cured at
room temperature for 24 hs. The specimen is machined into a solid cylinder 14 mm in diameter and 7 mm in thickness
from the cured syringe. In addition, a postcuring procedure in an electric furnace at 338 K for 2 hs in the case of
SW1838 and 322 K for 3 hs in the case of DP - 460 is applied and then both edges of the specimen are polished with
abrasive paper with a grit number of 2000#.
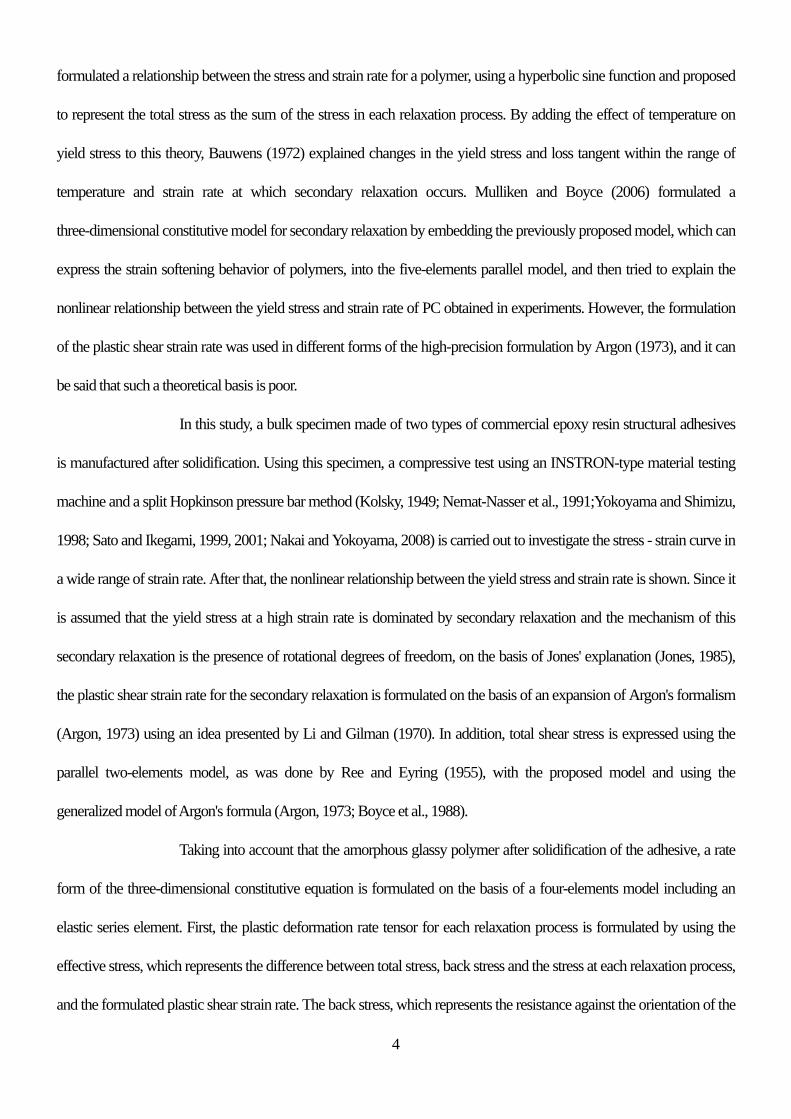
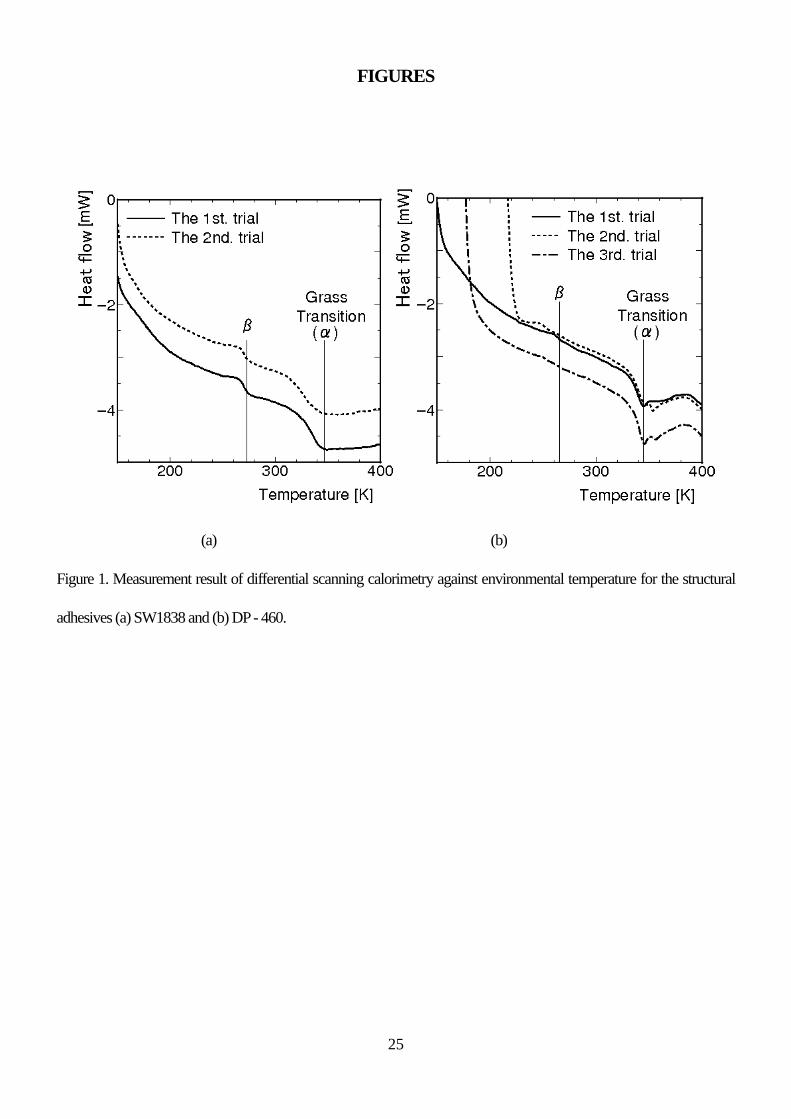
To verify the amorphous state of a specimen obtained as described above, a differential scanning
calorimeter (DSC-220C manufactured by SEIKO Instruments Inc.) is used for thermal analysis of the adhesive. Figure
1 represents the relationships between the heat flow and temperature of (a) SW1838 and (b) DP - 460 obtained by DSC
6
analysis. The different lines correspond to the number of trials. As shown in this figure, it can be seen that the negative
peaks are at about 345 K for both adhesives and the reproducibility with respect to the peaks is good. Since the glass
transition temperatures of SW1838 and DP-460 are 328 and 333 K from the catalog, it can be confirmed that this DSC
analysis is valid. As the result, the specimens are in the amorphous glassy state below this temperature with the negative
peak of heat flow. At a lower temperature from the peak, sudden decreases in heat flow near 280 K for SW1838 and
260 K for DP-460 appear. This phenomenon is related to a secondary relaxation known as β -relaxation. Again, the
prepared specimen, which will be used in the experiment at room temperature, is in the glassy state and undergoes
secondary relaxation.
2.2 Quasi-static and Impact Compressive Experiments
The quasi-static to dynamic compressive tests in the strain rate range from 10-4 to 1 s-1 are carried
out using an INSTRON-type material testing machine (Autograph AG-1 250kN manufactured by Shimadzu
Corporation) at room temperature. To avoid a beer-barreled deformation due to the effect of friction between a surface
of the die and the two ends of the specimen, commercial graphite grease is applied to the surface.
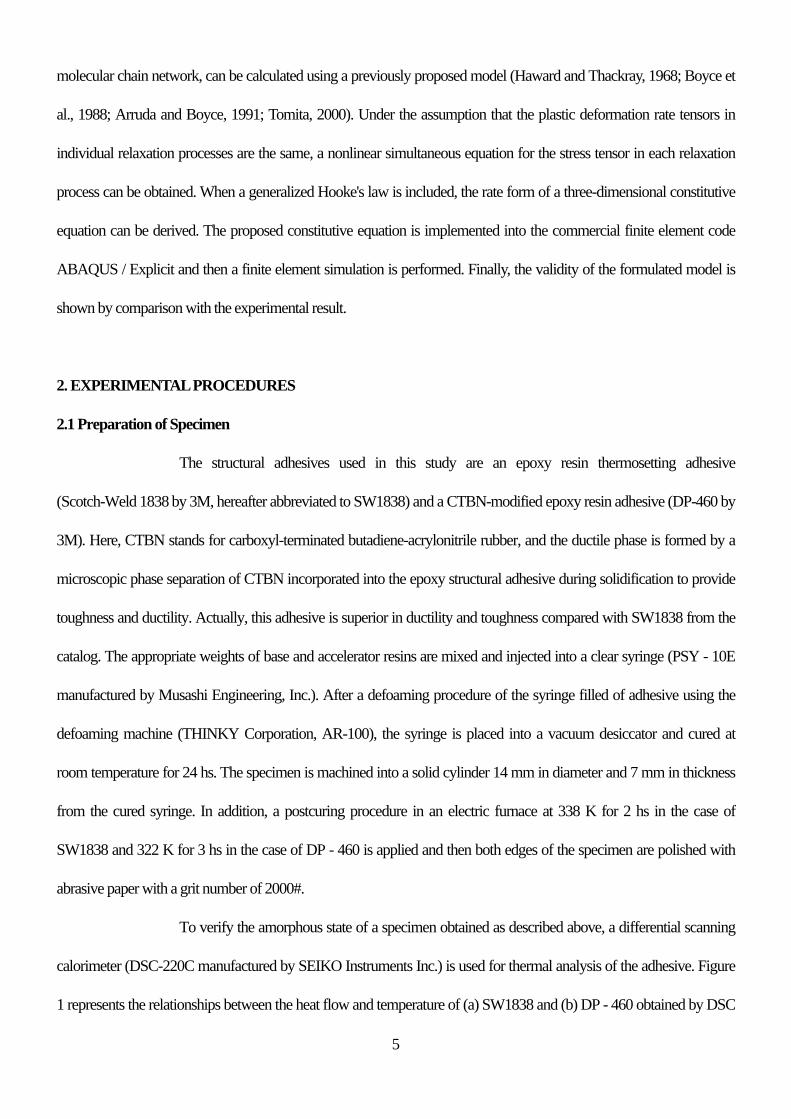
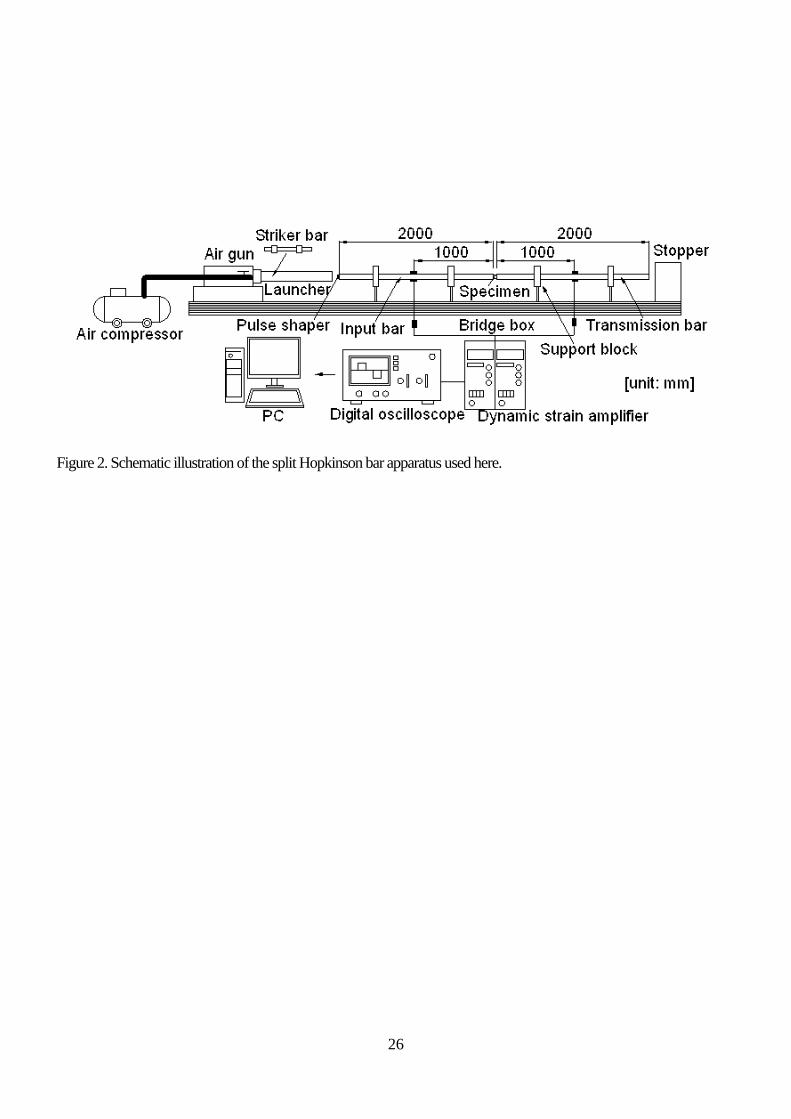
Impact tests in the strain rate range from 102 to 103 s-1 are carried out using a split Hopkinson
pressure bar apparatus at room temperature. Figure 2 shows a schematic illustration of the split Hopkinson pressure bar
apparatus used here. In consideration of a lower mechanical impedance of the specimen, extra super duralumin
A7075-T6511 (JIS) is chosen as the material for the striker, and input and output stress bars. Four semiconductor strain
gauges (Kyowa Electric instruments Co., Ltd., KSP-2-120-E4) are glued at the middle position on the input and output
rods in order to eliminate flexural strain. The specimen for the impact compressive test is placed between input and
output bars through graphite grease and commercial molybdenum disulfide to avoid beer-barreled deformation. The
striker is launched using compressed air and hits the left side of input bar. The specimen undergoes an impact
compressive load indirectly by the incident strain wave )(tiε . The generated incident wave propagates from left to
right in the input bar, some of the incident wave is reflected )(trε at the interface between the specimen and the input
bar, and the rest of the wave is transmitted )(ttε to the output bar. On the basis of the theory of elastic wave
7
propagation in one dimension, assuming dynamic stress equilibrium in the specimen, nominal stress ( )tnσ and
nominal strain ( )tnε of the specimen can be calculated by using a time series of the recorded strain signals, as in the
( ) ( ) ( ) ( ){ }ttta
AEt trin εεεσ ++=2
, ( ) ( ) ( ) ( ){ }tttc
t trin εεεε −−=l
& 0 , ( ) ( ) ''0
dtttt
nn ∫= εε & , (1)
where E , 0c and A are the Young's modulus, the wave velocity and the cross-sectional area of the stress bars,
respectively. a and l are the cross-sectional area and the length of the specimen. True stress ( )tσ can be
calculated from ( )tnσ and ( )tnε by the conventional way under an assumption of a constant volume during
deformation. Of course, the increase of cross section in the specimen cannot be measured during the impact
deformation. The polymeric materials might introduce the volume change during deformation. From this point of view,
it is noted that true stress calculated such a way is not correct. Generally speaking, the duration of the transmitted and
reflected strain waves becomes longer than that of the incident wave as the result of a long relaxation time for the
polymeric material. In the impact testing of polymeric materials, it is well known that the time taken to reach dynamic
stress equilibrium at the ends of the specimen also becomes longer than the time required for metallic materials, because
of the inclusion of relaxation time. In this study, the incident wave is controlled by attaching a thin disk (5 mm in
diameter and 0.5 mm in thickness) made of pure copper C1100 (JIS) as a buffer to the left side of the input bar; i.e. this
is the pulse shaping technique (Nemat-Nasser et al., 1991; Nakai and Yokoyama, 2008), and is necessary to lengthen the
rise time of the incident wave.
3. EXPERIMENTAL RESULTS
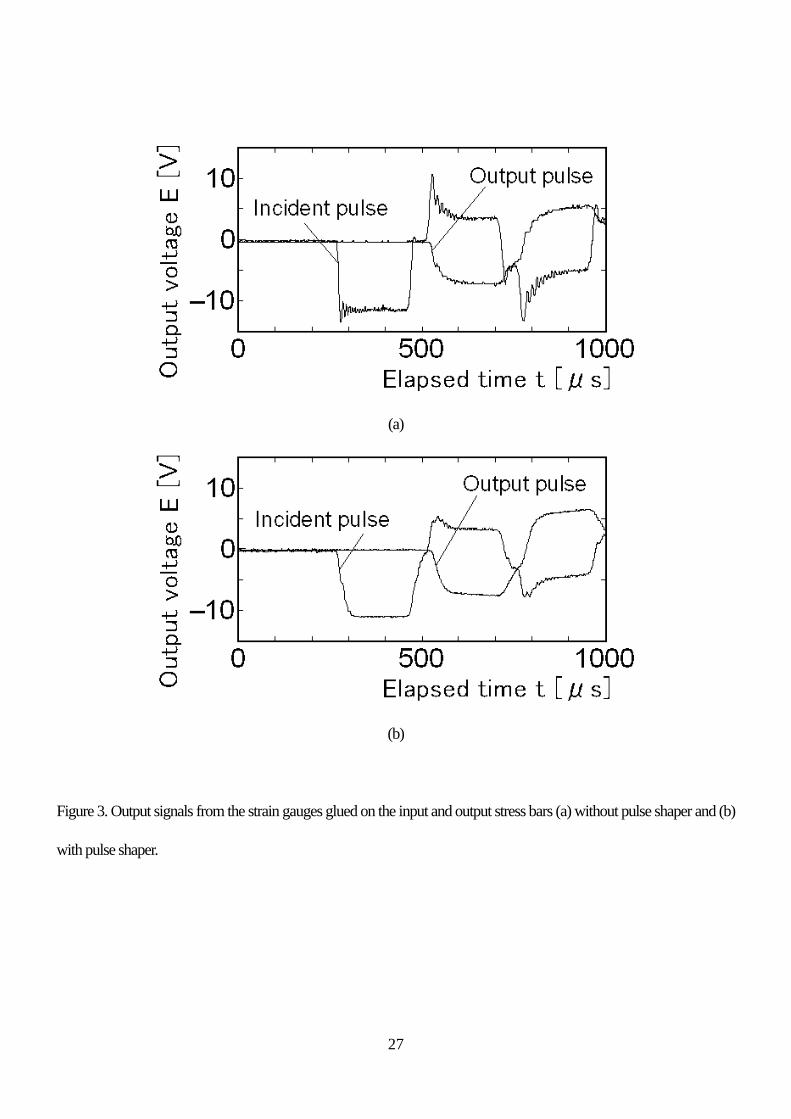
To confirm the effectiveness of the pulse shaping technique, Figure 3 shows the output signal
from the strain gauges glued on to the input and output stress bars (a) without a pulse shaper and (b) with a pulse shaper.
In this figure, the rise time of the incident wave becomes longer, and extra oscillation can be removed by introducing the
pulse shaper. The reflected wave can be smoothed and the initial peak of the reflected wave can be reduced. As a result,
the wave becomes almost constant. This means that a constant nominal strain rate can be realized during the impact
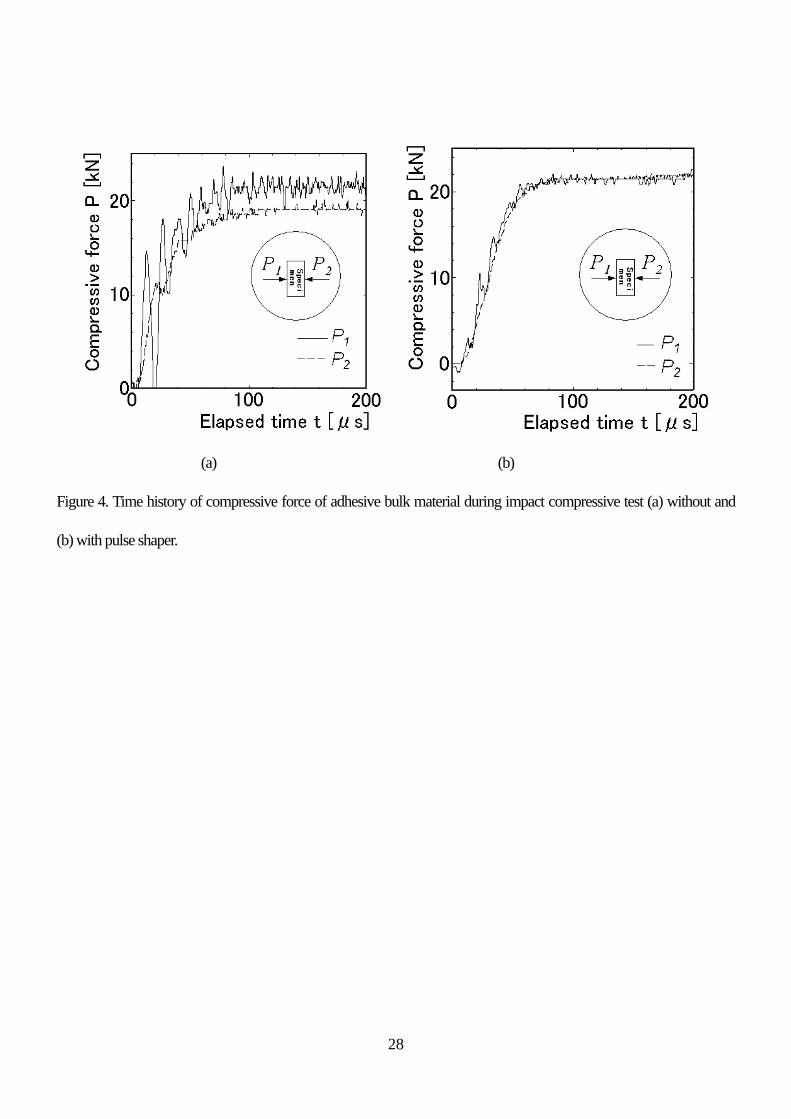
compression test. The transmitted wave remains almost the same after introducing the pulse shaper. Figure 4 shows a
8
comparison of the time series of the loads acting on the two sides of the specimen during impact compression test (a)
with the pulse shaper and (b) without the pulse shaper. According to the propagation theory of the one-dimensional
elastic wave, the loads can be calculated using the following equation with the measured strain waves.
( ) ( ) ( ){ }ttAEtP ri εε +=1 , ( ) ( )tAEtP tε=2 (2)
As shown in Fig. 4(a), the difference between the loads at the two ends of the specimen can be observed, and the
equilibrium state cannot be reached if there is no pulse shaper. However, once the pulse shaper is introduced, the
equilibrium state is maintained during the deformation because the loads are similar, as shown in Fig. 4 (b). As a result,
the validity and necessity of the pulse shaping technique can be confirmed.
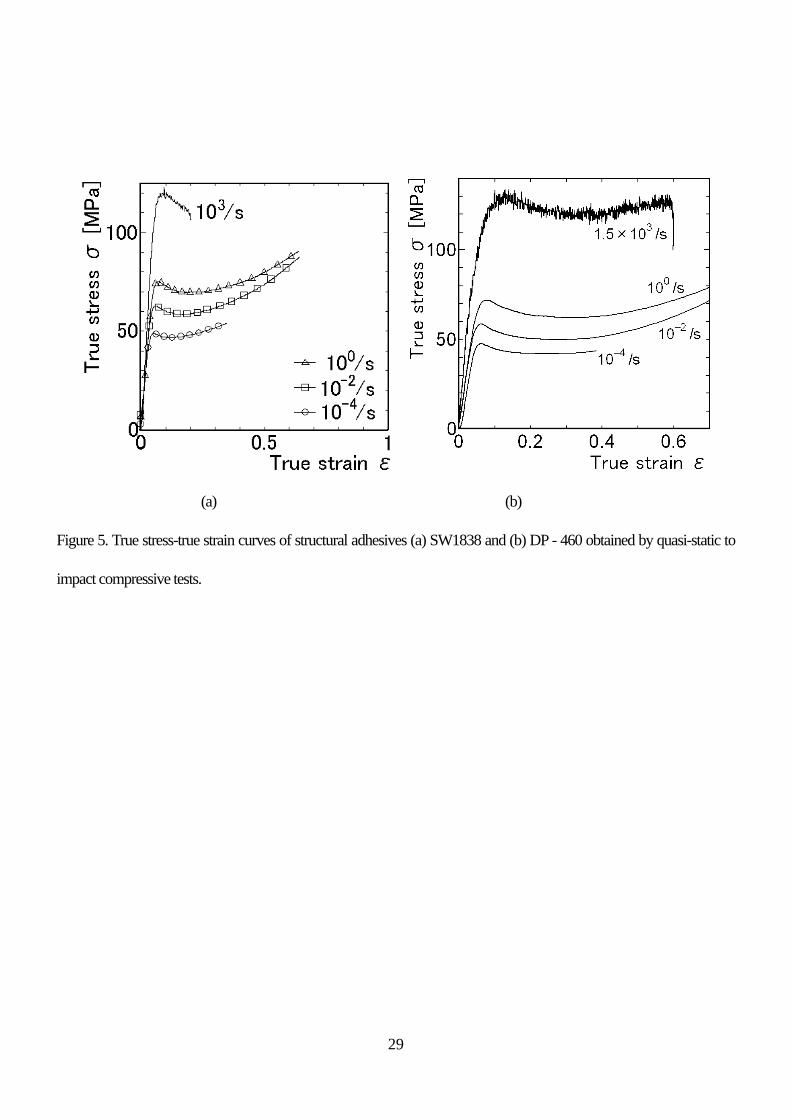
Figure 5 shows true stress - true strain curve obtained from the quasi-static impact and
compression tests for (a) SW1838 and (b) DP-460. The two kinds of epoxy structural adhesives used in this study show
a linear elastic region at first, then a maximum stress similar to the yield point, and finally a strain softening behavior.
Ultimately, the strain hardening behavior can be observed. When the maximum stress (hereafter called the yield stress)
is focused on, the increase in it is constant with increasing strain rate in the region from quasi-static to dynamic
deformation. However, the yield stress increases rapidly against the increase of the strain rate under impact deformation.
In our experiment for quasi-static case, no clear instability like neck propagation in tension can be observed from the
surface of specimen. However, the instability might be occurred because the strain-softening region was captured in the
stress-strain curve.
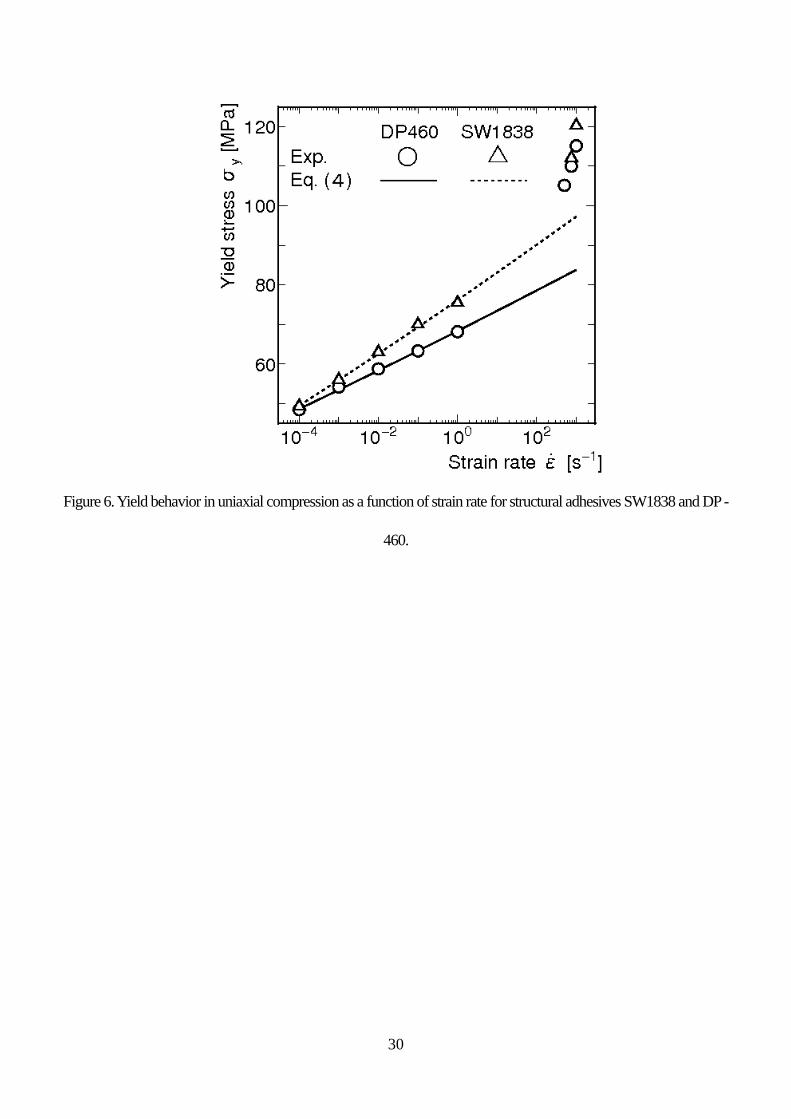
To visualize the above-described characteristics clearly, Fig. 6 shows the semi-logarithmic
relationship between the yield stress and strain rate obtained from the experiments and analysis described later. In the
figure, open circles represent the experimental results. In the experimental results, yield stress increases linearly with
increasing strain rate from the quasi-static to dynamic range, as described above. However, the slope of the linear region
at a low strain rate is not inherited at a high strain rate; the curve is expressed by different relatively steep lines. Overall,
nonlinearity of the yield stress - strain rate curve can be observed. As a result, stress - strain relationship shown in Fig. 5
and the yield stress - strain rate relationship shown in Fig. 6 can be also seen in other amorphous glassy polymers such
as the PC and PMMA. The results suggest that the constitutive model of other glassy polymers can be applied to
9
describe the deformation behavior of the bulk epoxy adhesive material after solidification.
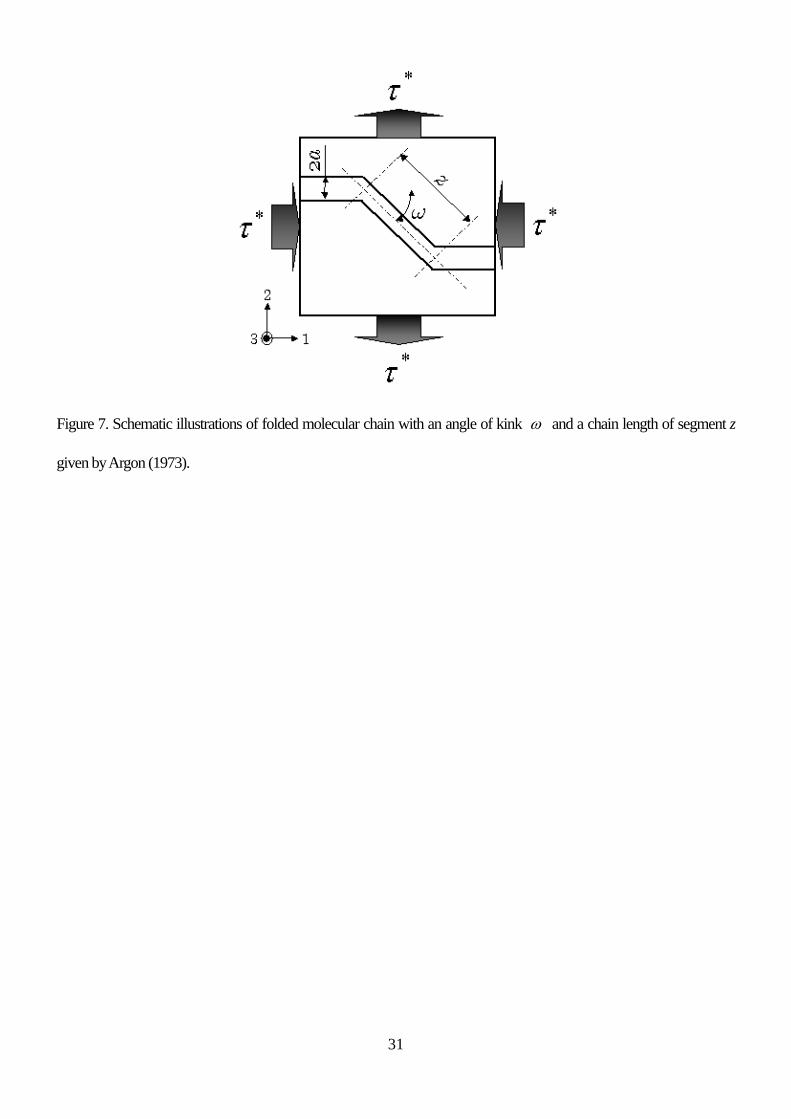
Meanwhile, Argon (1973) formulated the activated free energy of the intermolecular resistance
caused by a rotation in segments of the molecular chain, using the analytical results obtained by Li and Gilman (1970),
when a shear stress *τ was applied to a molecular chain with a double kink, as shown in Fig. 7. As a result, the
relationship between the plastic shear strain rate pγ& and *τ was determined from the change in the activated free
energy considering the effect of pressure, using the following equation,
( ) ( ) ( )
⎥⎥⎥
⎦
⎤
⎢⎢⎢
⎣
⎡⎟⎠⎞
⎜⎝⎛−
−⎪⎭
⎪⎬⎫
⎪⎩
⎪⎨⎧
⎟⎟⎠
⎞⎜⎜⎝
⎛−−
−−=
Gp
TkGa
GTkaG
B
c
B
p236
5*
6532
015.0
15.81116
3expωωτν
νωπγγ && . (3)
Here, )(TG and )(Tν are the shear modulus and Poisson's ratio as a function of the absolute temperature T , ω
is the rotational angle in the activated configurations from the initial state, a is the mean radius of the molecular chain,
p is the hydrostatic pressure, Bk is the Boltzmann constant, and 0γ& and cω are constants. Boyce et al. (1988)
expanded the above formula by arranging these parameters and vanishing the term containing p , as in the following
equation,
⎥⎥⎥
⎦
⎤
⎢⎢⎢
⎣
⎡
⎪⎭
⎪⎬
⎫
⎪⎩
⎪⎨
⎧
⎟⎟⎠
⎞⎜⎜⎝
⎛−−=
65
0
*0
0 1expsT
Asp τγγ && , ( )ν−≡1077.0
0Gs and
BkaA
1639 33πω
≡ . (4)
The analytical results obtained for SW1838 and DP-460 using Eq. (4) are shown as solid and dashed lines on Fig. 6. In
this figure, experimental and analytical results show good correspondence at low strain rates. However, it is extremely
difficult to represent this phenomenon by using Eq. (4) since Eq. (4) does not fit at all the results at high strain rate.
4. CONSITUTIVE FORMULATION
4.1 Plastic Shear Strain Rate for Secondary Relaxation
Here, the plastic shear strain rate is formulated by considering that the deformation of the
polymeric material at a high strain rate will be dominated by a secondary relaxation called the β -relaxation
(Hutchinson, 1973) and the adhesives used in this research work show the β -relaxation as mentioned above. First, the
mechanism for secondary relaxation proposed by Jones (1985), i.e., the relaxation caused by the existence of rotational
10
degrees of freedom in the main molecular chain, is supported and the formulation of the plastic shear strain rate in the
case of only secondary relaxation is given. Now, let us consider that a molecular chain with average molecular radius
a , constant rotation angle ω and chain length z of a segment in the equilibrium configuration, as shown on Fig. 7,
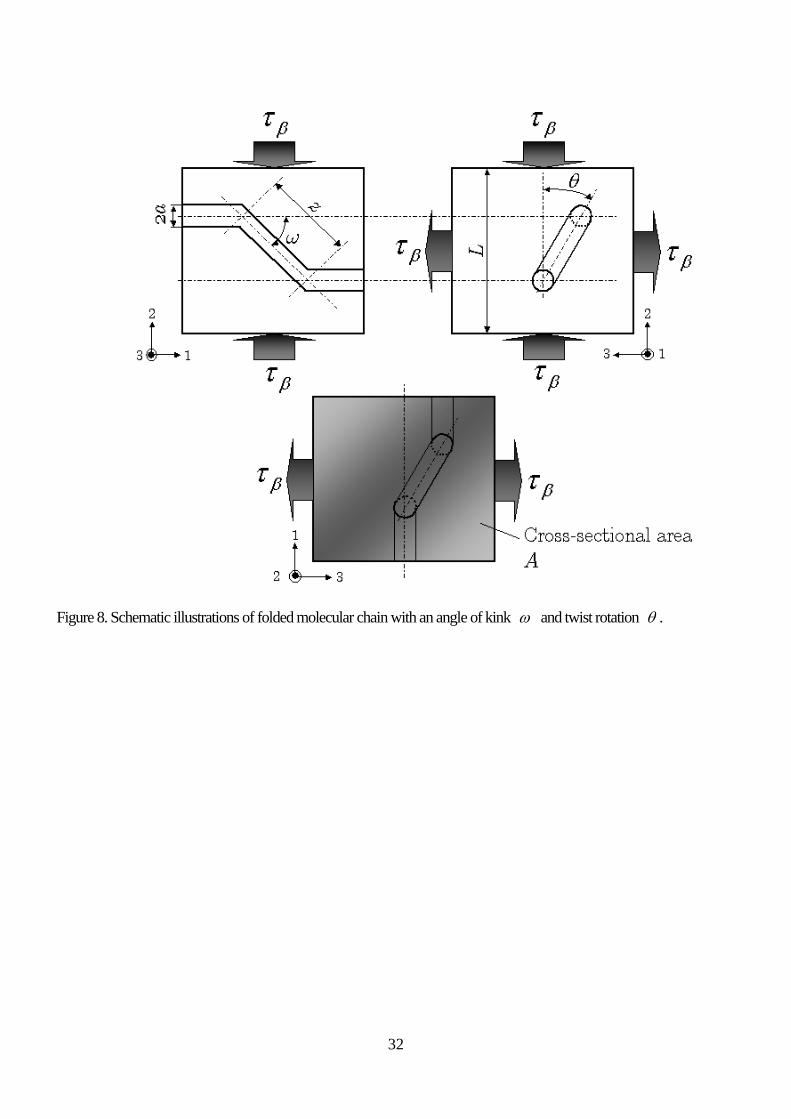
undergoes the torsional degrees of freedom θ , as shown in Fig. 8, as in Argon's interpretation (Argon, 1973). Of course,
Argon (1973) represents the rotation of the main molecular chain by ω . However, it can be expressed by θ since
structural changes during the β -relaxation due to a flip motion of a phenyl ring shown by Jones (1985) is likely to be
caused by twisting, not the bending degree of freedom ω .
Li and Gilman (1970) derived the following free energy of the molecular chain, which undergoes
torsion, including the interaction between the chains
( )52323
83
163
⎟⎠⎞
⎜⎝⎛−=Δ=Δ
zaGaGaFF θπθπθ . (5)
A shear stress βτ is applied to a rectangular region of an aggregate of chains, similar to Argon (1973), as shown in Fig.
8. In this case, normal strain 22ε in the vertical direction (direction 2 in the figure) can be expressed as
( )θωε cos1sin222 −−= z
LAal , (6)
where L and A are the length and the cross-sectional area of the region, respectively, and l is the average length
of the chain along direction 1 in the figure. Assuming plane strain, normal strain in the horizontal direction (direction 3
in Fig. 8) 33ε for a constant volume during plastic deformation can be expressed as
( )θωεε cos1sin22233 −=−= z
LAal . (7)
The work WΔ by applied shear stress βτ can be written as
( )[ ] βτθω cos1sin4 −=Δ zaW l . (8)
From Eqs. (1) and (8), free energy GΔ can be expressed as
( )θτωθπθπβ cos1sin4
83
163 2
52323
−⎟⎠⎞
⎜⎝⎛−⎟
⎠⎞
⎜⎝⎛−=Δ−Δ=Δ
aza
zaGaGaWFG l . (9)
11
In addition, since a change in θ from -π /2 to π /2 should be considered, θcos in the above equation can be
expressed approximately as
42
241
21cos1 θθθ −≅− . (10)
Thus, GΔ can be rewritten under the above approximation as
42
22533
6sinsin2
83
163 θτωθτωππ
ββ ⎟⎠⎞
⎜⎝⎛+
⎥⎥⎦
⎤
⎢⎢⎣
⎡⎟⎠⎞
⎜⎝⎛−⎟
⎠⎞
⎜⎝⎛−=Δ
zaa
aza
zaGaGaG l
l . (11)
Now, the degree of freedom to be considered here is only θ , and hence the extremal problem of GΔ on θ is
considered. Therefore, eqθ in the activated configuration is obtained as
( ) ( ) ⎥⎦
⎤⎢⎣
⎡+−±= 5/
21sin/8
96,0azaz
aGeq ωτ
πθβ l
. (12)
Since eqθ = 0 will be a saddle point, free energy at the stable configuration *βGΔ can be formulated as
( )( )[ ]
⎪⎭
⎪⎬⎫
⎪⎩
⎪⎨⎧
⎟⎠⎞
⎜⎝⎛−
−−⎟
⎠⎞
⎜⎝⎛
⎥⎥⎦
⎤
⎢⎢⎣
⎡−⎟
⎠⎞
⎜⎝⎛=Δ β
ββ ωτ
ωτππ sin256
sin2/9248
/1283 6
22522265
11
2*
azazGa
az
azaG
azaG ll
l. (13)
The plastic shear strain rate in the secondary relaxation process can be derived from the same procedure as used by
Argon (1973) and Boyce et al. (1988) as
( )[ ] ( ){ }( ){ } ⎪⎭
⎪⎬⎫
⎪⎩
⎪⎨⎧
⎥⎥⎦
⎤
⎢⎢⎣
⎡⎟⎟⎠
⎞⎜⎜⎝
⎛
−−⎟
⎟⎠
⎞⎜⎜⎝
⎛⎟⎠⎞
⎜⎝⎛−
−⎟⎠⎞
⎜⎝⎛−
−=Gaza
Gzaaza
za
TkazGa
B
pp β
βββ
τ
πω
τωππ
γγ2/3
sin16sin16
2/318
2/9exp 5
65553
0l
l&& . (14)
By an arrangement of parameters in the above equation similar to that adopted by Boyce et al. (1988), the following
simplified equation can be obtained:
⎪⎭
⎪⎬⎫
⎪⎩
⎪⎨⎧
⎟⎟⎠
⎞⎜⎜⎝
⎛−−−=
β
β
β
βββββ τ
τγγ 1
0
00 1exp
ssT
sApp && , (15)
( ){ }ω
πβ sin16
2/3 5
0l
−≡
azaGs , 6
01 ⎟⎠⎞
⎜⎝⎛≡
zass ββ and
52 sin6⎟⎠⎞
⎜⎝⎛≡
za
kaA
B
ωπβ
l .
It is noted that the expressions given by Mulliken and Boyce (2006) are different from Eqs. (4) and (15) if they are
12
employed to express the primary and the secondary relaxation process, respectively. In addition, if ατ is assumed to be
the shear stress driving the plastic shear strain rate pαγ& during the primary relaxation, total shear stress τ can be
expressed, following Ree and Eyring (1955), as
βα τττ += . (16)
In this case, pαγ& = p
βγ& = pγ& is assumed because the above equation is based on a parallel two-elements model.
Equations (4) and (15) are solved for ατ and βτ , and then τ can be calculated as the sum of the shear stresses, as
described by Eq. (16), as
⎪⎭
⎪⎬
⎫
⎪⎩
⎪⎨
⎧−
⎥⎥⎦
⎤
⎢⎢⎣
⎡⎟⎟⎠
⎞⎜⎜⎝
⎛++⎟
⎟⎠
⎞⎜⎜⎝
⎛++
⎭⎬⎫
⎩⎨⎧
⎟⎟⎠
⎞⎜⎜⎝
⎛−= 10
2
000
000
5/6
000 4lnln
21ln1 ββ
ββββ
ββββ
αααα γ
γγγ
γγτ ss
sATs
sATs
sATs p
p
p
p
p
p
&
&
&
&
&
&. (17)
In this case, seven parameters, 0αs , 0βs , 1βs , αA , βA , p0αγ& and p
0βγ& , must be identified from the experimental
results. However, the total number of parameters is reduced to six since 0αs can be expressed by Eq. (4).
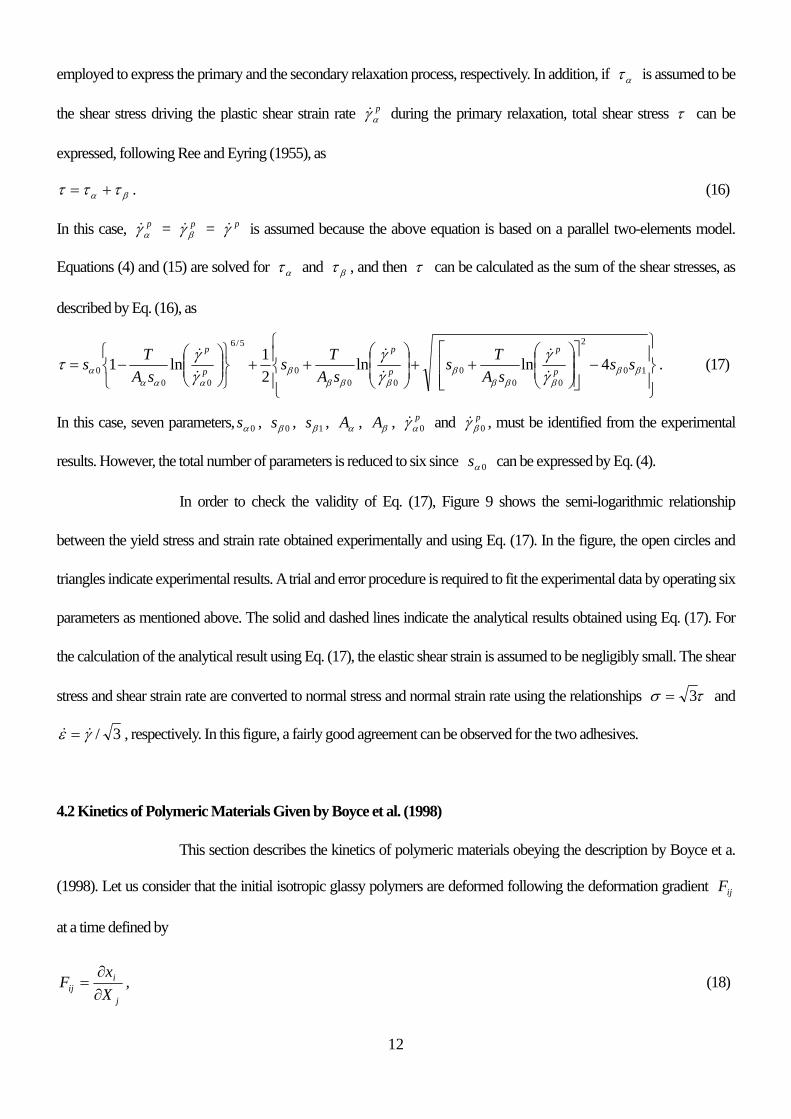
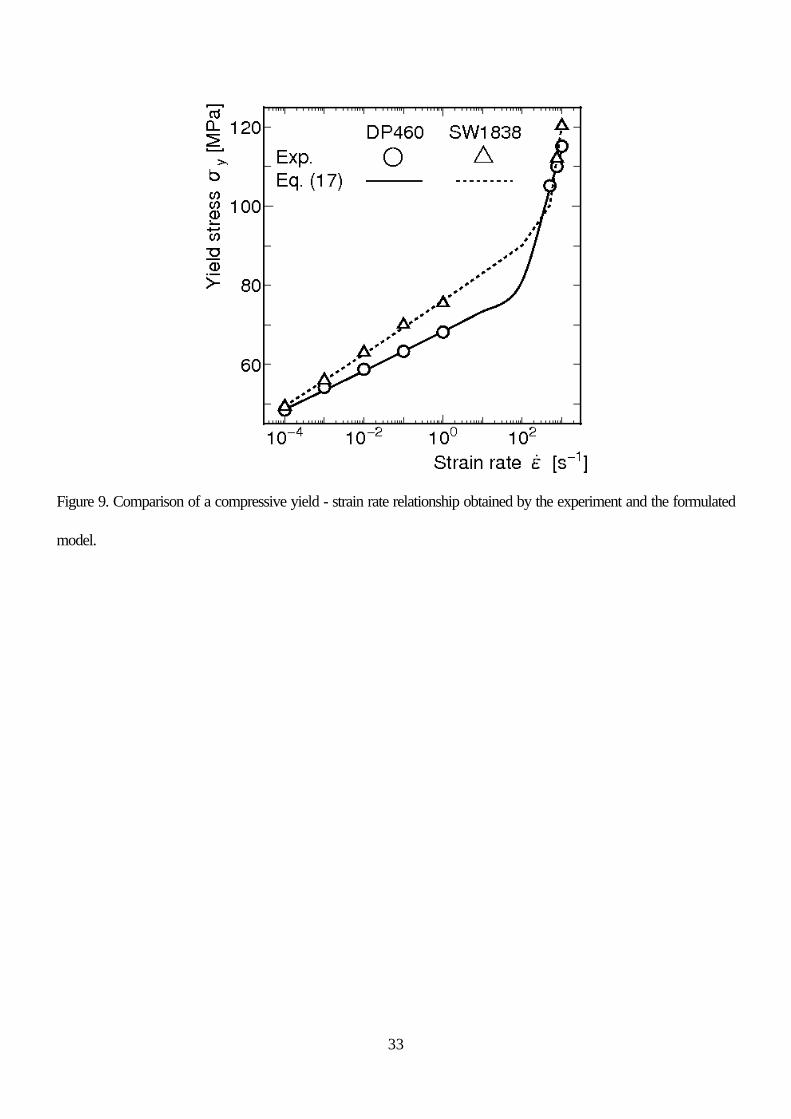
In order to check the validity of Eq. (17), Figure 9 shows the semi-logarithmic relationship
between the yield stress and strain rate obtained experimentally and using Eq. (17). In the figure, the open circles and
triangles indicate experimental results. A trial and error procedure is required to fit the experimental data by operating six
parameters as mentioned above. The solid and dashed lines indicate the analytical results obtained using Eq. (17). For
the calculation of the analytical result using Eq. (17), the elastic shear strain is assumed to be negligibly small. The shear
stress and shear strain rate are converted to normal stress and normal strain rate using the relationships τσ 3= and
3/γε && = , respectively. In this figure, a fairly good agreement can be observed for the two adhesives.
4.2 Kinetics of Polymeric Materials Given by Boyce et al. (1998)
This section describes the kinetics of polymeric materials obeying the description by Boyce et a.
(1998). Let us consider that the initial isotropic glassy polymers are deformed following the deformation gradient ijF
at a time defined by
j
iij X
xF
∂∂
= , (18)
13
where iX is the reference configuration, and ix represents the current configuration. At the reference configuration,
the glassy polymeric material is in an isotropic state in which molecular chains are randomly oriented. ijF can be
multiplicatively decomposed into the elastic component eijF and plastic component p
ijF , as shown by the equation
below:
pkj
eikij FFF = . (19)
pijF represents the stress-free configuration under the complete unloading condition and a permanent degree of
molecular orientation in the material is indicated physically. ijF is expressed in the form of the following equation
using elastic stretch eijV , rotation ijR and plastic stretch p
ijU :
pljkl
eikij URVF = . (20)
ijR is assumed to be divided into an elastic part and a plastic part, similarly to ijF , as
pkj
eikij RRR = . (21)
The following equation can be obtained by polar decomposition and using Eq. (21).
ekj
eik
ekj
eik
eij URRVF == and p
kjp
ikpkj
pik
pij URRVF == . (22)
In reality, we cannot specify whether rotation is elastic or plastic. However, the next equations are assumed here.
ijeijR δ= and p
ijij RR = . (23)
As a result, we can derive
pkjikkj
pik
pij URRVF == . (24)
The above equation expresses the stress-free configuration obtained after unloading without rotation, and eji
eij FF =
can be satisfied. Next, the velocity gradient ijL can be obtained as
1111 −−−− +==+=∂∂
= emj
plm
pkl
eik
ekj
eikkjikijij
j
iij FFFFFFFFd
xv
L &&&ω , (25)
where iv is the velocity, ijd is the deformation rate tensor which is a symmetric part of ijL and ijω is the spin
tensor which is an antisymmetric part of ijL . In addition, the following equations are obtained by assuming that ijd
and ijω are the sum of the elastic and plastic components.
pij
eijij ddd += , p
ijeijij ωωω += , (26)
14
1−=+ e
kje
ikeij
eij FFd &ω and 11 −−
=+ emj
plm
pkl
eik
pij
pij FFFFd &ω . (27)
The velocity gradient in the stress-free configuration pijL is given by
pij
pij
pkj
pik
pij dFFL ω~~1
+==−& . (28)
Strictly speaking, the plastic deformation rate tensors in the loading and unloading configurations can be expressed as
( )11
21 −− += e
lipkl
ejk
elj
pkl
eik
pij FLFFLFd and ( )p
jipij
pij LLd +=
21~ . (29)
They are different only in eijF ; however, the magnitude of each component in e
ijF is equivalent to the elastic strain, and
here, the following equation can be satisfied since eijF is negligibly small
pij
pij
pij ddd ˆ~
≡≡ . (30)
Also, by ignoring the elastic deformation gradient, we can approximate pijF and p
ijω as
ijp
ij ωω = and ijp
ij FF = . (31)
Plastic deformation rate tensor pijd can be expressed generally in each case of a loading or unloading configuration as
ijpp
ij Nd γ&=ˆ , (32)
where pγ& is the equivalent plastic shear strain rate and ijN is the tensor indicating the direction. Generally speaking,
since there are an associative and a non-associative cases for ijN . Our choice is descried later.
4.2 Rate Form of Three-dimensional Constitutive Equation
The resistance to a plastic flow of glassy polymeric materials is assumed to be divided into two
different physical resistances, the intermolecular resistance related to the rotation of the chain segments and the
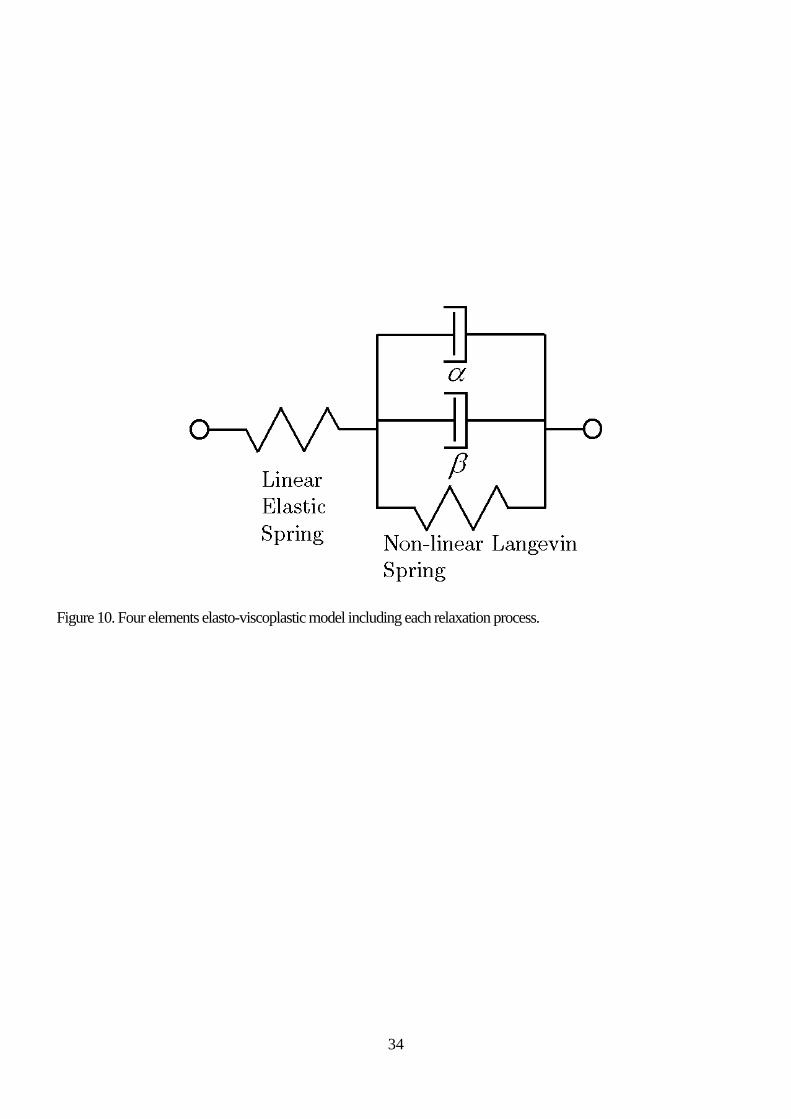
resistance of the molecular orientation (Boyce et al, 1988; Tomita, 2000). Figure 10 shows the four-elements model
with three parallel elements and one elastic series element used in this study. Here, the intermolecular resistance at each
relaxation process represented using the subscript α or β is expressed by a nonlinear dashpot. The eight-chain
model proposed by Arruda and Boyce (1991) is used for the resistance of the molecular orientation. In the previous
section, the intermolecular resistance in the primary and secondary relaxations, as shown in Figure 8, can be considered
to be caused by the rotational deformation of the double-kinked molecular chain, including bending and twisting. Then,
15
the relationship between the shear stress and the plastic shear strain rate is formulated. To describe the two effects of
strain softening and pressure in the model proposed in the previous section, the parameters 0αs and 0βs in Eqs. (4)
and (15) are replaced, as was done by Boyce et al. (1988), as
⎥⎥⎥
⎦
⎤
⎢⎢⎢
⎣
⎡
⎪⎭
⎪⎬⎫
⎪⎩
⎪⎨⎧
⎟⎟⎠
⎞⎜⎜⎝
⎛+
−Δ
−=65
*0
0 1exppsT
Gp
αα
αααα α
τγγ && ,
⎪⎭
⎪⎬⎫
⎪⎩
⎪⎨⎧
⎟⎟⎠
⎞⎜⎜⎝
⎛ +−
+−
Δ−=
β
ββ
ββ
ββββ τ
αατ
γγps
psTGpp 1
0
*0
0
ˆ1exp&& , (33)
where αα and βα are the pressure coefficients in each relaxation process, and *0αGΔ = 0αs αA and *
0βGΔ =
0βs βA are the constants resulting from the rearrangement of the parameters. αs , βs and βs are new state variables
that represent the current structure with their initial values being 0αs , 0βs and 1βs . Similar to the work of Boyce et
al. (1988), their evolution equations are assumed to be written as
( )p
pss Ts
shs α
αα
ααα γ
γ&
&&
⎪⎭
⎪⎬⎫
⎪⎩
⎪⎨⎧−=
,1
,
, ( )p
pss Ts
shs β
ββ
βββ γ
γ&
&&
⎪⎭
⎪⎬⎫
⎪⎩
⎪⎨⎧−=
,1
,
and ( )p
pss Ts
shs β
ββ
βββ γ
γ&
&&
⎪⎭
⎪⎬⎫
⎪⎩
⎪⎨⎧−=
,ˆˆ
1ˆˆ,
. (34)
αh , βh and βh are the positive constants. α,sss , β,sss and β,ˆsss are the values of αs , βs and βs in the
equilibrium state and have values less than 0αs , 0βs and 1βs , respectively. Since it is sufficient that the strain
softening behavior and pressure effect in the secondary relaxation can be expressed using only βs , βs is dealt with as
a constant here.
With continuing plastic deformation, the molecular chain becomes oriented in the direction of
plastic stretch and a back stress is generated in the network structure, which consists of molecular chains (Haward and
Thackray, 1968). This back stress becomes a kind of resistance to further plastic deformation. Using the eight-springs
molecular chain model (Arruda and Boyce, 1991), in which molecular chains are fixed to each other at both ends, the
principal component of back stress (Boyce et al., 1988; Arruda and Boyce, 1991; Tomita, 2000) is expressed as
⎟⎟⎠
⎞⎜⎜⎝
⎛−= −
NL
VNCb c
c
cp
iRi
λλ
λ 122
31 . (35)
Here, RC = TnkB , n is the number of chains per unit volume, N is a number of rigid chain links between
entanglements and its root is a limit stretch of the chain, and cλ is the principal plastic stretch that can be expressed by
16
( )23
22
21
2
31 ppp
c VVV ++=λ . (36)
( ) cc NL βλ =− /1 is the inverse of the Langevin function defined as
( )N
L c
ccc
λβ
ββ =−=1coth . (37)
Since back stress ijb is defined in the unloading configuration and develops with plastic stretch, it can be calculated as
being coaxial with plastic left stretch pijV obtained by polar decomposition of the plastic deformation gradient:
( )ijcijc
c
Rij B
NLNCb δλ
λλ
21
31
−⎟⎟⎠
⎞⎜⎜⎝
⎛= − , (38)
where jkikij FFB = and iic B312 =λ . In the above equation, the following is used under an assumption that the elastic
deformation is negligibly small.
2/1ij
pij BV ≈ (39)
The back stress tensor at the current configuration Bijσ can be written as
eljkl
eike
ij
Bij FbF
Fdet1
=σ . (40)
Following the work of Boyce et al. (1988), the plastic deformation rate tensor at each relaxation
process can be expressed from Eq. (32) with the associated flow rule, by using the back stress tensor and the plastic
shear strain rate, as
α
α
αα
τ
σγ
2
'd ijpp
ij &= , β
β
ββ
τ
σγ
2
'd ijpp
ij &= , (41)
where ')( means the deviatoric tensor, and ασ ij and βσ ij are the driving stress for each relaxation process, which
can be calculated as
Bijijijij σσσσ βα ++= , (42)
where ijσ is the total Cauchy stress. ατ and βτ can be calculated using 'ijασ and 'ij
βσ as
17
'' ijijαα
α σστ21
= , '' ijijββ
β σστ21
= . (43)
On the basis of Fig. 10, the total deformation rate tensor can be decomposed into three parts:
hij
pij
eijij dddd ++= , (44)
where hijd is the thermal part of the deformation rate tensor defined as
TAd ijhij
&= , ijhij vA δΔ= , (45)
where hvΔ is the thermal expansion coefficient. From Hooke's law, the following constitutive equation for elastic
deformation can be satisfied.
ekl
eijklij dCS =
o
, ( ) ( ) ⎭⎬⎫
⎩⎨⎧
−++= klijjkiljlik
eijkl GC δδ
ννδδδδ
21212 . (46)
Here, ijSo
is an objective rate of the Kirchhoff stress tensor. In this study, the Green-Nagdhi rate defined as follows is
chosen.
kjikkjikijij SSSS Ω+Ω−≡ &o
(47)
Here, jkikij RR&=Ω . Assuming αpijd = βp
ijd = pijd , the following rate form of the constitutive equation can be
obtained:
TBPdDS eijij
pkl
eijklij &&
o
−−= ααγ , (48)
where αijP can be calculated as
'G'CP klkleijklij
α
α
α
α
α στ
στ
221
== . (49)
In the constitutive equation, 'ijασ and 'ij
βσ become undetermined variables; however, the unknown variables can be
calculated by the solution of the following equation derived from Eqs. (41) and (42), and αpijd = βp
ijd = pijd .
''' Bijijijp
p
σσσττ
γγ α
α
β
β
α −=⎟⎟⎠
⎞⎜⎜⎝
⎛+&
&1 . (50)
Actually, Eq. (50) is not a single equation and contains six equations by considering symmetry of the deviatoric stress
tensor. Additionally, Eq. (50) with Eqs. (33) and (43) becomes a nonlinear simultaneous equation of 'ijασ . 'ij
βσ can
18
be calculated from Eq. (42). This nonlinear equation can be solved numerically by the Newton-Raphson method.
5. COMPUTATIONAL CONDITION, RESULTS AND DISCUSSION
The commercial finite element code ABAQUS / Explicit Ver. 6.8 is employed for numerical
simulation. After the above constitutive equation is implemented into a user subroutine, VUMAT, which is one of the
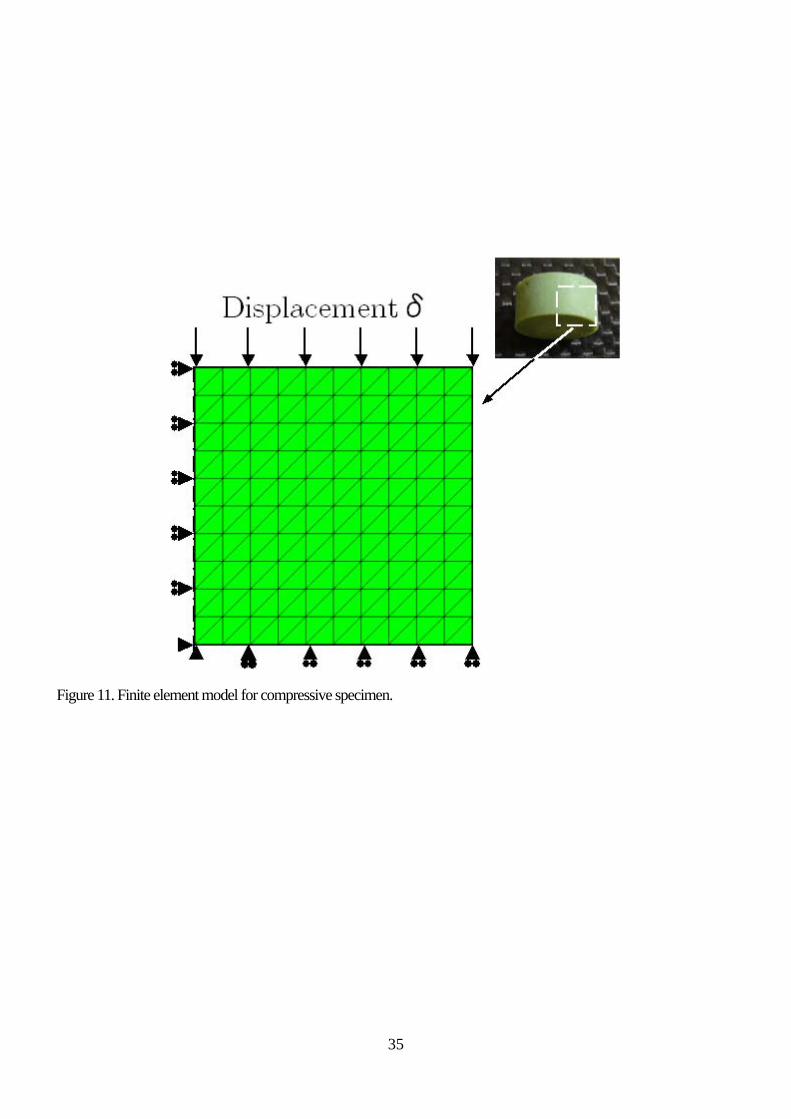
customized features of ABAQUS / Explicit, the numerical simulation is performed. Figure 11 shows the computational
model that has the same size and shape as the cylindrical specimen used in the experiment. The computational region is
discretized using a six-node axisymmetric triangular element with a reduced integration. Under the computational
conditions, the vertical displacement of nodes on the bottom is fixed and the shear-free condition is applied. The
environmental temperature is set to 296 K. The displacement rate on the upper end is the same as that in the experiment.
The crosshead speed of the testing machine in the cases of low strain rate and the time series of strain signals measured
from the stress bars of the split Hopkinson pressure bar apparatus for the case of impact testing are given. The
displacement rate for the impact test can be calculated using (Yokoyama and Shimizu, 1998)
( ) ( ) ( ) ( ){ }tttct tri εεεδ −−= 0& . (52)
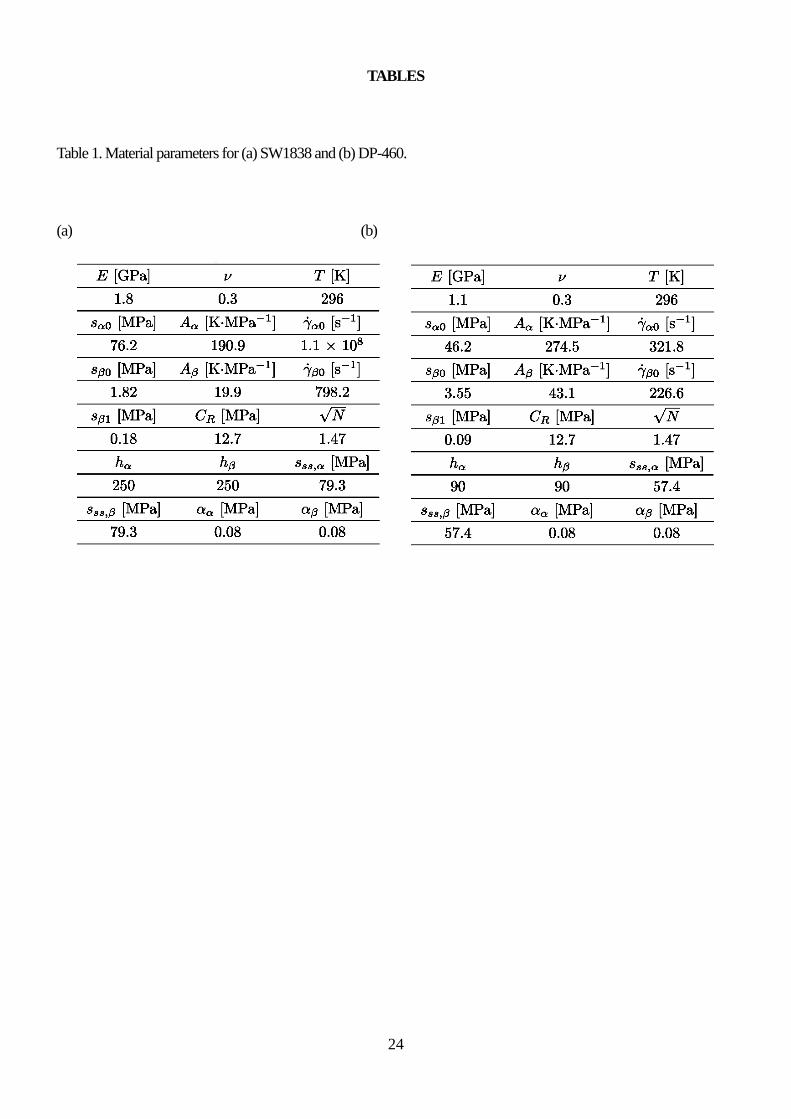
Table 1 shows the identified material parameters for (a) SW1838 and (b) DP-460. Paramaters 0αs , αA , p0αγ& ,
0βs , βA , p0βγ& and 1βs are identified using Eq. (17) and Fig. 9. Other material parameters are determined by
referring to other research works (Boyce et al., 1988; Arruda and Boyce, 1991; Tomita, 2000; Mulliken and Boyce,
2006). From our experimental observation as described previously, the deformation behavior is dealt with as a uniform.
This means that no imperfection is introduced and the mesh independency is confirmed.
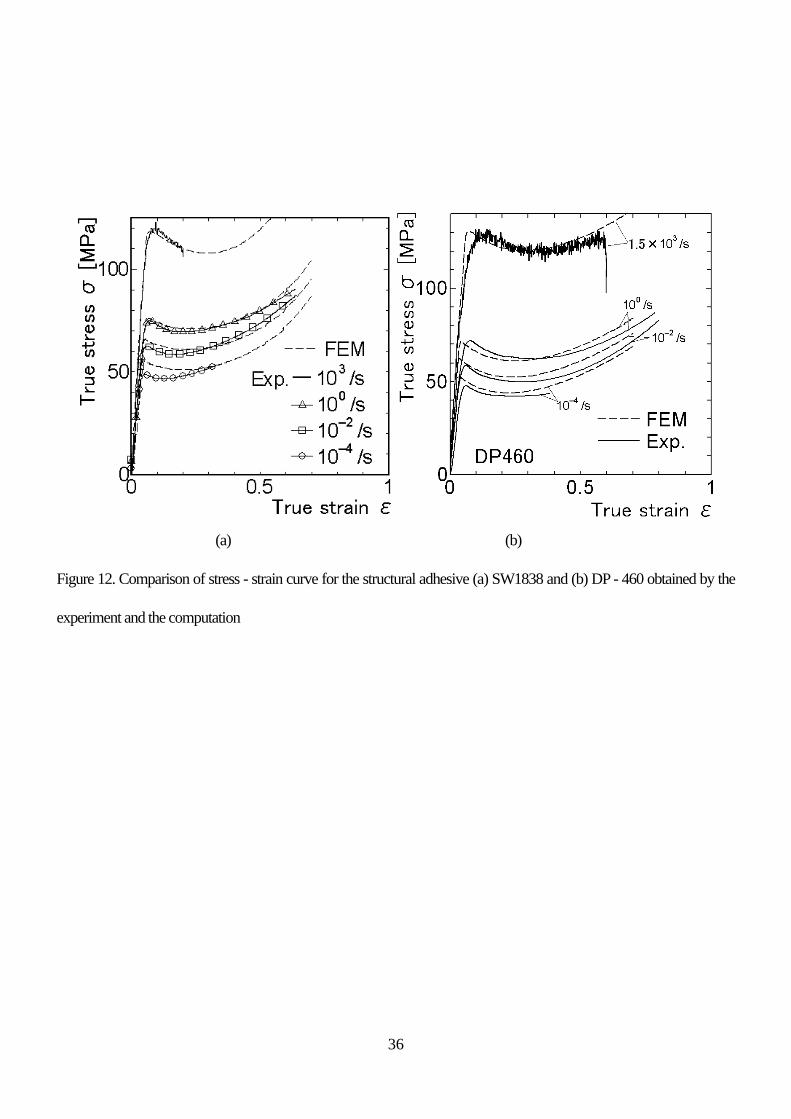
Figure 12 shows the true stress - true strain diagram obtained by the compression test and by
computation under quasi-static to impact loading for (a) SW1838 and (b) DP-460. Figure 12 (a) shows that the model
proposed in this study can successfully express the basic features of the curves, such as the linear elastic, strain softening
and strain hardening stages, observed for the solidified bulk material of structural adhesives. Almost quantitative
correspondence can be observed, and the validity of the proposed model is confirmed. The computational and
experimental results also show good agreement in Fig. 12 (b), similarly to Fig. 12 (a). Thus, our model can be widely
19
applied to structural epoxy adhesive, and the capability of this model can be confirmed.
6. CONCLUDING REMARKS
In this study, a bulk specimen made of two types of epoxy resin structural adhesives employed
frequently in a mechanical structure was manufactured after solidification. Using the specimen, a compressive test was
carried out using an INSTRON-type material testing machine and a split Hopkinson pressure bar method to investigate
the stress - strain curve in a wide range of strain rate. As a result, a nonlinear relationship between the yield stress and
strain rate was shown. Since it was assumed that the yield stress at a high strain rate is dominated by a secondary
relaxation and the mechanism behind secondary relaxation is the presence of rotational degrees of freedom, on the basis
of Jones' explanation (Jones, 1985), the plastic shear strain rate in the secondary relaxation was formulated on the basis
of an expansion of Argon's formalism (Argon, 1973) using an idea of Li and Gilman (1970). In addition, total shear
stress was expressed on the basis of the parallel two-elements model, as was done by Ree and Eyring (1955), using the
proposed model and the generalized model of Argon's formula (Argon, 1973).
Taking into account the amorphous glassy polymer after solidification of the adhesive, a rate form
of the three-dimensional constitutive equation was formulated on the basis of the four-elements model including an
elastic series element, as follows. First, the plastic deformation rate tensor for each relaxation process was formulated by
using the effective stress, which represents the difference between total stress, back stress and the stress at each
relaxation process, and the formulated plastic shear strain rate. Under the assumption that the plastic deformation rate
tensors in the two relaxation processes are the same, a nonlinear simultaneous equation for the stress tensor in each
relaxation process was obtained. Including a generalized Hooke's law, a rate form of the three-dimensional constitutive
equation can be derived. The proposed constitutive equation was implemented into the commercial finite element code
ABAQUS / Explicit and then a finite element simulation was performed. Finally, the validity of the formulated model
was shown by comparison with the experimental result.
Two points should be described for unsolved problems. First, the instability can be captured in the
stress-strain curve; however, the clear change on the surface cannot be observed like a neck propagation for the tension.
20
It is valuable to explain this paradox. Second, the fracture can be evaluated by a tension basically. Therefore, tensile
behavior of adhesive should be clarified. These points will be discussed in near future.
Acknowledgements
We wish to thank Professor Chiaki SATO of Tokyo Institute of Technology, for providing his valuable guidance on the
preparation of the bulk specimen. We also gratefully acknowledged Messer Hideaki KURAMOTO and Norio
UESUGI of Hiroshima Municipal Industrial Technology Center, Hiroshima City Industrial Promotion Center, to their
assistances on the quasi-static test by their own INSTRON-type material testing machine. The ABAQUS program was
provided under academic license by Dassault Systèmes Simulia Corp., Providence, RI.
REFERENCES
Argon, A. S., 1973. A theory for the low-temperature plastic deformation of glassy polymers. Philosophical Magazine
28 (4), 839-865.
Arruda, E. M., Boyce, M. C., 1991. A three-dimensional constitutive model for the large stretch behavior of rubber
elastic materials. Journal of the Mechanics and Physics of Solids 41 (2), 389-412.
Bauwens, J. C., 1972. Relation between the compression yield stress and the mechanical loss peak of
bisphenol-A-polycarbonate in the β transition range. Journal of Materials Science 7, 577-584.
Boyce, M. C., Parks, D. M., Argon, A. S., 1988. Inelastic deformation of glassy polymers. Part I: Rate dependent
constitutive model. Mechanics of Materials 7 (1), 15-33.
Fay, P. A., 2005. History of adhesive bonding In: Adams, R. D. (Eds.), Adhesive Bonding - Science, technology and
applications -. Woodhead Publishing Ltd., pp. 2-18.
21
Goglio, L., Peroni, L., Peroni, M., Rossetto, M., 2008. High strain-rate compression and tension behavior of an epoxy
bi-component adhesive. International Journal of Adhesion and Adhesives 28 (7), 329-339.
Haward, R. N., Thackray, G., 1968. The use of a mathematical model to describe isothermal stress-strain curves in
glassy thermoplastics. Proceedings of the Royal Society of London A302 (1471), 453-472.
Hutchinson, J. M., 1973. Relaxation processes and physical aging. In: Haward, R. N., Young, R. J. (Eds.), The physics
of glassy polymers. Chapman & Hall, pp. 128-129.
Jones, A. A., 1985. Molecular level model for motion and relaxation in glassy polycarbonate. Macromolecules 18 (5),
902-906.
Kolsky, H., 1949. An investigation of the mechanical properties of materials at very high rates of loading. Proceedings
of the Physical Society B62 (2), 676-700.
Li, J. C. M., Gilman, J. J., 1970. Disclination loops in polymers. Journal of Applied Physics 41 (11), 4248-4256.
Mulliken, A. D., Boyce, M. C., 2006. Mechanics of the rate-dependent elastic-plastic deformation of glassy polymers
from low to high strain rates. International Journal of Solids and Structures 43 (5), 1331-1356.
Nakai, K., Yokoyama, T., 2008. Strain rate dependence of compressive stress-strain loops of several polymers. Journal
of Solid Mechanics and Materials Engineering 2 (4), 557-566.
Nemat-Nasser, S., Issacs, J. B., Starrett, J. E., 1991. Hopkinson bar techniques for dynamic recovery experiments.
Proceedings of the Royal Society of London A435 (1894), 371-391.
Nishida, M., Ito, N., Tanaka, K., 2009. Effects of strain-rate and temperature on compressive properties of oil-based
biodegradable plastics. Zairyo 58 (5), 414-420. (in Japanese)
Ree, T., Eyring, H., 1955. Theory of non-newtonian flow. I. Solid plastic system. Journal of Applied Physics 26 (7),
793-800.
Sato, C., Ikegami, K., 1999. Strength of adhesively-bonded butt joints of tubes subjected to combined high-rate loads.
Journal of Adhesion 7 (1 & 2), 57-73.
22
Sato, C., Ikegami, K., 2001. Dynamic deformation of lap joints and scarf joints under impact loads. International
Journal of Adhesion and Adhesives 20 (1), 17-25.
Tomita, Y., 2000. Constitutive modelling of deformation behavior of glassy polymers and applications. International
Journal of Mechanical Sciences 42 (8), 1455-1469.
Yokoyama, T., Shimizu, H., 1998. Evaluation of impact shear strength of adhesive joints with the split Hopkinson bar.
JSME International Journal Series A 41 (4), 503-509.
Yu, X. X., Crocombe, A. D., Richardson, G., 2001. Material modelling for rate-dependent adhesives. International
Journal of Adhesion and Adhesives 21 (3), 197-210.
23
FIGURE CAPTIONS
Figure 1. Measurement result of differential scanning calorimetry against environmental temperature for the structural
adhesives (a) SW1838 and (b) DP - 460
Figure 2. Schematic illustration of the split Hopkinson bar apparatus used here
Figure 3. Output signals from the strain gauges glued on the input and output stress bars (a) without pulse shaper and (b)
with pulse shaper.
Figure 4. Time history of compressive force of adhesive bulk material during impact compressive test (a) without and
(b) with pulse shaper
Figure 5. True stress-true strain curves of structural adhesives (a) SW1838 and (b) DP - 460 obtained by quasi-static to
impact compressive tests
Figure 6. Yield behavior in uniaxial compression as a function of strain rate for structural adhesives SW1838 and DP -
460
Figure 7. Schematic illustrations of folded molecular chain with an angle of kink ω and a chain length of segment z
given by Argon (1973).
Figure 8. Schematic illustrations of folded molecular chain with an angle of kink ω and twist rotation θ
Figure 9. Comparison of a compressive yield stress - strain rate relationship obtained by the experiment and the
formulated model
Figure 10. Four elements elasto-viscoplastic model including each relaxation process
Figure 11. Finite element model for compressive specimen
Figure 12. Comparison of stress - strain curve for the structural adhesive (a) SW1838 and (b) DP - 460 obtained by the
experiment and the computation
TABLE CAPTIONS
Table 1. Material parameters for (a) SW1838 and (b) DP-460.
24
TABLES
Table 1. Material parameters for (a) SW1838 and (b) DP-460.
(a) (b)
25
FIGURES
(a) (b)
Figure 1. Measurement result of differential scanning calorimetry against environmental temperature for the structural
adhesives (a) SW1838 and (b) DP - 460.
26
Figure 2. Schematic illustration of the split Hopkinson bar apparatus used here.
27
(a)
(b)
Figure 3. Output signals from the strain gauges glued on the input and output stress bars (a) without pulse shaper and (b)
with pulse shaper.
28
(a) (b)
Figure 4. Time history of compressive force of adhesive bulk material during impact compressive test (a) without and
(b) with pulse shaper.
29
(a) (b)
Figure 5. True stress-true strain curves of structural adhesives (a) SW1838 and (b) DP - 460 obtained by quasi-static to
impact compressive tests.
30
Figure 6. Yield behavior in uniaxial compression as a function of strain rate for structural adhesives SW1838 and DP -
460.
31
Figure 7. Schematic illustrations of folded molecular chain with an angle of kink ω and a chain length of segment z
given by Argon (1973).
32
Figure 8. Schematic illustrations of folded molecular chain with an angle of kink ω and twist rotation θ .
33
Figure 9. Comparison of a compressive yield - strain rate relationship obtained by the experiment and the formulated
model.
34
Figure 10. Four elements elasto-viscoplastic model including each relaxation process.
35
Figure 11. Finite element model for compressive specimen.
36
(a) (b)
Figure 12. Comparison of stress - strain curve for the structural adhesive (a) SW1838 and (b) DP - 460 obtained by the
experiment and the computation


![SOME COMPUTATIONAL ISSUES IN LARGE STRAIN ...web.mit.edu/kjb/www/Publications_Prior_to_1998/Some...Computational issues in large strain elasto-plastic analysis 251 flow [28] or the](https://img.pdfslide.us/doc/110x75/5f2ef62e47538a55691f142e/some-computational-issues-in-large-strain-webmitedukjbwwwpublicationspriorto1998some.jpg)