Embed Size (px)
Citation preview

Experimental and Computational Investigation of a Small-Scale
Vertical Axis Wind Turbine with Dynamic Blade Pitching
Moble Benedict ∗
Department of Aerospace Engineering, Texas A and M University, College Station, TX, 77843
Vinod Lakshminarayan †
Science and Technology Corporation, Ames Research Center, Moffett Field, CA, 94035
Jeremy Garber ‡ Inderjit Chopra §
Alfred Gessow Rotorcraft Center, University of Maryland, College Park, MD, 20742
ABSTRACT
This paper describes the systematic performance measurements and computational (CFD) stud-ies conducted to investigate the performance of a small-scale dynamic-pitch vertical axis wind turbine(VAWT). The VAWT prototype was built and tested in a wind tunnel to understand the role of blade-pitch kinematics and flow curvature effects on turbine aerodynamic efficiency. The three parametersinvestigated in the experimental study were blade pitching amplitude (symmetric pitching), asym-metry in pitch kinematics between frontal and rear halves, and blade chord (or chord/radius ratio).Even though the optimal pitch amplitude is dependent on the tip speed ratio (TSR), moderate pitchamplitudes (± 20) had the highest overall efficiency for the symmetric pitch cases. The tip speedratio corresponding to the maximum CP decreased with increasing pitch amplitudes. The TSR cor-responding to maximum CP for 20 pitch amplitude was around 1.4, while the optimal TSR for the40 case was around 0.7. Because of the differences in the flow velocities in the front and rear halves,for maximizing power extraction, the pitch angles required in the front is significantly higher thanthat in the rear. The optimal performance of the turbine occurred at a phasing of 0. However,the performance was observed to be forgiving for small changes in phasing (<10) in the positivedirection (phase-lead), however, not in the negative direction. Increasing the chord/radius from 0.19to 0.25 caused significant improvements in turbine efficiency especially at higher pitch amplitudesbecause of the flow curvature effects. A CFD model was developed and extensively validated with thepresent experimental data. The validated CFD model was used to understand the effect of the dif-ferent parameters on turbine performance by analyzing the blade aerodynamics at various azimuthallocations. CFD analysis showed that the blade extracts most of the power in the frontal half of itscircular trajectory and in some cases even lose power in the rear half. This study clearly indicatesthe potential for major improvements in VAWT performance with novel blade kinematics, optimalchord/radius ratio, and using cambered blades.
Nomenclature
A Turbine frontal area, b×Db Blade span
*email:<[email protected]>†email:<[email protected]>‡email:<[email protected]>§email:<[email protected]>Presented at the 71st American Helicopter Society Annual Fo-rum, Virginia Beach, VA, May 5–7, 2015. Copyright c⃝2015 bythe American Helicopter Society International, Inc. All rights re-served.
c Blade chordCP Coefficient of powerD Turbine diameterR Turbine radiusTSR Tip speed ratio, ΩR/Uinf
Uinf Wind speedΩ Rotational speed of the turbineΨ Azimuthal locationϕ Blade pitch phasingρ Air density, 1.225 Kg/m3
θ Blade pitch angle
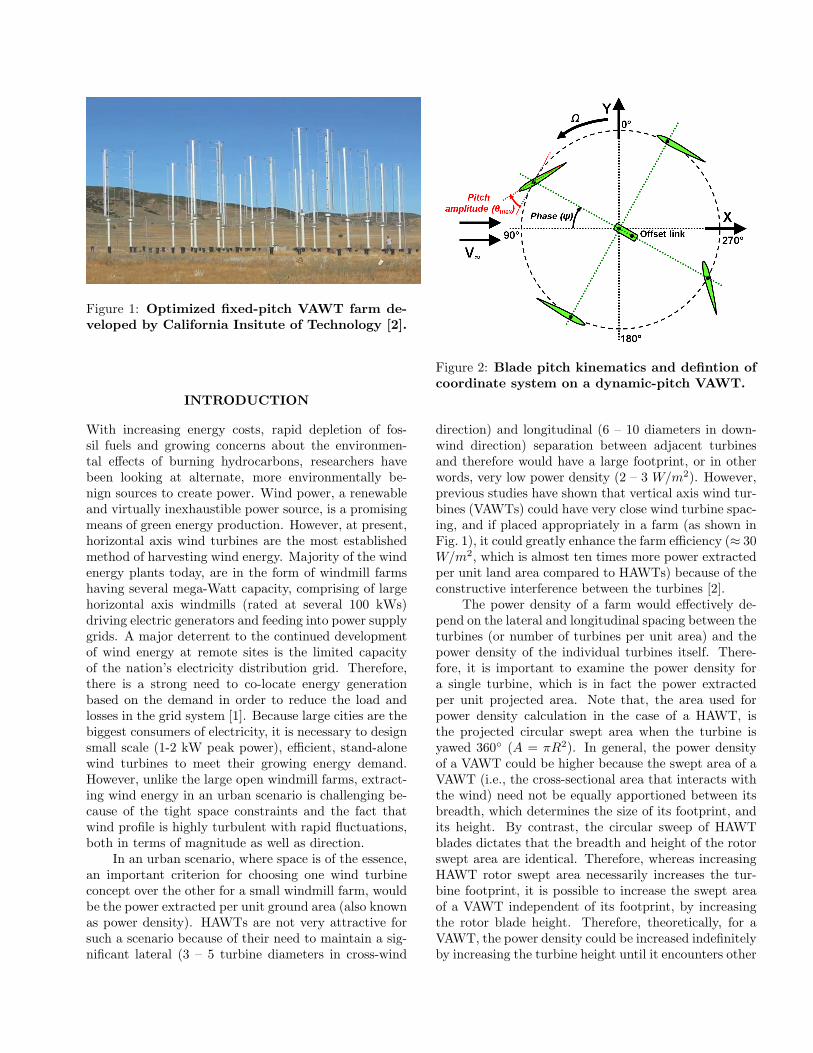
Figure 1: Optimized fixed-pitch VAWT farm de-veloped by California Insitute of Technology [2].
INTRODUCTION
With increasing energy costs, rapid depletion of fos-sil fuels and growing concerns about the environmen-tal effects of burning hydrocarbons, researchers havebeen looking at alternate, more environmentally be-nign sources to create power. Wind power, a renewableand virtually inexhaustible power source, is a promisingmeans of green energy production. However, at present,horizontal axis wind turbines are the most establishedmethod of harvesting wind energy. Majority of the windenergy plants today, are in the form of windmill farmshaving several mega-Watt capacity, comprising of largehorizontal axis windmills (rated at several 100 kWs)driving electric generators and feeding into power supplygrids. A major deterrent to the continued developmentof wind energy at remote sites is the limited capacityof the nation’s electricity distribution grid. Therefore,there is a strong need to co-locate energy generationbased on the demand in order to reduce the load andlosses in the grid system [1]. Because large cities are thebiggest consumers of electricity, it is necessary to designsmall scale (1-2 kW peak power), efficient, stand-alonewind turbines to meet their growing energy demand.However, unlike the large open windmill farms, extract-ing wind energy in an urban scenario is challenging be-cause of the tight space constraints and the fact thatwind profile is highly turbulent with rapid fluctuations,both in terms of magnitude as well as direction.
In an urban scenario, where space is of the essence,an important criterion for choosing one wind turbineconcept over the other for a small windmill farm, wouldbe the power extracted per unit ground area (also knownas power density). HAWTs are not very attractive forsuch a scenario because of their need to maintain a sig-nificant lateral (3 – 5 turbine diameters in cross-wind
Figure 2: Blade pitch kinematics and defintion ofcoordinate system on a dynamic-pitch VAWT.
direction) and longitudinal (6 – 10 diameters in down-wind direction) separation between adjacent turbinesand therefore would have a large footprint, or in otherwords, very low power density (2 – 3 W/m2). However,previous studies have shown that vertical axis wind tur-bines (VAWTs) could have very close wind turbine spac-ing, and if placed appropriately in a farm (as shown inFig. 1), it could greatly enhance the farm efficiency (≈ 30W/m2, which is almost ten times more power extractedper unit land area compared to HAWTs) because of theconstructive interference between the turbines [2].
The power density of a farm would effectively de-pend on the lateral and longitudinal spacing between theturbines (or number of turbines per unit area) and thepower density of the individual turbines itself. There-fore, it is important to examine the power density fora single turbine, which is in fact the power extractedper unit projected area. Note that, the area used forpower density calculation in the case of a HAWT, isthe projected circular swept area when the turbine isyawed 360 (A = πR2). In general, the power densityof a VAWT could be higher because the swept area of aVAWT (i.e., the cross-sectional area that interacts withthe wind) need not be equally apportioned between itsbreadth, which determines the size of its footprint, andits height. By contrast, the circular sweep of HAWTblades dictates that the breadth and height of the rotorswept area are identical. Therefore, whereas increasingHAWT rotor swept area necessarily increases the tur-bine footprint, it is possible to increase the swept areaof a VAWT independent of its footprint, by increasingthe rotor blade height. Therefore, theoretically, for aVAWT, the power density could be increased indefinitelyby increasing the turbine height until it encounters other
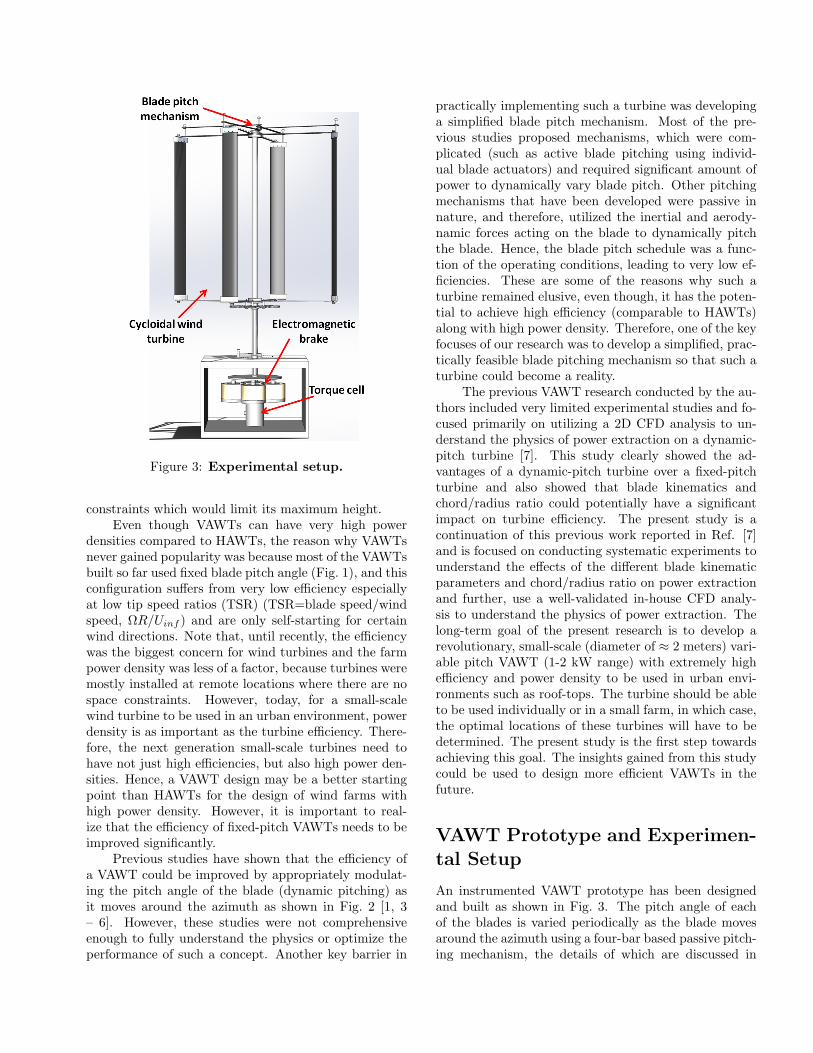
Figure 3: Experimental setup.
constraints which would limit its maximum height.Even though VAWTs can have very high power
densities compared to HAWTs, the reason why VAWTsnever gained popularity was because most of the VAWTsbuilt so far used fixed blade pitch angle (Fig. 1), and thisconfiguration suffers from very low efficiency especiallyat low tip speed ratios (TSR) (TSR=blade speed/windspeed, ΩR/Uinf ) and are only self-starting for certainwind directions. Note that, until recently, the efficiencywas the biggest concern for wind turbines and the farmpower density was less of a factor, because turbines weremostly installed at remote locations where there are nospace constraints. However, today, for a small-scalewind turbine to be used in an urban environment, powerdensity is as important as the turbine efficiency. There-fore, the next generation small-scale turbines need tohave not just high efficiencies, but also high power den-sities. Hence, a VAWT design may be a better startingpoint than HAWTs for the design of wind farms withhigh power density. However, it is important to real-ize that the efficiency of fixed-pitch VAWTs needs to beimproved significantly.
Previous studies have shown that the efficiency ofa VAWT could be improved by appropriately modulat-ing the pitch angle of the blade (dynamic pitching) asit moves around the azimuth as shown in Fig. 2 [1, 3– 6]. However, these studies were not comprehensiveenough to fully understand the physics or optimize theperformance of such a concept. Another key barrier in
practically implementing such a turbine was developinga simplified blade pitch mechanism. Most of the pre-vious studies proposed mechanisms, which were com-plicated (such as active blade pitching using individ-ual blade actuators) and required significant amount ofpower to dynamically vary blade pitch. Other pitchingmechanisms that have been developed were passive innature, and therefore, utilized the inertial and aerody-namic forces acting on the blade to dynamically pitchthe blade. Hence, the blade pitch schedule was a func-tion of the operating conditions, leading to very low ef-ficiencies. These are some of the reasons why such aturbine remained elusive, even though, it has the poten-tial to achieve high efficiency (comparable to HAWTs)along with high power density. Therefore, one of the keyfocuses of our research was to develop a simplified, prac-tically feasible blade pitching mechanism so that such aturbine could become a reality.
The previous VAWT research conducted by the au-thors included very limited experimental studies and fo-cused primarily on utilizing a 2D CFD analysis to un-derstand the physics of power extraction on a dynamic-pitch turbine [7]. This study clearly showed the ad-vantages of a dynamic-pitch turbine over a fixed-pitchturbine and also showed that blade kinematics andchord/radius ratio could potentially have a significantimpact on turbine efficiency. The present study is acontinuation of this previous work reported in Ref. [7]and is focused on conducting systematic experiments tounderstand the effects of the different blade kinematicparameters and chord/radius ratio on power extractionand further, use a well-validated in-house CFD analy-sis to understand the physics of power extraction. Thelong-term goal of the present research is to develop arevolutionary, small-scale (diameter of ≈ 2 meters) vari-able pitch VAWT (1-2 kW range) with extremely highefficiency and power density to be used in urban envi-ronments such as roof-tops. The turbine should be ableto be used individually or in a small farm, in which case,the optimal locations of these turbines will have to bedetermined. The present study is the first step towardsachieving this goal. The insights gained from this studycould be used to design more efficient VAWTs in thefuture.
VAWT Prototype and Experimen-tal Setup
An instrumented VAWT prototype has been designedand built as shown in Fig. 3. The pitch angle of eachof the blades is varied periodically as the blade movesaround the azimuth using a four-bar based passive pitch-ing mechanism, the details of which are discussed in
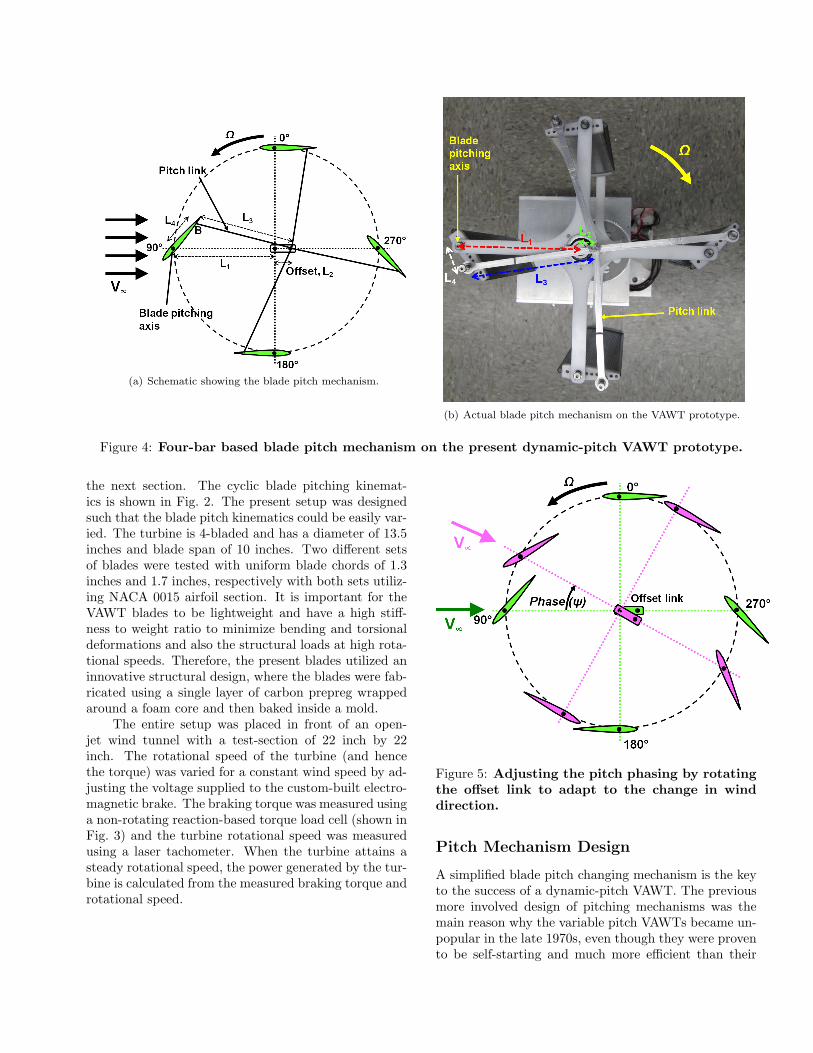
(a) Schematic showing the blade pitch mechanism.
(b) Actual blade pitch mechanism on the VAWT prototype.
Figure 4: Four-bar based blade pitch mechanism on the present dynamic-pitch VAWT prototype.
the next section. The cyclic blade pitching kinemat-ics is shown in Fig. 2. The present setup was designedsuch that the blade pitch kinematics could be easily var-ied. The turbine is 4-bladed and has a diameter of 13.5inches and blade span of 10 inches. Two different setsof blades were tested with uniform blade chords of 1.3inches and 1.7 inches, respectively with both sets utiliz-ing NACA 0015 airfoil section. It is important for theVAWT blades to be lightweight and have a high stiff-ness to weight ratio to minimize bending and torsionaldeformations and also the structural loads at high rota-tional speeds. Therefore, the present blades utilized aninnovative structural design, where the blades were fab-ricated using a single layer of carbon prepreg wrappedaround a foam core and then baked inside a mold.
The entire setup was placed in front of an open-jet wind tunnel with a test-section of 22 inch by 22inch. The rotational speed of the turbine (and hencethe torque) was varied for a constant wind speed by ad-justing the voltage supplied to the custom-built electro-magnetic brake. The braking torque was measured usinga non-rotating reaction-based torque load cell (shown inFig. 3) and the turbine rotational speed was measuredusing a laser tachometer. When the turbine attains asteady rotational speed, the power generated by the tur-bine is calculated from the measured braking torque androtational speed.
Figure 5: Adjusting the pitch phasing by rotatingthe offset link to adapt to the change in winddirection.
Pitch Mechanism Design
A simplified blade pitch changing mechanism is the keyto the success of a dynamic-pitch VAWT. The previousmore involved design of pitching mechanisms was themain reason why the variable pitch VAWTs became un-popular in the late 1970s, even though they were provento be self-starting and much more efficient than their

0 100 200 300 400 5000
0.5
1
1.5
2
2.5
3
3.5
Rotational speed, rpm
Pow
er (
Wat
ts)
Pblades
Pbrake
Pparasite
Figure 6: Experimental results showing the vari-tion of different components of power with tur-bine rotational speed.
fixed pitch counterparts. Therefore, a key focus of ourresearch was to develop a simplified blade pitch mecha-nism.
As shown in Fig. 4(a), the present pitching mech-anism is based on a four-bar linkage system, which isdesigned in such a way that the blade pitches automat-ically in a cyclic fashion as the turbine rotates. There-fore, the only power penalty incurred in its operationis the frictional losses associated with the moving com-ponents. As shown in the schematic, L1, L2, L3 andL4 are the four linkage lengths. The key component ofthe pitching mechanism is the offset link of length L2.The pitch links (of length L3) are connected to the endof the offset link on one end and the other end is con-nected to point B, on the blade, which is at a distanceL4 behind the pitching axis. The connections at bothends of the pitch link are through pin joints to allow therotational degree of freedom. The radius of the rotorforms the linkage length L1. With this arrangement, asthe rotor rotates, the blades automatically pitch, wherethe pitching amplitude depends on the offset length, L2,when the other linkage lengths remain fixed. The actualpitching mechanism implemented on the VAWT proto-type is shown in Fig. 4(b). The four-bar linkage systemcan be clearly seen in the figure.
As explained before, the magnitude of the offset(L2) changes the blade pitching amplitude and the di-rection in which the offset link is pointing would changethe phasing of the cyclic blade pitching as shown inFig. 5. For the sake of simplicity, the present proto-type is designed such that the offset length (L2) couldnot be changed while the turbine is rotating (Fig. 4(b)),which means the blade pitch kinematics (pitch ampli-
Figure 7: CFD grid system used for the 6.75 inchradius 4-bladed cyclorotors with 1.3 inch bladechord.
tude, θmax) is fixed. However, as shown in Fig. 5, inthe present mechanism, the offset link could be rotatedto actively change the phasing of the cyclic pitch (ϕ)depending on the direction of incoming wind to maxi-mize efficiency. This method of altering the phasing ofblade pitching is instantaneous and much simpler thanrotating the entire HAWT in the direction of the wind.This capability of the present VAWT pitch mechanism,to immediately respond to a change in wind direction,is the key to maximizing the power extraction in urbanenvironments where wind direction changes rapidly.
Experimental Methodology
As explained in the previous section, the power ex-tracted by the turbine was calculated from the mea-sured brake torque (with the electromagnetic brake) andits rotational speed. The inherent assumption here be-ing, once the turbine reaches steady state, the powerextracted by the turbine is equal to the braking power.However, the goal of the present experiment was not tomeasure the net aerodynamic power output of the tur-bine, but, the complete power extracted by the blades,which does not include the power lost (or parasiticpower) in rotating the rest of the turbine structure suchas the endplates, pitch links, etc. Assuming all thepower on a turbine is extracted by the blades, whenthe turbine reaches the equilibrium speed, the relationbelow should be satisfied.
Pblades = Pbrake + Pparasite (1)
where Pblades is the power extracted by the blades,
0 0.5 1 1.50
0.05
0.1
0.15
0.2
Tip speed ratio, TSR
Coe
ffici
ent o
f pow
er, C
P
Test dataCFD
(a) Variation of coefficient of power with tip speed ratio for 15 bladepitch amplitude.
0 0.5 1 1.50
0.05
0.1
0.15
0.2
Tip speed ratio, TSR
Coe
ffici
ent o
f pow
er, C
P
Test dataCFD
(b) Variation of coefficient of power with tip speed ratio for 20 bladepitch amplitude.
0 0.5 1 1.50
0.05
0.1
0.15
0.2
Tip speed ratio, TSR
Coe
ffici
ent o
f pow
er, C
P
Test dataCFD
(c) Variation of coefficient of power with tip speed ratio for 25 bladepitch amplitude.
0 0.5 1 1.50
0.05
0.1
0.15
0.2
Tip speed ratio, TSR
Coe
ffici
ent o
f pow
er, C
P
Test dataCFD
(d) Variation of coefficient of power with tip speed ratio for 30 bladepitch amplitude.
0 0.5 1 1.50
0.05
0.1
0.15
0.2
Tip speed ratio, TSR
Coe
ffici
ent o
f pow
er, C
P
Test dataCFD
(e) Variation of coefficient of power with tip speed ratio for 35 bladepitch amplitude.
0 0.5 1 1.50
0.05
0.1
0.15
0.2
Tip speed ratio, TSR
Coe
ffici
ent o
f pow
er, C
P
Test dataCFD
(f) Variation of coefficient of power with tip speed ratio for 40 bladepitch amplitude.
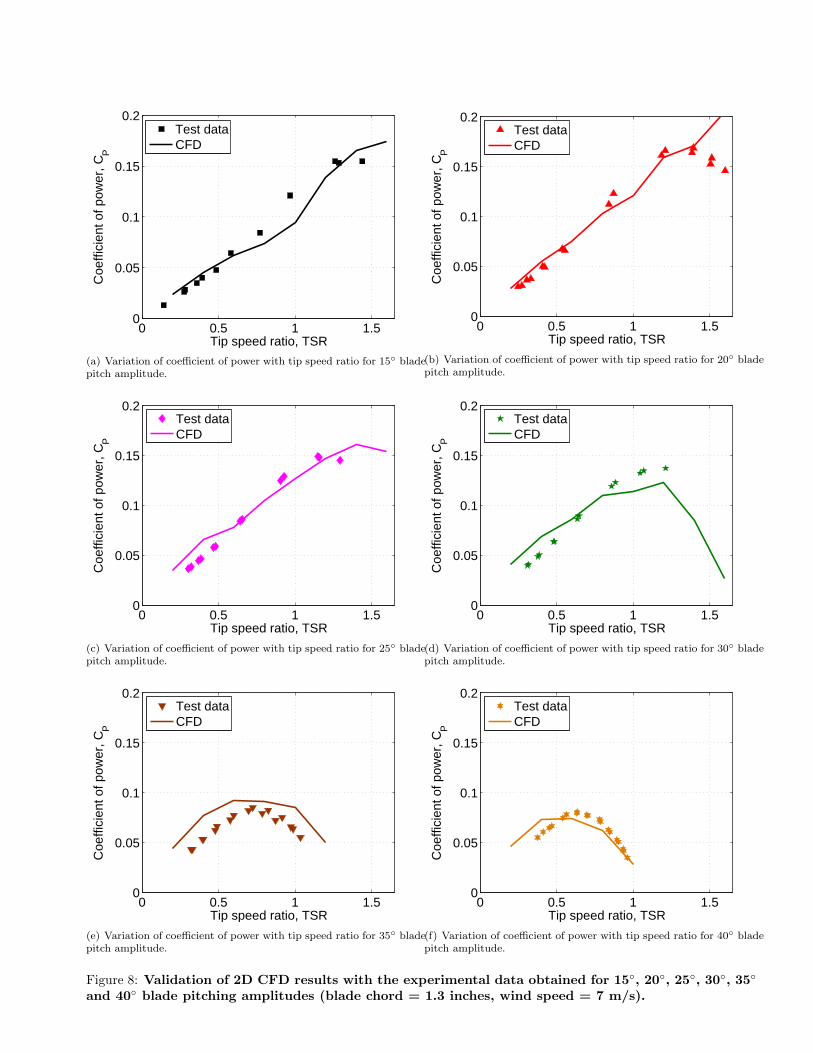
Figure 8: Validation of 2D CFD results with the experimental data obtained for 15, 20, 25, 30, 35
and 40 blade pitching amplitudes (blade chord = 1.3 inches, wind speed = 7 m/s).
0 0.5 1 1.50
0.05
0.1
0.15
0.2
Tip speed ratio, TSR
Coe
ffici
ent o
f pow
er, C
P
Test data(+10°)
CFD(+10°)
Test data(−10°)
CFD(−10°)
+/− Phasing
(a) Variation of coefficient of power with tip speed ratio for 20 bladepitch amplitude and ±10 phasing.
0 0.5 1 1.50
0.05
0.1
0.15
0.2
Tip speed ratio, TSR
Coe
ffici
ent o
f pow
er, C
P
Test data(20°F 10°R)
CFD(20°F 10°R)
Test data(20°F 25°R)
CFD(20°F 25°R)
F = FrontR = Rear
(b) Variation of coefficient of power with tip speed ratio for two asym-metric pitching cases with 20 blade pitch in the front, 10 and 25
in rear.
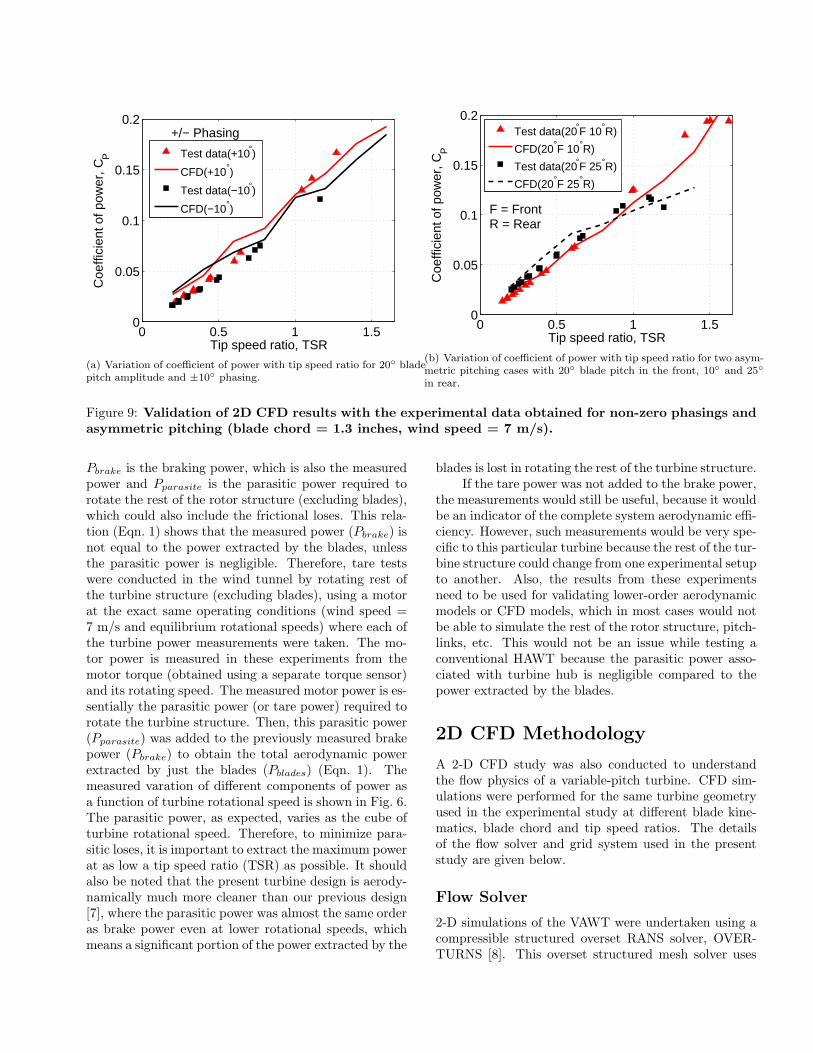
Figure 9: Validation of 2D CFD results with the experimental data obtained for non-zero phasings andasymmetric pitching (blade chord = 1.3 inches, wind speed = 7 m/s).
Pbrake is the braking power, which is also the measuredpower and Pparasite is the parasitic power required torotate the rest of the rotor structure (excluding blades),which could also include the frictional loses. This rela-tion (Eqn. 1) shows that the measured power (Pbrake) isnot equal to the power extracted by the blades, unlessthe parasitic power is negligible. Therefore, tare testswere conducted in the wind tunnel by rotating rest ofthe turbine structure (excluding blades), using a motorat the exact same operating conditions (wind speed =7 m/s and equilibrium rotational speeds) where each ofthe turbine power measurements were taken. The mo-tor power is measured in these experiments from themotor torque (obtained using a separate torque sensor)and its rotating speed. The measured motor power is es-sentially the parasitic power (or tare power) required torotate the turbine structure. Then, this parasitic power(Pparasite) was added to the previously measured brakepower (Pbrake) to obtain the total aerodynamic powerextracted by just the blades (Pblades) (Eqn. 1). Themeasured varation of different components of power asa function of turbine rotational speed is shown in Fig. 6.The parasitic power, as expected, varies as the cube ofturbine rotational speed. Therefore, to minimize para-sitic loses, it is important to extract the maximum powerat as low a tip speed ratio (TSR) as possible. It shouldalso be noted that the present turbine design is aerody-namically much more cleaner than our previous design[7], where the parasitic power was almost the same orderas brake power even at lower rotational speeds, whichmeans a significant portion of the power extracted by the
blades is lost in rotating the rest of the turbine structure.If the tare power was not added to the brake power,
the measurements would still be useful, because it wouldbe an indicator of the complete system aerodynamic effi-ciency. However, such measurements would be very spe-cific to this particular turbine because the rest of the tur-bine structure could change from one experimental setupto another. Also, the results from these experimentsneed to be used for validating lower-order aerodynamicmodels or CFD models, which in most cases would notbe able to simulate the rest of the rotor structure, pitch-links, etc. This would not be an issue while testing aconventional HAWT because the parasitic power asso-ciated with turbine hub is negligible compared to thepower extracted by the blades.
2D CFD Methodology
A 2-D CFD study was also conducted to understandthe flow physics of a variable-pitch turbine. CFD sim-ulations were performed for the same turbine geometryused in the experimental study at different blade kine-matics, blade chord and tip speed ratios. The detailsof the flow solver and grid system used in the presentstudy are given below.
Flow Solver
2-D simulations of the VAWT were undertaken using acompressible structured overset RANS solver, OVER-TURNS [8]. This overset structured mesh solver uses
the diagonal form of the implicit approximate factor-ization method developed by Pulliam and Chaussee [9]with a preconditioned dual-time scheme to solve thecompressible RANS equations. Computations are per-formed in the inertial frame in a time-accurate manner.A third-order MUSCL scheme [10] with Roe flux dif-ference splitting [11] and Koren’s limiter [12] is used tocompute the inviscid terms, and second-order centraldifferencing is used for the viscous terms. Due to therelatively low Mach numbers in which the present tur-bine operate, the inclusion of a low Mach preconditionerbased on Turkel’s [13] method accelerates the conver-gence and ensures accuracy of the solution. Spalart-Allmaras [14] turbulence model is employed for RANSclosure. This one-equation model has the advantagesof ease of implementation, computational efficiency andnumerical stability.
Grid System
An overset system of meshes, consisting of C-type airfoilmesh for each blade and a cylindrical background mesh,is used for the computation. The airfoil meshes have255× 55 grid points in the wraparound and normal di-rections, respectively. The background cylindrical meshhas 245× 221 points in the azimuthal and radial direc-tions, respectively. Implicit hole-cutting method devel-oped by Lee [15] and refined by Lakshminarayan [8] isused to find the connectivity information between theoverset meshes. Figure 7 shows the mesh system usedfor the present turbine. In these figures, only the fieldpoints (points where the flow equations are solved) areshown. All the points that are blanked out either receiveinformation from another mesh or lies inside a solid bodyand therefore, does not have a valid solution.
Results
For a fixed turbine geometry, the key parameters thatcan significantly affect power extraction on a dynamic-pitch VAWT are blade kinematics and its phasing withrespect to the wind direction (ϕ, shown in Fig. 2). Twotypes of blade kinematics were investigated, which aresymmetric and asymmetric blade pitch kinematics. Insymmetric pitch kinematics the blades have the samepitch angle variation in the frontal and rear halves andthe parameter that is varied is blade pitch amplitude(θmax, Fig. 2). Pitch amplitude was varied from ±10
to ±40 in steps of 5 with pitching axis at the quar-ter chord. Asymmetric blade kinematics would involveblades having dissimilar pitch angle variation in the twohalves of its circular trajectory. For the different asym-metric cases tested, the front half pitch schedule waskept constant and the rear pitch kinematics was varied
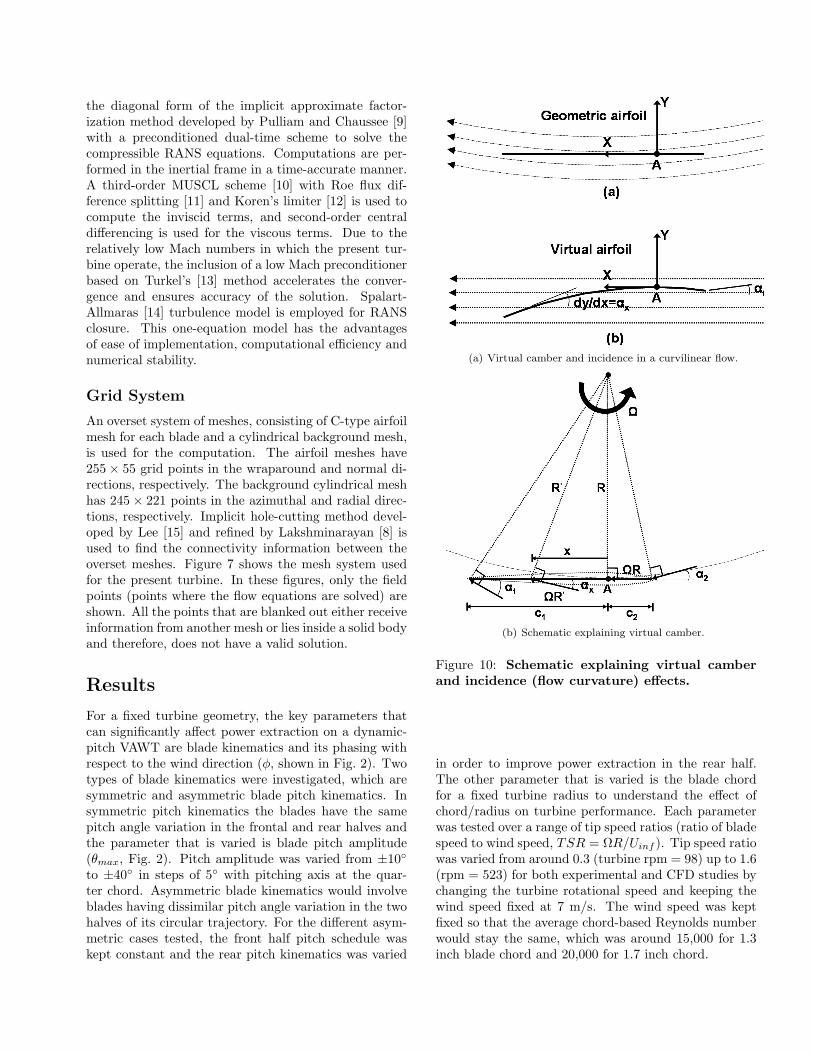
(a) Virtual camber and incidence in a curvilinear flow.
(b) Schematic explaining virtual camber.
Figure 10: Schematic explaining virtual camberand incidence (flow curvature) effects.
in order to improve power extraction in the rear half.The other parameter that is varied is the blade chordfor a fixed turbine radius to understand the effect ofchord/radius on turbine performance. Each parameterwas tested over a range of tip speed ratios (ratio of bladespeed to wind speed, TSR = ΩR/Uinf ). Tip speed ratiowas varied from around 0.3 (turbine rpm = 98) up to 1.6(rpm = 523) for both experimental and CFD studies bychanging the turbine rotational speed and keeping thewind speed fixed at 7 m/s. The wind speed was keptfixed so that the average chord-based Reynolds numberwould stay the same, which was around 15,000 for 1.3inch blade chord and 20,000 for 1.7 inch chord.
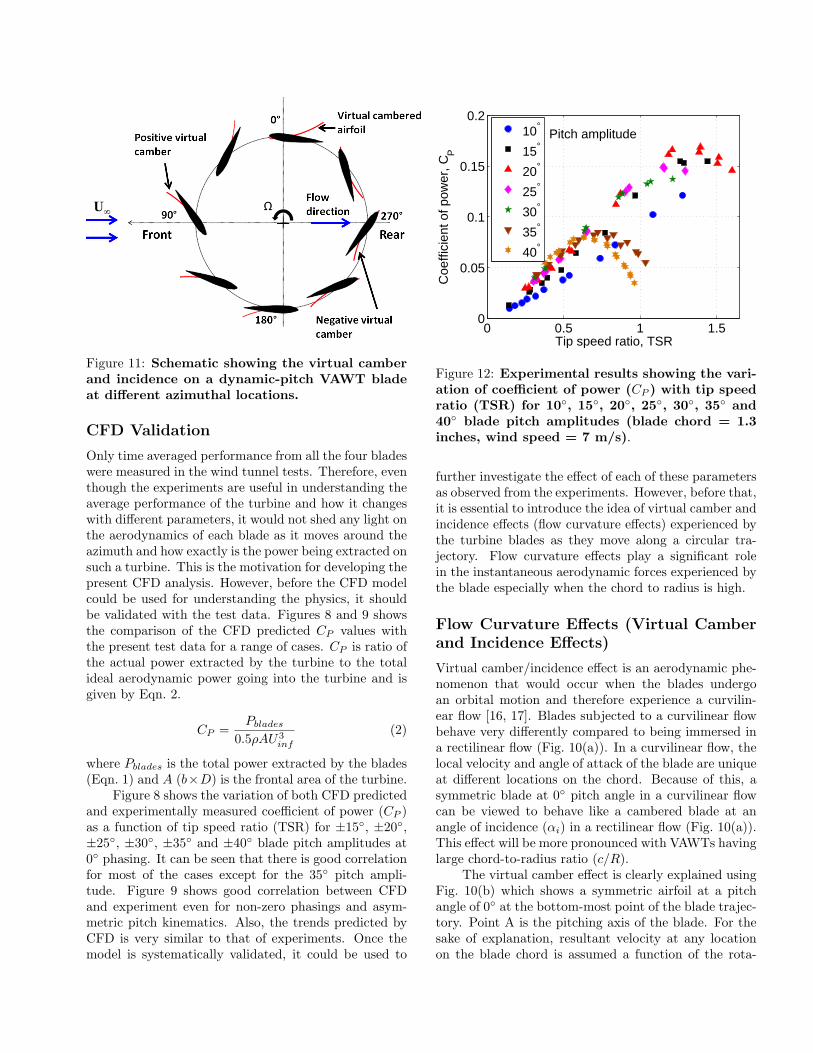
Figure 11: Schematic showing the virtual camberand incidence on a dynamic-pitch VAWT bladeat different azimuthal locations.
CFD Validation
Only time averaged performance from all the four bladeswere measured in the wind tunnel tests. Therefore, eventhough the experiments are useful in understanding theaverage performance of the turbine and how it changeswith different parameters, it would not shed any light onthe aerodynamics of each blade as it moves around theazimuth and how exactly is the power being extracted onsuch a turbine. This is the motivation for developing thepresent CFD analysis. However, before the CFD modelcould be used for understanding the physics, it shouldbe validated with the test data. Figures 8 and 9 showsthe comparison of the CFD predicted CP values withthe present test data for a range of cases. CP is ratio ofthe actual power extracted by the turbine to the totalideal aerodynamic power going into the turbine and isgiven by Eqn. 2.
CP =Pblades
0.5ρAU3inf
(2)
where Pblades is the total power extracted by the blades(Eqn. 1) and A (b×D) is the frontal area of the turbine.
Figure 8 shows the variation of both CFD predictedand experimentally measured coefficient of power (CP )as a function of tip speed ratio (TSR) for ±15, ±20,±25, ±30, ±35 and ±40 blade pitch amplitudes at0 phasing. It can be seen that there is good correlationfor most of the cases except for the 35 pitch ampli-tude. Figure 9 shows good correlation between CFDand experiment even for non-zero phasings and asym-metric pitch kinematics. Also, the trends predicted byCFD is very similar to that of experiments. Once themodel is systematically validated, it could be used to
0 0.5 1 1.50
0.05
0.1
0.15
0.2
Tip speed ratio, TSR
Coe
ffici
ent o
f pow
er, C
P
10°
15°
20°
25°
30°
35°
40°
Pitch amplitude
Figure 12: Experimental results showing the vari-ation of coefficient of power (CP ) with tip speedratio (TSR) for 10, 15, 20, 25, 30, 35 and40 blade pitch amplitudes (blade chord = 1.3inches, wind speed = 7 m/s).
further investigate the effect of each of these parametersas observed from the experiments. However, before that,it is essential to introduce the idea of virtual camber andincidence effects (flow curvature effects) experienced bythe turbine blades as they move along a circular tra-jectory. Flow curvature effects play a significant rolein the instantaneous aerodynamic forces experienced bythe blade especially when the chord to radius is high.
Flow Curvature Effects (Virtual Camberand Incidence Effects)
Virtual camber/incidence effect is an aerodynamic phe-nomenon that would occur when the blades undergoan orbital motion and therefore experience a curvilin-ear flow [16, 17]. Blades subjected to a curvilinear flowbehave very differently compared to being immersed ina rectilinear flow (Fig. 10(a)). In a curvilinear flow, thelocal velocity and angle of attack of the blade are uniqueat different locations on the chord. Because of this, asymmetric blade at 0 pitch angle in a curvilinear flowcan be viewed to behave like a cambered blade at anangle of incidence (αi) in a rectilinear flow (Fig. 10(a)).This effect will be more pronounced with VAWTs havinglarge chord-to-radius ratio (c/R).
The virtual camber effect is clearly explained usingFig. 10(b) which shows a symmetric airfoil at a pitchangle of 0 at the bottom-most point of the blade trajec-tory. Point A is the pitching axis of the blade. For thesake of explanation, resultant velocity at any locationon the blade chord is assumed a function of the rota-
0 0.5 1 1.50
0.05
0.1
0.15
0.2
Tip speed ratio, TSR
Coe
ffici
ent o
f pow
er, C
P
15°
20°
25°
30°
Pitch amplitude
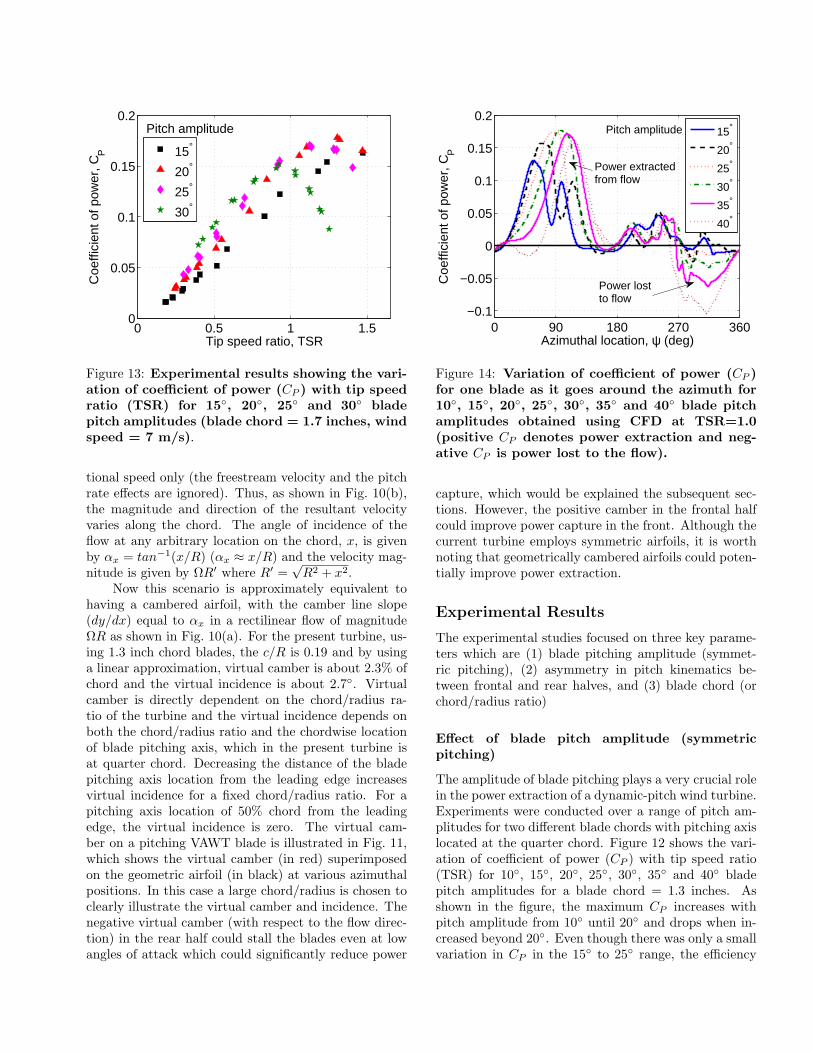
Figure 13: Experimental results showing the vari-ation of coefficient of power (CP ) with tip speedratio (TSR) for 15, 20, 25 and 30 bladepitch amplitudes (blade chord = 1.7 inches, windspeed = 7 m/s).
tional speed only (the freestream velocity and the pitchrate effects are ignored). Thus, as shown in Fig. 10(b),the magnitude and direction of the resultant velocityvaries along the chord. The angle of incidence of theflow at any arbitrary location on the chord, x, is givenby αx = tan−1(x/R) (αx ≈ x/R) and the velocity mag-nitude is given by ΩR′ where R′ =
√R2 + x2.
Now this scenario is approximately equivalent tohaving a cambered airfoil, with the camber line slope(dy/dx) equal to αx in a rectilinear flow of magnitudeΩR as shown in Fig. 10(a). For the present turbine, us-ing 1.3 inch chord blades, the c/R is 0.19 and by usinga linear approximation, virtual camber is about 2.3% ofchord and the virtual incidence is about 2.7. Virtualcamber is directly dependent on the chord/radius ra-tio of the turbine and the virtual incidence depends onboth the chord/radius ratio and the chordwise locationof blade pitching axis, which in the present turbine isat quarter chord. Decreasing the distance of the bladepitching axis location from the leading edge increasesvirtual incidence for a fixed chord/radius ratio. For apitching axis location of 50% chord from the leadingedge, the virtual incidence is zero. The virtual cam-ber on a pitching VAWT blade is illustrated in Fig. 11,which shows the virtual camber (in red) superimposedon the geometric airfoil (in black) at various azimuthalpositions. In this case a large chord/radius is chosen toclearly illustrate the virtual camber and incidence. Thenegative virtual camber (with respect to the flow direc-tion) in the rear half could stall the blades even at lowangles of attack which could significantly reduce power
0 90 180 270 360−0.1
−0.05
0
0.05
0.1
0.15
0.2
Azimuthal location, ψ (deg)
Coe
ffici
ent o
f pow
er, C
P
15°
20°
25°
30°
35°
40°
Power extractedfrom flow
Pitch amplitude
Power lostto flow
Figure 14: Variation of coefficient of power (CP )for one blade as it goes around the azimuth for10, 15, 20, 25, 30, 35 and 40 blade pitchamplitudes obtained using CFD at TSR=1.0(positive CP denotes power extraction and neg-ative CP is power lost to the flow).
capture, which would be explained the subsequent sec-tions. However, the positive camber in the frontal halfcould improve power capture in the front. Although thecurrent turbine employs symmetric airfoils, it is worthnoting that geometrically cambered airfoils could poten-tially improve power extraction.
Experimental Results
The experimental studies focused on three key parame-ters which are (1) blade pitching amplitude (symmet-ric pitching), (2) asymmetry in pitch kinematics be-tween frontal and rear halves, and (3) blade chord (orchord/radius ratio)
Effect of blade pitch amplitude (symmetricpitching)
The amplitude of blade pitching plays a very crucial rolein the power extraction of a dynamic-pitch wind turbine.Experiments were conducted over a range of pitch am-plitudes for two different blade chords with pitching axislocated at the quarter chord. Figure 12 shows the vari-ation of coefficient of power (CP ) with tip speed ratio(TSR) for 10, 15, 20, 25, 30, 35 and 40 bladepitch amplitudes for a blade chord = 1.3 inches. Asshown in the figure, the maximum CP increases withpitch amplitude from 10 until 20 and drops when in-creased beyond 20. Even though there was only a smallvariation in CP in the 15 to 25 range, the efficiency
(a) Blade pitch amplitude = 15. (b) Blade pitch amplitude = 20.
(c) Blade pitch amplitude = 25. (d) Blade pitch amplitude = 30.
(e) Blade pitch amplitude = 35. (f) Blade pitch amplitude = 40.
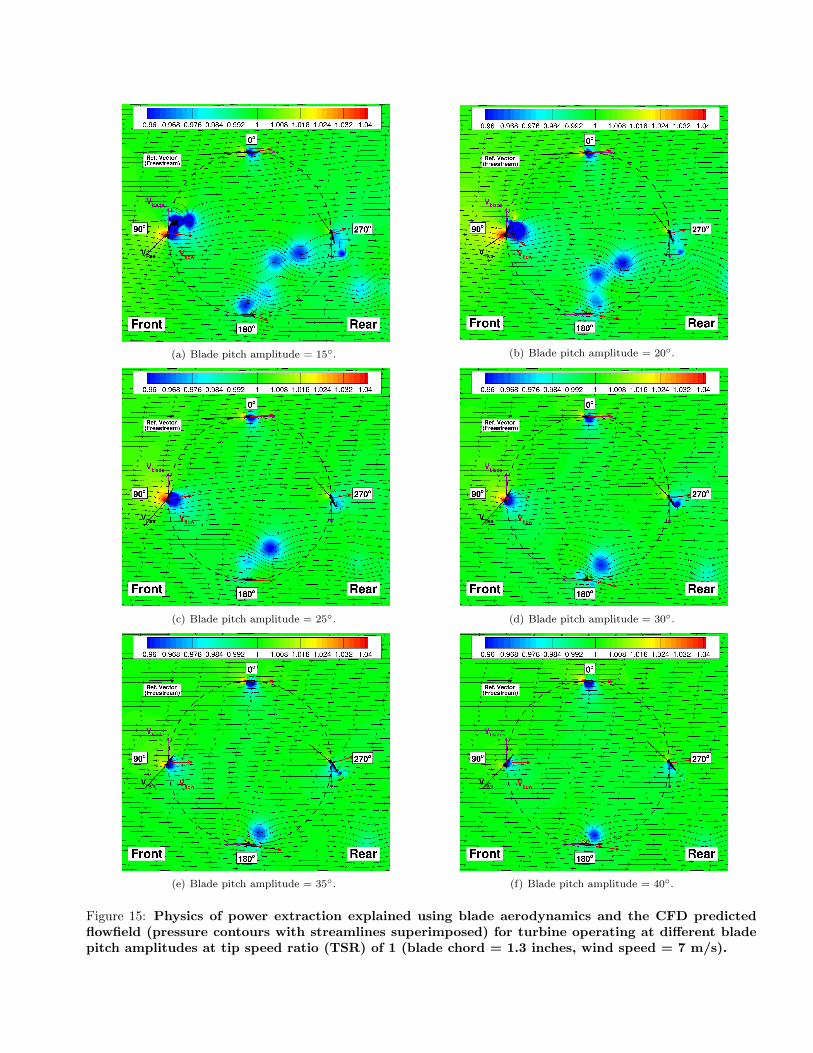
Figure 15: Physics of power extraction explained using blade aerodynamics and the CFD predictedflowfield (pressure contours with streamlines superimposed) for turbine operating at different bladepitch amplitudes at tip speed ratio (TSR) of 1 (blade chord = 1.3 inches, wind speed = 7 m/s).
0 0.5 1 1.50
0.05
0.1
0.15
0.2
Tip speed ratio, TSR
Coe
ffici
ent o
f pow
er, C
P
20°F 25°R
20°F 20°R
20°F 15°R
20°F 10°R
20°F 5°R
F = FrontR = Rear
(a) Front pitch angle = 20.
0 0.5 1 1.50
0.05
0.1
0.15
0.2
Tip speed ratio, TSR
Coe
ffici
ent o
f pow
er, C
P
25°F 25°R
25°F 20°R
25°F 15°R
25°F 10°R
F = FrontR = Rear
(b) Front pitch angle = 25.
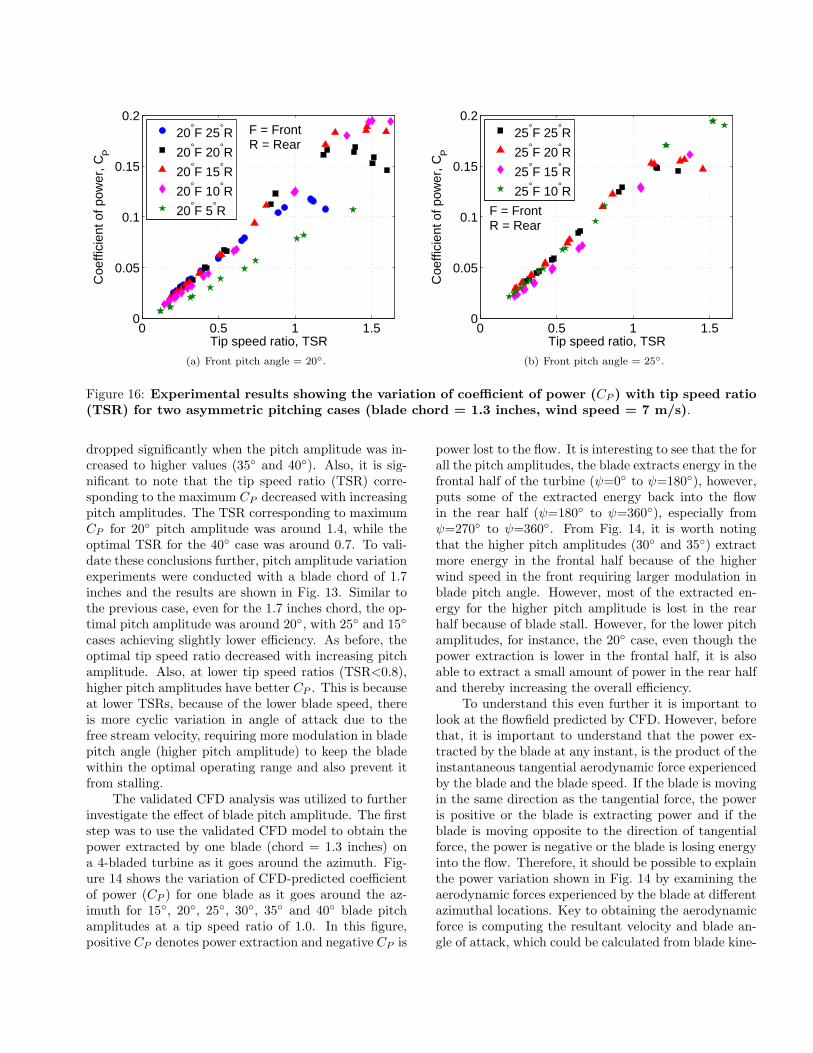
Figure 16: Experimental results showing the variation of coefficient of power (CP ) with tip speed ratio(TSR) for two asymmetric pitching cases (blade chord = 1.3 inches, wind speed = 7 m/s).
dropped significantly when the pitch amplitude was in-creased to higher values (35 and 40). Also, it is sig-nificant to note that the tip speed ratio (TSR) corre-sponding to the maximum CP decreased with increasingpitch amplitudes. The TSR corresponding to maximumCP for 20 pitch amplitude was around 1.4, while theoptimal TSR for the 40 case was around 0.7. To vali-date these conclusions further, pitch amplitude variationexperiments were conducted with a blade chord of 1.7inches and the results are shown in Fig. 13. Similar tothe previous case, even for the 1.7 inches chord, the op-timal pitch amplitude was around 20, with 25 and 15
cases achieving slightly lower efficiency. As before, theoptimal tip speed ratio decreased with increasing pitchamplitude. Also, at lower tip speed ratios (TSR<0.8),higher pitch amplitudes have better CP . This is becauseat lower TSRs, because of the lower blade speed, thereis more cyclic variation in angle of attack due to thefree stream velocity, requiring more modulation in bladepitch angle (higher pitch amplitude) to keep the bladewithin the optimal operating range and also prevent itfrom stalling.
The validated CFD analysis was utilized to furtherinvestigate the effect of blade pitch amplitude. The firststep was to use the validated CFD model to obtain thepower extracted by one blade (chord = 1.3 inches) ona 4-bladed turbine as it goes around the azimuth. Fig-ure 14 shows the variation of CFD-predicted coefficientof power (CP ) for one blade as it goes around the az-imuth for 15, 20, 25, 30, 35 and 40 blade pitchamplitudes at a tip speed ratio of 1.0. In this figure,positive CP denotes power extraction and negative CP is
power lost to the flow. It is interesting to see that the forall the pitch amplitudes, the blade extracts energy in thefrontal half of the turbine (ψ=0 to ψ=180), however,puts some of the extracted energy back into the flowin the rear half (ψ=180 to ψ=360), especially fromψ=270 to ψ=360. From Fig. 14, it is worth notingthat the higher pitch amplitudes (30 and 35) extractmore energy in the frontal half because of the higherwind speed in the front requiring larger modulation inblade pitch angle. However, most of the extracted en-ergy for the higher pitch amplitude is lost in the rearhalf because of blade stall. However, for the lower pitchamplitudes, for instance, the 20 case, even though thepower extraction is lower in the frontal half, it is alsoable to extract a small amount of power in the rear halfand thereby increasing the overall efficiency.
To understand this even further it is important tolook at the flowfield predicted by CFD. However, beforethat, it is important to understand that the power ex-tracted by the blade at any instant, is the product of theinstantaneous tangential aerodynamic force experiencedby the blade and the blade speed. If the blade is movingin the same direction as the tangential force, the poweris positive or the blade is extracting power and if theblade is moving opposite to the direction of tangentialforce, the power is negative or the blade is losing energyinto the flow. Therefore, it should be possible to explainthe power variation shown in Fig. 14 by examining theaerodynamic forces experienced by the blade at differentazimuthal locations. Key to obtaining the aerodynamicforce is computing the resultant velocity and blade an-gle of attack, which could be calculated from blade kine-
0 90 180 270 360−0.1
−0.05
0
0.05
0.1
0.15
0.2
0.25
Azimuthal location, ψ (deg)
Coe
ffici
ent o
f pow
er, C
P
20°F 10°R
20°F 25°RF = FrontR = Rear
Power extractedfrom flow
Power lostto flow
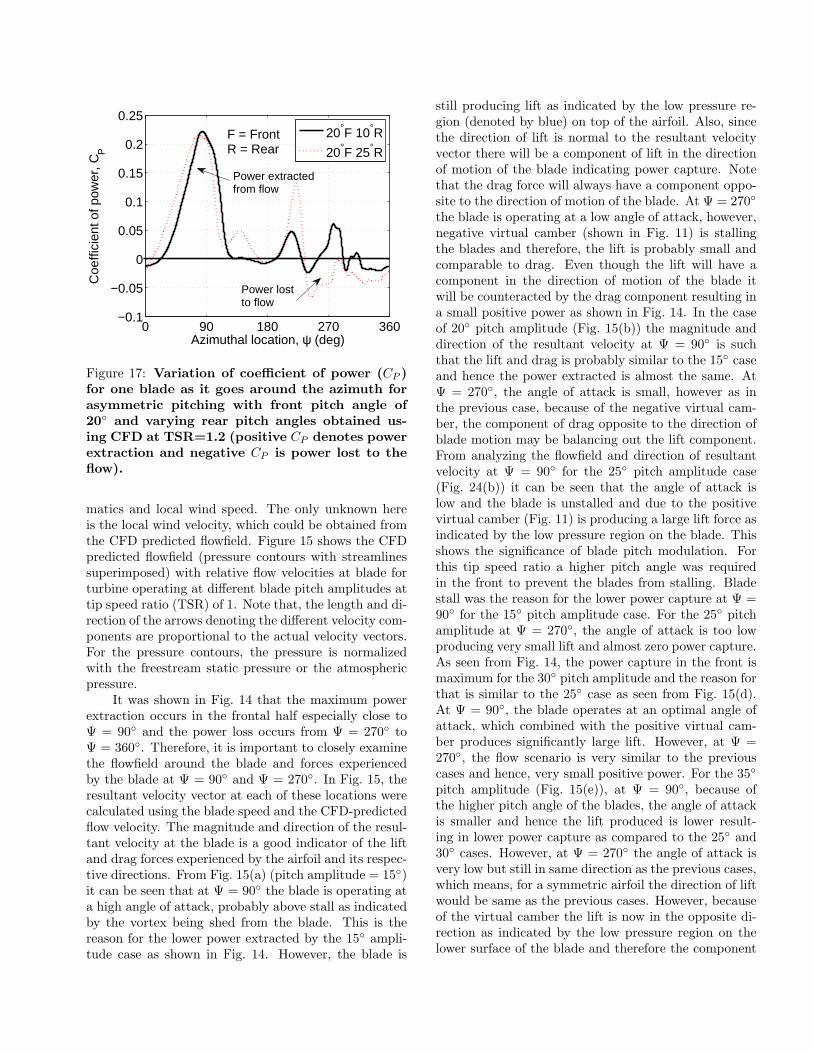
Figure 17: Variation of coefficient of power (CP )for one blade as it goes around the azimuth forasymmetric pitching with front pitch angle of20 and varying rear pitch angles obtained us-ing CFD at TSR=1.2 (positive CP denotes powerextraction and negative CP is power lost to theflow).
matics and local wind speed. The only unknown hereis the local wind velocity, which could be obtained fromthe CFD predicted flowfield. Figure 15 shows the CFDpredicted flowfield (pressure contours with streamlinessuperimposed) with relative flow velocities at blade forturbine operating at different blade pitch amplitudes attip speed ratio (TSR) of 1. Note that, the length and di-rection of the arrows denoting the different velocity com-ponents are proportional to the actual velocity vectors.For the pressure contours, the pressure is normalizedwith the freestream static pressure or the atmosphericpressure.
It was shown in Fig. 14 that the maximum powerextraction occurs in the frontal half especially close toΨ = 90 and the power loss occurs from Ψ = 270 toΨ = 360. Therefore, it is important to closely examinethe flowfield around the blade and forces experiencedby the blade at Ψ = 90 and Ψ = 270. In Fig. 15, theresultant velocity vector at each of these locations werecalculated using the blade speed and the CFD-predictedflow velocity. The magnitude and direction of the resul-tant velocity at the blade is a good indicator of the liftand drag forces experienced by the airfoil and its respec-tive directions. From Fig. 15(a) (pitch amplitude = 15)it can be seen that at Ψ = 90 the blade is operating ata high angle of attack, probably above stall as indicatedby the vortex being shed from the blade. This is thereason for the lower power extracted by the 15 ampli-tude case as shown in Fig. 14. However, the blade is
still producing lift as indicated by the low pressure re-gion (denoted by blue) on top of the airfoil. Also, sincethe direction of lift is normal to the resultant velocityvector there will be a component of lift in the directionof motion of the blade indicating power capture. Notethat the drag force will always have a component oppo-site to the direction of motion of the blade. At Ψ = 270
the blade is operating at a low angle of attack, however,negative virtual camber (shown in Fig. 11) is stallingthe blades and therefore, the lift is probably small andcomparable to drag. Even though the lift will have acomponent in the direction of motion of the blade itwill be counteracted by the drag component resulting ina small positive power as shown in Fig. 14. In the caseof 20 pitch amplitude (Fig. 15(b)) the magnitude anddirection of the resultant velocity at Ψ = 90 is suchthat the lift and drag is probably similar to the 15 caseand hence the power extracted is almost the same. AtΨ = 270, the angle of attack is small, however as inthe previous case, because of the negative virtual cam-ber, the component of drag opposite to the direction ofblade motion may be balancing out the lift component.From analyzing the flowfield and direction of resultantvelocity at Ψ = 90 for the 25 pitch amplitude case(Fig. 24(b)) it can be seen that the angle of attack islow and the blade is unstalled and due to the positivevirtual camber (Fig. 11) is producing a large lift force asindicated by the low pressure region on the blade. Thisshows the significance of blade pitch modulation. Forthis tip speed ratio a higher pitch angle was requiredin the front to prevent the blades from stalling. Bladestall was the reason for the lower power capture at Ψ =90 for the 15 pitch amplitude case. For the 25 pitchamplitude at Ψ = 270, the angle of attack is too lowproducing very small lift and almost zero power capture.As seen from Fig. 14, the power capture in the front ismaximum for the 30 pitch amplitude and the reason forthat is similar to the 25 case as seen from Fig. 15(d).At Ψ = 90, the blade operates at an optimal angle ofattack, which combined with the positive virtual cam-ber produces significantly large lift. However, at Ψ =270, the flow scenario is very similar to the previouscases and hence, very small positive power. For the 35
pitch amplitude (Fig. 15(e)), at Ψ = 90, because ofthe higher pitch angle of the blades, the angle of attackis smaller and hence the lift produced is lower result-ing in lower power capture as compared to the 25 and30 cases. However, at Ψ = 270 the angle of attack isvery low but still in same direction as the previous cases,which means, for a symmetric airfoil the direction of liftwould be same as the previous cases. However, becauseof the virtual camber the lift is now in the opposite di-rection as indicated by the low pressure region on thelower surface of the blade and therefore the component
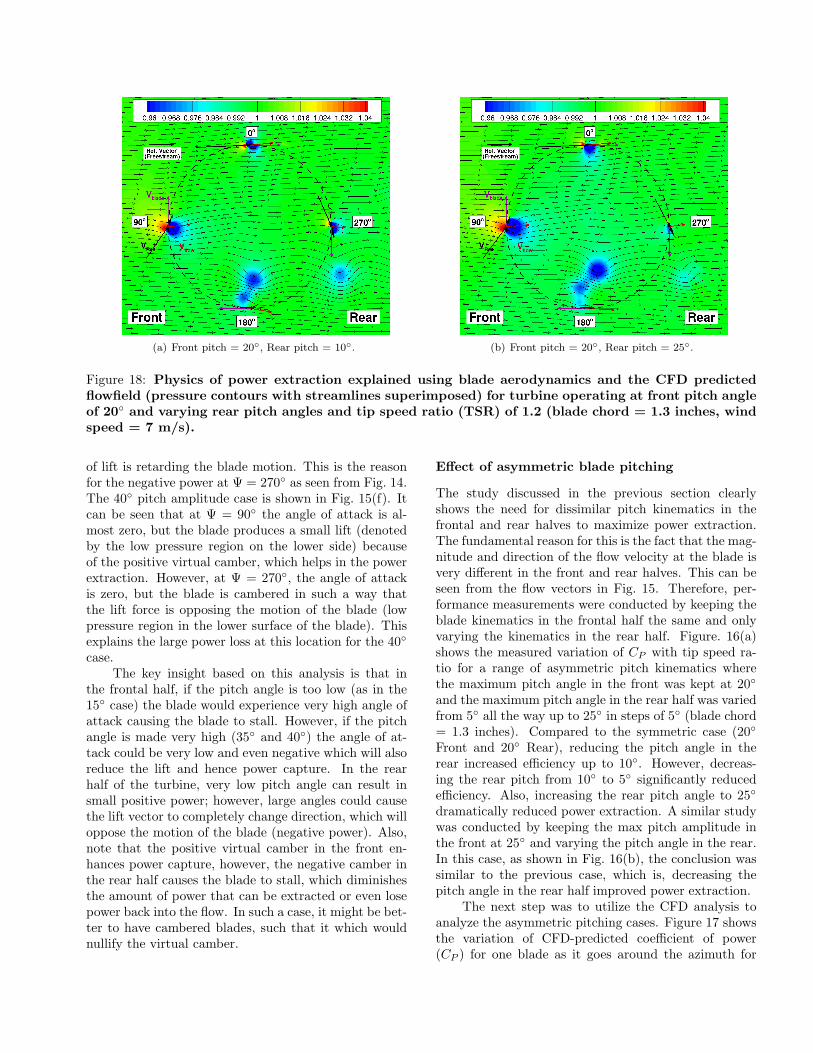
(a) Front pitch = 20, Rear pitch = 10. (b) Front pitch = 20, Rear pitch = 25.
Figure 18: Physics of power extraction explained using blade aerodynamics and the CFD predictedflowfield (pressure contours with streamlines superimposed) for turbine operating at front pitch angleof 20 and varying rear pitch angles and tip speed ratio (TSR) of 1.2 (blade chord = 1.3 inches, windspeed = 7 m/s).
of lift is retarding the blade motion. This is the reasonfor the negative power at Ψ = 270 as seen from Fig. 14.The 40 pitch amplitude case is shown in Fig. 15(f). Itcan be seen that at Ψ = 90 the angle of attack is al-most zero, but the blade produces a small lift (denotedby the low pressure region on the lower side) becauseof the positive virtual camber, which helps in the powerextraction. However, at Ψ = 270, the angle of attackis zero, but the blade is cambered in such a way thatthe lift force is opposing the motion of the blade (lowpressure region in the lower surface of the blade). Thisexplains the large power loss at this location for the 40
case.The key insight based on this analysis is that in
the frontal half, if the pitch angle is too low (as in the15 case) the blade would experience very high angle ofattack causing the blade to stall. However, if the pitchangle is made very high (35 and 40) the angle of at-tack could be very low and even negative which will alsoreduce the lift and hence power capture. In the rearhalf of the turbine, very low pitch angle can result insmall positive power; however, large angles could causethe lift vector to completely change direction, which willoppose the motion of the blade (negative power). Also,note that the positive virtual camber in the front en-hances power capture, however, the negative camber inthe rear half causes the blade to stall, which diminishesthe amount of power that can be extracted or even losepower back into the flow. In such a case, it might be bet-ter to have cambered blades, such that it which wouldnullify the virtual camber.
Effect of asymmetric blade pitching
The study discussed in the previous section clearlyshows the need for dissimilar pitch kinematics in thefrontal and rear halves to maximize power extraction.The fundamental reason for this is the fact that the mag-nitude and direction of the flow velocity at the blade isvery different in the front and rear halves. This can beseen from the flow vectors in Fig. 15. Therefore, per-formance measurements were conducted by keeping theblade kinematics in the frontal half the same and onlyvarying the kinematics in the rear half. Figure. 16(a)shows the measured variation of CP with tip speed ra-tio for a range of asymmetric pitch kinematics wherethe maximum pitch angle in the front was kept at 20
and the maximum pitch angle in the rear half was variedfrom 5 all the way up to 25 in steps of 5 (blade chord= 1.3 inches). Compared to the symmetric case (20
Front and 20 Rear), reducing the pitch angle in therear increased efficiency up to 10. However, decreas-ing the rear pitch from 10 to 5 significantly reducedefficiency. Also, increasing the rear pitch angle to 25
dramatically reduced power extraction. A similar studywas conducted by keeping the max pitch amplitude inthe front at 25 and varying the pitch angle in the rear.In this case, as shown in Fig. 16(b), the conclusion wassimilar to the previous case, which is, decreasing thepitch angle in the rear half improved power extraction.
The next step was to utilize the CFD analysis toanalyze the asymmetric pitching cases. Figure 17 showsthe variation of CFD-predicted coefficient of power(CP ) for one blade as it goes around the azimuth for
0 0.5 1 1.50
0.05
0.1
0.15
0.2
Tip speed ratio, TSR
Coe
ffici
ent o
f pow
er, C
P
−10°
0°
+5°
+10°
+20°
+/− Phasing
(a) Blade pitch amplitude = 15.
0 0.5 1 1.50
0.05
0.1
0.15
0.2
Tip speed ratio, TSR
Coe
ffici
ent o
f pow
er, C
P
−10°
0°
+5°
+10°
+20°
+/− Phasing
(b) Blade pitch amplitude = 20.
0 0.5 1 1.50
0.05
0.1
0.15
0.2
Tip speed ratio, TSR
Coe
ffici
ent o
f pow
er, C
P
−10°
0°
+5°
+10°
+20°
+/− Phasing
(c) Blade pitch amplitude = 25.
0 0.5 1 1.50
0.05
0.1
0.15
0.2
Tip speed ratio, TSR
Coe
ffici
ent o
f pow
er, C
P
−10°
0°
+5°
+10°
+20°
+/− Phasing
(d) Blade pitch amplitude = 30.
0 0.5 1 1.50
0.05
0.1
0.15
0.2
Tip speed ratio, TSR
Coe
ffici
ent o
f pow
er, C
P
−10°
0°
+5°
+10°
+20°
+/− Phasing
(e) Blade pitch amplitude = 35.
0 0.5 1 1.50
0.05
0.1
0.15
0.2
Tip speed ratio, TSR
Coe
ffici
ent o
f pow
er, C
P
−10°
0°
+5°
+10°
+20°
+/− Phasing
(f) Blade pitch amplitude = 40.
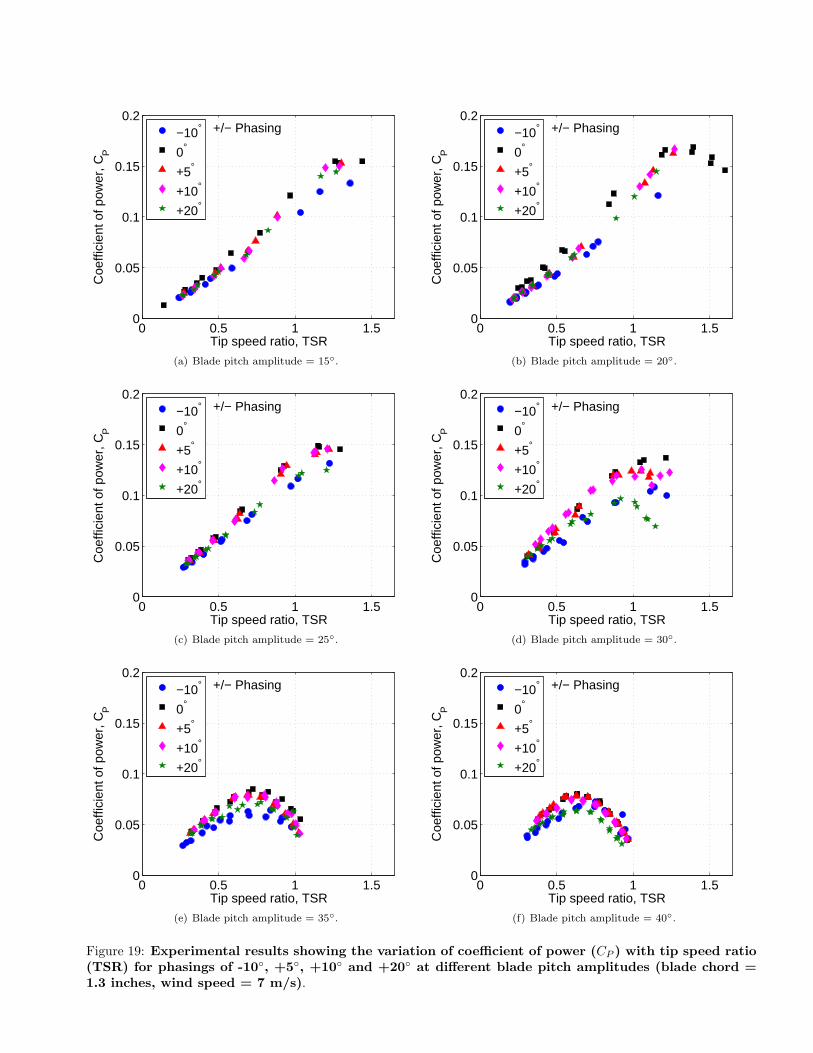
Figure 19: Experimental results showing the variation of coefficient of power (CP ) with tip speed ratio(TSR) for phasings of -10, +5, +10 and +20 at different blade pitch amplitudes (blade chord =1.3 inches, wind speed = 7 m/s).
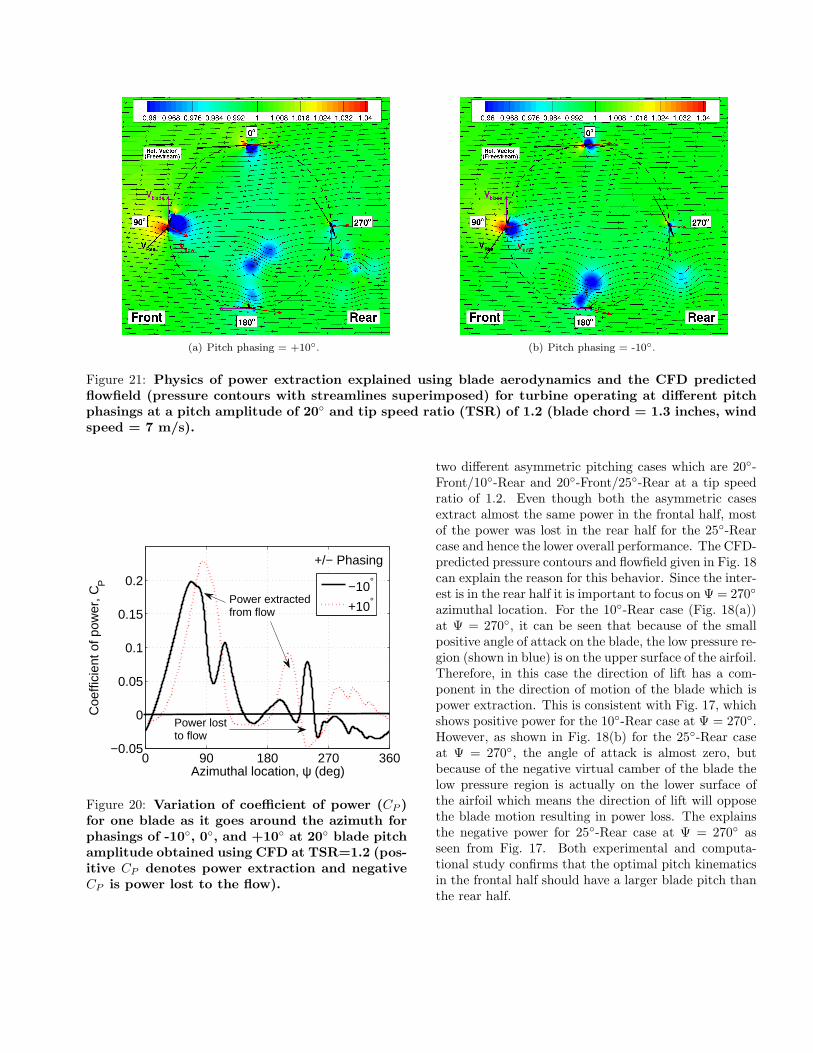
(a) Pitch phasing = +10. (b) Pitch phasing = -10.
Figure 21: Physics of power extraction explained using blade aerodynamics and the CFD predictedflowfield (pressure contours with streamlines superimposed) for turbine operating at different pitchphasings at a pitch amplitude of 20 and tip speed ratio (TSR) of 1.2 (blade chord = 1.3 inches, windspeed = 7 m/s).
0 90 180 270 360−0.05
0
0.05
0.1
0.15
0.2
Azimuthal location, ψ (deg)
Coe
ffici
ent o
f pow
er, C
P
−10°
+10°
+/− Phasing
Power extractedfrom flow
Power lostto flow
Figure 20: Variation of coefficient of power (CP )for one blade as it goes around the azimuth forphasings of -10, 0, and +10 at 20 blade pitchamplitude obtained using CFD at TSR=1.2 (pos-itive CP denotes power extraction and negativeCP is power lost to the flow).
two different asymmetric pitching cases which are 20-Front/10-Rear and 20-Front/25-Rear at a tip speedratio of 1.2. Even though both the asymmetric casesextract almost the same power in the frontal half, mostof the power was lost in the rear half for the 25-Rearcase and hence the lower overall performance. The CFD-predicted pressure contours and flowfield given in Fig. 18can explain the reason for this behavior. Since the inter-est is in the rear half it is important to focus on Ψ = 270
azimuthal location. For the 10-Rear case (Fig. 18(a))at Ψ = 270, it can be seen that because of the smallpositive angle of attack on the blade, the low pressure re-gion (shown in blue) is on the upper surface of the airfoil.Therefore, in this case the direction of lift has a com-ponent in the direction of motion of the blade which ispower extraction. This is consistent with Fig. 17, whichshows positive power for the 10-Rear case at Ψ = 270.However, as shown in Fig. 18(b) for the 25-Rear caseat Ψ = 270, the angle of attack is almost zero, butbecause of the negative virtual camber of the blade thelow pressure region is actually on the lower surface ofthe airfoil which means the direction of lift will opposethe blade motion resulting in power loss. The explainsthe negative power for 25-Rear case at Ψ = 270 asseen from Fig. 17. Both experimental and computa-tional study confirms that the optimal pitch kinematicsin the frontal half should have a larger blade pitch thanthe rear half.
0 0.5 1 1.50
0.05
0.1
0.15
0.2
Tip speed ratio, TSR
Coe
ffici
ent o
f pow
er, C
P
1.7 inch1.3 inch
Blade chord
(a) Blade pitch amplitude = 15.
0 0.5 1 1.50
0.05
0.1
0.15
0.2
Tip speed ratio, TSR
Coe
ffici
ent o
f pow
er, C
P
1.7 inch1.3 inch
Blade chord
(b) Blade pitch amplitude = 20.
0 0.5 1 1.50
0.05
0.1
0.15
0.2
Tip speed ratio, TSR
Coe
ffici
ent o
f pow
er, C
P
1.7 inch1.3 inch
Blade chord
(c) Blade pitch amplitude = 25.
0 0.5 1 1.50
0.05
0.1
0.15
0.2
Tip speed ratio, TSR
Coe
ffici
ent o
f pow
er, C
P
1.7 inch1.3 inch
Blade chord
(d) Blade pitch amplitude = 30.
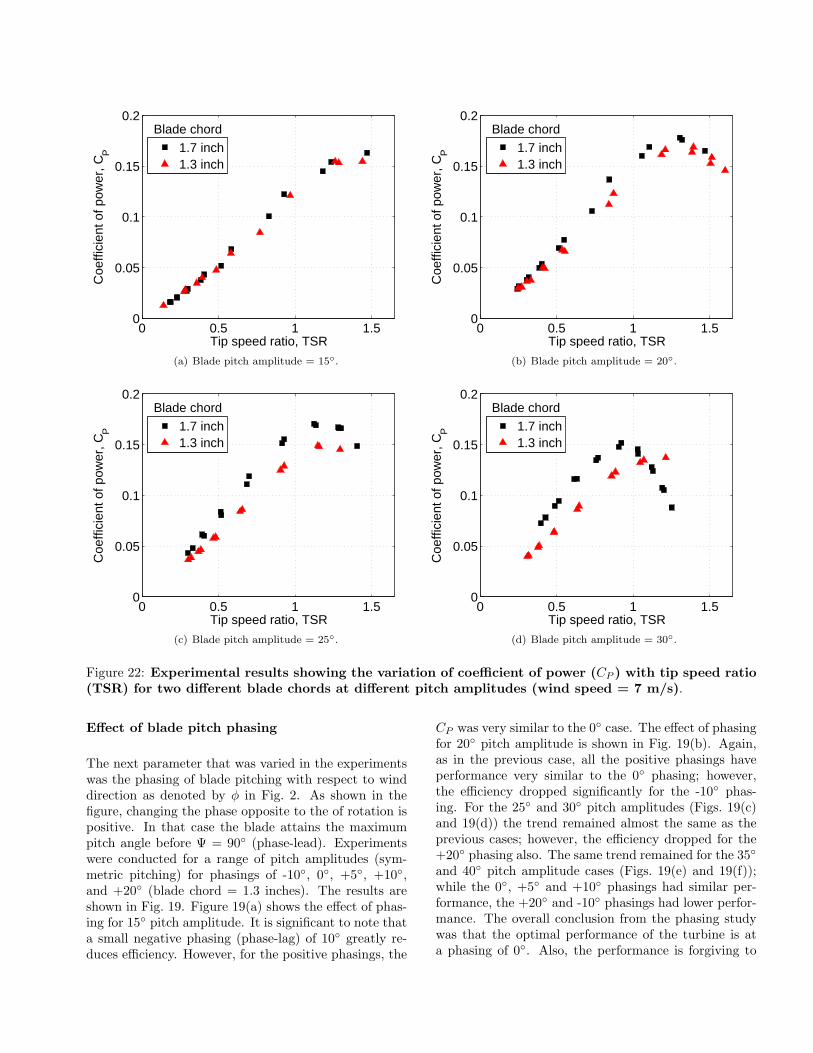
Figure 22: Experimental results showing the variation of coefficient of power (CP ) with tip speed ratio(TSR) for two different blade chords at different pitch amplitudes (wind speed = 7 m/s).
Effect of blade pitch phasing
The next parameter that was varied in the experimentswas the phasing of blade pitching with respect to winddirection as denoted by ϕ in Fig. 2. As shown in thefigure, changing the phase opposite to the of rotation ispositive. In that case the blade attains the maximumpitch angle before Ψ = 90 (phase-lead). Experimentswere conducted for a range of pitch amplitudes (sym-metric pitching) for phasings of -10, 0, +5, +10,and +20 (blade chord = 1.3 inches). The results areshown in Fig. 19. Figure 19(a) shows the effect of phas-ing for 15 pitch amplitude. It is significant to note thata small negative phasing (phase-lag) of 10 greatly re-duces efficiency. However, for the positive phasings, the
CP was very similar to the 0 case. The effect of phasingfor 20 pitch amplitude is shown in Fig. 19(b). Again,as in the previous case, all the positive phasings haveperformance very similar to the 0 phasing; however,the efficiency dropped significantly for the -10 phas-ing. For the 25 and 30 pitch amplitudes (Figs. 19(c)and 19(d)) the trend remained almost the same as theprevious cases; however, the efficiency dropped for the+20 phasing also. The same trend remained for the 35
and 40 pitch amplitude cases (Figs. 19(e) and 19(f));while the 0, +5 and +10 phasings had similar per-formance, the +20 and -10 phasings had lower perfor-mance. The overall conclusion from the phasing studywas that the optimal performance of the turbine is ata phasing of 0. Also, the performance is forgiving to
0 90 180 270 360−0.05
0
0.05
0.1
0.15
0.2
0.25
Azimuthal location, ψ (deg)
Coe
ffici
ent o
f pow
er, C
P
1.7 inch1.3 inch
Blade chord
Power lost to flow
Power extractedfrom flow
Rear halfFront half
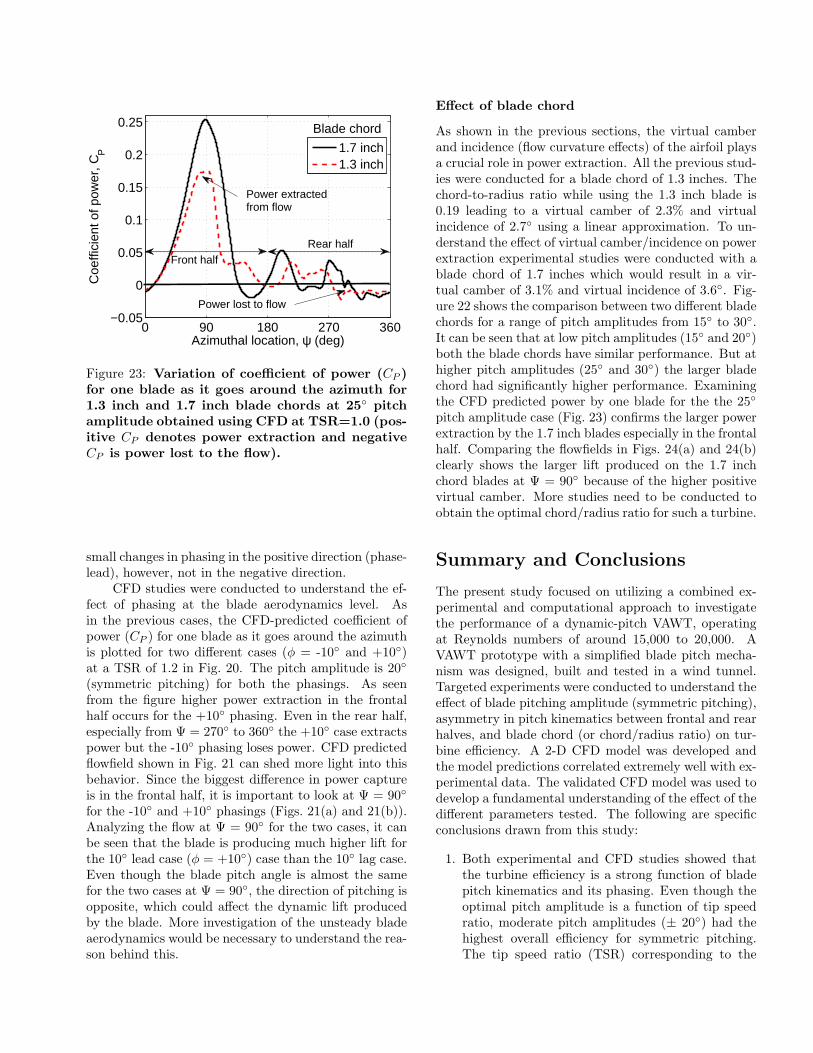
Figure 23: Variation of coefficient of power (CP )for one blade as it goes around the azimuth for1.3 inch and 1.7 inch blade chords at 25 pitchamplitude obtained using CFD at TSR=1.0 (pos-itive CP denotes power extraction and negativeCP is power lost to the flow).
small changes in phasing in the positive direction (phase-lead), however, not in the negative direction.
CFD studies were conducted to understand the ef-fect of phasing at the blade aerodynamics level. Asin the previous cases, the CFD-predicted coefficient ofpower (CP ) for one blade as it goes around the azimuthis plotted for two different cases (ϕ = -10 and +10)at a TSR of 1.2 in Fig. 20. The pitch amplitude is 20
(symmetric pitching) for both the phasings. As seenfrom the figure higher power extraction in the frontalhalf occurs for the +10 phasing. Even in the rear half,especially from Ψ = 270 to 360 the +10 case extractspower but the -10 phasing loses power. CFD predictedflowfield shown in Fig. 21 can shed more light into thisbehavior. Since the biggest difference in power captureis in the frontal half, it is important to look at Ψ = 90
for the -10 and +10 phasings (Figs. 21(a) and 21(b)).Analyzing the flow at Ψ = 90 for the two cases, it canbe seen that the blade is producing much higher lift forthe 10 lead case (ϕ = +10) case than the 10 lag case.Even though the blade pitch angle is almost the samefor the two cases at Ψ = 90, the direction of pitching isopposite, which could affect the dynamic lift producedby the blade. More investigation of the unsteady bladeaerodynamics would be necessary to understand the rea-son behind this.
Effect of blade chord
As shown in the previous sections, the virtual camberand incidence (flow curvature effects) of the airfoil playsa crucial role in power extraction. All the previous stud-ies were conducted for a blade chord of 1.3 inches. Thechord-to-radius ratio while using the 1.3 inch blade is0.19 leading to a virtual camber of 2.3% and virtualincidence of 2.7 using a linear approximation. To un-derstand the effect of virtual camber/incidence on powerextraction experimental studies were conducted with ablade chord of 1.7 inches which would result in a vir-tual camber of 3.1% and virtual incidence of 3.6. Fig-ure 22 shows the comparison between two different bladechords for a range of pitch amplitudes from 15 to 30.It can be seen that at low pitch amplitudes (15 and 20)both the blade chords have similar performance. But athigher pitch amplitudes (25 and 30) the larger bladechord had significantly higher performance. Examiningthe CFD predicted power by one blade for the the 25
pitch amplitude case (Fig. 23) confirms the larger powerextraction by the 1.7 inch blades especially in the frontalhalf. Comparing the flowfields in Figs. 24(a) and 24(b)clearly shows the larger lift produced on the 1.7 inchchord blades at Ψ = 90 because of the higher positivevirtual camber. More studies need to be conducted toobtain the optimal chord/radius ratio for such a turbine.
Summary and Conclusions
The present study focused on utilizing a combined ex-perimental and computational approach to investigatethe performance of a dynamic-pitch VAWT, operatingat Reynolds numbers of around 15,000 to 20,000. AVAWT prototype with a simplified blade pitch mecha-nism was designed, built and tested in a wind tunnel.Targeted experiments were conducted to understand theeffect of blade pitching amplitude (symmetric pitching),asymmetry in pitch kinematics between frontal and rearhalves, and blade chord (or chord/radius ratio) on tur-bine efficiency. A 2-D CFD model was developed andthe model predictions correlated extremely well with ex-perimental data. The validated CFD model was used todevelop a fundamental understanding of the effect of thedifferent parameters tested. The following are specificconclusions drawn from this study:
1. Both experimental and CFD studies showed thatthe turbine efficiency is a strong function of bladepitch kinematics and its phasing. Even though theoptimal pitch amplitude is a function of tip speedratio, moderate pitch amplitudes (± 20) had thehighest overall efficiency for symmetric pitching.The tip speed ratio (TSR) corresponding to the
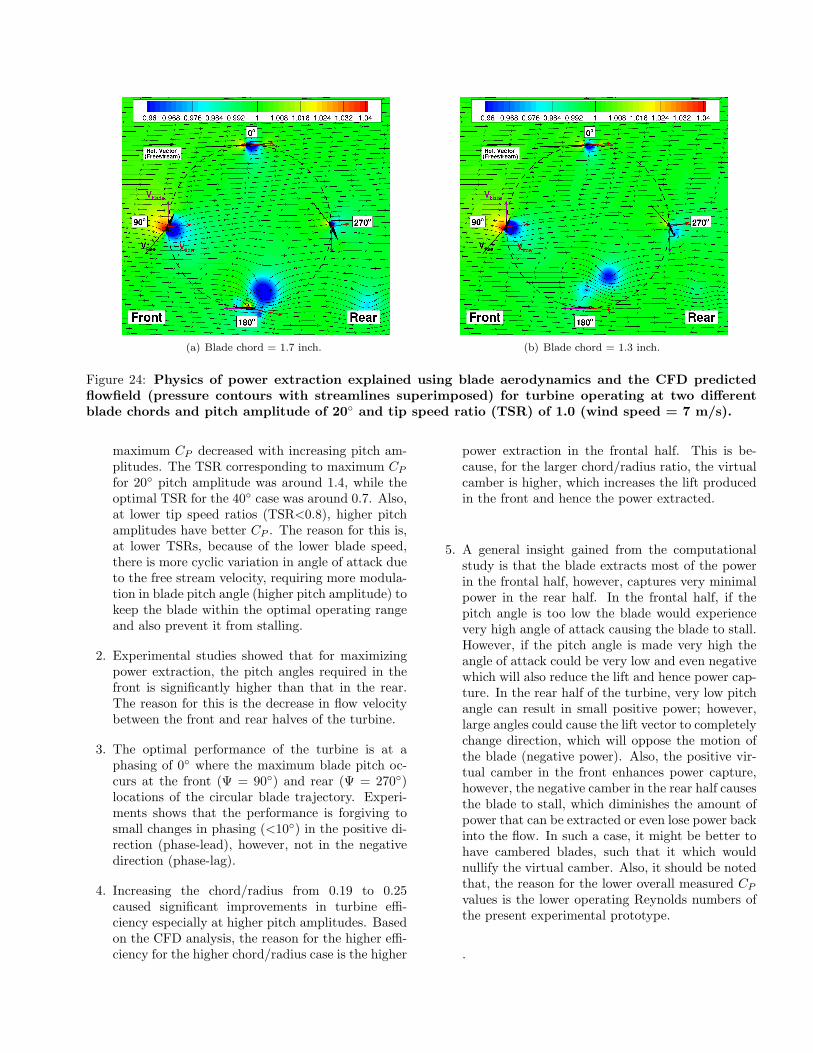
(a) Blade chord = 1.7 inch. (b) Blade chord = 1.3 inch.
Figure 24: Physics of power extraction explained using blade aerodynamics and the CFD predictedflowfield (pressure contours with streamlines superimposed) for turbine operating at two differentblade chords and pitch amplitude of 20 and tip speed ratio (TSR) of 1.0 (wind speed = 7 m/s).
maximum CP decreased with increasing pitch am-plitudes. The TSR corresponding to maximum CP
for 20 pitch amplitude was around 1.4, while theoptimal TSR for the 40 case was around 0.7. Also,at lower tip speed ratios (TSR<0.8), higher pitchamplitudes have better CP . The reason for this is,at lower TSRs, because of the lower blade speed,there is more cyclic variation in angle of attack dueto the free stream velocity, requiring more modula-tion in blade pitch angle (higher pitch amplitude) tokeep the blade within the optimal operating rangeand also prevent it from stalling.
2. Experimental studies showed that for maximizingpower extraction, the pitch angles required in thefront is significantly higher than that in the rear.The reason for this is the decrease in flow velocitybetween the front and rear halves of the turbine.
3. The optimal performance of the turbine is at aphasing of 0 where the maximum blade pitch oc-curs at the front (Ψ = 90) and rear (Ψ = 270)locations of the circular blade trajectory. Experi-ments shows that the performance is forgiving tosmall changes in phasing (<10) in the positive di-rection (phase-lead), however, not in the negativedirection (phase-lag).
4. Increasing the chord/radius from 0.19 to 0.25caused significant improvements in turbine effi-ciency especially at higher pitch amplitudes. Basedon the CFD analysis, the reason for the higher effi-ciency for the higher chord/radius case is the higher
power extraction in the frontal half. This is be-cause, for the larger chord/radius ratio, the virtualcamber is higher, which increases the lift producedin the front and hence the power extracted.
5. A general insight gained from the computationalstudy is that the blade extracts most of the powerin the frontal half, however, captures very minimalpower in the rear half. In the frontal half, if thepitch angle is too low the blade would experiencevery high angle of attack causing the blade to stall.However, if the pitch angle is made very high theangle of attack could be very low and even negativewhich will also reduce the lift and hence power cap-ture. In the rear half of the turbine, very low pitchangle can result in small positive power; however,large angles could cause the lift vector to completelychange direction, which will oppose the motion ofthe blade (negative power). Also, the positive vir-tual camber in the front enhances power capture,however, the negative camber in the rear half causesthe blade to stall, which diminishes the amount ofpower that can be extracted or even lose power backinto the flow. In such a case, it might be better tohave cambered blades, such that it which wouldnullify the virtual camber. Also, it should be notedthat, the reason for the lower overall measured CP
values is the lower operating Reynolds numbers ofthe present experimental prototype.
.
REFERENCES
[1] Kirke, B. K., “Evaluation of Self-Starting Verti-cal Axis Wind Turbines For Stand-Alone Applica-tions,” Ph.D Thesis, School of Engineering, GriffithUniversity Gold Coast Campus, April 1998.
[2] Dabiri, J. O., “Potential order-of-magnitude en-hancement of wind farm power density via counter-rotating vertical-axis wind turbine arrays,” Journalof Renewable and Sustainable Energy, Vol. 3, 2011,pp. 043104-1 – 043104-12.
[3] McGowan, R., Lozano, R., Raghav, V., andKomerath, N., ”Vertical Axis Micro Wind TurbineDesign for Low Tip Speed Ratios, “Proceedings ofthe 3rd International Multi-Conference on Com-plexity, Informatics and Cybernetics,” Orlando,FL, March 25 – 28, 2012.
[4] Parashivoiu, I., and Delclaux, F., “Double Multi-ple Streamtube Model with Recent Improvements,”Journal of Energy, Vol. 7, No. 3, May – June 1983,pp. 250 – 255.
[5] Parashivoiu, I., Trifu, O., and Saeed, F., “H-Darrieus Wind Turbine with Blade Pitch Control,”International Journal of Rotating Machinery, Vol.2009, 2009, pp. 1 – 7.
[6] Asher, I. M., Drela, M., and Peraire, J., “A Low Or-der Model for Vertical Axis Wind Turbines,” Pro-ceedings of the 28th AIAA Applied AerodynamicsConference, Chicago, IL, June 28 – July 1, 2010.
[7] Benedict, M., Lakshminarayan, V. K., Johnathan,P., and Chopra, I., “Fundamental Understandingof the Physics of a Small-Scale Vertical Axis WindTurbine with Dynamic Blade Pitching: An Exper-imental and Computational Approach,” Proceed-ings of the 54th AIAA/ASME/ASCE/AHS/ASCStructures, Structural Dynamics, and MaterialsConference, Boston, Massachusetts, April 8 – 11,2013.
[8] Lakshminarayan, V. K., “Computational Investi-gation of Micro-Scale Coaxial Rotor Aerodynam-ics in Hover,” Ph.D. dissertation, Department ofAerospace Engineering, University of Maryland atCollege Park, 2009.
[9] Pulliam, T., and Chaussee, D., “A Diagonal Formof an Implicit Approximate Factorization Algo-rithm,” Journal of Computational Physics, Vol. 39,(2), February 1981, pp. 347–363.
[10] Van Leer B., “Towards the Ultimate Conserva-tive Difference Scheme V. A Second-Order SequelTo Godunovs Method, Journal of ComputationalPhysics, Vol. 135, No. 2, 1997, pp. 229-248.
[11] Roe, P., “Approximate Riemann Solvers, Param-eter Vectors and Difference Schemes,” Journal ofComputational Physics, Vol. 135, No. 2, 1997, pp.250-258.
[12] Koren, B., “Multigrid and Defect Correction forthe Steady Navier-Stokes Equations”, Proceedingsof the 11th International Conference on Numeri-cal Methods in Fluid Dynamics , Willamsburg, VA,June 1988.
[13] Turkel, E., “Preconditioning Techniques in Compu-tational Fluid Dynamics,” Annual Review of FluidMechanics, Vol. 31, 1999, pp. 385–416
[14] Spalart, P. R., and Allmaras, S. R., “A One-equation Turbulence Model for AerodynamicFlows,” AIAA Paper 1992-0439, 30th AIAAAerospace Sciences Meeting and Exhibit, Reno,NV, January 6–9, 1992.
[15] Lee, Y., “On Overset Grids Connectivity and Auto-mated Vortex Tracking in Rotorcraft CFD,” Ph.D.Dissertation, Department of Aerospace Engineer-ing, University of Maryland at College Park, 2008.
[16] Migliore, P. G., Wolfe, W. P., and Fanuccif, J.B., “Flow Curvature Effects on Darrieus TurbineBlade Aerodynamics,” Journal of Energy, Vol. 4,(2), 1980, pp. 49–55
[17] Benedict, M., “Fundamental Understanding of theCycloidal-Rotor Concept for Micro Air Vehicle Ap-plications,” Ph.D Thesis, Department of AerospaceEngineering, University of Maryland College Park,December 2010.