Embed Size (px)
Citation preview
Athens Journal of Technology and Engineering - Volume 7, Issue 3, September 2020 –
Pages 185-204
https://doi.org/10.30958/ajte.7-3-2 doi=10.30958/ajte.7-3-2
Experiences on Development and Design of STACK
Problems for Circuit Analysis
By Otto Ellonen, Maarit Vesapuisto
± & Timo Vekara
‡
STACK (System for Teaching and Assessment using a Computer Algebra
Kernel) is an open-source assessment system for mathematics and related fields.
At University of Vaasa, STACK has been used in courses of Mathematics and
now it has been implemented in Electrical Engineering. This paper discusses
experiences on development and design of various Circuit Analysis problems in
STACK environment including student feedback. The starting point for
developing problems here is that they do not include much calculation; instead
the problems focus more on the representation of equations. The problems are
designed to provide essential visual assistance to the students by drawing
pictures, such as circuit diagrams by using JSXGraph library that is supported
by STACK. With the help of JSXGraph, designer can draw various geometrical
figures according to IEC 60617 standard. One important function in STACK is
that it immediately gives automated feedback to the students depending on their
answers. For this reason, a so-called potential response tree (PRT) is created
for every problem. The PRT usually consists of several nodes, which compare
whether specified conditions are fulfilled. The PRT can further be developed
into a more complex one, which examines not only frequent but even rare errors
made by students. These assets and learning tools seem to create a powerful
basis for interactive learning process, where visual aids are used in solving
Circuit Analysis problems in Moodle.
Keywords: STACK, JSXGraph, interactive learning, circuit analysis, IEC
60617.
Introduction
STACK is an open-source assessment system for mathematics and related
fields created by Chris Sangwin in University of Birmingham in early 2000s
(Sangwin 2013). The key concept of this system is to provide tools for creating
mathematical Moodle-based questions which can generate automatic feedback for
the students depending on their given answer (Moodle 2020). By using Maxima,
STACK can evaluate the given mathematical input (Maxima 2020). STACK also
supports graphical presentation of problems by utilizing JSXGraph JavaScript
library.
The goal of this paper is to examine the development process of STACK
problems in the field of Circuit Analysis at University of Vaasa. The purpose of
these problems is to help the students to understand the most basic and
Research Assistant, School of Technology and Innovations, University of Vaasa, Finland.
±Lecturer, School of Technology and Innovations, University of Vaasa, Finland.
‡Professor, School of Technology and Innovations, University of Vaasa, Finland.
Vol. 7, No. 3 Ellonen et al.: Experiences on Development and Design of…
186
fundamental parts of each given topic in the field. With the help of these questions
in addition to the course material, the students are able to solve conventional
exercises more successfully.
Background
Circuit Analysis is one of the most fundamental aspects in electrical
engineering. University of Vaasa has co-operation with Aalto University, where
professors Erkki Voipio and Martti Valtonen created during tens of years sound
basis on teaching circuit analysis exactly (Voipio 2006, Valtonen 2020). In Vaasa
our teaching continues this tradition and circuit theory is currently divided into two
courses: Circuit Analysis A and B from which the first one is held for the first-year
students in the spring and the second one is held at the beginning of the 2nd
year in
Autumn (University of Vaasa 2020). In order to successfully pass the Circuit
Analysis B, the student must have acquired the fundamental skills and knowledge
from the previous course which deals with the basics of DC and AC circuits.
During the first year the students also attend the basic calculus course which is a
prerequisite for the Circuit Analysis A and is organized during the first semester.
The Circuit Analysis A is often held up as one of the most challenging
courses by the students during the first year due to number of different reasons.
One of the reasons, which has been identified, by lecturer Maarit Vesapuisto is the
applying of the mathematical knowledge when forming equations related to
different circuit laws. It has also been noticed that some students do not draw the
complete circuit diagrams with the needed arrows at all which makes the
evaluation of their solution impossible. Others might get an answer that can
possibly be right, but instead of thinking about it, they just move to the next
problem. Another difficulty occurs when the students start experimenting with AC
circuits and must start calculating with phasors and complex numbers. As stated in
Neitola’s study (2019), the University of Oulu has had similar problems when
teaching circuit analysis (Neitola 2019).
The problems might also relate to understanding the concepts related to
electrical circuits (McDermott and Schaffer 1992). For example, the students have
difficulties in understanding the differences between current and voltage or how
either of them work. Even when the students could mathematically solve the given
problem, they would struggle with the answer when asked about the functionality
of the circuit. This leads to another problem where the students can solve complex
systems and models mathematically but fail to analyze the results they get. This
can be problematic later in the studies and working life.
It should be noted that problems related to conceptual understanding of the
basics that occur during the Circuit Analysis A should be dealt with during the
course. Any misinterpret pieces of information are carried on to the Circuit
Analysis B and will cause unwanted obstacles for the students which would make
the passing of the course harder.
It has also been suggested that lab exercises can be used to motivate students
when it comes down to learning about circuit analysis (Trajković 2011). The
Athens Journal of Technology & Engineering September 2020
187
practical work can be an eye-opening experience in some cases where the students
have been struggling to understand some of the concepts and might also find it
more ‘interesting’ than the conventional lectures and exercises. As stated in Fino
(2018) the problems arise with the increase in numbers of students attending the
course.
Another way of improving the student’s chances in learning circuit analysis in
addition to traditional lectures and exercises is the implementation of simulation
exercises. There are many different simulation programs like LTspice (Analog
Devices 2020), APLAC (Cadence 2020) or MATLAB (Attia 1995) which can be
used to enhance the students learning capabilities in circuit analysis. Student’s
skills to create equations and exact drawings for circuits are essential.
There also exist numerous helpful applications such as circuit calculators
(WolframAlpha 2020) or circuit building and simulation tools like CircuitLab
(CircuitLab 2020) or EveryCircuit (EveryCircuit 2020). These simulation tools let
the students to play with circuits interactively. Different components and their
values can be changed during runtime and the application generates visual help
like animations and plots for the user to see how the changes in values and circuit
affect the other properties like currents. Generally in circuit analysis, there are
trends towards animations, simulations and interaction, still keeping on visuality
with precise graphical drawings.
At University of Vaasa the Circuit Analysis courses include lectures with
animations, weekly exercises and simulation exercises based on APLAC. In
addition, from 2019 onwards STACK has been used during the course Circuit
Analysis A.
Developing Circuit Analysis Problems in STACK
In this section a more in-depth look is given on developing exercises in the
field of circuit theory. Earlier STACK has been used in the University of Vaasa in
mathematics (linear algebra lectured by Matti Laaksonen) and based on the
flexibility and accessibility it was chosen as the main development tool for the
circuit analysis as well. The idea was to create numerous different and simplified
problems that the students could perform and train on before trying to solve the
more complex exercises. Another important objective was to focus more on what
type of answers the students would have to give. In most cases the correct answer
was an equation instead of a numerical value i.e., no calculation was needed. This
is also the case particularly in questions regarding DC circuits in steady state as the
calculation would be trivial and easily done with a calculator if the equation is
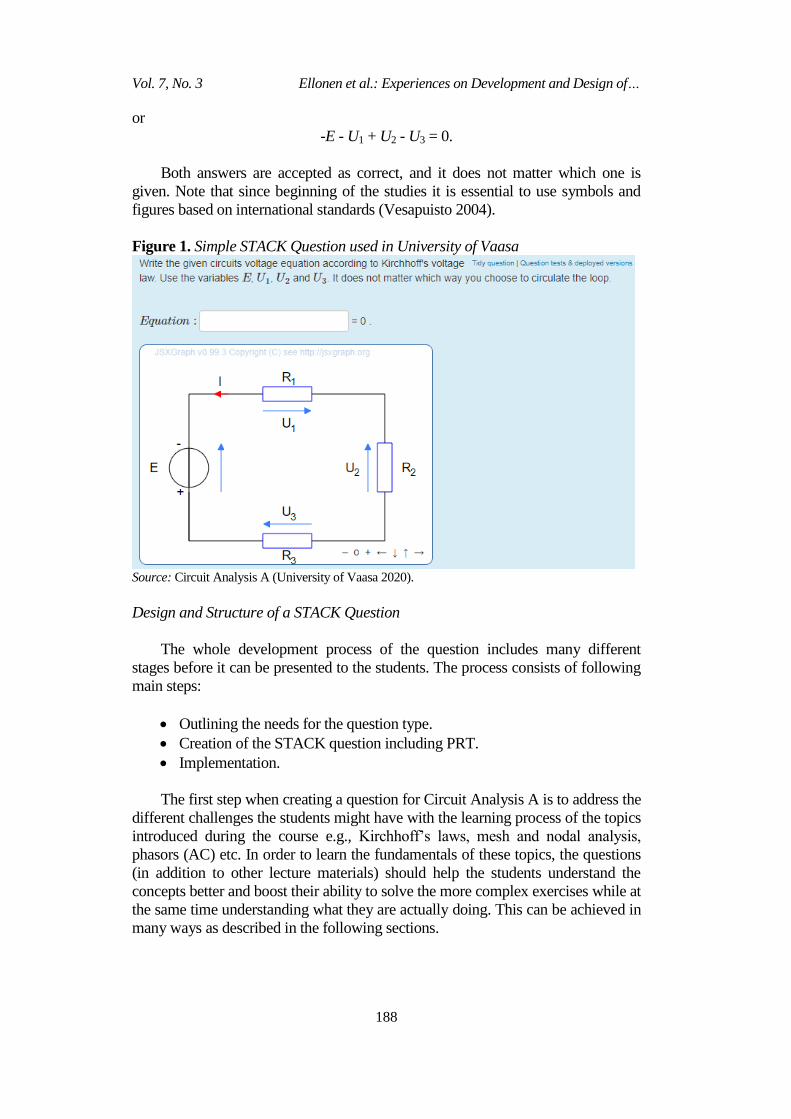
right. For example, the most basic question would ask the student the voltage
equation of a given one current loop with a voltage source and three resistors
based on Kirchhoff’s laws as seen in Figure 1. According to Kirchhoff’s voltage
law the sum of voltages around any closed loop is zero so the correct answer to the
problem in that case would be
E + U1 - U2 + U3 = 0
Vol. 7, No. 3 Ellonen et al.: Experiences on Development and Design of…
188
or
-E - U1 + U2 - U3 = 0.
Both answers are accepted as correct, and it does not matter which one is
given. Note that since beginning of the studies it is essential to use symbols and
figures based on international standards (Vesapuisto 2004).
Figure 1. Simple STACK Question used in University of Vaasa
Source: Circuit Analysis A (University of Vaasa 2020).
Design and Structure of a STACK Question
The whole development process of the question includes many different
stages before it can be presented to the students. The process consists of following
main steps:
Outlining the needs for the question type.
Creation of the STACK question including PRT.
Implementation.
The first step when creating a question for Circuit Analysis A is to address the
different challenges the students might have with the learning process of the topics
introduced during the course e.g., Kirchhoff’s laws, mesh and nodal analysis,
phasors (AC) etc. In order to learn the fundamentals of these topics, the questions
(in addition to other lecture materials) should help the students understand the
concepts better and boost their ability to solve the more complex exercises while at
the same time understanding what they are actually doing. This can be achieved in
many ways as described in the following sections.
Athens Journal of Technology & Engineering September 2020
189
Creation of a STACK Question in General
In this section a general STACK question generation process is briefly
summarized for the case of simplicity. The structure of a STACK question can be
divided into following three main parts as described by Sangwin (2013):
Question Variables.
Question Text.
Potential Response Tree.
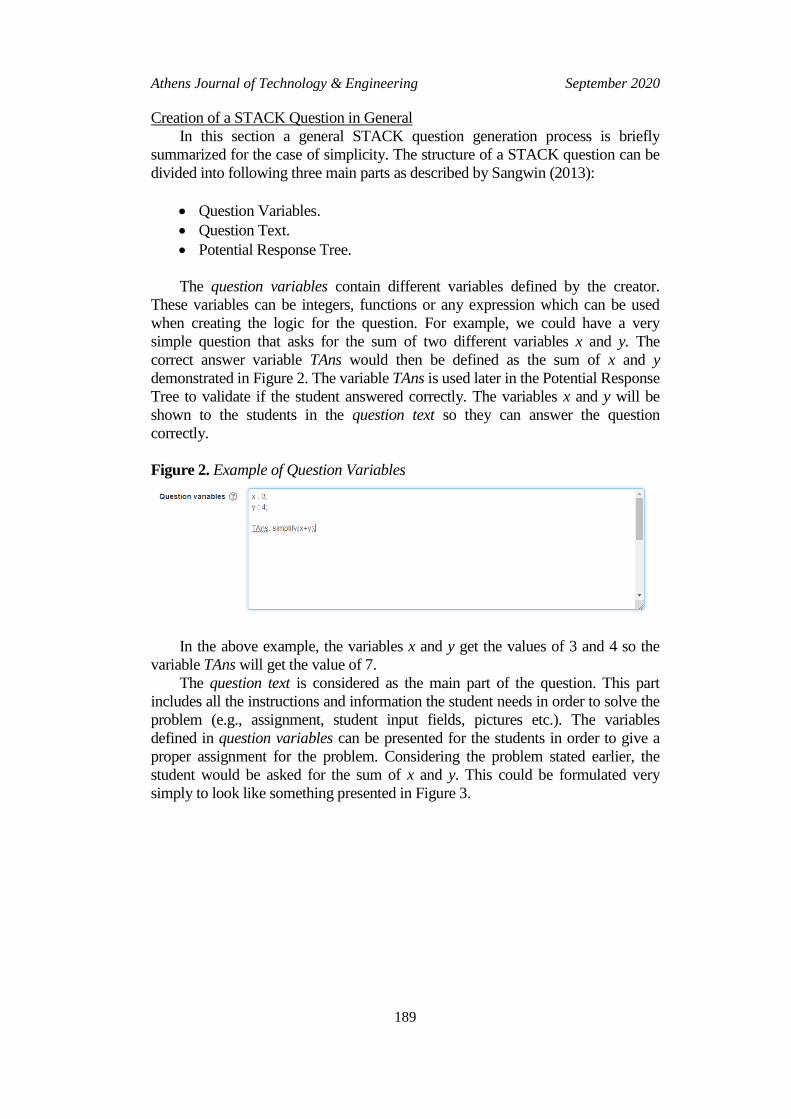
The question variables contain different variables defined by the creator.
These variables can be integers, functions or any expression which can be used
when creating the logic for the question. For example, we could have a very
simple question that asks for the sum of two different variables x and y. The
correct answer variable TAns would then be defined as the sum of x and y
demonstrated in Figure 2. The variable TAns is used later in the Potential Response
Tree to validate if the student answered correctly. The variables x and y will be
shown to the students in the question text so they can answer the question
correctly.
Figure 2. Example of Question Variables
In the above example, the variables x and y get the values of 3 and 4 so the
variable TAns will get the value of 7.
The question text is considered as the main part of the question. This part
includes all the instructions and information the student needs in order to solve the
problem (e.g., assignment, student input fields, pictures etc.). The variables
defined in question variables can be presented for the students in order to give a
proper assignment for the problem. Considering the problem stated earlier, the
student would be asked for the sum of x and y. This could be formulated very
simply to look like something presented in Figure 3.
Vol. 7, No. 3 Ellonen et al.: Experiences on Development and Design of…
190
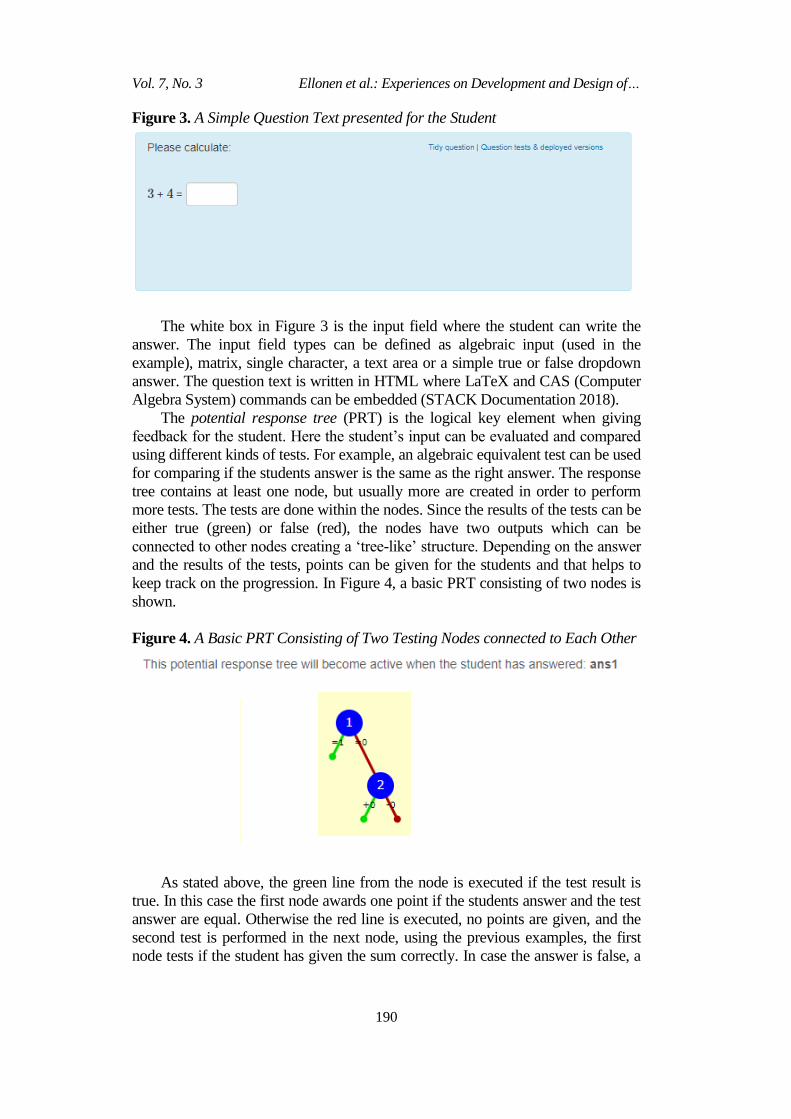
Figure 3. A Simple Question Text presented for the Student
The white box in Figure 3 is the input field where the student can write the
answer. The input field types can be defined as algebraic input (used in the
example), matrix, single character, a text area or a simple true or false dropdown
answer. The question text is written in HTML where LaTeX and CAS (Computer
Algebra System) commands can be embedded (STACK Documentation 2018).
The potential response tree (PRT) is the logical key element when giving
feedback for the student. Here the student’s input can be evaluated and compared
using different kinds of tests. For example, an algebraic equivalent test can be used
for comparing if the students answer is the same as the right answer. The response
tree contains at least one node, but usually more are created in order to perform
more tests. The tests are done within the nodes. Since the results of the tests can be
either true (green) or false (red), the nodes have two outputs which can be
connected to other nodes creating a ‘tree-like’ structure. Depending on the answer
and the results of the tests, points can be given for the students and that helps to
keep track on the progression. In Figure 4, a basic PRT consisting of two nodes is
shown.
Figure 4. A Basic PRT Consisting of Two Testing Nodes connected to Each Other
As stated above, the green line from the node is executed if the test result is
true. In this case the first node awards one point if the students answer and the test
answer are equal. Otherwise the red line is executed, no points are given, and the
second test is performed in the next node, using the previous examples, the first
node tests if the student has given the sum correctly. In case the answer is false, a
Athens Journal of Technology & Engineering September 2020
191
second test is used to further analyze what kind of an error was made. For
example, the second test checks if the student used subtraction instead of addition.
The ans1 mentioned is the input variable of the student answer.
The most important feature of the response tree is the ability to generate
feedback depending on answers given by the students. In addition to grading,
verbal and visual feedback can also be included. The most common feedback is
telling the student if the answer was correct or not. With simple problems like the
example above this short feedback might be enough. However, with more
complex problems this might not be the case. Because of this, performing more
tests with the students answer makes it possible to give more versatile and precise
feedback which helps the student to realize what was wrong.
Usage of JSXGraph in Circuit Analysis
The visualization of a problem is a crucial part when solving questions related
to circuit analysis since the problems, without few exceptions, always deal with a
given circuit. As stated earlier with the use of pre-defined pictures e.g. circuit
diagrams as components in the question text, it is possible to construct number of
arbitrary circuit problems for the students. However, there are also possibilities to
generate more sophisticated visual aids in the question.
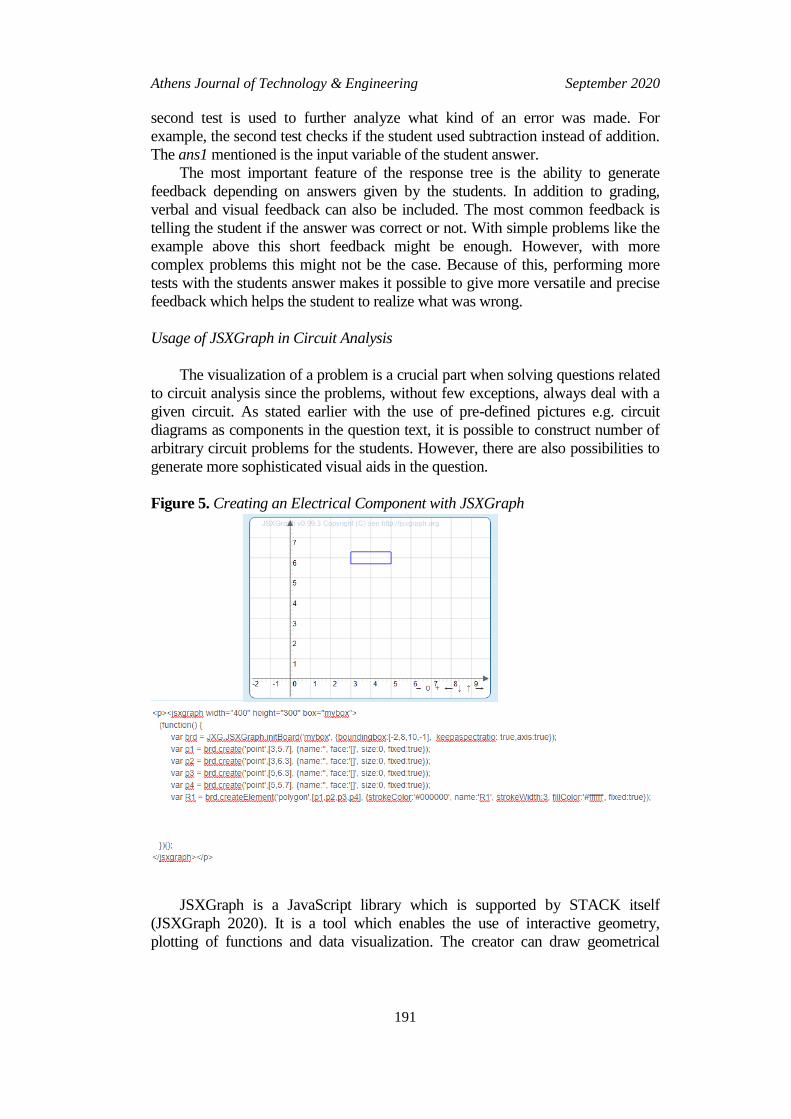
Figure 5. Creating an Electrical Component with JSXGraph
JSXGraph is a JavaScript library which is supported by STACK itself
(JSXGraph 2020). It is a tool which enables the use of interactive geometry,
plotting of functions and data visualization. The creator can draw geometrical
Vol. 7, No. 3 Ellonen et al.: Experiences on Development and Design of…
192
figures such as lines, circles, boxes, etc., on a user-defined coordinate system.
These figures are then generated when the student begins to solve the question.
Usually these are used in mathematics with problems related to geometry, but they
can also be manipulated to be used in other fields like circuit analysis. For
example, different electrical components can be generated with the use of these
geometrical figures. Consider a resistor which is shaped like a rectangle. There are
many ways to achieve this with one requiring the creator to define the corners of
the rectangle and using the ‘polyon’ element of JSXGraph which creates a
rectangle according to the coordinates of the corners. In Figure 5 the above
example with the related code is presented.
The coordinate system is printed inside the JSXGraph box whose dimensions
are defined first. The variable brd is then created to hold the information regarding
the board. Then four different points p1 – p4 are created with different coordinates
to describe the wanted component corners. Finally, the ‘polygon’ element with the
previous parameters is created. In addition, one could make use of the ‘text’
element to display the name of the component i.e., R1.
With the help of the various elements from the JSXGraph library also other
electrical components can be created. With the ‘line’ element the generated
components can be connected to each other visualizing wiring to make a proper
looking circuit shown in Figure 1. The color of the drawn elements can also be
changed to provide more visually pleasing outcome and to make it more distinct
for the students. At University of Vaasa the current arrow is usually denoted with
red and arrows used to imply voltages are blue as seen in Figure 1.
Randomization of the Circuit
To properly test the students’ knowledge on circuit theory it should be tested
with multiple unique situations and not the same ones repeatedly. On the other
hand, it would need much work to make multiple versions of the same circuit
manually with small changes and then implementing them later. For this purpose,
there is an easy solution to this: randomization of the parameters. Different
parameters and variables defined in question variables can also be randomized. As
stated, before these values can be used later in the question text section including
in the different JSXGraph elements. This means we can generate random
components in selected positions. In Figure 6 two different situations of the same
question are presented but with randomly generated components. This means that
when the student attempts the quiz one of the two situations is picked. This can be
achieved with a simple if-else statement. In this case a variable is defined in
question variables which can have two different values chosen randomly when the
code is run. The if statement simply checks which one was chosen and according
to that a component is generated. This procedure can be used for every other
component in the circuit which further adds more different versions.
Athens Journal of Technology & Engineering September 2020
193
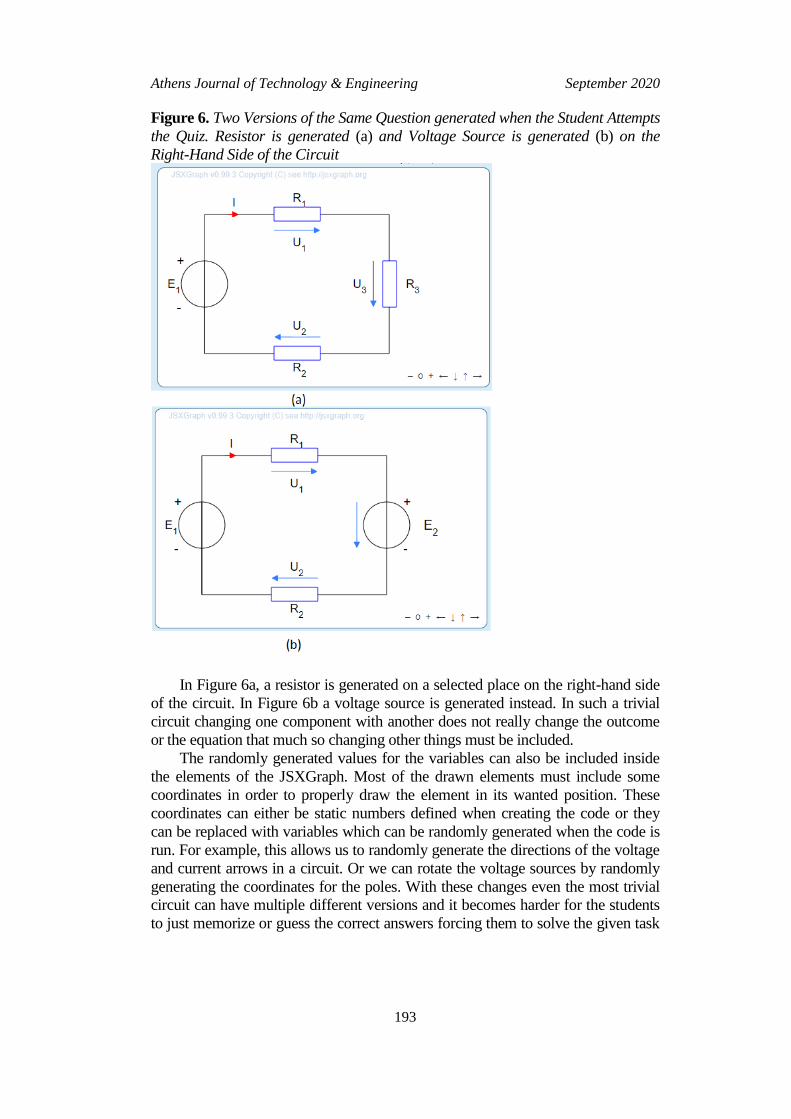
Figure 6. Two Versions of the Same Question generated when the Student Attempts
the Quiz. Resistor is generated (a) and Voltage Source is generated (b) on the
Right-Hand Side of the Circuit
In Figure 6a, a resistor is generated on a selected place on the right-hand side
of the circuit. In Figure 6b a voltage source is generated instead. In such a trivial
circuit changing one component with another does not really change the outcome
or the equation that much so changing other things must be included.
The randomly generated values for the variables can also be included inside
the elements of the JSXGraph. Most of the drawn elements must include some
coordinates in order to properly draw the element in its wanted position. These
coordinates can either be static numbers defined when creating the code or they
can be replaced with variables which can be randomly generated when the code is
run. For example, this allows us to randomly generate the directions of the voltage
and current arrows in a circuit. Or we can rotate the voltage sources by randomly
generating the coordinates for the poles. With these changes even the most trivial
circuit can have multiple different versions and it becomes harder for the students
to just memorize or guess the correct answers forcing them to solve the given task
Vol. 7, No. 3 Ellonen et al.: Experiences on Development and Design of…
194
accordingly. With additional loops and more complex circuits, the blind guessing
becomes almost impossible due to the big number of changing variables.
Adding randomness can be an efficient way of generating multiple versions of
the same circuit. However, this also makes the modelling of the correct answer for
the circuit a bit trickier. Manually inputting every possible answer and then
determine which is correct for the given circuit would simply take too much time
and in case of errors troubleshooting could get tedious. By our experience, a very
simple method can be used to generate the model answer for each input. As stated
before, the placement, rotation or direction of the elements can be generated
randomly. The voltage arrow U1 in Figure 6 could have two different directions:
from left to right (as seen in the figure) or from right to left. Considering the
situation of Figure 6a, the circuits voltage equation would be
E1 – U1 – U2 – U3 = 0
or
-E1 + U1 + U2 + U3 = 0.
If we were to change the direction of U1 to go from right to left the above
equations would change to
E1 + U1 – U2 – U3 = 0
or
-E1 – U1 + U2 + U3 = 0.
We can see that the only thing that changes is the sign before U1. This leads
us to a very simple solution of the model answer. Each of these signs are based on
the directions of the voltage arrows in the circuit and since the directions are
defined with randomized variables, we can use them in the model answer as
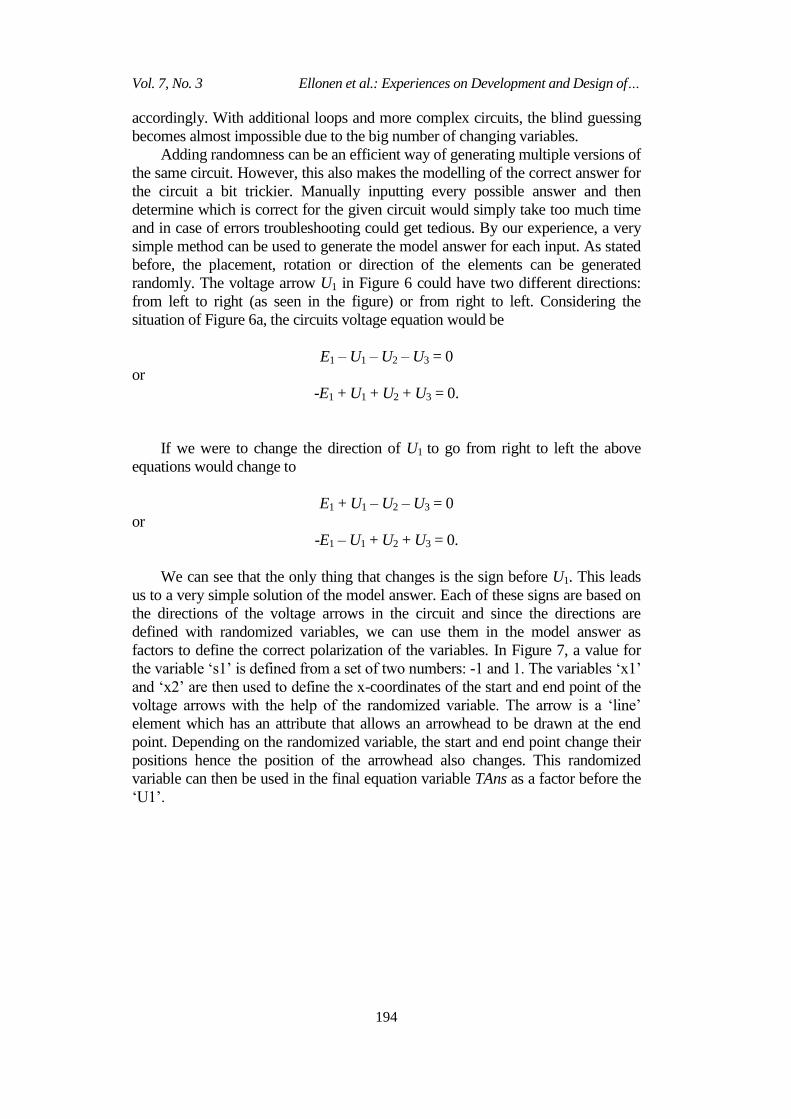
factors to define the correct polarization of the variables. In Figure 7, a value for
the variable ‘s1’ is defined from a set of two numbers: -1 and 1. The variables ‘x1’
and ‘x2’ are then used to define the x-coordinates of the start and end point of the
voltage arrows with the help of the randomized variable. The arrow is a ‘line’
element which has an attribute that allows an arrowhead to be drawn at the end
point. Depending on the randomized variable, the start and end point change their
positions hence the position of the arrowhead also changes. This randomized
variable can then be used in the final equation variable TAns as a factor before the
‘U1’.
Athens Journal of Technology & Engineering September 2020
195
Figure 7. Usage of Random Variables in the Model Answer
With this method every other voltage arrow in the circuit could also be
randomized e.g. with other variables like ‘s2’, ‘s3’, etc. These variables could then
be implemented to the final answer to form a correct model answer. Possible
programming errors in the solution are relatively easy to fix since they are only
dependent on the sign before the factor. The ‘simplify’ command removes the
factors when the answer is displayed for the student making it more readable and
understandable.
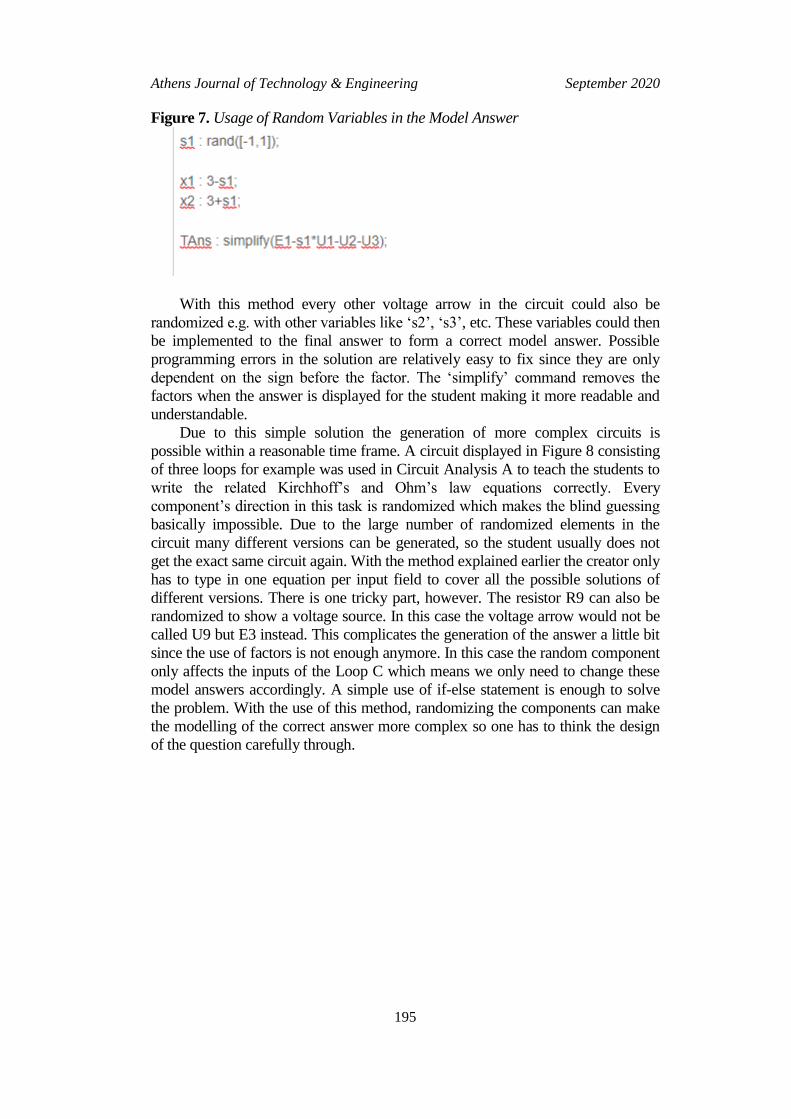
Due to this simple solution the generation of more complex circuits is
possible within a reasonable time frame. A circuit displayed in Figure 8 consisting
of three loops for example was used in Circuit Analysis A to teach the students to
write the related Kirchhoff’s and Ohm’s law equations correctly. Every
component’s direction in this task is randomized which makes the blind guessing
basically impossible. Due to the large number of randomized elements in the
circuit many different versions can be generated, so the student usually does not
get the exact same circuit again. With the method explained earlier the creator only
has to type in one equation per input field to cover all the possible solutions of
different versions. There is one tricky part, however. The resistor R9 can also be
randomized to show a voltage source. In this case the voltage arrow would not be
called U9 but E3 instead. This complicates the generation of the answer a little bit
since the use of factors is not enough anymore. In this case the random component
only affects the inputs of the Loop C which means we only need to change these
model answers accordingly. A simple use of if-else statement is enough to solve
the problem. With the use of this method, randomizing the components can make
the modelling of the correct answer more complex so one has to think the design
of the question carefully through.
Vol. 7, No. 3 Ellonen et al.: Experiences on Development and Design of…
196
Figure 8. A Circuit with Three Loops used in Circuit Analysis A
Source: Circuit Analysis A (University of Vaasa 2020).
Various Question Types
Many different types of questions can be created by using STACK. Traditional
types include calculating and formulating equations as shown before. According to
some feedback given by the students this can sometimes be frustrating since the
typing of the answer has to be exact. One small mistake in the equation makes the
whole answer wrong and the student must start from the beginning. This problem
becomes more severe with longer and more complex equations with division and
brackets. That is why it is also possible to generate more interactive problems
without a shown input field. Instead the students can move the elements in picture
to right places to give a correct answer. These types of questions can be used for
example in vector analysis, where the student is asked to draw a given vector.
These types can also be applied in circuit theory.
With the use of ‘slider’ element some values can be adjusted by the students.
Considering a classic problem of reactive power compensation in an AC parallel
circuit the student could be asked to set the values of inductance and capacitance
of the components so that the reactive power in the circuit is compensated. This
setup is shown in Figure 9. With the addition of showing the waveforms of the
voltage and current in the circuit and the power triangle and the reactive power
generated by the inductor and capacitor, the students should be able to compensate
the circuit without calculating anything, thus understanding what compensation
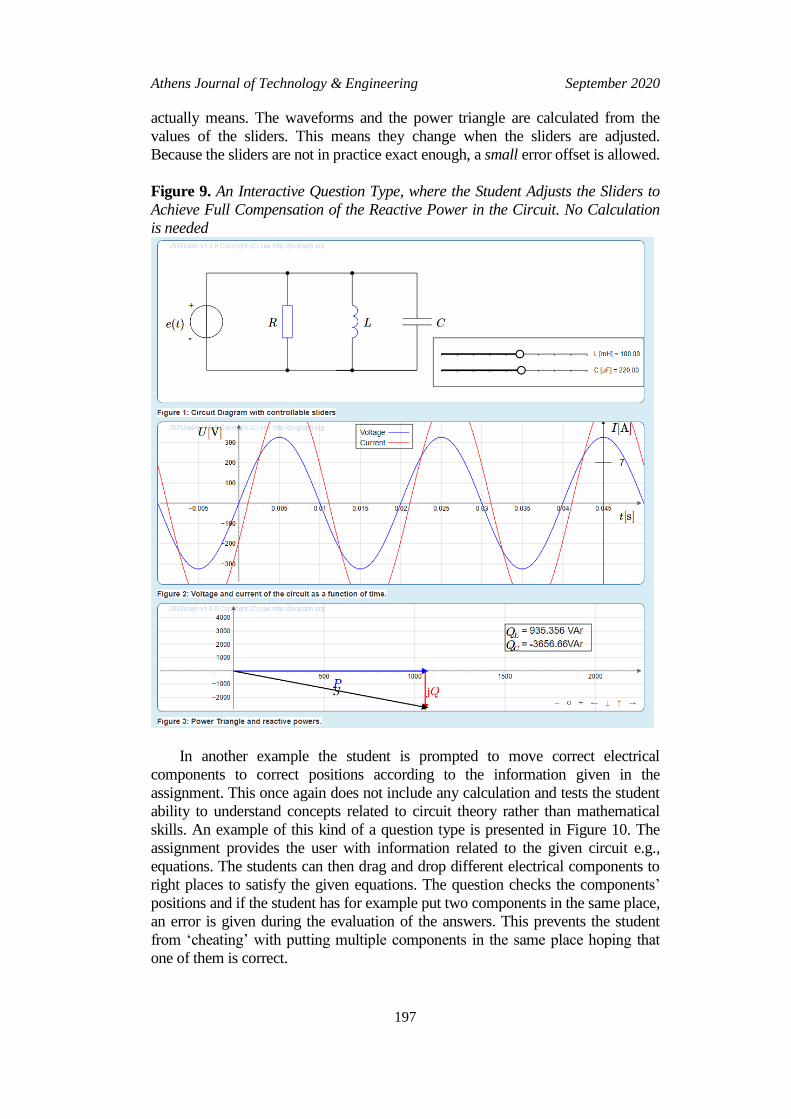
Athens Journal of Technology & Engineering September 2020
197
actually means. The waveforms and the power triangle are calculated from the
values of the sliders. This means they change when the sliders are adjusted.
Because the sliders are not in practice exact enough, a small error offset is allowed.
Figure 9. An Interactive Question Type, where the Student Adjusts the Sliders to
Achieve Full Compensation of the Reactive Power in the Circuit. No Calculation
is needed
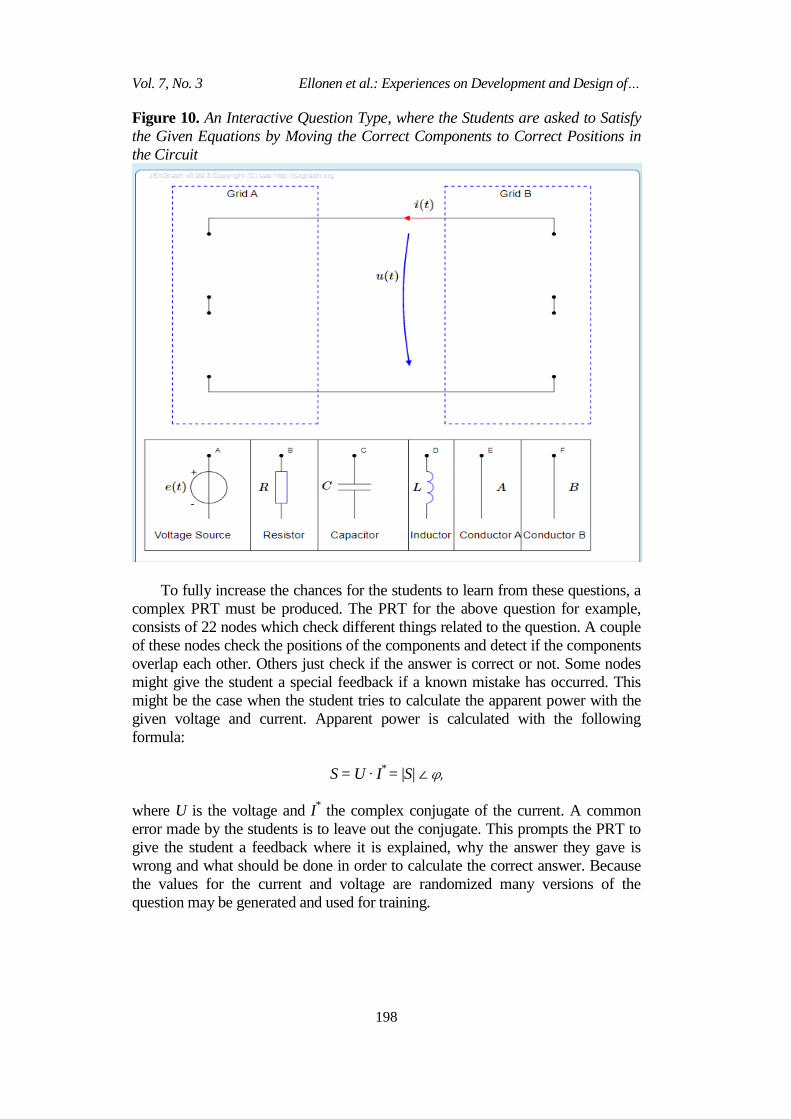
In another example the student is prompted to move correct electrical
components to correct positions according to the information given in the
assignment. This once again does not include any calculation and tests the student
ability to understand concepts related to circuit theory rather than mathematical
skills. An example of this kind of a question type is presented in Figure 10. The
assignment provides the user with information related to the given circuit e.g.,
equations. The students can then drag and drop different electrical components to
right places to satisfy the given equations. The question checks the components’
positions and if the student has for example put two components in the same place,
an error is given during the evaluation of the answers. This prevents the student
from ‘cheating’ with putting multiple components in the same place hoping that
one of them is correct.
Vol. 7, No. 3 Ellonen et al.: Experiences on Development and Design of…
198
Figure 10. An Interactive Question Type, where the Students are asked to Satisfy
the Given Equations by Moving the Correct Components to Correct Positions in
the Circuit
To fully increase the chances for the students to learn from these questions, a
complex PRT must be produced. The PRT for the above question for example,
consists of 22 nodes which check different things related to the question. A couple
of these nodes check the positions of the components and detect if the components
overlap each other. Others just check if the answer is correct or not. Some nodes
might give the student a special feedback if a known mistake has occurred. This
might be the case when the student tries to calculate the apparent power with the
given voltage and current. Apparent power is calculated with the following
formula:
S = U ∙ I* = |S| ∠ φ,
where U is the voltage and I* the complex conjugate of the current. A common
error made by the students is to leave out the conjugate. This prompts the PRT to
give the student a feedback where it is explained, why the answer they gave is
wrong and what should be done in order to calculate the correct answer. Because
the values for the current and voltage are randomized many versions of the
question may be generated and used for training.
Athens Journal of Technology & Engineering September 2020
199
Implementation of STACK Problems in Circuit Analysis
This section covers how the different problems created with STACK were
implemented and used in Circuit Analysis A. As explained earlier the idea of the
STACK questions is to help the students understand the basics of each topic so
that they could solve the more complex problems introduced in the traditional
exercises. This was done in the form of Moodle quizzes. A Moodle quiz can
consist of given number of STACK questions. The most used number of questions
in a quiz was three. The idea was to make the students to perform the whole quiz
repeatedly until they got everything right. Because of this the questions were rather
simple and with the more complex problems i.e. problem introduced in Fig. 8, the
number of questions inside a quiz was decreased to a minimum of one. This made
it possible for the students to learn the necessary skills right after the lectures and
before attempting to solve the more complex exercises without spending too much
time doing the STACK questions.
At the start of the course all the quizzes were hidden from the students and
they were only revealed after the related topics were discussed in the lectures. It
was thought that students might react better with more positive attitude when only
a few of the quizzes were shown at a time. The students could perform the quizzes
repeatedly as many times as they liked without the need to worry about lowering
their score since only the best attempt was considered. The questions in the
quizzes were presented one at a time. After all the questions were answered the
feedback from each of the questions with the student’s own answer was given.
This made it possible for the student to examine and compare their answers to the
right ones or the special feedback.
During the course, the students were asked to immediately contact the lecturer
or the creator responsible for the STACK questions in case they noticed some
programming errors or other technical problems. This worked quite well, and the
questions were usually fixed in a matter of couple of hours. Because of the idea
that the students should train with the STACK questions before attending the
exercises, deadlines were also issued, although some of the students solved the
questions right after they were released and most finished them just before a given
deadline. The traditional and the interactive question types worked well apart from
programming errors, and there were little to no technical problems associated
when the students performed the quizzes.
From the designer point of view there is much to think about when creating
this kind of STACK questions. When the STACK question production was started
for Circuit Analysis in late 2018, it took very much time to get something done
due to number of factors. Our small development team was not sure what kind of
possibilities and limits STACK had. This led us to explore and experiment in
various ways of visualizing the circuit diagram and later we settled on the
JSXGraph presentation which proved to be a good choice. The generation of such
complex questions can be time consuming because they need to achieve a certain
quality before introduced in the course. This means that the PRT for example,
must be on point and must give the students the feedback they need in the best
way possible. Without the years of experience, it could be hard to see and think
which kind of problems the student might have and what kind of errors they would
Vol. 7, No. 3 Ellonen et al.: Experiences on Development and Design of…
200
make. Enabling the use of teamwork and fusing together different knowledge and
skills made the process possible and quicker.
Feedback Given by the Students
After the final lectures and exercises on 28.04.2020 an optional feedback
from the students was gathered. Out of 25 students, 14 answered a series of
questions regarding the STACK problems and issues used in the course (N=14).
The typical questions prompted the users to evaluate the accuracy of given
statements with a range from 1 to 6 with 1 meaning ‘completely disagree’ and 6
meaning ‘completely agree’. The two final questions were free word questions
asking the students to give some positive feedback and something that could have
been better or could be changed. All the statements in the feedback had to be
answered.
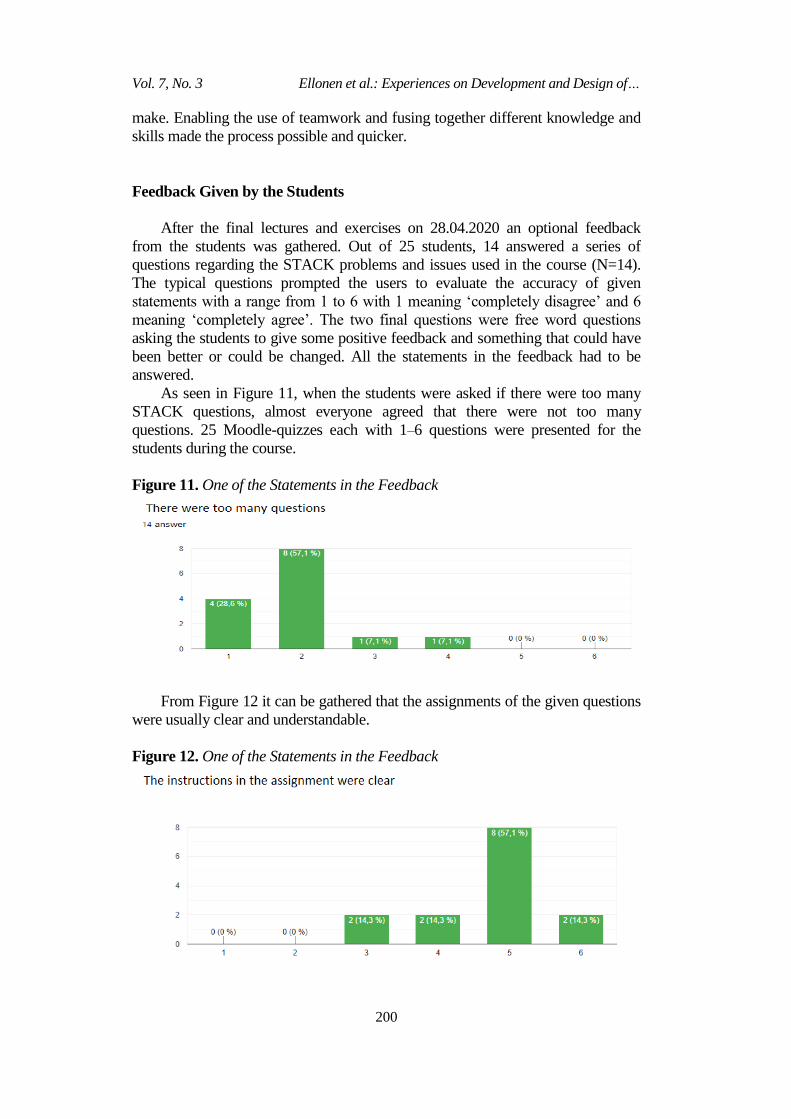
As seen in Figure 11, when the students were asked if there were too many
STACK questions, almost everyone agreed that there were not too many
questions. 25 Moodle-quizzes each with 1–6 questions were presented for the
students during the course.
Figure 11. One of the Statements in the Feedback
From Figure 12 it can be gathered that the assignments of the given questions
were usually clear and understandable.
Figure 12. One of the Statements in the Feedback
Athens Journal of Technology & Engineering September 2020
201
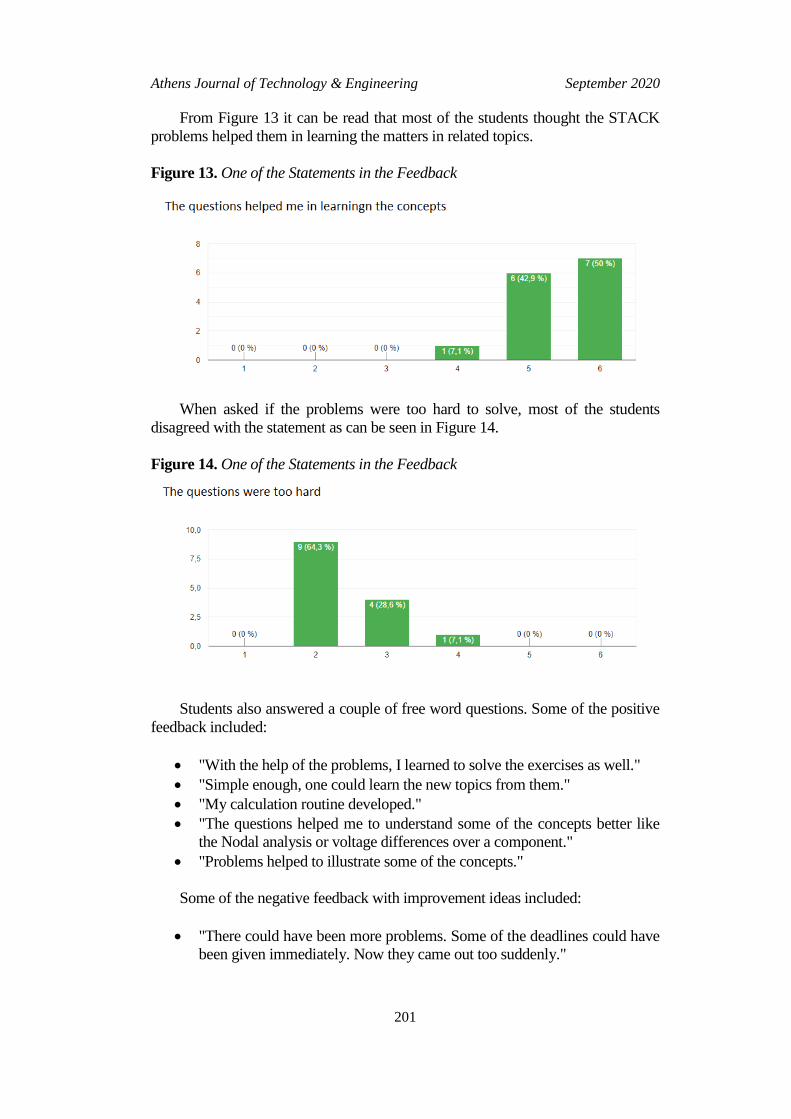
From Figure 13 it can be read that most of the students thought the STACK
problems helped them in learning the matters in related topics.
Figure 13. One of the Statements in the Feedback
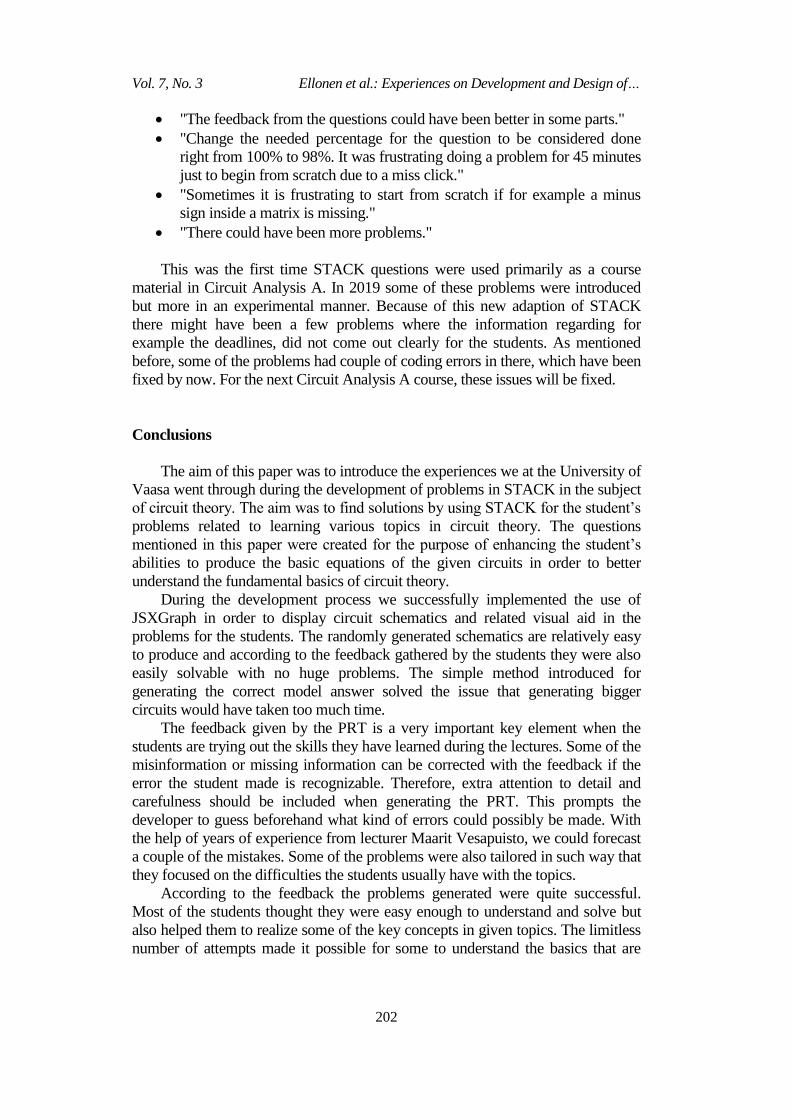
When asked if the problems were too hard to solve, most of the students
disagreed with the statement as can be seen in Figure 14.
Figure 14. One of the Statements in the Feedback
Students also answered a couple of free word questions. Some of the positive
feedback included:
"With the help of the problems, I learned to solve the exercises as well."
"Simple enough, one could learn the new topics from them."
"My calculation routine developed."
"The questions helped me to understand some of the concepts better like
the Nodal analysis or voltage differences over a component."
"Problems helped to illustrate some of the concepts."
Some of the negative feedback with improvement ideas included:
"There could have been more problems. Some of the deadlines could have
been given immediately. Now they came out too suddenly."
Vol. 7, No. 3 Ellonen et al.: Experiences on Development and Design of…
202
"The feedback from the questions could have been better in some parts."
"Change the needed percentage for the question to be considered done
right from 100% to 98%. It was frustrating doing a problem for 45 minutes
just to begin from scratch due to a miss click."
"Sometimes it is frustrating to start from scratch if for example a minus
sign inside a matrix is missing."
"There could have been more problems."
This was the first time STACK questions were used primarily as a course
material in Circuit Analysis A. In 2019 some of these problems were introduced
but more in an experimental manner. Because of this new adaption of STACK
there might have been a few problems where the information regarding for
example the deadlines, did not come out clearly for the students. As mentioned
before, some of the problems had couple of coding errors in there, which have been
fixed by now. For the next Circuit Analysis A course, these issues will be fixed.
Conclusions
The aim of this paper was to introduce the experiences we at the University of
Vaasa went through during the development of problems in STACK in the subject
of circuit theory. The aim was to find solutions by using STACK for the student’s
problems related to learning various topics in circuit theory. The questions
mentioned in this paper were created for the purpose of enhancing the student’s
abilities to produce the basic equations of the given circuits in order to better
understand the fundamental basics of circuit theory.
During the development process we successfully implemented the use of
JSXGraph in order to display circuit schematics and related visual aid in the
problems for the students. The randomly generated schematics are relatively easy
to produce and according to the feedback gathered by the students they were also
easily solvable with no huge problems. The simple method introduced for
generating the correct model answer solved the issue that generating bigger
circuits would have taken too much time.
The feedback given by the PRT is a very important key element when the
students are trying out the skills they have learned during the lectures. Some of the
misinformation or missing information can be corrected with the feedback if the
error the student made is recognizable. Therefore, extra attention to detail and
carefulness should be included when generating the PRT. This prompts the
developer to guess beforehand what kind of errors could possibly be made. With
the help of years of experience from lecturer Maarit Vesapuisto, we could forecast
a couple of the mistakes. Some of the problems were also tailored in such way that
they focused on the difficulties the students usually have with the topics.
According to the feedback the problems generated were quite successful.
Most of the students thought they were easy enough to understand and solve but
also helped them to realize some of the key concepts in given topics. The limitless
number of attempts made it possible for some to understand the basics that are
Athens Journal of Technology & Engineering September 2020
203
definitely needed when trying to solve the more complex problems. Naturally,
according to the feedback something needs to be improved. For example, in some
topics the feedback given by the PRT should have been more detailed according to
the students.
From the designer point of view the creation of more unique types of
problems might be time consuming. But when we look at the feedback, it can be
perceived that all the time spent in planning, coding and constructing these
problems definitely pays off. In the future more STACK problems will be
constructed in the field of circuit theory. The aim is to create enough problems for
the more advanced course of Circuit Analysis B and possibly for other courses too
depending on the resources available. The precise presentation of the problems for
the students must also be thought thoroughly for the next course in 2021.
More complex engineering problems for example in circuit theory can also be
made in STACK. However, in this case presenting the whole problem at once
could be very intimidating for the student. In this case it might be wise to
introduce the problem for the student piece by piece. With the newer versions of
STACK, it is possible to build such problems relatively easy. In the case of
complex problems special instructions or tutorials can be given for the students.
References
Analog Devices (2020) LTspice. Retrieved from: https://bit.ly/3f5sZha.
Attia J (1995) Teaching AC circuit analysis with MATLAB. In IEEE 1995, Proceedings
Frontiers in Education 1995 25th Annual Conference. Engineering Education for the
21st Century. DOI=https://www.doi.org/10.1109/FIE.1995.483086.
Cadence (2020) AWR-APLAC. Retrieved from: https://www.awr.com/.
CircuitLab (2020) Circuit simulation and schematics. Retrieved from: https://www.circuit
lab.com/.
EveryCircuit (2020) Circuits are better animated. Retrieved from: https://everycircuit.
com/#0.
Fino M (2018) Challenges in teaching electrical circuit analysis to millennials. In IEEE
2018, 3rd
International Conference of the Portuguese Society for Engineering
Education (CISPEE). DOI=https://www.doi.org/10.1109/CISPEE.2018.8593460.
JSXGraph (2020) Dynamic mathematics with JavaScript. Retrieved from: https://jsxgra
ph.uni-bayreuth.de/wp/index.html.
Maxima (2020) Maxima, a computer algebra system. Retrieved from: http://maxima.sour
ceforge.net/.
McDermott L, Shaffer P (1992) Research as a guide for curriculum development: an
example from introductory electricity - Part I: investigation of student understanding.
American Journal of Physics 60(11): 994–1003.
Moodle (2020) Empower educators with a flexible, open source LMS. Retrieved from:
https://moodle.com/.
Neitola M (2019) Circuit theory e-assessment realized in an open-source learning
environment. International Journal of Engineering Pedagogy 9(1): 4–18.
Sangwin C (2013) Computer aided assessment of mathematics. New York, USA: Oxford
University Press.
STACK Documentation (2018) STACK documentation. Retrieved from: https://stack2.
maths.ed.ac.uk/demo2018/question/type/stack/doc/doc.php.

Vol. 7, No. 3 Ellonen et al.: Experiences on Development and Design of…
204
Trajković L (2011) Teaching circuits to new generations of engineers. In IEEE 2011,
International Symposium of Circuits and Systems (ISCAS). DOI=https://www.doi.
org/10.1109/ISCAS.2011.5937781.
University of Vaasa (2020) Electrical engineering program description for 2019–2020.
Retrieved from: https://bit.ly/38zC3bG.
Valtonen M (2020) Piirianalyysi 1. (Circuit analysis). Finland: Aalto University.
Vesapuisto M (2004) Virtapiirimerkintöjen johdonmukaisuus opetuksen kannalta.
(Consistency of electrical circuit markings from the teaching point of view). Master
Thesis. Finland: University of Vaasa.
Voipio E (2006) Virtapiirit ja verkot. (Electric circuits and networks). Finland: Otatieto.
WolframAlpha (2020) WolframAlpha, electrical circuit calculators. Retrieved from:
https://bit.ly/2AFQMWa.