Embed Size (px)
Citation preview
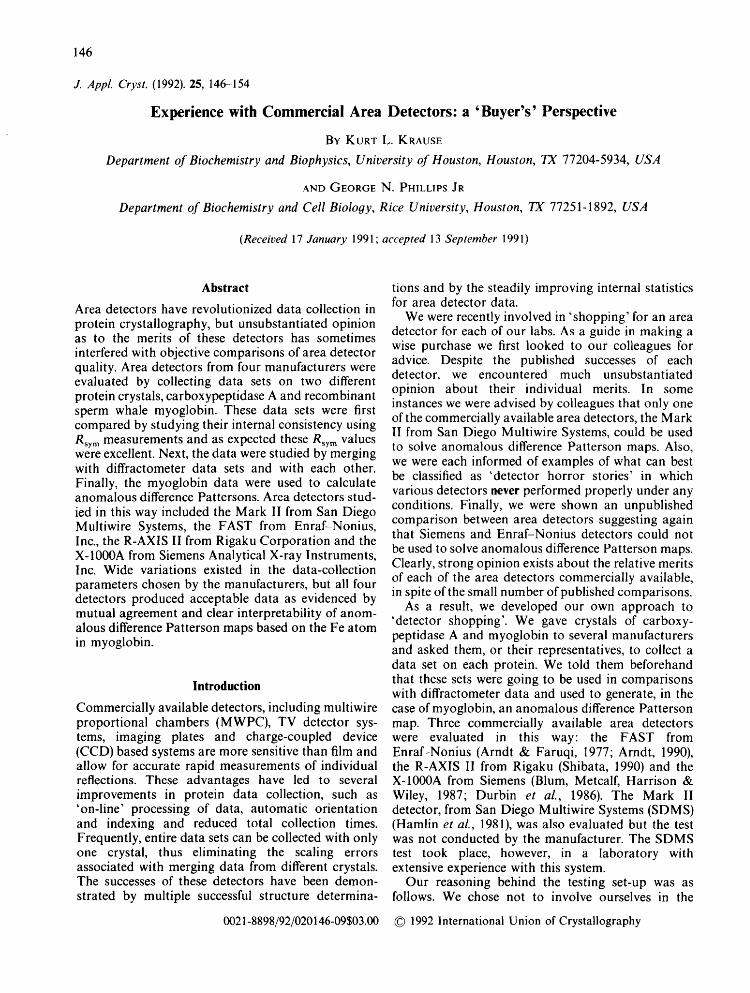
146
J. Appl. Cryst. (1992). 25, 146-154
Experience with Commercial Area Detectors: a 'Buyer's' Perspective
BY KURT L. KRAUSE
Department of Biochemistry and Biophysics, University of Houston, Houston, TX 77204-5934, USA
AND GEORGE N. PHILLIPS JR
Department of Biochemistry and Cell Biology, Rice University, Houston, TX 7725 l- 1892, USA
(Received 17 January 1991 ; accepted 13 September 1991)
Abstract
Area detectors have revolutionized data collection in protein crystallography, but unsubstantiated opinion as to the merits of these detectors has sometimes interfered with objective comparisons of area detector quality. Area detectors from four manufacturers were evaluated by collecting data sets on two different protein crystals, carboxypeptidase A and recombinant sperm whale myoglobin. These data sets were first compared by studying their internal consistency using Rsy m m e a s u r e m e n t s and as expected these Rsy m values were excellent. Next, the data were studied by merging with diffractometer data sets and with each other. Finally, the myoglobin data were used to calculate anomalous difference Pattersons. Area detectors stud- ied in this way included the Mark II from San Diego Multiwire Systems, the FAST from Enraf-Nonius, Inc., the R-AXIS II from Rigaku Corporation and the X-1000A from Siemens Analytical X-ray Instruments, Inc. Wide variations existed in the data-collection parameters chosen by the manufacturers, but all four detectors produced acceptable data as evidenced by mutual agreement and clear interpretability of anom- alous difference Patterson maps based on the Fe atom in myoglobin.
Introduction
Commercially available detectors, including multiwire proportional chambers (MWPC), TV detector sys- tems, imaging plates and charge-coupled device (CCD) based systems are more sensitive than film and allow for accurate rapid measurements of individual reflections. These advantages have led to several improvements in protein data collection, such as 'on-line' processing of data, automatic orientation and indexing and reduced total collection times. Frequently, entire data sets can be collected with only one crystal, thus eliminating the scaling errors associated with merging data from different crystals. The successes of these detectors have been demon- strated by multiple successful structure determina-
0021-8898/92/020146-09503.00
tions and by the steadily improving internal statistics for area detector data.
We were recently involved in "shopping' for an area detector for each of our labs. As a guide in making a wise purchase we first looked to our colleagues for advice. Despite the published successes of each detector, we encountered much unsubstantiated opinion about their individual merits. In some instances we were advised by colleagues that only one of the commercially available area detectors, the Mark II from San Diego Multiwire Systems, could be used to solve anomalous difference Patterson maps. Also, we were each informed of examples of what can best be classified as 'detector horror stories' in which various detectors never performed properly under any conditions. Finally, we were shown an unpublished comparison between area detectors suggesting again that Siemens and Enraf-Nonius detectors could not be used to solve anomalous difference Patterson maps. Clearly, strong opinion exists about the relative merits of each of the area detectors commercially available, in spite of the small number of published comparisons.
As a result, we developed our own approach to 'detector shopping'. We gave crystals of carboxy- peptidase A and myoglobin to several manufacturers and asked them, or their representatives, to collect a data set on each protein. We told them beforehand that these sets were going to be used in comparisons with diffractometer data and used to generate, in the case of myoglobin, an anomalous difference Patterson map. Three commercially available area detectors were evaluated in this way: the FAST from Enraf-Nonius (Arndt & Faruqi, 1977; Arndt, 1990), the R-AXIS II from Rigaku (Shibata, 1990) and the X-1000A from Siemens (Blum, Metcalf, Harrison & Wiley, 1987; Durbin et al., 1986). The Mark II detector, from San Diego Multiwire Systems (SDMS) (Hamlin et al., 1981), was also evaluated but the test was not conducted by the manufacturer. The SDMS test took place, however, in a laboratory with extensive experience with this system.
Our reasoning behind the testing set-up was as follows. We chose not to involve ourselves in the
© 1992 International Union of Crystallography
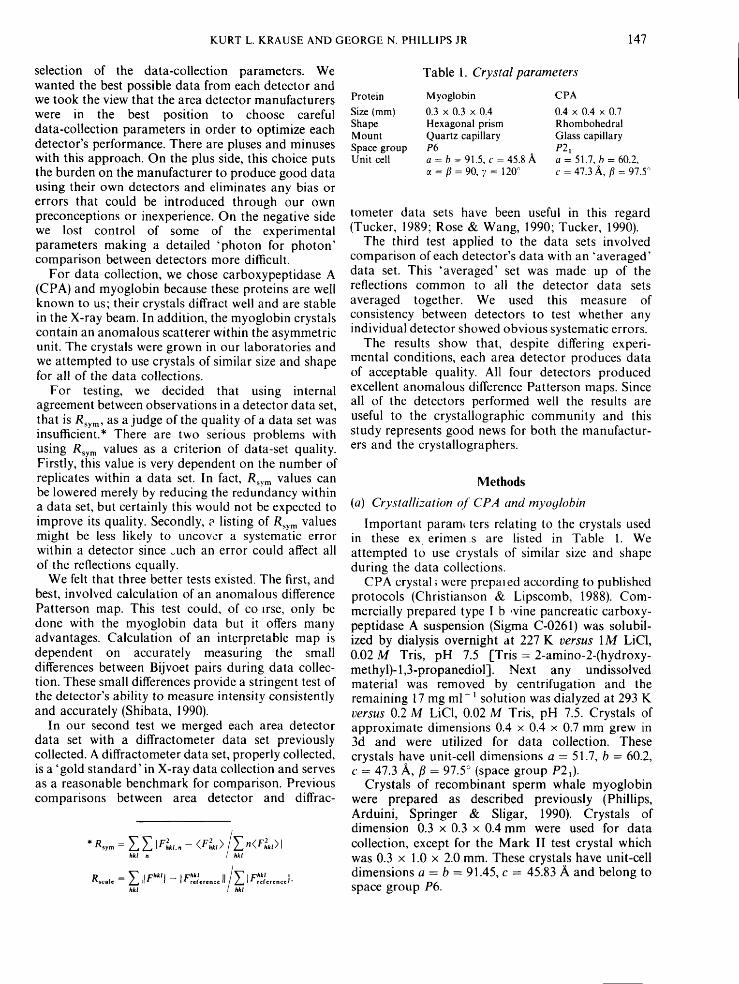
KURT L. KRAUSE AND GEORGE N. PHILLIPS JR 147
selection of the data-collection parameters. We wanted the best possible data from each detector and we took the view that the area detector manufacturers were in the best position to choose careful data-collection parameters in order to optimize each detector's performance. There are pluses and minuses with this approach. On the plus side, this choice puts the burden on the manufacturer to produce good data using their own detectors and eliminates any bias or errors that could be introduced through our own preconceptions or inexperience. On the negative side we lost control of some of the experimental parameters making a detailed 'photon for photon' comparison between detectors more difficult.
For data collection, we chose carboxypeptidase A (CPA) and myoglobin because these proteins are well known to us; their crystals diffract well and are stable in the X-ray beam. In addition, the myoglobin crystals contain an anomalous scatterer within the asymmetric unit. The crystals were grown in our laboratories and we attempted to use crystals of similar size and shape for all of the data collections.
For testing, we decided that using internal agreement between observations in a detector data set, that is Rsym, as a judge of the quality of a data set was insufficient.* There are two serious problems with using Rsy m values as a criterion of data-set quality. Firstly, this value is very dependent on the number of replicates within a data set. In fact, Rsy m values can be lowered merely by reducing the redundancy within a data set, but certainly this would not be expected to improve its quality. Secondly, e listing of R,ym values might be less likely to uncover a systematic error within a detector since ~uch an error could affect all of the reflections equally.
We felt that three better tests existed. The first, and best, involved calculation of an anomalous difference Patterson map. This test could, of co lrse, only be done with the myoglobin data but it offers many advantages. Calculation of an interpretable map is dependent on accurately measuring the small differences between Bijvoet pairs during data collec- tion. These small differences provide a stringent test of the detector's ability to measure intensity consistently and accurately (Shibata, 1990).
In our second test we merged each area detector data set with a diffractometer data set previously collected. A diffractometer data set, properly collected, is a 'gold standard ' in X-ray data collection and serves as a reasonable benchmark for comparison. Previous comparisons between area detector and diffrac-
hkl n I h k l
Rs¢,,, II F"k~l ,,f ...... II - , , r ...... • hkl
Table I. Crystal parameters
Protein Myoglobin CPA Size (mm) 0.3 × 0.3 x 0.4 0.4 × 0.4 x 0.7 Shape Hexagonal p r i s m Rhombohedral Mount Quartz capillary Glass capillary Space group P6 P2~ Unit cell a = b = 91.5, c = 45.8/~ a = 51.7, b = 60.2,
= / / = 90, 7 = 120~ c = 47.3 ,~,/~ = 97.5 e'
tometer data sets have been useful in this regard (Tucker, 1989; Rose & Wang, 1990; Tucker, 1990).
The third test applied to the data sets involved comparison of each detector's data with an "averaged' data set. This 'averaged' set was made up of the reflections common to all the detector data sets averaged together. We used this measure of consistency between detectors to test whether any individual detector showed obvious systematic errors.
The results show that, despite differing experi- mental conditions, each area detector produces data of acceptable quality. All four detectors produced excellent anomalous difference Patterson maps. Since all of the detectors performed well the results are useful to the crystallographic community and this study represents good news for both the manufactur- ers and the crystallographers.
Methods
(a) Crystallization of CPA and myoylobin
Important param~ ters relating to the crystals used in these ex erimen.s are listed in Table 1. We attempted to use crystals of similar size and shape during the data collections.
CPA crystal; were prepa~ ed according to published protocols (Christianson & Lipscomb, 1988). Com- mercially prepared type I b ,vine pancreatic carboxy- peptidase A suspension (Sigma C-0261) was solubil- ized by dialysis overnight at 227 K versus 1M LiC1, 0.02 M Tris, pH 7.5 [Tris = 2-amino-2-(hydroxy- methyl)-l,3-propanediol]. Next any undissolved material was removed by centrifugation and the remaining 17 mg ml- 1 solution was dialyzed at 293 K versus 0.2 M LiC1, 0.02 M Tris, pH 7.5. Crystals of approximate dimensions 0.4 x 0.4 x 0.7 mm grew in 3d and were utilized for data collection. These crystals have unit-cell dimensions a = 51.7, b = 60.2, c -- 47.3 A, fl = 97.5 ° (space group P21).
Crystals of recombinant sperm whale myoglobin were prepared as described previously (Phillips, Arduini, Springer & Sligar, 1990). Crystals of dimension 0.3 x 0.3 x 0.4 mm were used for data collection, except for the Mark II test crystal which was 0.3 x 1.0 x 2.0 mm. These crystals have unit-cell dimensions a = b --- 91.45, c = 45.83 A and belong to space group P6.
148 COMMERCIAL AREA DETECTORS: A 'BUYER'S' PERSPECTIVE
Experimental set-up
X-ray source Wavelength (A) Power (kV; mA) Focal spot (lam) Monochromator Collimator (mm) Temperature (K)
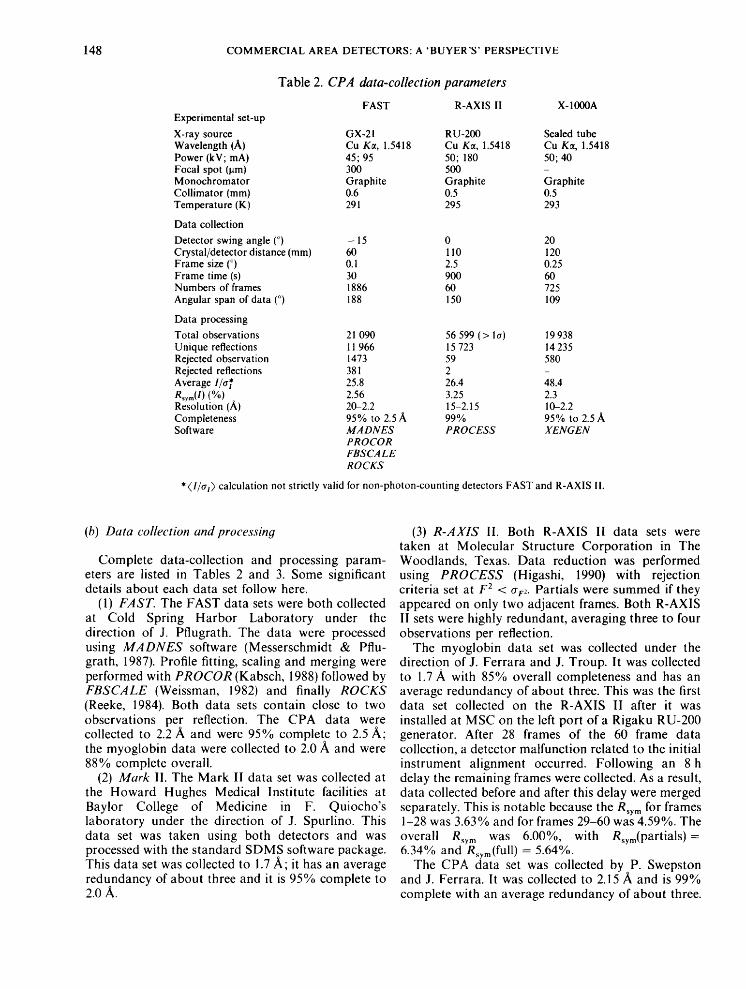
Table 2. CPA data-collection parameters
FAST R-AXIS II X-IOOOA
GX-21 RU-200 Sealed tube Cu K~, 1.5418 Cu Kct, 1.5418 Cu Kct, 1.5418 45; 95 50; 180 50; 40 300 500 - Graphite Graphite Graphite 0.6 0.5 0.5 291 295 293
Data collection
Detector swing angle (°) - 15 0 20 Crystal/detector distance (mm) 60 110 120 Frame size (°) 0.1 2.5 0.25 Frame time (s) 30 900 60 Numbers of frames 1886 60 725 Angular span of data (o) 188 150 109
Data processing
Total observations 21 090 56 599 (> la) 19 938 Unique reflections 11 966 15 723 14 235 Rejected observation 1473 59 580 Rejected reflections 381 2 - Average l/tr~ 25.8 26.4 48.4 Rsym(l ) (%) 2.56 3.25 2.3 Resolution (A) 20-2.2 15-2.15 10-2.2 Completeness 95% to 2.5 ,~ 99% 95% to 2.5/~, Software M A D N E S P R O C E S S X E N G E N
P R O C O R FBSC A L E R O C K S
* ( l / a t ) calculation not strictly valid for non-photon-counting detectors FAST and R-AXIS II.
(b) Data collection and processin 9
Complete data-collection and processing param- eters are listed in Tables 2 and 3. Some significant details about each data set follow here.
(1) FAST. The FAST data sets were both collected at Cold Spring Harbor Laboratory under the direction of J. Pflugrath. The data were processed using M A D N E S software (Messerschmidt & Pflu- grath, 1987). Profile fitting, scaling and merging were performed with PROCOR (Kabsch, 1988) followed by F B S C A L E (Weissman, 1982) and finally ROCKS (Reeke, 1984). Both data sets contain close to two observations per reflection. The CPA data were collected to 2.2 A and were 95% complete to 2.5 ,~; the myoglobin data were collected to 2.0 ,~ and were 88% complete overall.
(2) Mark II. The Mark II data set was collected at the Howard Hughes Medical Institute facilities at Baylor College of Medicine in F. Quiocho's laboratory under the direction of J. Spurlino. This data set was taken using both detectors and was processed with the standard SDMS software package. This data set was collected to 1.7 A; it has an average redundancy of about three and it is 95% complete to 2.0/~.
(3) R-AXIS II. Both R-AXIS II data sets were taken at Molecular Structure Corporation in The Woodlands, Texas. Data reduction was performed using P R O C E S S (Higashi, 1990) with rejection criteria set at F 2 < o>2. Partials were summed if they appeared on only two adjacent frames. Both R-AXIS II sets were highly redundant, averaging three to four observations per reflection.
The myoglobin data set was collected under the direction of J. Ferrara and J. Troup. It was collected to 1.7 A with 85% overall completeness and has an average redundancy of about three. This was the first data set collected on the R-AXIS II after it was installed at MSC on the left port of a Rigaku RU-200 generator. After 28 frames of the 60 frame data collection, a detector malfunction related to the initial instrument alignment occurred. Following an 8 h delay the remaining frames were collected. As a result, data collected before and after this delay were merged separately. This is notable because the R~ym for frames 1-28 was 3.63% and for frames 29-60 was 4.59%. The overall Rsy m w a s 6.00%, with R~ym(partials)= 6.34% and Rsym(full ) = 5.64%.
The CPA data set was collected by P. Swepston and J. Ferrara. It was collected to 2.15 ,~ and is 99% complete with an average redundancy of about three.
KURT L. KRAUSE AND GEORGE N. PHILLIPS JR 149
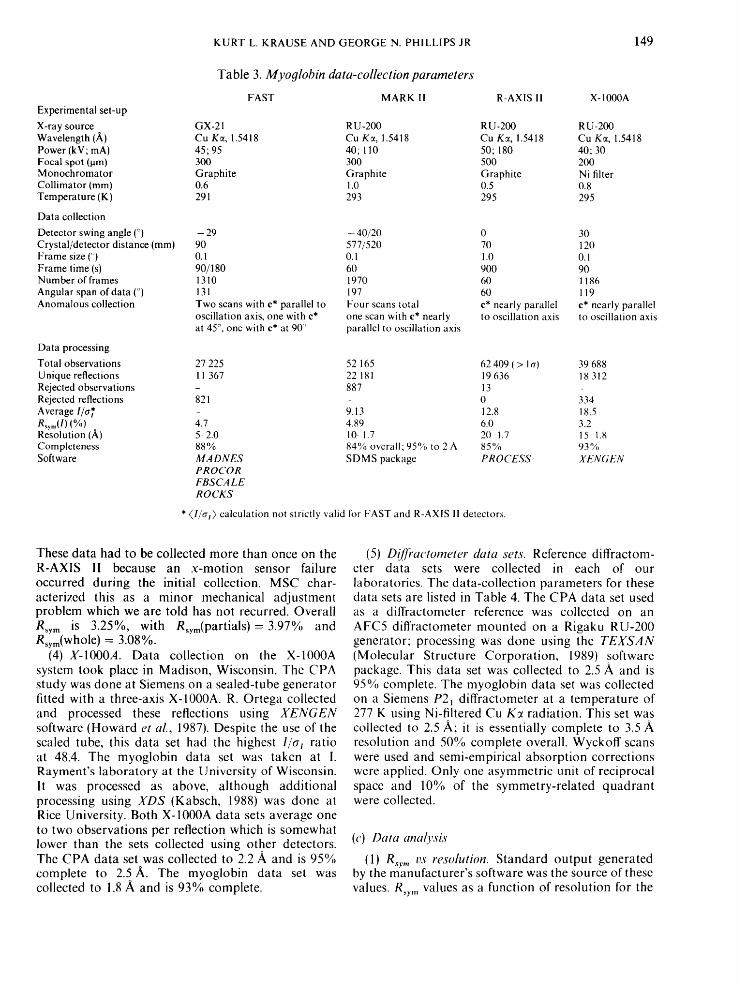
Experimental set-up
X-ray source Wavelength (A) Power (kV; mA) Focal spot (~m) Monochromator Collimator (mm) Temperature (K)
Data collection Detector swing angle (°) Crystal/detector distance (mm) Frame size (") Frame time (s) Number of frames Angular span of data ('~) Anomalous collection
Data processing
Total observations Unique reflections Rejected observations Rejected reflections Average l/a* Rsym(/) (°A,) Resolution (A) Completeness Software
Table 3. Myoylobin data-collection parameters
FAST MARK II R-AXIS II X- 1000A
GX-21 R U-200 R U-200 R U-200 Cu KT, 1.5418 Cu K~, 1.5418 Cu K~, 1.5418 Cu K~, 1.5418 45; 95 40;110 50; 180 40:30 300 300 500 200 Graphite Graphite Graphite Ni filter 0.6 1.0 0.5 0.8 291 293 295 295
- 29 - 40/20 0 30 90 577/520 70 12(1 0.1 0.1 1.0 0.1 90/180 60 900 90 1310 1970 60 1186 131 197 60 119 Two scans with e* parallel to Four scans total e* nearly parallel c* nearly parallel oscillation axis, one with e* one scan with e* nearly to oscillation axis to oscillation axis at 45 °, one with e* at 90" parallel to oscillation axis
27 225 52 165 62 409 ( > 1 a) 39 688 11367 22 181 19636 18312 - 887 13 821 0 334
- 9.13 12.8 18.5 4.7 4.89 6.0 3.2 5-2.0 10-1.7 20 1.7 15 1.8 88% 84% overall; 95% to 2 A 85% 93% MA DNES SD M S package PROCESS XENGEN PROCOR FBSCA L E ROCKS
* (I/at) calculation not strictly valid for FAST and R-AXIS II detectors.
These da ta had to be collected more than once on the R-AXIS II because an x - m o t i o n sensor failure occurred dur ing the init ial collection. MSC char- acterized this as a minor mechanica l ad jus tmen t p rob lem which we are told has not recurred. Overal l gsy m is 3.25%, with Rsym(part ials)= 3.97% and Rsym(whole ) = 3.08%.
(4) X-1000A. Da ta col lect ion on the X-1000A system took place in Madison , Wisconsin. The CPA study was done at Siemens on a sealed-tube genera to r fitted with a three-axis X-1000A. R. Or tega collected and processed these reflections using X E N G E N software (Howard et al., 1987). Despi te the use of the sealed tube, this da ta set had the highest l/o~ ra t io at 48.4. The myog lob in da ta set was taken at I. Rayment ' s l abo ra to ry at the Univers i ty of Wisconsin. It was processed as above, a l t hough add i t iona l processing using X D S (Kabsch, 1988) was done at Rice Universi ty. Both X-1000A da ta sets average one to two observa t ions per reflection which is somewha t lower than the sets collected using o ther detectors. The CPA da ta set was collected to 2.2 A and is 95°/,, comple te to 2.5/~. The myog lob in da ta set was collected to 1.8 A and is 93% complete .
(5) D([]?actometer data sets. Reference diff ractom- eter da ta sets were collected in each of our laborator ies . The da ta -co l lec t ion paramete rs for these da ta sets are listed in Table 4. The CPA data set used as a d i f f rac tometer reference was collected on an AFC5 diflYactometer m o u n t e d on a Rigaku RU-200 genera tor : processing was done using the T E X S A N (Molecular Structure C o r p o r a t i o n , 1989) software package. This da ta set was collected to 2.5 A and is 95% complete. The myog lob in da ta set was collected on a Siemens P21 di f f rac tometer at a t empera tu re of 277 K using Ni-fil tered Cu K~ radia t ion . This set was collected to 2.5 ,~; it is essentially comple te to 3.5 A resolut ion and 50% comple te overall. Wyckof f scans were used and semi-empir ical abso rp t ion cor rec t ions were applied. Only one asymmet r ic unit of reciprocal space and 10% of the symmet ry- re la ted q u a d r a n t were collected.
(c) Data analysis
(1) R~.v, . vs resolution. Standa rd ou tpu t genera ted by the manufac ture r ' s software was the source of these values. Rsy m values as a funct ion of resolu t ion for the
150 COMMERCIAL AREA DETECTORS: A 'BUYER'S' PERSPECTIVE
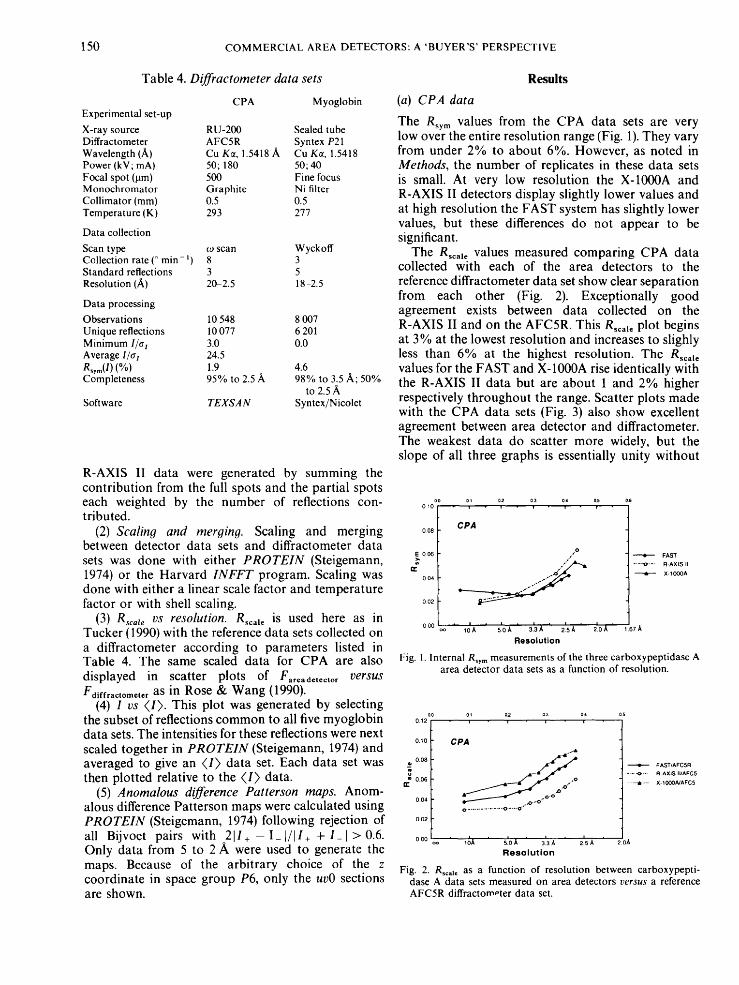
Table 4. Diffractometer data sets
CPA Myoglobin Experimental set-up X-ray source RU-200 Sealed tube Diffractometer AFC5R Syntex P21 Wavelength (,~) Cu Kct, 1.5418/~, Cu Kct, 1.5418 Power (kV; mA) 50; 180 50; 40 Focal spot (~tm) 500 Fine focus Monochromator Graphite Ni filter Collimator (mm) 0.5 0.5 Temperature (K) 293 277
Data collection Scan type to scan Wyckoff Collection rate (° min- ~) 8 3 Standard reflections 3 5 Resolution (,~,) 20-2.5 18 -2.5
Data processing Observations 10 548 8 007 Unique reflections 10 077 6 201 Minimum l/ot 3.0 0.0 Average l/at 24.5 - R,,.,(I) (%) 1.9 4.6 Completeness 95% to 2.5 A 98% to 3.5 A; 50%
to 2.5 A Software TEXSA N Syntex/Nicolet
Results
(a) C P A data
The Rsy m values from the CPA data sets are very low over the entire resolution range (Fig. 1). They vary from under 2% to about 6%. However, as noted in Methods, the number of replicates in these data sets is small. At very low resolution the X-1000A and R-AXIS II detectors display slightly lower values and at high resolution the FAST system has slightly lower values, but these differences do not appear to be significant.
The Rscal e values measured compar ing CPA data collected with each of the area detectors to the reference diffractometer data set show clear separat ion from each other (Fig. 2). Exceptionally good agreement exists between data collected on the R-AXIS II and on the AFC5R. This Rscal e plot begins at 3% at the lowest resolution and increases to slighly less than 6% at the highest resolution. The Rs¢at, values for the FAST and X-1000A rise identically with the R-AXIS II data but are about 1 and 2% higher respectively throughout the range. Scatter plots made with the CPA data sets (Fig. 3) also show excellent agreement between area detector and diffractometer. The weakest data do scatter more widely, but the slope of all three graphs is essentially unity without
R-AXIS II data were generated by summing the contr ibution from the full spots and the partial spots each weighted by the number of reflections con- tributed.
(2) Scalin9 and merging. Scaling and merging 0o0 between detector data sets and diffractometer data sets was done with either P R O T E I N (Steigemann, , ~00~ 1974) or the Harvard I N F F T program. Scaling was " 0o, done with either a linear scale factor and temperature factor or with shell scaling. 0.02
(3) Rscal e US resolution. R~c,~le is used here as in 0 00
Tucker (1990) with the reference data sets collected on a diffractometer according to parameters listed in Table 4. The same scaled data for CPA are also displayed in scatter plots of Fareadetector v e r s u s
Fdiffractometer as in Rose & Wang (1990). (4) I vs ( I ) . This plot was generated by selecting
the subset of reflections common to all five myoglobin data sets. The intensities for these reflections were next
0 .10
scaled together in P R O T E I N (Steigemann, 1974) and averaged to give an ( I ) data set. Each data set was _-0.o8 then plotted relative to the ( I ) data. = 0.06
n -
(5) Anomalous difference Patterson maps. Anom- alous difference Patterson maps were calculated using 0.0, P R O T E I N (Steigemann, 1974) following rejection of 002 all Bijvoet pairs with 21I+ - I_ I/1I+ + I_ I > 0.6. Only data from 5 to 2 A were used to generate the maps. Because of the arbi trary choice of the z coordinate in space group P6, only the uvO sections are shown.
00 01 02 03 0.4 0~ 06 o 1 0 , , , , f
CPA
. 0 41. FAST
. . . . - 0 , . - . R - A X I S II
X-IOOOA
, I , i i i I , oo ~0 A s'.0 A 3'3 A 2!s A 2.0A 1.67 A
R e s o l u t i o n
Fig. 1. Internal Rsy m measurements of the three carboxypeptidase A area detector data sets as a function of resolution.
oo 01 02 03 04 os 0.12 , , , ,
CPA
. ~ . ~ ~ ~ .o. . ,o " ~ ' ° ' ' ° ' ' "
o. . . . . . . . . . . . . . . . . o . - . - . o " " "
• FAST/AFCSR
- - "O"- ' R-AXIS II /AFC5
....... ~1" ..... X- 1 0 0 0 N A F C 5
ooo ,~A ' ' 313A ' oo ' 5 .0 A ' 2!5 A ' 2 0 A
R e s o l u t i o n
Fig. 2. Rs¢.~ , as a function of resolution between carboxypepti- dase A data sets measured on area detectors versus a reference AFC5R diffractom,~ter data set.
K U R T L. KRAUSE A N D G E O R G E N. PHILLIPS JR 151
200 . r- t . . . . . . . . . q- ] . //~
/ : i !
100.
50.
O. J
O. 50. 100. 150. 200 .
Fdiffractometer (a)
200 . r ....... I ....... ~- ~ / ~
150. R-AXIS II ~ .:!.;;~..~," i
100.
50.
O. ~ ..... _c__ I h i
O. 50. 100. 150. 200. Fdiffractometer
(b)
200.
150.
o
*a
,o 100.
50.
X- IO00A , ' ~ ._
,.i..',? ~'¢'r
50. 100. 150. 200 .
~diffractometer (c)
Fig. 3. Plots of F . . . . detector v e r s u s Fdiffraetometer for the (a) FAST, (b) R-AXIS II and (c) X-1000A detectors using CPA data. These data were scaled with a linear scale factor and a temperature prior to plotting, that is F~cal " = F o b , k exp [ - B(sin 20)/22].
evidence of any systematic error. The width of the scatter is somewhat less for the R-AXIS II data and somewhat more for the X-1000A data.
(b) M y o o l o b & data
Excellent Rsym values were obtained from the myoglobin area detector data (Fig. 4). All of the curves display a very gradual increase in Rsy m with resolution; at 2 .5A the Rsrm value for all four detectors is about 5%. At the highest resolution the X-1000A curve climbs more rapidly than the others while the Mark II data slope remains close to level. The R-AXIS II curve was calculated using only data from the first 28 frames collected and truncation of the data in this way would significantly lower the apparent R~y~. An Rsy m curve generated from the full data set would probably be 1 to 2% higher over the entire range.
The myoglobin data display level Rs¢~l, values until about 3.3 ,~, when these values begin to increase in parallel for all four detectors (see Fig. 5). At resolutions less than 3.3 A the X-1000A has the lowest Rseal e values, and above 3.3 A the Mark II data and the R-AXIS II data have the best Rs¢~t ¢ values, but the difference between all four data sets is quite small. The shape of the curve differs from the CPA RsCat ~ plots in that there is an increase in R~¢a~ ¢ at low resolution.
o o 016
0.14
0,12
~010 m
(¢ 008
0.06
0,04
0.02
0 . 0 0 o o '
01 02 03 04 05 06 i | i i i
Myoglobin
°,,o'°
o.
ida ' ~loA' 3'~A' 215A' 2'oA R e s o l u t i o n
t F A S T
- - - I - - M A R K II
. . . . ~ " - ' R - A X I S II °
A X -1000A
• p a r t i a l d a t a s e e t e x t
~7 A
Fig. 4. Internal Rsy m m e a s u r e m e n t s of the three recombinant myoglobin area detector data sets as a function of resolution. The R-AXIS II plot is calculated from the data collected from frames 1 to 28 out of 60 frames total.
01200
010
0~
m u
0 . ~
0 02
0 .~
o.t 02 03
Myoglobin
0 4 0 5 I
__ .~ ._ FAST~ IFF MARKI I /D IFF
. . . . -o..-. R - A X I S W D I F F
- - - - 1 - - - X-100OMDIFF
' I~A ' ,'.oA' AA ' 2~A ' 2oA l:lesolullon
Fig. 5. R,c~, as a function of resolution between recombinant myoglobin data sets measured on area detectors v e r s u s a
reference P21 diffractometer data set.
152 COMMERCIAL AREA DETECTORS: A 'BUYER'S' PERSPECTIVE
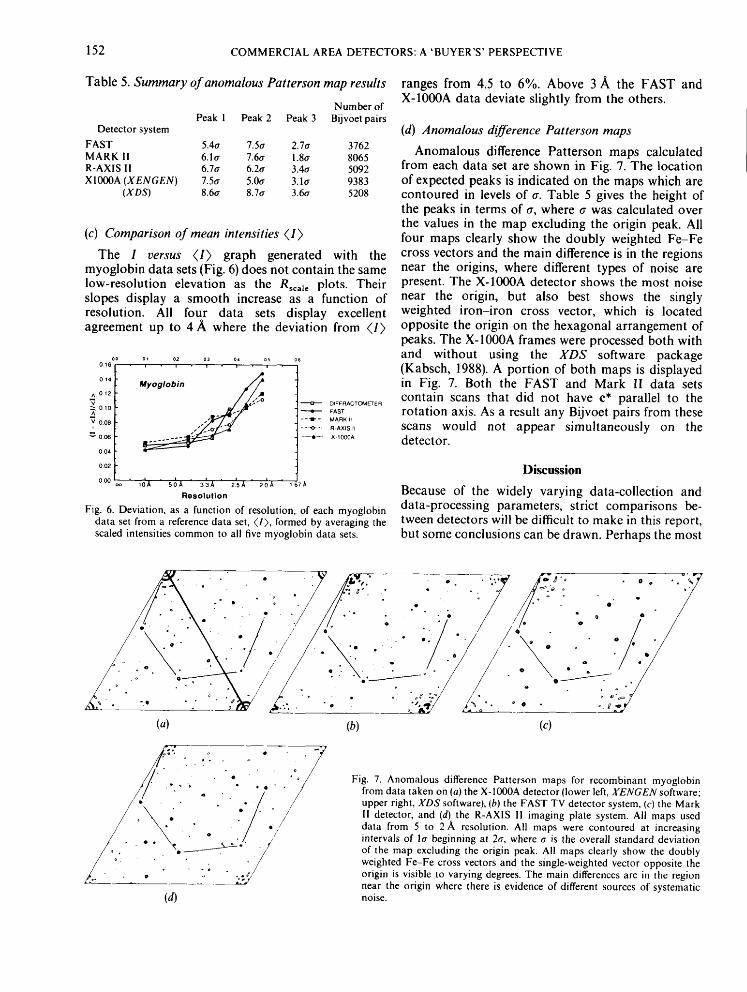
Table 5. Summary of anomalous Patterson map results
Number of Peak 1 Peak 2 Peak 3 Bijvoet pairs
Detector system
FAST 5.4tr 7.5tr 2.7tr 3762 MARK II 6.1tr 7.6tr 1.8tr 8065 R-AXIS I1 6.7tr 6.2a 3.4tr 5092 X1000A (XENGEN) 7.5tr 5.0tr 3.1tr 9383
(XDS) 8.6tr 8.7tr 3.6a 5208
(c) Comparison of mean intensities ( I )
The I versus ( I ) graph generated with the myoglobin data sets (Fig. 6) does not contain the same low-resolution elevation as the R,¢a~ = plots• Their slopes display a smooth increase as a function of resolution. All four data sets display excellent agreement up to 4 A where the deviation from ( I )
01600
014
A 0 1 2
V 010 A
v 0 ,08
006
004
0 02
000 oo
01 02 03 04 05
, , - l , |
Myoglobin ~ ~'. . .o
DIFFRACTOMETE R
11. FAST
- - ' 1~ - MARK II
. . . . "O ' - ' R.AXIS tt
....... Q ...... X .1000A
, 1 . 1 . i .
~oA soA 33A 2'sA 2oA ,67A Resolution
Fig. 6. Deviation, as a function of resolution, of each myoglobin data set from a reference data set, ( I ) , formed by averaging the scaled intensities common to all five myoglobin data sets.
ranges from 4.5 to 6%. Above 3 A the FAST and X-1000A data deviate slightly from the others.
(d) Anomalous difference Patterson maps
Anomalous difference Patterson maps calculated from each data set are shown in Fig. 7. The location of expected peaks is indicated on the maps which are contoured in levels of tr. Table 5 gives the height of the peaks in terms of tr, where tr was calculated over the values in the map excluding the origin peak. All four maps clearly show the doubly weighted Fe-Fe cross vectors and the main difference is in the regions near the origins, where different types of noise are present. The X-1000A detector shows the most noise near the origin, but also best shows the singly weighted iron-iron cross vector, which is located opposite the origin on the hexagonal arrangement of peaks. The X-1000A frames were processed both with and without using the XDS software package (Kabsch, 1988)• A portion of both maps is displayed in Fig. 7. Both the FAST and Mark II data sets contain scans that did not have e* parallel to the rotation axis. As a result any Bijvoet pairs from these scans would not appear simultaneously on the detector.
Discussion
Because of the widely varying data-collection and data-processing parameters, strict comparisons be- tween detectors will be difficult to make in this report, but some conclusions can be drawn. Perhaps the most
• °
"
(a)
• Y . . - : ' - e • ° .
/ • * " • . ' ° ' " " • 6 " / ; - :/" . . /
"I -/ /. X -, .." "I "/ /. X, , ." "I, "/
7 / / :. i..// . y . . /./ I . . . . . o . • o . • . o
(b) (c)
" , e ' o
,°. • . ° " " "o" .~'~ '
(d)
Fig. 7. Anomalous difference Patterson maps for recombinant myoglobin from data taken on (a) the X-1000A detector (lower left, XENGEN software; upper right, XDS software), (b) the FAST TV detector system, (c) the Mark II detector, and (d) the R-AXIS I1 imaging plate system. All maps used data from 5 to 2,~, resolution. All maps were contoured at increasing intervals of la beginning at 2a, where a is the overall standard deviation of the map excluding the origin peak. All maps clearly show the doubly weighted Fe-Fe cross vectors and the single-weighted vector opposite the origin is visible to varying degrees. The main differences are in the region near the origin where there is evidence of different sources of systematic noise.
KURT L. KRAUSE AND GEORGE N. PHILLIPS JR 153
significant conclusion is that all the detectors produce data of acceptable quality as shown by their excellent Rsy m values, their low R,ca~e values, but most of all by their readily interpretable anomalous difference Patterson maps.
We also conclude that calculation of an anomalous difference Patterson map works well as an overall test of data integrity. It serves as a reasonable model for measuring the weak reflections common in protein crystals because a successful test relies on the ability to measure accurately small differences between Bijvoet pairs. Despite some variation in statistics, all of the detectors passed this test, as all of their anomalous difference Patterson maps were readily interpretable. Accordingly, this result is encouraging for those searching for an area detector and contrasts with unpublished opinion to the contrary.
Statistical analysis of the data we collected suggests that the detectors differ on the average by only a few percent from each other. Differences in crystal quality, software and care in data collection could certainly explain these differences and careful choices in these areas is probably more important than which detector is used to collect data. Based on the Rscal e plots, the I vs ( I ) graphs and the scatter plots, there is little difference between area detectors at resolutions lower than about 3 A. Above 2.5 A, the Mark II detector and the R-AXIS II may perform somewhat better than either the FAST or the X-1000A. The explanation for this is unknown but the Mark II and R-AXIS II data sets did have a higher degree of redundancy than the others at high resolution, and the X-1000A data was collected on a sealed tube, albeit with an l/a~ of almost 50. Attention to problems surrounding the use of area detectors to collect very weak or very high resolution data is beyond the scope of this survey but some references may be helpful (Thomas, 1989, 1990; Tucker, 1989, 1990).
Of all of the statistics we used in this survey, Rsy m values were the least useful. They did not allow for discrimination between the detectors. In fact, all of the Rsy m values reported here are very low when viewed in comparison to the highly replicated film data sets of a decade ago. Perhaps when applied to area detector data sets that contain small numbers of replicates, Rsy m m e a s u r e m e n t s lose some of their value. The number of replicates is certainly critical in interpreting Rsy m statistics. In fact, we performed tests in which we reduced the redundancy of area detector data and we were able to improve the Rsy m values, but anomalous difference Patterson maps calculated with the data were noisier. One way to improve the use of Rsy m measurements would be to develop a standard data-collection test involving a required minimum number of symmetry-related replicates for each reflection. Otherwise the test is probably inadequate.
Overall we feel the minor variations we observed in
detector performance could readily be accounted for by differences in crystal quality or data-collection strategy. It seems likely to us that these kinds of experimental variables rather than any inherent hardware detector characteristics are responsible for the differences we see.
Finally, none of the detector systems is completely without problems in hardware and/or software. Crystallographers expecting a completely automated data-collection system will be disappointed. All the manufacturers are continuing to find bugs and make improvements in both hardware and software. However, a careful researcher should be able to use any of the available detectors to solve and refine protein crystal structures successfully.
Note added in proof: Area detector technology has continued to evolve since the data were collected for this paper. All of the manufacturers have continued to improve their hardware and/or software, and more recent data collected on the same crystal form of myoglobin have resulted in better statistics and cleaner difference Patterson maps in every case in which data have been recollected. In some cases the effect is attributed to harware (FAST), others software (X1000A). and others improved data-collection strategies (SDMS). According to the admittedly limited criteria that we chose for detector perform- ance, however, all of the detectors are still on a par with each other, and the general conclusions of the paper still apply.
We acknowledge the following colleagues for their patience and kind assistance in the preparation of this report: Bram Schierbeek, Jim Phillips and Graheme Williams at Enraf-Nonius; Joe Ferrara, Paul Swepston, Bev Vincent and Jan Troup at Molecular Structure Corporation; and Rich Ortega at Siemens and Andy Howard at Genex. We thank Jim Pflugrath, Flo Quiocho and Ivan Rayment for making their detectors available for the tests. Mitch Miller is acknowledged for help with programming; Ken Johnson and John Spurlino for collecting the San Diego Multiwire Systems data set. This work was partially supported by NIH grants AR32764, AR40252 and DK1928; NSF grant DMB 8716507, a grant from the State of Texas (ARP 3652-245), a grant from the Robert A. Welch Foundation, and a grant from the W. M. Keck Foundation (no. 881016).
References
ARNDT, U. W. (1990). Synchrotron Radiat. News, 3, 17-22. ARNDT, U. W. & FARUQI, A. R. (1977). In The
Rotation Method in Crystallography, edited by U. W. ARNDT & A. J. WONACOTT, pp. 219--226. Amsterdam: North Holland.
154 COMMERCIAL AREA DETECTORS: A 'BUYER'S' PERSPECTIVE
BLUM, M., METCALF, P., HARRISON, S. C. • WILEY, D. C. (1987). J. Appl. Cryst. 20, 235-242.
CHRIST1ANSON, D. W. & LIPSCOMB, W. N. (1988). J. Am. Chem. Soc. ll0, 5560-5565.
DURBIN, R. M., BURNS, R., MOULA1, J., METCALE, P., FREYMANN, D., BLUM, M., ANDERSON, J. E., HARRISON, S. C. (~ WILEY, D. C. (1986). Science, 232, 1127-1132.
HAMLIN, R., CORK, C., HOWARD, A., NIELSEN, C., VERNON, W., MA1"rHEWS, D., XUONG, NG. H. (g~ PEREZ-MENDEZ, V. (1981). J. Appl. Cryst. 14, 85-93.
HIGASUl, T. (1990). PROCESS: a Program for Indexing and Processing R-AXIS II Imaging Plate Data. Rigaku Corp., Tokyo, Japan.
HOWARD, A. J., GILLILAND, G. L. FINZEL, B. C., POULOS, T. L., OHLENDORF, D. H. t~ SALEMME, F. R. (1987). J. Appl. Cryst. 20, 383-387.
KABSCH, W. (1988). J. Appl. Cryst. 21,916-924. MESSERSCHMIDT, A. (~ PFLUGRATH, J. W. (1987). J. Appl.
Cryst. 20, 306-315. Molecular Structure Corporation (1989). TEXSAN. TEX-
RAY Structure Analysis Package. Version 5.0. MSC, 3200A Research Forest Drive, The Woodlands, TX 77381, USA.
PHILLIPS, G. N. JR, ARDUINI, R. M., SPRINGER, B. A. & SLIGAR, S. G. (1990). Proteins, 7, 358-365.
REEKE, G. N. (1984). J. Appl. Cryst. 17, 125-130. ROSE, J. P. & WANG, B.-C. (1990). J. Appl. Cryst. 23,
234-240. SmBATA, A. (1990). Rigaku J. 7, 28-32. STEIGEMANN, W. (1974). PhD thesis, Technische Univ.,
Mfinchen, Germany. THOMAS, D. J. (1989). Proc. R. Soc. London Set. A, 425,
129-167. THOMAS, D. J. (1990). Proc. R. Soc. London Ser. A, 428,
181-214. TUCKER, P. A. (1989). Joint CCP4 and ESF-EACBM
Newsletter on Protein Crystallography, Vol. 24, pp. 47-62. SERC Daresbury Laboratory, Warrington, England.
TUCKER, P. A. (1990). Report DL/SCI/R28. Proc. of CCP4 Study Weekend on Accuracy and Reliability of Macro- molecule Crystal Structures, 26-27 January 1990, Dares- bury Laboratory. SERC Daresbury Laboratory, Warring- ton, England.
WEISSMAN, L. (1982). In Computational Crystallography, edited by D. SAYRE, pp. 56--63. Oxford: Clarendon Press.
![[Welding] Miller Buyer's Guide; Plasma Cutting Buyer's Handbook (eBook, 20 Pages)](https://img.pdfslide.us/doc/110x75/55cf9a94550346d033a2702a/welding-miller-buyers-guide-plasma-cutting-buyers-handbook-ebook.jpg)