Embed Size (px)
Citation preview
OR I G INA L ART I C L E
Experience Shapes the Development of NeuralSubstrates of Face Processing in Human VentralTemporal CortexGolijeh Golarai1, Alina Liberman3 and Kalanit Grill-Spector1,2
1Department of Psychology, Stanford University, 2Neuroscience Institute, Stanford University, Stanford,CA 94305-213, USA and 3University of California, Berkeley, 94720 CA, USA
Address correspondence to Golijeh Golarai. Department of Psychology, Jordan Hall (Bldg. 420), Stanford University, Stanford, CA 94305-213, USA.Email: [email protected]
AbstractIn adult humans, the ventral temporal cortex (VTC) represents faces in a reproducible topology. However, it is unknown whatrole visual experience plays in the development of this topology. Using functional magnetic resonance imaging in children andadults, we found a sequential development, in which the topology of face-selective activations across the VTC was matured byage 7, but the spatial extent anddegree of face selectivity continued to develop past age 7 into adulthood. Importantly, own- andother-age faces were differentially represented, both in the distributed multivoxel patterns across the VTC, and also in themagnitude of responses of face-selective regions. These results provide strong evidence that experience shapes corticalrepresentations of faces during development from childhood to adulthood. Our findings have important implications for therole of experience and age in shaping the neural substrates of face processing in the human VTC.
Key words: development, face-processing, fusiform gyrus, high-level vision, ventral temporal cortex
IntroductionIn adult humans, the ventral temporal cortex (VTC) responds tocomplex visual stimuli, such as faces, objects, and scenes, in acharacteristic spatial organization that is reliable with respectto cortical gyri and sulci. These visual stimuli are representedin two complementary manners across the VTC, namely as (1)distributed patterns of activation across the entire VTC, contain-ing information about the categoricalmembership of visual stim-uli (Haxby et al. 2001; Kriegeskorte et al. 2008), and as (2) regionsthat respond more strongly to stimuli of a particular categorythan others, such as face-selective regions along the fusiformgyrus (FG, Kanwisher et al. 1997). These face-selective regionsconstitute the peaks of distributed face representations acrossthe VTC (Haxby et al. 2001). Furthermore, there is a reliable cor-respondence between large-scale anatomical landmarks andfunctional topology across the VTC, in terms of both regional se-lectivity and distributed responses to visual stimuli (Weiner and
Grill-Spector 2010; Nasr et al. 2011; Weiner et al. 2014). This cor-respondence between structure and function suggests that ana-tomical constraints may play an important role in shaping thefunctional organization of VTC, supporting the idea that thisfunctional topology develops early. In contrast, converging evi-dence suggests that face-selective regions in the FG undergo aslow childhood development (Gathers et al. 2004; Aylward et al.2005; Golarai et al. 2007, 2010; Scherf et al. 2007, 2012; Peelenet al. 2009; Cantlon et al. 2011), which continues well into theteens (Golarai et al. 2010) and is associatedwith an age-related in-crease in the spatial extent of face-selective activations. Thesefindings have raised the possibility that an experience-depend-ent developmental process shapes the functional organizationof VTC. However, two key questions remain. First, does the spa-tial organization of distributed responses to faces or other objectschange during childhood? Second, does visual experience play arole in shaping the development of the distributed representa-tions or face-selective regions in VTC?
© The Author 2015. Published by Oxford University Press. All rights reserved. For Permissions, please e-mail: [email protected]
Cerebral Cortex, 2015, 1–16
doi: 10.1093/cercor/bhv314Original Article
1
Cerebral Cortex Advance Access published December 18, 2015 at Stanford U
niversity on Decem
ber 18, 2015http://cercor.oxfordjournals.org/
Dow
nloaded from
To elucidate the development of functional topology of VTC inresponse to faces and objects, we tested the hypothesis thatchildhood development involves qualitative changes in the spa-tial topology of distributed responses to visual categories. Sup-porting this possibility, some evidence suggests that thecortical location of face-selective regions is different in youngchildren compared with adults. For example, one study foundthat face-selective regions are located outside of the FG in 5–8year olds (Gathers et al. 2004), and another study reported theirabsence in 5–8 year olds (Scherf et al. 2007). According to thishypothesis, qualitative developments in the overall functionaltopology may lead to age-related changes in the distributedrepresentations of visual categories. However, other studiessupport a second hypothesis, in which the topology of VTC re-sponses remains qualitatively stable after age 7. This hypothesisis based on evidence that the anatomical location of face-, object-,and scene-selective regions in children as young as 7 years oldwere similar to adults (Golarai et al. 2007, 2010; Scherf et al.2007, 2012; Peelen et al. 2009; Cantlon et al. 2011). This hypothesispredicts that the spatial extent and magnitude of face selectivityincrease with age, but these developments minimally alter thelarge-scale functional topology of the VTC, as face-selective re-gions constitute only a small portion of the surface area of theVTC. A third possibility is that in the absence of large-scale topo-logical differences across age groups, even subtle developmentalchanges in the functional topologymight alter the category infor-mation content of distributed responses in the VTC.
Another goal of our study was to examine the role of experi-ence in shaping the functional organization of the VTC andparticularly face processing. This poses a challenge, as both cu-mulative experience and maturational processes contribute todevelopment, and it is not feasible to manipulate children’sexperience with faces over long periods. Instead, we sought touse normal variations in the social milieu, and thus exposureto different types of faces during the life-span to test theeffects of experience on the development of face processing inthe VTC (Cassia et al. 2009; Harrison and Hole 2009; Hills andLewis 2011).
One possibility is that relatively recent experience with own-age faces plays a key role in shaping the functional organizationof the VTC. Supporting a role for experience, a recent study ofjuvenile macaque infero-temporal cortex found a spatial segre-gation of regions selective for natural versus cartoon faces afterintense training with cartoon faces (Srihasam et al. 2012, 2014).In humans, experience with own-age faces may show moreprominent effects in adults, who have many more years ofexperience with adult faces, than in children whose own-agecohorts span only a few years. Neurally, these experience-dependent effects may manifest in the VTC in 3 ways that arenot mutually exclusive: (1) as different distributed responses toown- versus other-age faces, (2) in the spatial segregation of re-gions selective for own- versus other-age faces, and (3) in differ-ent amplitudes of responses to own- versus other-age faces inregions with overlapping selectivity for both face subtypes.
A second possibility is that maturation dominates the func-tional development of VTC. This hypothesis predicts thatage-related changes in the functional organization or responseproperties of theVTCwill be similar for own- and other-age faces.
A third possibility is that both experience-dependent and ex-perience-independent neural mechanisms shape the functionalproperties of the VTC, where each type of mechanism differen-tially shapes the functional attributes of distributed responsesacross the VTC or local responses of category-selective regions.This hypothesis predicts that some representations in the VTC
are shaped by experience-dependent mechanisms and, othersby experience-independent mechanisms.
Here, we used functional magnetic resonance imaging (fMRI)to examine the development of functional organization in VTCfrom childhood to adulthood and elucidate the contributions ofmaturation and experience-dependent mechanisms. Children(ages 7–11 years old) and adults (ages 18–40 years old) underwentfMRI as they viewed images of own- and other-age faces, cars andnovel objects, as well as scenes and textures (Fig. 1A). Across theVTC, we examined the development of distributed multivoxelpatterns (MVPs) of responses to faces, objects, and scenes, aswell as the development of face-selective regions in the FG. Totest the effects of recent versus cumulative experience on the de-velopment of VTC, we compared responses to subtypes of faces(own- vs. other-ages) and objects (cars vs. novel objects), withwhich subjects had varying levels of prior experience. We ex-pected that maturation would lead to age-related changes inde-pendent of stimulus subtype, while experience-related changeswould lead to interactions between age of subject and age offaces (or types of objects), depending on the duration of subjects’prior experience.
Materials and MethodsSubjects
A total of 25 children, ages 7–11 years, and 13 adults, ages 18–40years, participated in our experiments. Thirteen of 25 childrenand 1 of 13 adults were excluded from data analysis due to exces-sive motion during fMRI. The remaining subjects were matchedacross age groups on the quality of blood–oxygen-level-dependent(BOLD) signals (Fig. B–G). Thus, data from 12 children (ages 7–11,7 females), and 12 adults (ages 18–40, 6 females) are reported inthis study.
Subjects had normal or corrected vision with no past orcurrent neurological or psychiatric conditions. Children were re-cruited from the Palo Alto school districts through advertise-ments in school newspapers, and attended local public schoolsat the time of study. Adult subjects were university affiliatesand were not engaged with children in their daily work at thetime of the experiment. Only 2 of 12 adult participants were par-ents (living with their children who were >5 year olds). Informedconsent was obtained according to the requirements of the Panelon Human Subjects in Medical Research at Stanford University.Children were invited to a practice session to exercise motioncontrol in a simulated scanner environment. All subjects wereacclimated to the scanner before fMRI by first participating inanatomical MRI.
Scanning
MRI data were acquired on a 3 Tesla whole-body General ElectricSigna MRI scanner (General Electric, Milwaukee, WI) at the LucasImaging Center at Stanford University.
Structural MRIUsing a head coil we acquired 4 whole-brain anatomical scansusing 3D Fast SPGR, 166 sagittal slices, 0.938 mm× 0.938 mm,1.5 mm slice thickness, and 256 × 256 image matrix.
Functional MRIUsing an 8-channel surface coil (NovaMedical, www.novamedical.com), we acquired functional images applying T2*-sensitive gradi-ent echo spiral pulse sequence (Glover 1999) across 32 slices,
2 | Cerebral Cortex
at Stanford University on D
ecember 18, 2015
http://cercor.oxfordjournals.org/D
ownloaded from
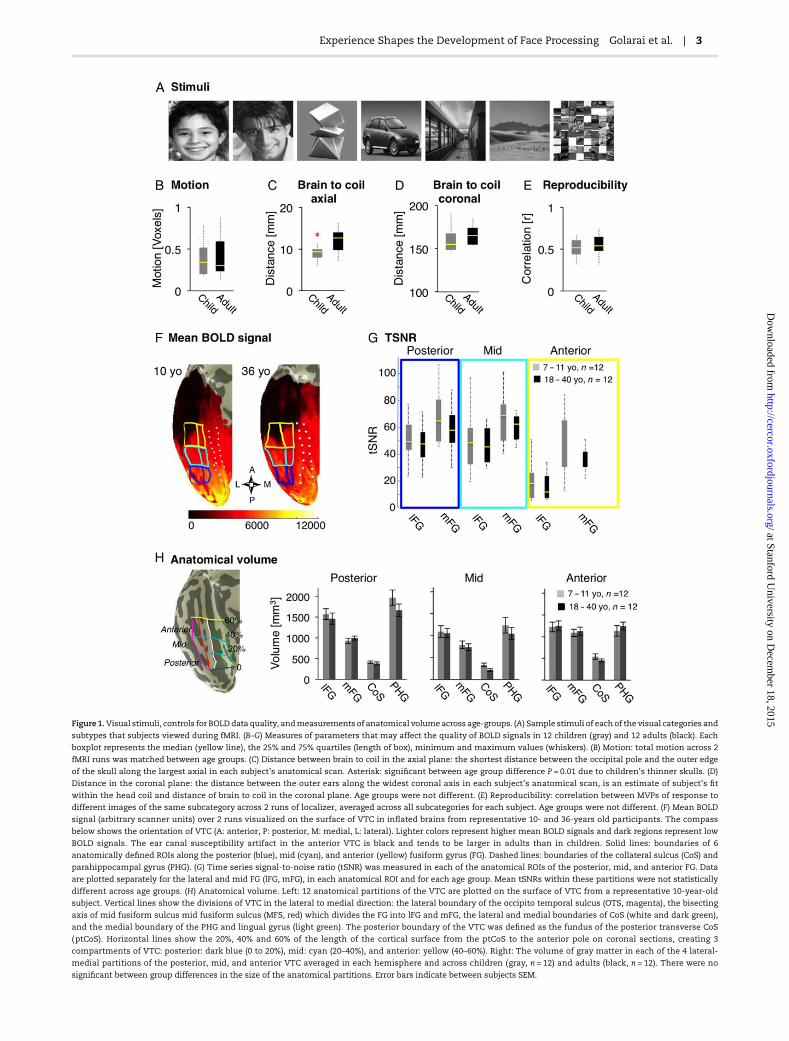
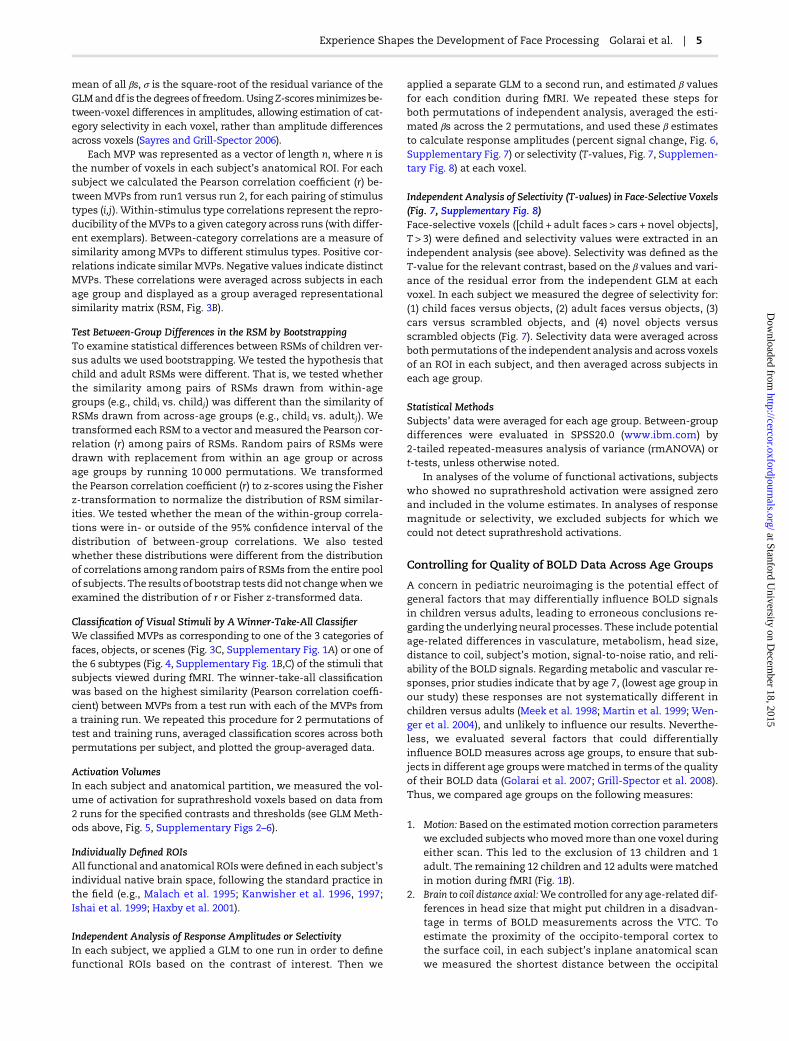
Figure1.Visual stimuli, controls for BOLDdata quality, andmeasurements of anatomical volume across age-groups. (A) Sample stimuli of eachof the visual categories and
subtypes that subjects viewed during fMRI. (B–G) Measures of parameters that may affect the quality of BOLD signals in 12 children (gray) and 12 adults (black). Each
boxplot represents the median (yellow line), the 25% and 75% quartiles (length of box), minimum and maximum values (whiskers). (B) Motion: total motion across 2
fMRI runs was matched between age groups. (C) Distance between brain to coil in the axial plane: the shortest distance between the occipital pole and the outer edge
of the skull along the largest axial in each subject’s anatomical scan. Asterisk: significant between age group difference P = 0.01 due to children’s thinner skulls. (D)
Distance in the coronal plane: the distance between the outer ears along the widest coronal axis in each subject’s anatomical scan, is an estimate of subject’s fit
within the head coil and distance of brain to coil in the coronal plane. Age groups were not different. (E) Reproducibility: correlation between MVPs of response to
different images of the same subcategory across 2 runs of localizer, averaged across all subcategories for each subject. Age groups were not different. (F) Mean BOLD
signal (arbitrary scanner units) over 2 runs visualized on the surface of VTC in inflated brains from representative 10- and 36-years old participants. The compass
below shows the orientation of VTC (A: anterior, P: posterior, M: medial, L: lateral). Lighter colors represent higher mean BOLD signals and dark regions represent low
BOLD signals. The ear canal susceptibility artifact in the anterior VTC is black and tends to be larger in adults than in children. Solid lines: boundaries of 6
anatomically defined ROIs along the posterior (blue), mid (cyan), and anterior (yellow) fusiform gyrus (FG). Dashed lines: boundaries of the collateral sulcus (CoS) and
parahippocampal gyrus (PHG). (G) Time series signal-to-noise ratio (tSNR) was measured in each of the anatomical ROIs of the posterior, mid, and anterior FG. Data
are plotted separately for the lateral and mid FG (lFG, mFG), in each anatomical ROI and for each age group. Mean tSNRs within these partitions were not statistically
different across age groups. (H) Anatomical volume. Left: 12 anatomical partitions of the VTC are plotted on the surface of VTC from a representative 10-year-old
subject. Vertical lines show the divisions of VTC in the lateral to medial direction: the lateral boundary of the occipito temporal sulcus (OTS, magenta), the bisecting
axis of mid fusiform sulcus mid fusiform sulcus (MFS, red) which divides the FG into lFG and mFG, the lateral and medial boundaries of CoS (white and dark green),
and the medial boundary of the PHG and lingual gyrus (light green). The posterior boundary of the VTC was defined as the fundus of the posterior transverse CoS
(ptCoS). Horizontal lines show the 20%, 40% and 60% of the length of the cortical surface from the ptCoS to the anterior pole on coronal sections, creating 3
compartments of VTC: posterior: dark blue (0 to 20%), mid: cyan (20–40%), and anterior: yellow (40–60%). Right: The volume of gray matter in each of the 4 lateral-
medial partitions of the posterior, mid, and anterior VTC averaged in each hemisphere and across children (gray, n = 12) and adults (black, n = 12). There were no
significant between group differences in the size of the anatomical partitions. Error bars indicate between subjects SEM.
Experience Shapes the Development of Face Processing Golarai et al. | 3
at Stanford University on D
ecember 18, 2015
http://cercor.oxfordjournals.org/D
ownloaded from
oriented perpendicular to the calcarine sulcus and extending fromthe occipital pole to the anterior temporal lobe (time repetition[TR] = 2000 ms, time echo = 30ms, flip angle = 76°, field of view =200 mm, resolution: 3.125 × 3.125 × 3 mm). Applying the sameslice prescription, we acquired anatomical T1-weighted images toregister each subject’s functional data to their whole-brainanatomy.
Visual PresentationImages were projected onto a screen and viewed via a mirrormounted on the fMRI coil (visual angle = 15°). Images were pre-sented and responseswere recorded via aMacbook Pro usingMa-tlab (Mathworks) and Psychtoolbox (www.psychtoolbox.org).
Visual StimuliStimuli consisted of gray-scale images of frontal view of malefaces (school aged children, and young adults, all faces were Cau-casian, with a uniform happy or neutral expression, minimal fa-cial hair, without glasses or jewelry), novel objects (abstractsculptures), common cars (all modern makes), indoor scenes,outdoor scenes (all devoid of people, animals, or salient objects),and scrambled images (created by randomly scrambling picturesinto 225, 8 × 8 pixel squares, Fig. 1A).
Face images were collected from advertising web sites formodels, andwerematched for distinctiveness and attractivenessby 4 adult observers. We used male faces based on the assump-tion that most children have lower exposure to male adults inthe role of nonparental caretakers or school teachers. Additional-ly, we aimed to reduce gender effects, as some behavioral studiessuggest that females have better face recognition memory com-pared with males due to their selectively better recognitionmemory for female faces (Lewin and Herlitz 2002).
Pixel-wise similarity (Grill-Spector et al. 1999) of image sub-types between the 2 runs were not different across face stimuli(child faces: 0.30 ± 0.01; adult faces: 0.30 ± 0.01) and scenes (indoorscenes 0.36 ± 0.01, outdoor scenes 0.35 ± 0.01; mean ± SEM), butcar images were more similar to each other than images ofnovel objects were to each other (cars: 0.42 ± 0.01, novel objects0.21 ± 0.01).
fMRI ExperimentDuring fMRI, stimuli were presented at 1 Hz in 12 s blocks ofimages from a single subcategory, alternating with 12 s of ablank screen with a fixation. Subjects participated in two 396 sruns and viewed a total of 4 blocks per subcategory. Each imagewas presented once, except for random image pairs that repeatedsuccessively within a block (∼17% of images).
1-Back Task. Subjects were instructed to fixate on a central redpoint and press a button when images repeated successively.Due to occasional button box malfunction, behavioral datawere obtained in 9/12 children and 10/12 adults.
Analysis of Imaging Data
Data were analyzed with Matlab and our in-house software,mrVista (white.stanford.edu/software).
Structural MRI
In each subject high-resolution anatomical whole-brain imagesfrom 4 scans were averaged into one volume. Using ITK-SNAP(white.stanford.edu/software), white and gray matter were seg-mented. The cortical surface was grown to include 4 mm of
gray matter, creating a uniform gray matter thickness. Thusany variations in the volume of gray matter measurements inour study reflect variations in cortical surface area.
Anatomical Partitions of the VTCAnatomical partitionswere individually defined in each subject’snative space as shown in Figure 1H. The VTC was defined as a re-gion between the lateral border of the occipito-temporal sulcus(OTS), the medial border of the parahippocampal gyrus (PHG) ex-tending to the lingual gyrus, and the fundus of the posteriortransverse collateral sulcus (ptCoS). The ptCoS reliably marksthe anterior edge of hV4 (Witthoft et al. 2014), thus excludingearly retinotopic visual areas (V1-hV4) from the VTC. We subdi-vided the VTC into a total of 12 partitions. In the lateral to medialdirection these partitionswere: (1) the lateral fusiform gyrus (lFG)extending from the OTS to a line bisecting the midfusiform sul-cus (MFS, (Nasr et al. 2011; Weiner et al. 2014)); (2) the medialFG (mFG), from the bisecting line of MFS to the lateral edge ofthe CoS, (3) the collateral sulcus (CoS) and (4) the PHG. Then wesubdivided each of these partitions from posterior to anterioralong the 20%, 40%, and 60% length of the VTC measured fromthe ptCoS to the temporal pole. The 40% boundary of the VTC co-incided with the posterior limit of the hippocampal gyrus in bothchildren and adults. Anatomical regions of interest (ROIs) werecreated by GG and validated by KGS.
Therewere no between age-group differences in the total vol-ume of the right or left VTC or any of their partitions (P > 0.3), des-pite some trends towards “larger” volumes in children in somepartitions (Fig. 1H). Also, the volume of the left VTC was largerin males than in females (t(22) = 2.86, P = 0.009, t-test, data notshown), but there were no interactions among age and gender(P > 0.18) in the volume of the right or left VTC.
Functional MRI
PreprocessingFMRI datawere analyzed in each subjects’ native brain space. Foreach subject, fMRI data were aligned to the 3D whole-brain vol-ume and motion corrected. Data were detrended using a tem-poral high-pass filter with a 1/20 Hz cutoff. The time course ofeach voxel was converted to percent signal change by dividingits response amplitude at each TR by its mean amplitude acrossthe time course. Data were not spatially smoothed.
General Linear ModelWeused a standard general linearmodel (GLM) to generate voxel-by-voxel activation maps. Predictors were the stimulus con-ditions convolved with the hemodynamic impulse responsefunction used in SPM (http://www.fil.ion.ucl.ac.uk/spm/). We es-timated the beta coefficients for each stimulus category from aGLM applied to the preprocessed BOLD time series.We calculatedseveral GLMs in each subject: (1) GLM of data from each run forMVP analyses (Figs 3 and 4, Supplementary Fig. 1), as well as in-dependent analyses of response amplitudes (Fig. 6, Supplemen-tary Fig. 7) and selectivity (Fig. 7) and (2) GLMusing data frombothruns to visualize activation maps and measure their volumes(Fig. 5, Supplementary Figs 2–6).
MVP AnalysesWedetermined theMVPs to each stimulus typewithin the anatom-ical boundaries of VTC separately for data from Run 1 and Run 2(Fig. 3A) by calculatingat eachvoxel the relative responseamplitudeto each stimulus type (1) as Z- score = (βi � EðβÞ=ðσ=
ffiffiffiffiffi
dfp
ÞÞ;where βiis the β coefficient from the GLM for the ith stimulus, E(β) is the
4 | Cerebral Cortex
at Stanford University on D
ecember 18, 2015
http://cercor.oxfordjournals.org/D
ownloaded from
mean of all βs, σ is the square-root of the residual variance of theGLManddf is the degrees of freedom.UsingZ-scoresminimizes be-tween-voxel differences in amplitudes, allowing estimation of cat-egory selectivity in each voxel, rather than amplitude differencesacross voxels (Sayres and Grill-Spector 2006).
Each MVP was represented as a vector of length n, where n isthe number of voxels in each subject’s anatomical ROI. For eachsubject we calculated the Pearson correlation coefficient (r) be-tween MVPs from run1 versus run 2, for each pairing of stimulustypes (i,j). Within-stimulus type correlations represent the repro-ducibility of theMVPs to a given category across runs (with differ-ent exemplars). Between-category correlations are a measure ofsimilarity among MVPs to different stimulus types. Positive cor-relations indicate similar MVPs. Negative values indicate distinctMVPs. These correlations were averaged across subjects in eachage group and displayed as a group averaged representationalsimilarity matrix (RSM, Fig. 3B).
Test Between-Group Differences in the RSM by BootstrappingTo examine statistical differences between RSMs of children ver-sus adults we used bootstrapping. We tested the hypothesis thatchild and adult RSMs were different. That is, we tested whetherthe similarity among pairs of RSMs drawn from within-agegroups (e.g., childi vs. childj) was different than the similarity ofRSMs drawn from across-age groups (e.g., childi vs. adultj). Wetransformed each RSM to a vector andmeasured the Pearson cor-relation (r) among pairs of RSMs. Random pairs of RSMs weredrawn with replacement from within an age group or acrossage groups by running 10 000 permutations. We transformedthe Pearson correlation coefficient (r) to z-scores using the Fisherz-transformation to normalize the distribution of RSM similar-ities. We tested whether the mean of the within-group correla-tions were in- or outside of the 95% confidence interval of thedistribution of between-group correlations. We also testedwhether these distributions were different from the distributionof correlations among random pairs of RSMs from the entire poolof subjects. The results of bootstrap tests did not changewhenweexamined the distribution of r or Fisher z-transformed data.
Classification of Visual Stimuli by AWinner-Take-All ClassifierWe classified MVPs as corresponding to one of the 3 categories offaces, objects, or scenes (Fig. 3C, Supplementary Fig. 1A) or one ofthe 6 subtypes (Fig. 4, Supplementary Fig. 1B,C) of the stimuli thatsubjects viewed during fMRI. The winner-take-all classificationwas based on the highest similarity (Pearson correlation coeffi-cient) between MVPs from a test run with each of the MVPs froma training run. We repeated this procedure for 2 permutations oftest and training runs, averaged classification scores across bothpermutations per subject, and plotted the group-averaged data.
Activation VolumesIn each subject and anatomical partition, we measured the vol-ume of activation for suprathreshold voxels based on data from2 runs for the specified contrasts and thresholds (see GLM Meth-ods above, Fig. 5, Supplementary Figs 2–6).
Individually Defined ROIsAll functional and anatomical ROIswere defined in each subject’sindividual native brain space, following the standard practice inthe field (e.g., Malach et al. 1995; Kanwisher et al. 1996, 1997;Ishai et al. 1999; Haxby et al. 2001).
Independent Analysis of Response Amplitudes or SelectivityIn each subject, we applied a GLM to one run in order to definefunctional ROIs based on the contrast of interest. Then we
applied a separate GLM to a second run, and estimated β valuesfor each condition during fMRI. We repeated these steps forboth permutations of independent analysis, averaged the esti-mated βs across the 2 permutations, and used these β estimatesto calculate response amplitudes (percent signal change, Fig. 6,Supplementary Fig. 7) or selectivity (T-values, Fig. 7, Supplemen-tary Fig. 8) at each voxel.
Independent Analysis of Selectivity (T-values) in Face-Selective Voxels(Fig. 7, Supplementary Fig. 8)Face-selective voxels ([child + adult faces > cars + novel objects],T > 3) were defined and selectivity values were extracted in anindependent analysis (see above). Selectivity was defined as theT-value for the relevant contrast, based on the β values and vari-ance of the residual error from the independent GLM at eachvoxel. In each subject we measured the degree of selectivity for:(1) child faces versus objects, (2) adult faces versus objects, (3)cars versus scrambled objects, and (4) novel objects versusscrambled objects (Fig. 7). Selectivity data were averaged acrossboth permutations of the independent analysis and across voxelsof an ROI in each subject, and then averaged across subjects ineach age group.
Statistical MethodsSubjects’ data were averaged for each age group. Between-groupdifferences were evaluated in SPSS20.0 (www.ibm.com) by2-tailed repeated-measures analysis of variance (rmANOVA) ort-tests, unless otherwise noted.
In analyses of the volume of functional activations, subjectswho showed no suprathreshold activation were assigned zeroand included in the volume estimates. In analyses of responsemagnitude or selectivity, we excluded subjects for which wecould not detect suprathreshold activations.
Controlling for Quality of BOLD Data Across Age Groups
A concern in pediatric neuroimaging is the potential effect ofgeneral factors that may differentially influence BOLD signalsin children versus adults, leading to erroneous conclusions re-garding the underlying neural processes. These include potentialage-related differences in vasculature, metabolism, head size,distance to coil, subject’s motion, signal-to-noise ratio, and reli-ability of the BOLD signals. Regarding metabolic and vascular re-sponses, prior studies indicate that by age 7, (lowest age group inour study) these responses are not systematically different inchildren versus adults (Meek et al. 1998; Martin et al. 1999; Wen-ger et al. 2004), and unlikely to influence our results. Neverthe-less, we evaluated several factors that could differentiallyinfluence BOLD measures across age groups, to ensure that sub-jects in different age groupswerematched in terms of the qualityof their BOLD data (Golarai et al. 2007; Grill-Spector et al. 2008).Thus, we compared age groups on the following measures:
1. Motion: Based on the estimatedmotion correction parameterswe excluded subjects whomovedmore than one voxel duringeither scan. This led to the exclusion of 13 children and 1adult. The remaining 12 children and 12 adults werematchedin motion during fMRI (Fig. 1B).
2. Brain to coil distance axial:Wecontrolled for any age-related dif-ferences in head size that might put children in a disadvan-tage in terms of BOLD measurements across the VTC. Toestimate the proximity of the occipito-temporal cortex tothe surface coil, in each subject’s inplane anatomical scanwe measured the shortest distance between the occipital
Experience Shapes the Development of Face Processing Golarai et al. | 5
at Stanford University on D
ecember 18, 2015
http://cercor.oxfordjournals.org/D
ownloaded from
pole and the outer edge of the skull (Fig. 1C). The brain-to-coildistance was significantly higher in adults than in children(t(22) = 2.89, P = 0.01; t-test) due to thicker skull and dura inadults. Thus, children’s’ brains were on average closer to thesurface coil, resulting in a trend towards higher mean BOLDsignals than adults (see below).
3. Brain to coil distance coronal:We estimated the proximity of thelateral cortex to the surface coil by measuring the shortestdistance between the outer edges of the 2 ear canals in eachsubject from their in-plane anatomical scans. We found nobetween-group differences (Fig. 1D). Given that we used thesame surface coil for all subjects in the study, these ear-to-ear measurements give a reliable (albeit indirect) estimatefor the distance between brain to coil in the coronal axis.
4. Mean BOLD signals in VTC: To test for any differences acrossage-groups in (1) the spatial distortions caused by the earcanal artifact and (2) the overall mean signal, we measuredin each subject the mean BOLD signal at each voxel, visua-lized signals on the cortical surface (Fig. 1F, example subjects),and calculated the averagemean signal in each of the 12 ana-tomical partitions of the VTC in each subject. Then, we com-pared thesemeanBOLD signalmeasures across age groups. Ingeneral, the ear canal artifact was not different or smaller inchildren than in adults. Furthermore, mean BOLD signalswere significantly higher in children’s VTC than in adults’, es-pecially in the lateral and anterior VTC partitions in bothhemispheres (right and left VTC: age of subject: F1,110 > 25.48,P < 0.0001; age of subject X partition: F5,110 > 10.27, P < 0.004;2-way rmANOVA, data not shown). Highermean BOLD signalsin children than in adults, indicates that our use of surfacecoil put children at an advantage in terms of BOLD measure-ments across the VTC.
5. Time series signal-to-noise ratio (tSNR): tSNR during the blankbaseline period was measured at each voxel as the mean sig-nal divided by the standard deviation of the time series. Theaverage tSNR across voxels were not significantly differentacross age groups (right and left VTC: age of subject: F < 1.18,P > 0.2, Fig. 1G). However, we found tSNR differences acrossVTC partitions (right and left VTC: partition: F > 17.4, P <0.0001, Fig. 1G), as the susceptibility artifact around the earcanal significantly reduced tSNR in the anterior FG (Fig. 1F).Thus, we excluded the anterior VTC from further analyses,as it was below the minimal tSNR of 35, as previously sug-gested (Murphy et al. 2007).
6. Reproducibility of MVPs across runs: We tested the reproducibil-ity of MVPs (based on the average Pearson correlation ofMVPs) across different images of the same subcategory across
2 runs. We found no significant differences across age groups(t(22) < 1.9, P > 0.1, t-test, Fig. 1E).
ResultsThe Quality of BOLD Signals During fMRI and Accuracy inthe 1-Back Task are not Different Across Age Groups
We examined the development of VTC responses to faces, ob-jects, and scenes across children and adults while subjectsviewed images of these categories in blocks and performed a1-back task (Fig. 1A, Materials and Methods). There were no sig-nificant differences among age groups in motion during fMRI,proximity to coil, reproducibility of distributed fMRI responses,or tSNR (Fig. 1B–G). Likewise, the volume of gray matter in theVTC was not significantly different across age groups (Fig. 1H).Thesemeasurements indicate that the quality of BOLDmeasure-ments were similar across age groups (Materials and Methods).
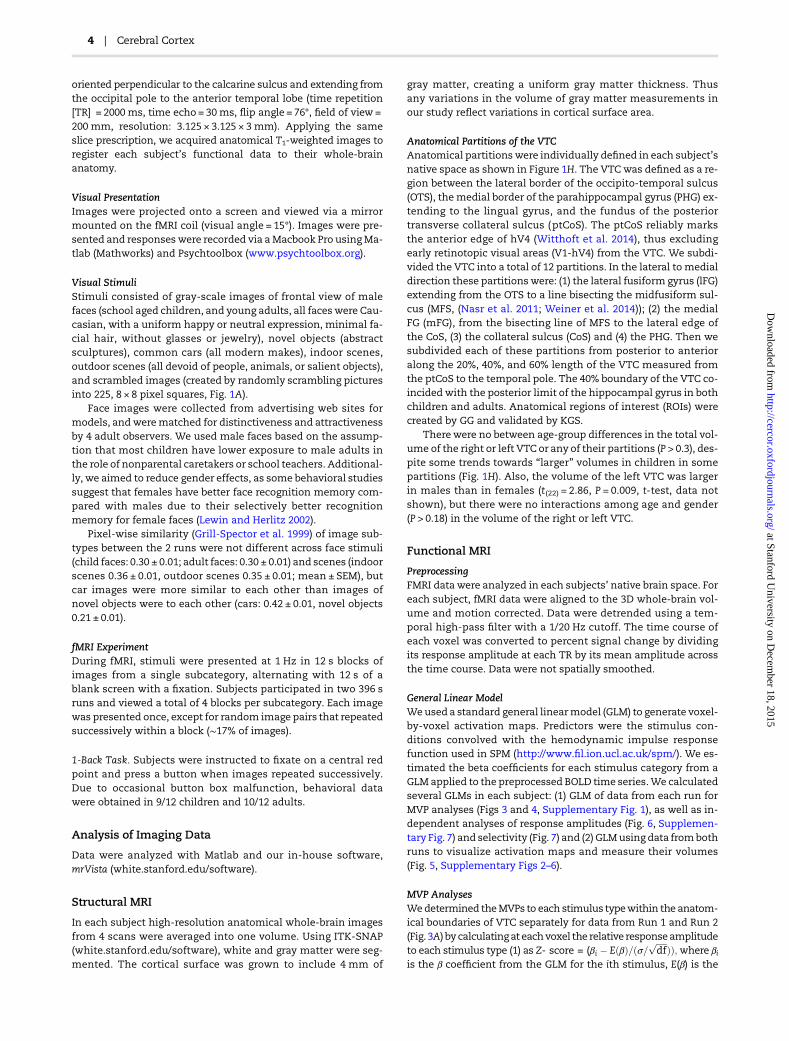
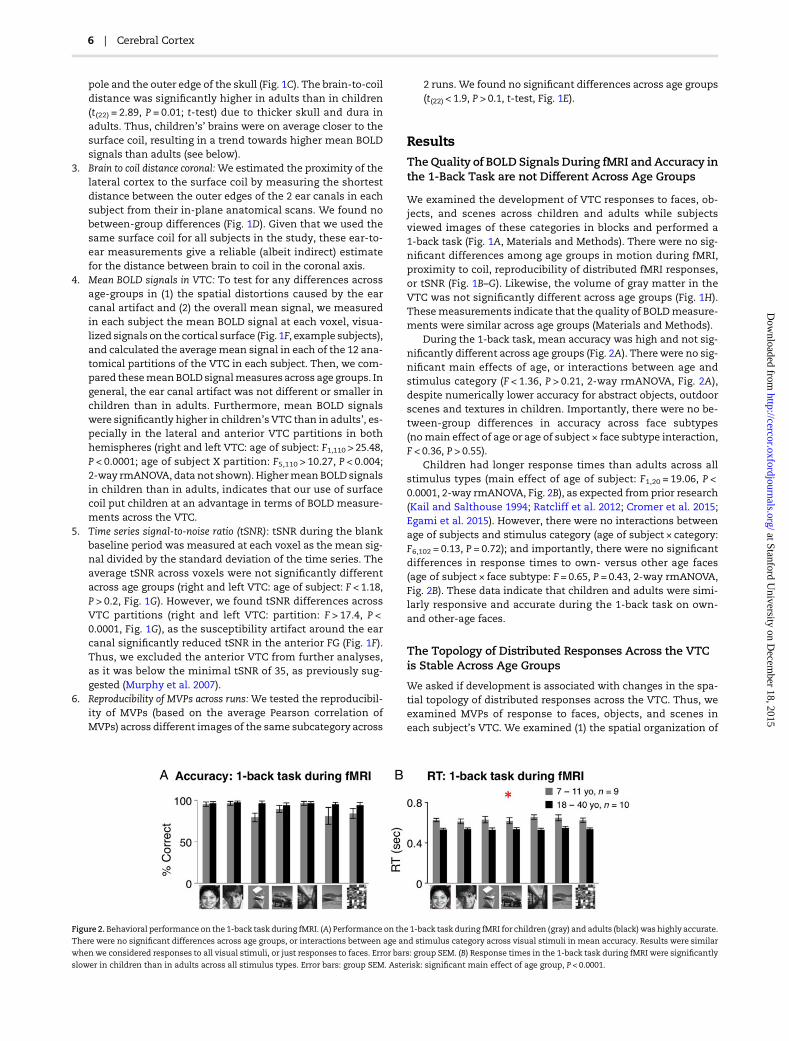
During the 1-back task, mean accuracy was high and not sig-nificantly different across age groups (Fig. 2A). Therewere no sig-nificant main effects of age, or interactions between age andstimulus category (F < 1.36, P > 0.21, 2-way rmANOVA, Fig. 2A),despite numerically lower accuracy for abstract objects, outdoorscenes and textures in children. Importantly, there were no be-tween-group differences in accuracy across face subtypes(nomain effect of age or age of subject × face subtype interaction,F < 0.36, P > 0.55).
Children had longer response times than adults across allstimulus types (main effect of age of subject: F1,20 = 19.06, P <0.0001, 2-way rmANOVA, Fig. 2B), as expected from prior research(Kail and Salthouse 1994; Ratcliff et al. 2012; Cromer et al. 2015;Egami et al. 2015). However, there were no interactions betweenage of subjects and stimulus category (age of subject × category:F6,102 = 0.13, P = 0.72); and importantly, there were no significantdifferences in response times to own- versus other age faces(age of subject × face subtype: F = 0.65, P = 0.43, 2-way rmANOVA,Fig. 2B). These data indicate that children and adults were simi-larly responsive and accurate during the 1-back task on own-and other-age faces.
The Topology of Distributed Responses Across the VTCis Stable Across Age Groups
We asked if development is associated with changes in the spa-tial topology of distributed responses across the VTC. Thus, weexamined MVPs of response to faces, objects, and scenes ineach subject’s VTC. We examined (1) the spatial organization of
Figure 2. Behavioral performance on the 1-back task during fMRI. (A) Performance on the 1-back task during fMRI for children (gray) and adults (black) was highly accurate.
There were no significant differences across age groups, or interactions between age and stimulus category across visual stimuli in mean accuracy. Results were similar
when we considered responses to all visual stimuli, or just responses to faces. Error bars: group SEM. (B) Response times in the 1-back task during fMRI were significantly
slower in children than in adults across all stimulus types. Error bars: group SEM. Asterisk: significant main effect of age group, P < 0.0001.
6 | Cerebral Cortex
at Stanford University on D
ecember 18, 2015
http://cercor.oxfordjournals.org/D
ownloaded from
these MVPs with respect to major anatomical landmarks of VTC,and (2) the information content of these MVPs.
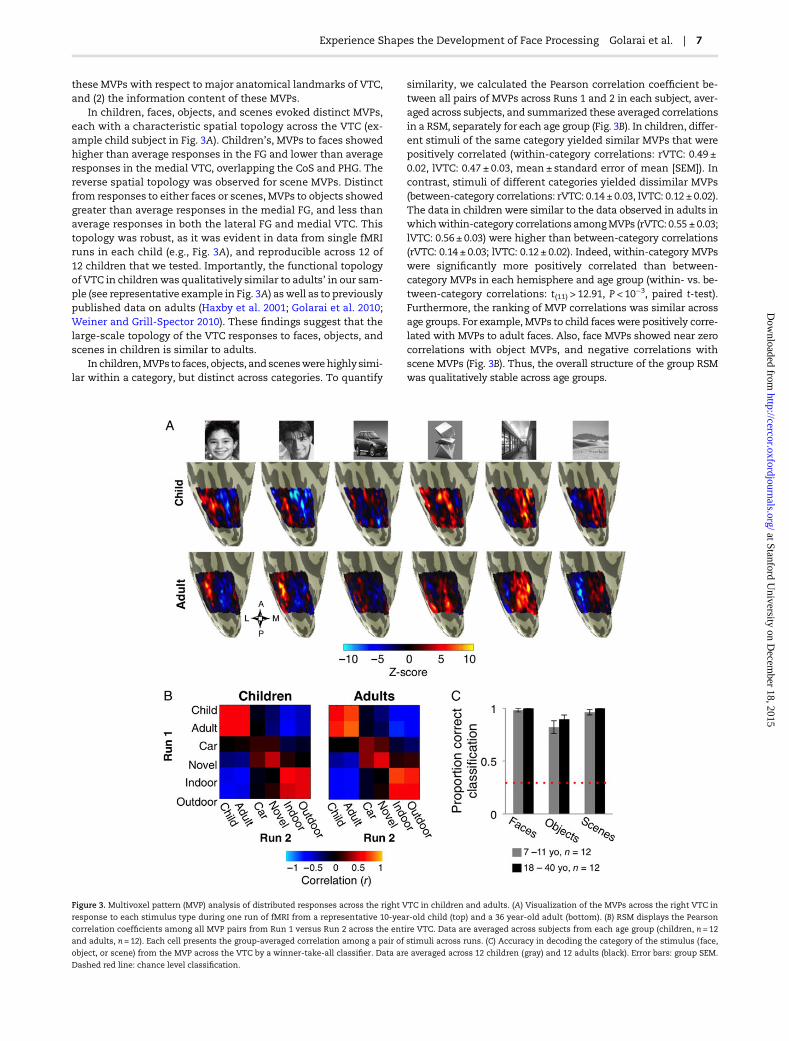
In children, faces, objects, and scenes evoked distinct MVPs,each with a characteristic spatial topology across the VTC (ex-ample child subject in Fig. 3A). Children’s, MVPs to faces showedhigher than average responses in the FG and lower than averageresponses in the medial VTC, overlapping the CoS and PHG. Thereverse spatial topology was observed for scene MVPs. Distinctfrom responses to either faces or scenes, MVPs to objects showedgreater than average responses in the medial FG, and less thanaverage responses in both the lateral FG and medial VTC. Thistopology was robust, as it was evident in data from single fMRIruns in each child (e.g., Fig. 3A), and reproducible across 12 of12 children that we tested. Importantly, the functional topologyof VTC in childrenwas qualitatively similar to adults’ in our sam-ple (see representative example in Fig. 3A) aswell as to previouslypublished data on adults (Haxby et al. 2001; Golarai et al. 2010;Weiner and Grill-Spector 2010). These findings suggest that thelarge-scale topology of the VTC responses to faces, objects, andscenes in children is similar to adults.
In children,MVPsto faces, objects, and sceneswerehighlysimi-lar within a category, but distinct across categories. To quantify
similarity, we calculated the Pearson correlation coefficient be-tween all pairs of MVPs across Runs 1 and 2 in each subject, aver-aged across subjects, and summarized these averaged correlationsin a RSM, separately for each age group (Fig. 3B). In children, differ-ent stimuli of the same category yielded similar MVPs that werepositively correlated (within-category correlations: rVTC: 0.49 ±0.02, lVTC: 0.47 ± 0.03, mean ± standard error of mean [SEM]). Incontrast, stimuli of different categories yielded dissimilar MVPs(between-category correlations: rVTC: 0.14 ± 0.03, lVTC: 0.12 ± 0.02).The data in children were similar to the data observed in adults inwhichwithin-category correlations amongMVPs (rVTC: 0.55 ± 0.03;lVTC: 0.56 ± 0.03) were higher than between-category correlations(rVTC: 0.14 ± 0.03; lVTC: 0.12 ± 0.02). Indeed, within-category MVPswere significantly more positively correlated than between-category MVPs in each hemisphere and age group (within- vs. be-tween-category correlations: t(11) > 12.91, P < 10−3, paired t-test).Furthermore, the ranking of MVP correlations was similar acrossage groups. For example, MVPs to child faces were positively corre-lated with MVPs to adult faces. Also, face MVPs showed near zerocorrelations with object MVPs, and negative correlations withscene MVPs (Fig. 3B). Thus, the overall structure of the group RSMwas qualitatively stable across age groups.
Figure 3. Multivoxel pattern (MVP) analysis of distributed responses across the right VTC in children and adults. (A) Visualization of the MVPs across the right VTC in
response to each stimulus type during one run of fMRI from a representative 10-year-old child (top) and a 36 year-old adult (bottom). (B) RSM displays the Pearson
correlation coefficients among all MVP pairs from Run 1 versus Run 2 across the entire VTC. Data are averaged across subjects from each age group (children, n = 12
and adults, n = 12). Each cell presents the group-averaged correlation among a pair of stimuli across runs. (C) Accuracy in decoding the category of the stimulus (face,
object, or scene) from the MVP across the VTC by a winner-take-all classifier. Data are averaged across 12 children (gray) and 12 adults (black). Error bars: group SEM.
Dashed red line: chance level classification.
Experience Shapes the Development of Face Processing Golarai et al. | 7
at Stanford University on D
ecember 18, 2015
http://cercor.oxfordjournals.org/D
ownloaded from
The relative magnitudes of between-category correlationsreflected the spatial topology of MVPs in both age groups. In chil-dren, the correlation between face- and object-MVPs was higherthan the correlation between face- and scene-MVPs. This rankordering of correlations was similar to adults’, and tracked thetopological organization of distributed responses across theVTC along its lateral-to-medial axis. That is, the peak responsesto faces and objects were proximal, but the peak responses tofaces and scenes were more widely separated (Fig. 3A). Thus, adevelopmentally stable large-scale functional topology of distrib-uted VTC response to faces, objects, and scenes was associatedwith a qualitatively stable structure of the RSM for these categor-ies across age groups.
To test for quantitative differences in the functional top-ology across age groups, we measured the similarity betweenRSMs among pairs of subjects within or across age groups in aseries of bootstrap tests (see Materials and Methods). We rea-soned that if development involves changes in RSMs, pairs ofRSMs drawn from within an age group would be more similarthan pairs drawn from across age groups. We found that the dis-tribution of Fisher z-transformed Pearson correlations amongpairs of RSMs drawn from within-age groups versus RSMsdrawn from between-age groups were highly overlapping andthus statistically indistinguishable (within-age group: rVTC:children: 1.25 [0.73–2.07], mean [95% confidence interval ofz-scores], adults: 1.45 [1.03–1.89]; lVTC: children: 1.20 [0.80–1.67], adults: 1.42 [0.92–2.00], between-age groups: rVTC: 1.33[0.80–1.94], lVTC: 1.30 [0.88–1.79]). Likewise, we expected thatlarge-scale developmental changes in RSMs would lead to alower similarity between pairs of RSMs drawn across age groupsthan random pairs of RSMs from the entire pool of subjects.However, we found that themean of between-age group correla-tions was numerically similar to the mean (and well within the95% confidence interval) of the distribution of correlationsamong random pairs of RSMs drawn from the entire pool of sub-jects (between-age groups: rVTC: 1.33 [0.80–1.94] mean [95%confidence interval of z-scores]; lVTC: 1.30 [0.88–1.79]) randompairs: rVTC: 1.34 [0.79–1.95]; lVTC: 1.31 [0.86–1.84]). These find-ings confirm that the large-scale structure of RSM for distributedVTC responses to faces, objects and scenes is stable duringdevelopment.
To quantify further the categorical information in the MVPsin each age group, we used a winner-take-all classifier on eachsubjects’MVPs. This classifier determined the categorical mem-bership of the stimuli that the subject viewed during fMRI. Theclassifier accurately decoded if a child was viewing faces, ob-jects, or scenes (accuracy in decoding children’s MVPs > 92%,Fig. 3C). This classification performance was similar to thatbased on adults’ MVPs (accuracy > % 96, Fig. 3C). For both agegroups, classification accuracy varied across stimulus categor-ies, and was higher for faces than for objects. A 2-way repeatedrmANOVA on classification accuracy, using factors of stimuluscategory and age of subject, showed a significant effect of stimu-lus category in the right VTC (rVTC: stimulus category: F2,44 =3.67, P = 0.03). However, therewere no between age-group differ-ences in the accuracy of these classifications or interaction be-tween subject age and stimulus category (rVTC: age of subject:F1,44 = 1.32, P > 0.26, stimulus category × age of subject: F2,22 = 2.2,P > 0.15, Fig. 3C). Classification accuracywas similarly high in theleft VTC, and there were no significant effects of age of subject,category, or interaction among these factors (SupplementaryFig. 1A). Thus, the categorical information content of distributedresponses to faces, objects, and scenes across the VTC isdevelopmentally stable after age 7.
Own- and Other-Age Faces are Differentially RepresentedAcross the VTC
Althoughwe found that agegroupswere similar in their large-scalerepresentations of faces, objects and scenes across the VTC, the re-presentation of subtypes of these categories may change with ageand experience. Thus, we tested the hypothesis that more recentexperience with own-age faces leads to different MVPs across theVTC for own- versus other-age faces. This hypothesis predictsthat a classifier would decode the age of face stimuli more accur-ately from own- than from other-age face MVPs.
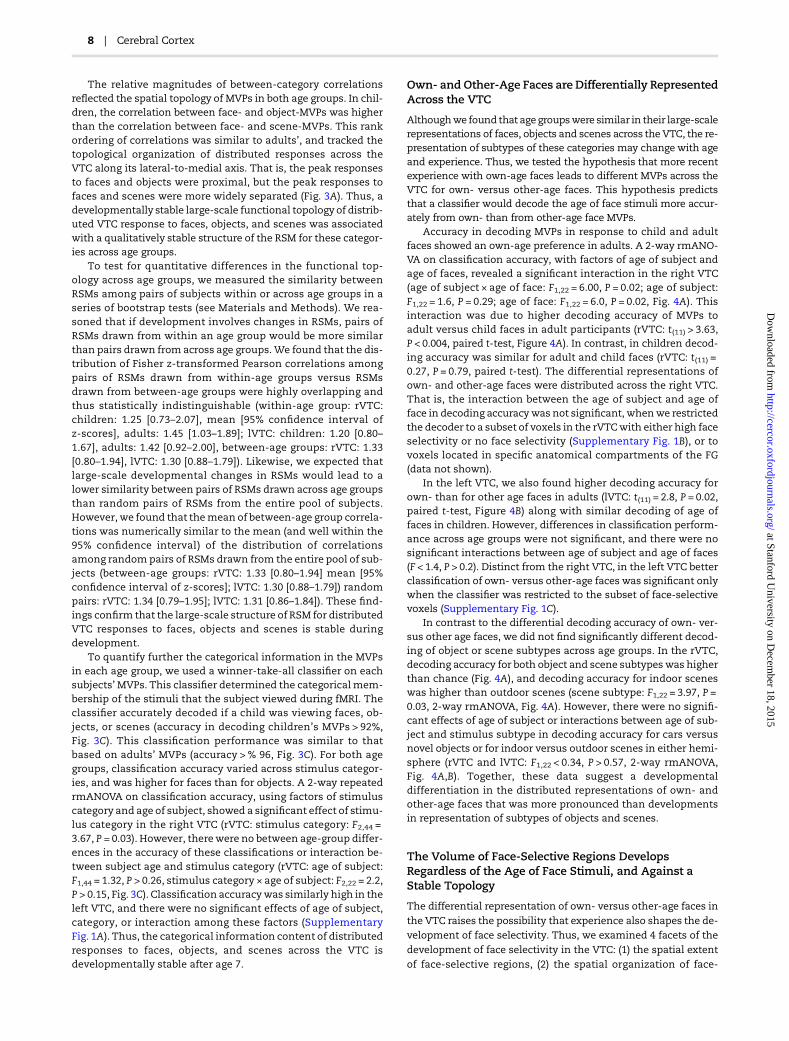
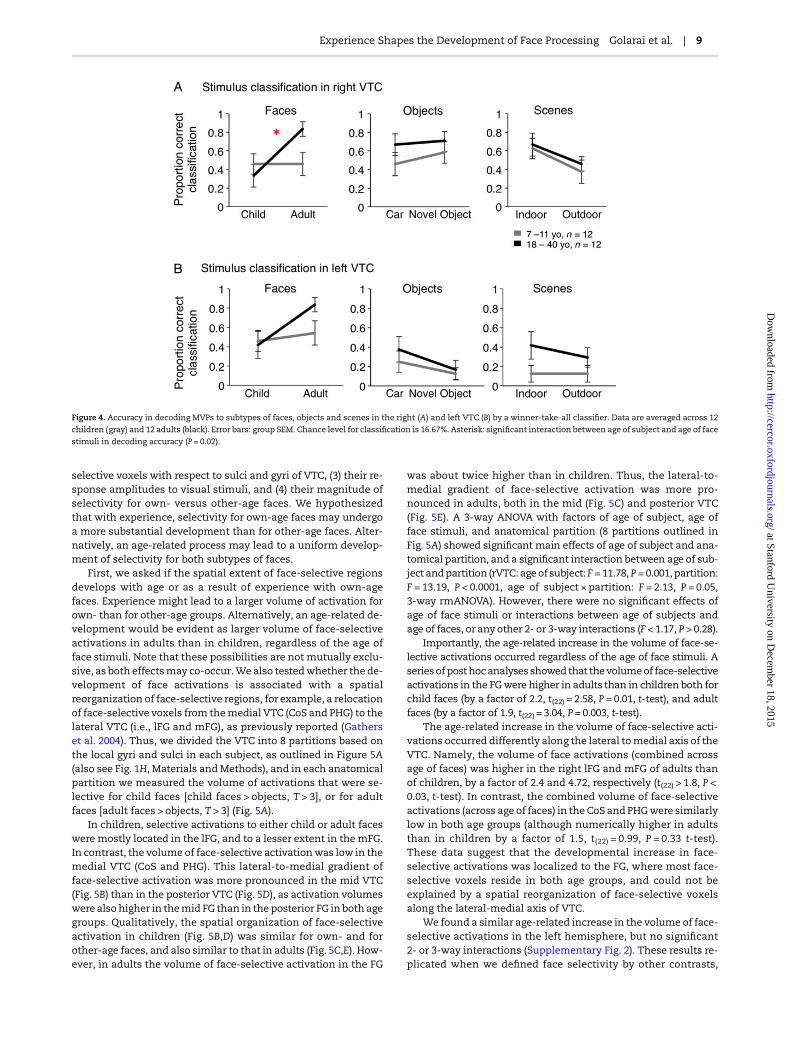
Accuracy in decoding MVPs in response to child and adultfaces showed an own-age preference in adults. A 2-way rmANO-VA on classification accuracy, with factors of age of subject andage of faces, revealed a significant interaction in the right VTC(age of subject × age of face: F1,22 = 6.00, P = 0.02; age of subject:F1,22 = 1.6, P = 0.29; age of face: F1,22 = 6.0, P = 0.02, Fig. 4A). Thisinteraction was due to higher decoding accuracy of MVPs toadult versus child faces in adult participants (rVTC: t(11) > 3.63,P < 0.004, paired t-test, Figure 4A). In contrast, in children decod-ing accuracy was similar for adult and child faces (rVTC: t(11) =0.27, P = 0.79, paired t-test). The differential representations ofown- and other-age faces were distributed across the right VTC.That is, the interaction between the age of subject and age offace in decoding accuracywas not significant, whenwe restrictedthe decoder to a subset of voxels in the rVTCwith either high faceselectivity or no face selectivity (Supplementary Fig. 1B), or tovoxels located in specific anatomical compartments of the FG(data not shown).
In the left VTC, we also found higher decoding accuracy forown- than for other age faces in adults (lVTC: t(11) = 2.8, P = 0.02,paired t-test, Figure 4B) along with similar decoding of age offaces in children. However, differences in classification perform-ance across age groups were not significant, and there were nosignificant interactions between age of subject and age of faces(F < 1.4, P > 0.2). Distinct from the right VTC, in the left VTC betterclassification of own- versus other-age faces was significant onlywhen the classifier was restricted to the subset of face-selectivevoxels (Supplementary Fig. 1C).
In contrast to the differential decoding accuracy of own- ver-sus other age faces, we did not find significantly different decod-ing of object or scene subtypes across age groups. In the rVTC,decoding accuracy for both object and scene subtypes was higherthan chance (Fig. 4A), and decoding accuracy for indoor sceneswas higher than outdoor scenes (scene subtype: F1,22 = 3.97, P =0.03, 2-way rmANOVA, Fig. 4A). However, there were no signifi-cant effects of age of subject or interactions between age of sub-ject and stimulus subtype in decoding accuracy for cars versusnovel objects or for indoor versus outdoor scenes in either hemi-sphere (rVTC and lVTC: F1,22 < 0.34, P > 0.57, 2-way rmANOVA,Fig. 4A,B). Together, these data suggest a developmentaldifferentiation in the distributed representations of own- andother-age faces that was more pronounced than developmentsin representation of subtypes of objects and scenes.
The Volume of Face-Selective Regions DevelopsRegardless of the Age of Face Stimuli, and Against aStable Topology
The differential representation of own- versus other-age faces inthe VTC raises the possibility that experience also shapes the de-velopment of face selectivity. Thus, we examined 4 facets of thedevelopment of face selectivity in the VTC: (1) the spatial extentof face-selective regions, (2) the spatial organization of face-
8 | Cerebral Cortex
at Stanford University on D
ecember 18, 2015
http://cercor.oxfordjournals.org/D
ownloaded from
selective voxels with respect to sulci and gyri of VTC, (3) their re-sponse amplitudes to visual stimuli, and (4) their magnitude ofselectivity for own- versus other-age faces. We hypothesizedthat with experience, selectivity for own-age faces may undergoa more substantial development than for other-age faces. Alter-natively, an age-related process may lead to a uniform develop-ment of selectivity for both subtypes of faces.
First, we asked if the spatial extent of face-selective regionsdevelops with age or as a result of experience with own-agefaces. Experience might lead to a larger volume of activation forown- than for other-age groups. Alternatively, an age-related de-velopment would be evident as larger volume of face-selectiveactivations in adults than in children, regardless of the age offace stimuli. Note that these possibilities are not mutually exclu-sive, as both effectsmay co-occur.We also testedwhether the de-velopment of face activations is associated with a spatialreorganization of face-selective regions, for example, a relocationof face-selective voxels from themedial VTC (CoS and PHG) to thelateral VTC (i.e., lFG and mFG), as previously reported (Gatherset al. 2004). Thus, we divided the VTC into 8 partitions based onthe local gyri and sulci in each subject, as outlined in Figure 5A(also see Fig. 1H, Materials andMethods), and in each anatomicalpartition we measured the volume of activations that were se-lective for child faces [child faces > objects, T > 3], or for adultfaces [adult faces > objects, T > 3] (Fig. 5A).
In children, selective activations to either child or adult faceswere mostly located in the lFG, and to a lesser extent in the mFG.In contrast, the volume of face-selective activationwas low in themedial VTC (CoS and PHG). This lateral-to-medial gradient offace-selective activation was more pronounced in the mid VTC(Fig. 5B) than in the posterior VTC (Fig. 5D), as activation volumeswere also higher in themid FG than in the posterior FG in both agegroups. Qualitatively, the spatial organization of face-selectiveactivation in children (Fig. 5B,D) was similar for own- and forother-age faces, and also similar to that in adults (Fig. 5C,E). How-ever, in adults the volume of face-selective activation in the FG
was about twice higher than in children. Thus, the lateral-to-medial gradient of face-selective activation was more pro-nounced in adults, both in the mid (Fig. 5C) and posterior VTC(Fig. 5E). A 3-way ANOVA with factors of age of subject, age offace stimuli, and anatomical partition (8 partitions outlined inFig. 5A) showed significant main effects of age of subject and ana-tomical partition, and a significant interaction between age of sub-ject andpartition (rVTC: ageof subject:F = 11.78, P = 0.001, partition:F = 13.19, P < 0.0001, age of subject × partition: F = 2.13, P = 0.05,3-way rmANOVA). However, there were no significant effects ofage of face stimuli or interactions between age of subjects andage of faces, or any other 2- or 3-way interactions (F < 1.17, P > 0.28).
Importantly, the age-related increase in the volume of face-se-lective activations occurred regardless of the age of face stimuli. Aseriesof posthocanalyses showed that thevolumeof face-selectiveactivations in the FGwere higher in adults than in children both forchild faces (by a factor of 2.2, t(22) = 2.58, P = 0.01, t-test), and adultfaces (by a factor of 1.9, t(22) = 3.04, P = 0.003, t-test).
The age-related increase in the volume of face-selective acti-vations occurred differently along the lateral tomedial axis of theVTC. Namely, the volume of face activations (combined acrossage of faces) was higher in the right lFG and mFG of adults thanof children, by a factor of 2.4 and 4.72, respectively (t(22) > 1.8, P <0.03, t-test). In contrast, the combined volume of face-selectiveactivations (across age of faces) in the CoS and PHGwere similarlylow in both age groups (although numerically higher in adultsthan in children by a factor of 1.5, t(22) = 0.99, P = 0.33 t-test).These data suggest that the developmental increase in face-selective activations was localized to the FG, where most face-selective voxels reside in both age groups, and could not beexplained by a spatial reorganization of face-selective voxelsalong the lateral-medial axis of VTC.
We found a similar age-related increase in the volume of face-selective activations in the left hemisphere, but no significant2- or 3-way interactions (Supplementary Fig. 2). These results re-plicated when we defined face selectivity by other contrasts,
Figure 4. Accuracy in decoding MVPs to subtypes of faces, objects and scenes in the right (A) and left VTC (B) by a winner-take-all classifier. Data are averaged across 12
children (gray) and 12 adults (black). Error bars: group SEM. Chance level for classification is 16.67%. Asterisk: significant interaction between age of subject and age of face
stimuli in decoding accuracy (P = 0.02).
Experience Shapes the Development of Face Processing Golarai et al. | 9
at Stanford University on D
ecember 18, 2015
http://cercor.oxfordjournals.org/D
ownloaded from

including activations that were exclusively selective for childfaces, exclusively selective for adult faces (SupplementaryFig. 3), or by contrasting faces against a variety of nonface stimuli,and across a range of thresholds (Supplementary Fig. 4).
Notably, in contrast to the age-related increase in the volumeof face activations, the volume of activation for novel objectsdecreased with age andwas 30–50% lower in themid FG of adultsthan in children (Supplementary Figs 5 and 6). Thus, the develop-mental increase in the volume of face-selective activations doesnot reflect an increase in the volume of activation to all visualstimuli due to a general age effect.
Taken together, these data reveal a substantial age-related in-crease in the volume of face-selective regions that occurred irre-spective of the age of face stimuli, and was localized to the FG,against a stable large-scale spatial organization of face-selectivevoxels across the VTC.
Response Amplitudes and Selectivity of Face-SelectiveActivations Show an Own-Age Bias
We tested whether age and experience shape the response am-plitudes of face-selective regions in the FG. We hypothesized
that general age-related developments would lead to changesin response amplitudes for both face subtypes, not excludingthe possibility that differential experience with child or adultfaces may lead to higher response amplitude for own- comparedwith other-age faces. In each subjectwe defined face-selective re-gions (child face + adult face > object, T > 3) from one run, and ex-tracted from an independent run the response amplitude foreach category of visual stimuli (Materials and Methods). Due tothe relatively small volume of face-selective activations in themedial FG in both age groups, we combined the lateral and med-ial FG partitions into a single compartment (Fig. 6A).
Response amplitudes to both child and adult faces were high-er in adults than in children (Fig. 6B–E). In contrast, responses tonovel objects, scenes, and scrambled images were not differentacross age groups. A 3-way rmANOVA on the response ampli-tudes in the right FG, with factors of age of subject, stimulustype (6 stimuli), and compartment (posterior/mid), showed sig-nificant main effects of age of subject, stimulus type, and a3-way interaction in the right FG (right FG: age of subject: F1,21 = 8.2,P = 0.007; stimulus type: F1,110 = 55.69, P < 10−4; age of subject ×stimulus type × partition: F5,110 = 4.18, P = 0.04, Fig. 6C,E). These
Figure 5. Volume of face-selective activations across the rVTC partitions. (A) Anatomical partitions and face activations are rendered on the surface of the right VTC from
representative 9- and 36-year-old subjects. Face activations were defined based on selectivity for child faces versus objects ([child faces > cars + novel objects], T > 3); or
selectivity for adult faces versus objects ([adult > car + objects], T > 3). The volumes of these activations were separately measured in each anatomical partition. (B–E)
The total volume of activation to child faces (light bars) and to adult faces (dark bars) is plotted for the lateral fusiform gyrus (lFG), medial fusiform gyrus (mFG),
collateral sulcus (CoS), and parahippocampal gyrus (PHG) in the right VTC (rVTC) averaged across 12 children (B,D) and 12 adults (C,E). (B,C) Data from the mid VTC, (D,
E) from the posterior VTC. Error bars: group SEM.
10 | Cerebral Cortex
at Stanford University on D
ecember 18, 2015
http://cercor.oxfordjournals.org/D
ownloaded from
data show that response amplitudes of face-selective regions inthe right FG increased with the age of subject, but not uniformlyacross stimuli or FG compartments.
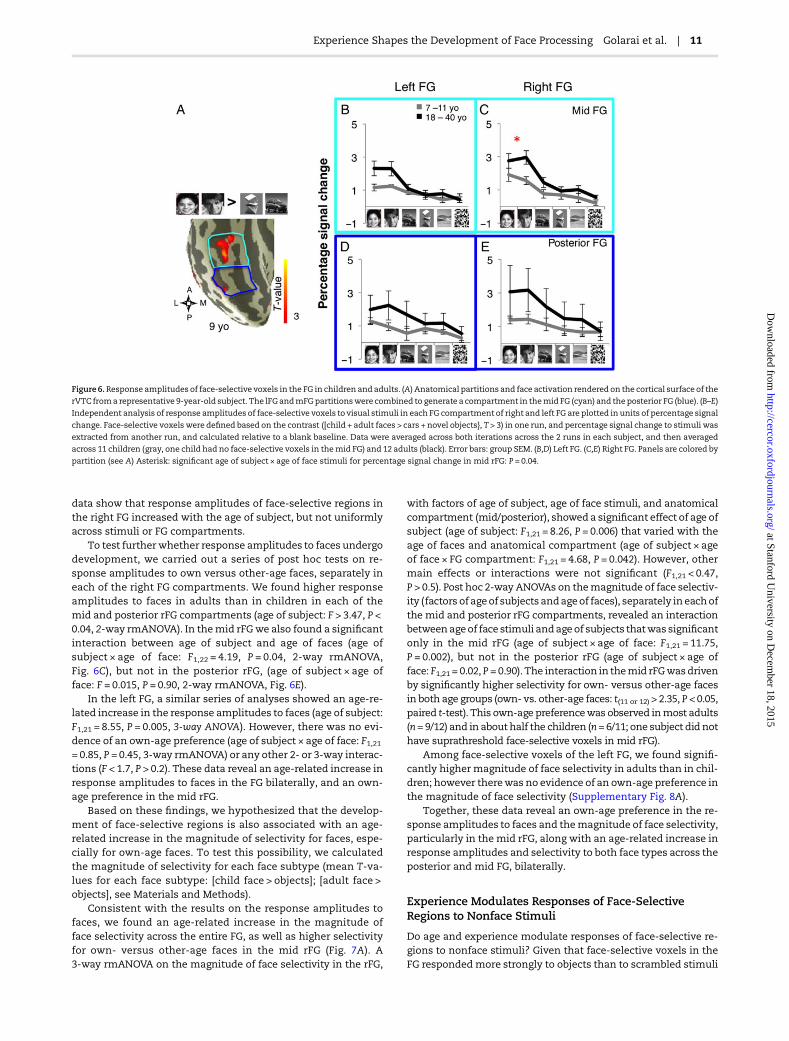
To test furtherwhether response amplitudes to faces undergodevelopment, we carried out a series of post hoc tests on re-sponse amplitudes to own versus other-age faces, separately ineach of the right FG compartments. We found higher responseamplitudes to faces in adults than in children in each of themid and posterior rFG compartments (age of subject: F > 3.47, P <0.04, 2-way rmANOVA). In themid rFGwe also found a significantinteraction between age of subject and age of faces (age ofsubject × age of face: F1,22 = 4.19, P = 0.04, 2-way rmANOVA,Fig. 6C), but not in the posterior rFG, (age of subject × age offace: F = 0.015, P = 0.90, 2-way rmANOVA, Fig. 6E).
In the left FG, a similar series of analyses showed an age-re-lated increase in the response amplitudes to faces (age of subject:F1,21 = 8.55, P = 0.005, 3-way ANOVA). However, there was no evi-dence of an own-age preference (age of subject × age of face: F1,21= 0.85, P = 0.45, 3-way rmANOVA) or any other 2- or 3-way interac-tions (F < 1.7, P > 0.2). These data reveal an age-related increase inresponse amplitudes to faces in the FG bilaterally, and an own-age preference in the mid rFG.
Based on these findings, we hypothesized that the develop-ment of face-selective regions is also associated with an age-related increase in the magnitude of selectivity for faces, espe-cially for own-age faces. To test this possibility, we calculatedthe magnitude of selectivity for each face subtype (mean T-va-lues for each face subtype: [child face > objects]; [adult face >objects], see Materials and Methods).
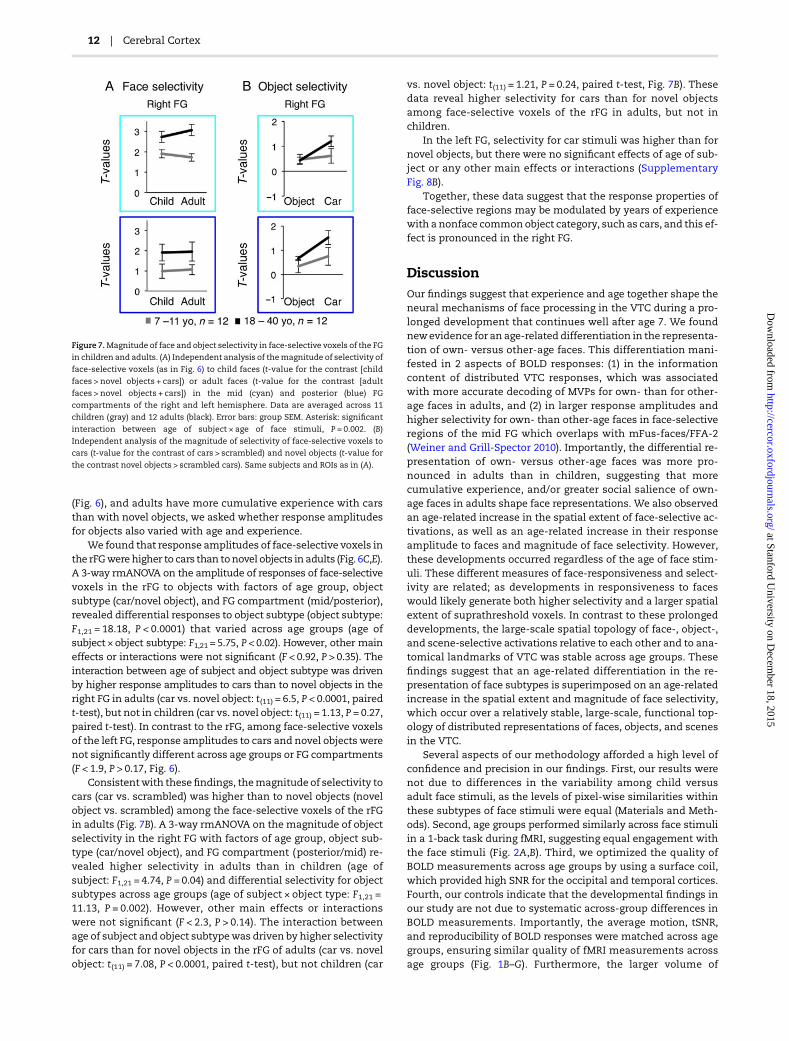
Consistent with the results on the response amplitudes tofaces, we found an age-related increase in the magnitude offace selectivity across the entire FG, as well as higher selectivityfor own- versus other-age faces in the mid rFG (Fig. 7A). A3-way rmANOVA on the magnitude of face selectivity in the rFG,
with factors of age of subject, age of face stimuli, and anatomicalcompartment (mid/posterior), showed a significant effect of age ofsubject (age of subject: F1,21 = 8.26, P = 0.006) that varied with theage of faces and anatomical compartment (age of subject × ageof face × FG compartment: F1,21 = 4.68, P = 0.042). However, othermain effects or interactions were not significant (F1,21 < 0.47,P > 0.5). Post hoc 2-way ANOVAs on themagnitude of face selectiv-ity (factors of ageof subjects andageof faces), separately in eachofthe mid and posterior rFG compartments, revealed an interactionbetweenageof face stimuli andage of subjects thatwas significantonly in the mid rFG (age of subject × age of face: F1,21 = 11.75,P = 0.002), but not in the posterior rFG (age of subject × age offace: F1,21 = 0.02, P = 0.90). The interaction in themid rFGwasdrivenby significantly higher selectivity for own- versus other-age facesin both age groups (own- vs. other-age faces: t(11 or 12) > 2.35, P < 0.05,paired t-test). This own-age preferencewas observed inmost adults(n= 9/12) and in about half the children (n= 6/11; one subject did nothave suprathreshold face-selective voxels in mid rFG).
Among face-selective voxels of the left FG, we found signifi-cantly higher magnitude of face selectivity in adults than in chil-dren; however therewas no evidence of an own-age preference inthe magnitude of face selectivity (Supplementary Fig. 8A).
Together, these data reveal an own-age preference in the re-sponse amplitudes to faces and themagnitude of face selectivity,particularly in the mid rFG, along with an age-related increase inresponse amplitudes and selectivity to both face types across theposterior and mid FG, bilaterally.
Experience Modulates Responses of Face-SelectiveRegions to Nonface Stimuli
Do age and experience modulate responses of face-selective re-gions to nonface stimuli? Given that face-selective voxels in theFG responded more strongly to objects than to scrambled stimuli
Figure 6.Response amplitudes of face-selective voxels in the FG in children and adults. (A) Anatomical partitions and face activation rendered on the cortical surface of the
rVTC froma representative 9-year-old subject. The lFGandmFGpartitionswere combined to generate a compartment in themid FG (cyan) and the posterior FG (blue). (B–E)
Independent analysis of response amplitudes of face-selective voxels to visual stimuli in each FG compartment of right and left FG are plotted in units of percentage signal
change. Face-selective voxels were defined based on the contrast ([child + adult faces > cars + novel objects}, T > 3) in one run, and percentage signal change to stimuli was
extracted from another run, and calculated relative to a blank baseline. Data were averaged across both iterations across the 2 runs in each subject, and then averaged
across 11 children (gray, one child had no face-selective voxels in themid FG) and 12 adults (black). Error bars: group SEM. (B,D) Left FG. (C,E) Right FG. Panels are colored by
partition (see A) Asterisk: significant age of subject × age of face stimuli for percentage signal change in mid rFG: P = 0.04.
Experience Shapes the Development of Face Processing Golarai et al. | 11
at Stanford University on D
ecember 18, 2015
http://cercor.oxfordjournals.org/D
ownloaded from
(Fig. 6), and adults have more cumulative experience with carsthan with novel objects, we asked whether response amplitudesfor objects also varied with age and experience.
We found that response amplitudes of face-selective voxels inthe rFGwere higher to cars than tonovel objects in adults (Fig. 6C,E).A 3-way rmANOVA on the amplitude of responses of face-selectivevoxels in the rFG to objects with factors of age group, objectsubtype (car/novel object), and FG compartment (mid/posterior),revealed differential responses to object subtype (object subtype:F1,21 = 18.18, P < 0.0001) that varied across age groups (age ofsubject × object subtype: F1,21 = 5.75, P < 0.02). However, other maineffects or interactions were not significant (F < 0.92, P > 0.35). Theinteraction between age of subject and object subtype was drivenby higher response amplitudes to cars than to novel objects in theright FG in adults (car vs. novel object: t(11) = 6.5, P < 0.0001, pairedt-test), but not in children (car vs. novel object: t(11) = 1.13, P = 0.27,paired t-test). In contrast to the rFG, among face-selective voxelsof the left FG, response amplitudes to cars and novel objects werenot significantly different across age groups or FG compartments(F < 1.9, P > 0.17, Fig. 6).
Consistentwith thesefindings, themagnitude of selectivity tocars (car vs. scrambled) was higher than to novel objects (novelobject vs. scrambled) among the face-selective voxels of the rFGin adults (Fig. 7B). A 3-way rmANOVA on the magnitude of objectselectivity in the right FG with factors of age group, object sub-type (car/novel object), and FG compartment (posterior/mid) re-vealed higher selectivity in adults than in children (age ofsubject: F1,21 = 4.74, P = 0.04) and differential selectivity for objectsubtypes across age groups (age of subject × object type: F1,21 =11.13, P = 0.002). However, other main effects or interactionswere not significant (F < 2.3, P > 0.14). The interaction betweenage of subject and object subtypewas driven by higher selectivityfor cars than for novel objects in the rFG of adults (car vs. novelobject: t(11) = 7.08, P < 0.0001, paired t-test), but not children (car
vs. novel object: t(11) = 1.21, P = 0.24, paired t-test, Fig. 7B). Thesedata reveal higher selectivity for cars than for novel objectsamong face-selective voxels of the rFG in adults, but not inchildren.
In the left FG, selectivity for car stimuli was higher than fornovel objects, but there were no significant effects of age of sub-ject or any other main effects or interactions (SupplementaryFig. 8B).
Together, these data suggest that the response properties offace-selective regions may be modulated by years of experiencewith a nonface commonobject category, such as cars, and this ef-fect is pronounced in the right FG.
DiscussionOur findings suggest that experience and age together shape theneural mechanisms of face processing in the VTC during a pro-longed development that continues well after age 7. We foundnewevidence for an age-related differentiation in the representa-tion of own- versus other-age faces. This differentiation mani-fested in 2 aspects of BOLD responses: (1) in the informationcontent of distributed VTC responses, which was associatedwith more accurate decoding of MVPs for own- than for other-age faces in adults, and (2) in larger response amplitudes andhigher selectivity for own- than other-age faces in face-selectiveregions of the mid FG which overlaps with mFus-faces/FFA-2(Weiner and Grill-Spector 2010). Importantly, the differential re-presentation of own- versus other-age faces was more pro-nounced in adults than in children, suggesting that morecumulative experience, and/or greater social salience of own-age faces in adults shape face representations. We also observedan age-related increase in the spatial extent of face-selective ac-tivations, as well as an age-related increase in their responseamplitude to faces and magnitude of face selectivity. However,these developments occurred regardless of the age of face stim-uli. These different measures of face-responsiveness and select-ivity are related; as developments in responsiveness to faceswould likely generate both higher selectivity and a larger spatialextent of suprathreshold voxels. In contrast to these prolongeddevelopments, the large-scale spatial topology of face-, object-,and scene-selective activations relative to each other and to ana-tomical landmarks of VTC was stable across age groups. Thesefindings suggest that an age-related differentiation in the re-presentation of face subtypes is superimposed on an age-relatedincrease in the spatial extent and magnitude of face selectivity,which occur over a relatively stable, large-scale, functional top-ology of distributed representations of faces, objects, and scenesin the VTC.
Several aspects of our methodology afforded a high level ofconfidence and precision in our findings. First, our results werenot due to differences in the variability among child versusadult face stimuli, as the levels of pixel-wise similarities withinthese subtypes of face stimuli were equal (Materials and Meth-ods). Second, age groups performed similarly across face stimuliin a 1-back task during fMRI, suggesting equal engagement withthe face stimuli (Fig. 2A,B). Third, we optimized the quality ofBOLD measurements across age groups by using a surface coil,which provided high SNR for the occipital and temporal cortices.Fourth, our controls indicate that the developmental findings inour study are not due to systematic across-group differences inBOLD measurements. Importantly, the average motion, tSNR,and reproducibility of BOLD responses were matched across agegroups, ensuring similar quality of fMRI measurements acrossage groups (Fig. 1B–G). Furthermore, the larger volume of
Figure 7.Magnitude of face and object selectivity in face-selective voxels of the FG
in children and adults. (A) Independent analysis of themagnitude of selectivity of
face-selective voxels (as in Fig. 6) to child faces (t-value for the contrast [child
faces > novel objects + cars]) or adult faces (t-value for the contrast [adult
faces > novel objects + cars]) in the mid (cyan) and posterior (blue) FG
compartments of the right and left hemisphere. Data are averaged across 11
children (gray) and 12 adults (black). Error bars: group SEM. Asterisk: significant
interaction between age of subject × age of face stimuli, P = 0.002. (B)
Independent analysis of the magnitude of selectivity of face-selective voxels to
cars (t-value for the contrast of cars > scrambled) and novel objects (t-value for
the contrast novel objects > scrambled cars). Same subjects and ROIs as in (A).
12 | Cerebral Cortex
at Stanford University on D
ecember 18, 2015
http://cercor.oxfordjournals.org/D
ownloaded from
activations to novel objects in the FG of children (compared withadults) rules out any substantial contribution of BOLD confoundsin driving the specific developmental increases in the spatial ex-tent amplitude and selectivity of responses to faces in the FG.Fifth, we enhanced the spatial precision of our measurementsby examining developmental effects in VTC partitions, whichwere based on major anatomical landmarks in each subject(Fig. 1H). Together, these methodological controls ensured thatgeneral between-group differences, such as task performanceduring scan (due to differences in attention, anxiety, or motiv-ation), BOLD related confounds or anatomical developmentscould not explain our findings.
Below, we discuss the implications of 3 aspects of our find-ings: (1) the stable topology of VTC categorical representationsafter age 7; (2) age-related changes in response to faces irrespect-ive of the face subtype, and (3) experience-dependent changes inresponse to face and object subtypes.
The Topology of Face, Object, and Scene Representationsis Stable After Age 7
Our data revealed the large-scale spatial topology of distributedresponses to broad categories of faces, objects, and scenes inthe VTC of children. This topology was highly reproducible inchildren, both in relation to major anatomical landmarks ofVTC and in terms of the information content of the distributed re-sponses to these broad categories (Fig. 3).
The topology of distributed responses in VTC was stableacross age groups, both qualitatively, in terms of the large-scalespatial organization, and also quantitatively, in terms of their in-formation content (Fig. 3). These findings suggest that the large-scale functional topology of face, object, and scene categories inVTC develops before age 7.
Developmentally, this topologymayarise froma combinationof factors, including (1) anatomical constraints, such as the cyto-architecture of VTC (Caspers et al. 2012, 2014; Weiner et al. 2014),(2) long-distance white-matter connections (Gschwind et al.2012; Phillips et al. 2012; Harel et al. 2013; Saygin et al. 2013;Gomez et al. 2015), and (3) functional constraints, such as eccen-tricity bias (Levy et al. 2001; Hasson et al. 2002) or responsivenessto primitive shapes (e.g., curvature vs. rectilinearity (Srihasamet al. 2012, 2014; Nasr et al. 2014)). Notably, each of these anatom-ical and functional factors is organized along the lateral-medialaxis of VTC (Grill-Spector and Weiner 2014).
Our finding of a stable spatial topology of face-selective acti-vations (Fig. 5, Supplementary Figs 2–4) argues against the ideathat face-selective regions undergo a major relocation duringchildhood (Gathers et al. 2004). Also stable was the spatial loca-tion of activations for own- and other-age faces across 8 anatom-ical partitions of VTC, (Fig. 5, Supplementary Figs 2–4). In fact, themajority of face-selective voxels showed selectivity for both own-and also other-age faces (Supplementary Fig. 3).
The stable large-scale topology of face, object, and scene repre-sentations does not rule out the possibility of developmentalchanges in the representation of other categories or subcategoriesthat were not included in our study. Future studies are needed tocompare the development of a broader range of face and object re-presentations, using awider variety of stimulus categories that ac-tivate the VTC (e.g., animals, tools, body parts, or words) andsubcategories (e.g., animal vs. human faces, kitchen utensils vs.construction tools) and tasks, to determinewhether those VTC re-presentations change during development. Based on our findings,we predict that the large-scale topology of category representa-tions develops before the fine-grain distinctions among subtypes.
Face-Selective Regions Undergo An Age-RelatedDevelopment Regardless of the Age of Faces
Despite a stable, large-scale functional topology, the spatial ex-tent and magnitude of face selectivity in the FG increased afterage 7, consistent with previous data from our studies and others’(Gathers et al. 2004; Golarai et al. 2007, 2010; Scherf et al. 2007;Peelen et al. 2009; Cantlon et al. 2011). Importantly, this age-re-lated development (1) occurred regardless of the age of face stim-uli (Fig. 5, Supplementary Figs 2 and 3), (2) was evident across arange of contrasts and statistical thresholds (SupplementaryFig. 4), and (3) was specific to faces and not found for objects (Sup-plementary Figs 5 and 6), ruling out a general maturation effect.Interestingly, in the same anatomical regions of FG—where wefound a near doubling of the extent of face-selective activationswith age—we also found a near 30% decrease in the extent ofobject-selective activations with age. These findings raise theintriguing possibility that with age and experience, some ob-ject-selective voxels in the FG (which are also responsive tofaces, see Supplementary Fig. 7), may become face-selective,and contribute to the growth of the spatially expanding face-selective regions during development. This hypothesis may beexamined in future longitudinal studies of development.
Several underlying neural mechanisms have been proposedto explain the development of face selectivity: (1) increased firingrate of face-selective neurons in response to faces (Grill-Spectoret al. 2008; Srihasamet al. 2014), (2) reduced responsiveness to ob-jects (Cantlon et al. 2011), (3) clustering of face-selective neuronsin the FG due to large-scale functional reorganization of VTC(Gathers et al. 2004) or (4) clustering of face-selective neurons atthe voxel level, all of which could lead to an age-related, netincrease in face selectivity in the FG. Our data rule out a reducedresponsiveness to objects among face-selective regions or alarge-scale spatial reorganization in the VTC. Instead, our find-ings support age-related increases in responsiveness to faceswithin face-selective regions. Future studies with higher reso-lution fMRI or adaptation methods are needed to determinewhether this development is due to greater clustering of face-se-lective neurons, increased responsiveness to faces, or both.
Experience-Dependent Differentiation inRepresentations of Own- Versus Other-Age Faces
A key finding in our study was an own-age advantage, which canbe understood in terms of the role of experience in shaping 2 spe-cific aspects of VTC responses. First, the distinct representation ofown- compared to other-age faces in the distributed responses ofVTC suggests that experiencewith peer faces shapes these repre-sentations, especially in adults. This plasticity was specificto distributed representation of faces and was not a general mat-uration effect, aswedidnotfindananalogous interactionbetweenage of subject and subtypes of objects or scenes (Fig. 4). Second, inboth age groups the selectivity and amplitude of responses toown-age faces were higher than to other-age faces in face-select-ive voxels of the right mid FG (which corresponds to mFus-faces/FFA-2; (Weiner andGrill-Spector 2010). These data suggest that ex-periencewith own-age faces increases the local selectivity and re-sponse amplitudes for own-age faces in mFus-faces/FFA-2.However, we cannot rule out a less pronounced effect of this ex-perienceon the responses of face-selective regions in the posterioror left FG. Also, this own-age advantage was evident in both agegroups, suggesting that in adults, recent years of experience withadult peers leads to a reversal of an earlier preference for child-hood peers. These findings are consistent with reports of higher
Experience Shapes the Development of Face Processing Golarai et al. | 13
at Stanford University on D
ecember 18, 2015
http://cercor.oxfordjournals.org/D
ownloaded from
FFA responses to own-race versus other-race faces (Golby et al.2001) and suggest a flexible representation of face subtypes inthe mFus-faces/FFA-2 well into adulthood.
What Components of Real Life Experience with Faces Contribute to theOwn-Age Preference in VTC Responses?We hypothesize that the relative frequency and cumulative effectof encounters with own- versus other-age faces, along with thegreater social salience of own-age faces are critical factors (Cassiaet al. 2009; Harrison and Hole 2009; Hills and Lewis 2011). For ex-ample, the combination of recent and cumulative experiencewould explain our observation of a larger own-age preference indistributedVTC representations in adults comparedwith children.Namely, adults typically interact socially with other adults on adaily basis, but not with many children. Meanwhile, adult facesdominate the social milieu throughout the life span and thusexert a cumulative effect since infancy (Macchi Cassia et al.2014). In contrast, children’s experience with peer faces is moretransient as the physical shape of a child’s face rapidly changesduring development. Moreover, the asymmetric social salienceand roles of adults versus children (e.g., in providing vs. receivingcare) are likely to differentially shape the cumulative experienceofchildren and adults with own- versus other-age faces.
One limitation of our study is thatwedid not quantify the tim-ing, duration or frequency of our participant’s prior experiencewith individuals of own- versus other-age groups. Thus, we can-not distinguish the contributions of ongoing, recent, or cumula-tive experience with own-age faces or the potential role of any“critical periods” during adolescence or early adulthood. Like-wise, we did not attempt to change our subjects’ level of experi-ence by training our participants with other age faces, or byfocusing on specific subpopulation of children (e.g., homeschooled children) or adults (e.g., teachers) with more or less ex-posure to specific age groups. Future longitudinal studies beforeand after variable durations of every day exposure or laboratorytrainingwithdifferent subtypes of faces are needed to test the spe-cific effects of recent versus cumulative experience. However, ourfindings predict that prolonged and substantive experience withother ages will alter VTC responses to those face subtypes. For ex-ample, teachers ormaternityward nurses, who interact daily withchildren or infants, respectively, may show a decreased own-agepreference in VTC responses relative to faces of the age groupwith which they have substantial daily experience, as suggestedby behavioral studies (Cassia et al. 2009; Harrison and Hole 2009).
Responses in Face-Selective Regions areAlsoMalleable toExperience with Objects
Experience-dependent modulation of face-selective regions bynonface stimuli has been interpreted fromdivergent perspectives.One view suggests a unique and critical involvement of these re-gions in processing objects of expertise (Gauthier et al. 1999, 2000;McGugin et al. 2011; McGugin, Gatenby et al. 2012; Gauthier et al.2014). A second view suggests that faces and objects are represen-tated by nonoverlapping, domain-specific neural populationswithin an fMRI voxel (Kanwisher et al. 1997; Grill-Spector et al.2004; McKone et al. 2007). A third-view posits a distributedrepresentation of faces and objects allowing the possibility thatexperience with objects would affect response in face-selectiveregions (Haxby et al. 2001; Harel et al. 2013, 2014). A fourth viewsuggests that VTC responses are organized by combinations ofshape (Nasr et al. 2014), animacy (Konkle and Caramazza 2013;Sha et al. 2015), and retinotopy (Levy et al. 2001). Given that carsand faces share some common features (e.g., rounded frontal
features), these stimuli may generate activations at overlappingregions.
Our findings suggest that cumulative experience with a non-face object subtype (cars) shapes responses in face-selective re-gions. Specifically, the magnitude of selectivity and responseamplitudes of face-selective regions in the adult FG were higherfor cars (with which adults had many years of experience) thanfor novel objects (with which all subjects had little prior experi-ence). Furthermore, in the same regions, responses to cars werehigher in adults than in children, consistent with adults’ greatercumulative experience with cars. In contrast, there were no age-group differences in the response of these regions to novel ob-jects, ruling out a general maturation effect.
Preferential responses to cars overlapped the face-selectiveregions of mid rFG (i.e., mFus-faces/FFA-2), where we alsofound an own-age preference in response to faces. Future studiescapable of resolving small neural populations are needed to de-termine whether the malleability to experience with face andnonface stimuli occurs among the same neuronal populations –
as predicted by the expertise view (Gauthier et al. 2000; Gauthierand Bukach 2007; McGugin, Richler et al. 2012) – or among nono-verlapping populations within an fMRI voxel, as predicted by thedomain-specificity view (Kanwisher et al. 1997; Grill-Spector et al.2004; McKone et al. 2007).
ConclusionsWe report 2 key findings. First, we find a sequential developmentof VTC, where the topology of distributed representations offaces, objects, and scenes developed by age 7, but the spatial ex-tent and degree of face selectivity continued to develop intoadulthood. Second, we provide the first direct evidence that ex-perience plays a role in shaping the development of face repre-sentations in the VTC, as responses to own compared withother age faces became differentiated with age, both in the dis-tributed responses of VTC and within face-selective regions.These findings elucidate the interplay of experience and matur-ation in shaping the development of the neural substrates offace processing in human VTC.
Supplementary MaterialSupplementary material can be found at: http://www.cercor.oxfordjournals.org/.
FundingThis research was funded by grants: NIH RO1EY02988-A1 andNSF BCS 0920865.
NotesWe thank Drs Nancy Kanwisher for fruitful discussions, DavieYoon forhelp indatacollection, andAndersC.Greenwood forhelp-ful feedback on the manuscript. Conflict of Interest: None declared.
ReferencesAylward EH, Park JE, Field KM, Parsons AC, Richards TL,
Cramer SC, Meltzoff AN. 2005. Brain activation during faceperception: evidence of a developmental change. J CogNeuro Sci. 17:308–319.
Cantlon JF, Pinel P, Dehaene S, Pelphrey KA. 2011. Cortical repre-sentations of symbols, objects, and faces are pruned back dur-ing early childhood. Cereb Cortex. 21:191–199.
14 | Cerebral Cortex
at Stanford University on D
ecember 18, 2015
http://cercor.oxfordjournals.org/D
ownloaded from

Caspers J, Zilles K, Amunts K, Laird AR, Fox PT, Eickhoff SB. 2014.Functional characterization and differential coactivation pat-terns of two cytoarchitectonic visual areas on the human pos-terior fusiform gyrus. Hum Brain Mapp. 35:13.
Caspers J, Zilles K, Eickhoff SB, Schleicher A, Mohlberg H,Amunts K. 2012. Cytoarchitectonical analysis and probabilis-tic mapping of two extrastriate areas of the human posteriorfusiform gyrus. Brain Struct Funct. 218:15.
Cassia VM, Picozzi M, Kuefner D, Casati M. 2009. Why mix-upsdon’t happen in the nursery: evidence for an experience-based interpretation of the other-age effect. Q J Exp Psychol(Hove). 62:1099–1107.
Cromer JA, Schembri AJ, Harel BT, Maruff P. 2015. The nature andrate of cognitivematuration from late childhood to adulthood.Front Psychol. 6:704.
Egami C, Yamashita Y, Tada Y, Anai C, Mukasa A, Yuge K,Nagamitsu S, Matsuishi T. 2015. Developmental trajectoriesfor attention and working memory in healthy Japaneseschool-aged children. Brain Dev. 37(9): 840–848.
Gathers AD, Bhatt R, Corbly CR, Farley AB, Joseph JE. 2004. Devel-opmental shifts in cortical loci for face and object recognition.Neuroreport. 15:1549–1553.
Gauthier I, Bukach C. 2007. Should we reject the expertise hy-pothesis? Cognition. 103:322–330.
Gauthier I, McGugin RW, Richler JJ, Herzmann G, Speegle M, VanGulick AE. 2014. Experiencemoderates overlap between objectand face recognition, suggesting a common ability. J Vis. 14:7.
Gauthier I, Skudlarski P, Gore JC, Anderson AW. 2000. Expertisefor cars and birds recruits brain areas involved in face recogni-tion. Nat Neurosci. 3:191–197.
Gauthier I, Tarr MJ, Anderson AW, Skudlarski P, Gore JC. 1999. Ac-tivation of the middle fusiform ‘face area’ increases with ex-pertise in recognizing novel objects. Nat Neurosci. 2:568–573.
Golarai G, Ghahremani DG, Whitfield-Gabrieli S, Reiss A,Eberhardt JL, Gabrieli JD, Grill-Spector K. 2007. Differentialdevelopment of high-level visual cortex correlates with cat-egory-specific recognition memory. Nat Neurosci. 10:512–522.
Glover GH. 1999. 3D z-shimmethod for reduction of susceptibilityeffects in BOLD fMRI. Magn Reson Med. 42:290–299.
Golarai G, LibermanA, Yoon JM, Grill-Spector K. 2010. Differentialdevelopment of the ventral visual cortex extends throughadolescence. Front Hum Neurosci. 3:80.
Golby AJ, Gabrieli JDE, Chiao JY, Eberhardt JL. 2001. Differential re-sponses in the fusiform region to same-race and other-racefaces. Nat Neurosci. 4:845–850.
Gomez J, Pestilli F, Witthoft N, Golarai G, Liberman A, Poltoratski S,Yoon J, Grill-Spector K. 2015. Functionally defined white matterreveals segregated pathways in human ventral temporal cortexassociatedwithcategory-specificprocessing.Neuron. 85:216–227.
Grill-Spector K, Golarai G, Gabrieli J. 2008. Developmental neuroi-maging of the human ventral visual cortex. Trends Cogn Sci.12:152–162.
Grill-Spector K, Knouf N, Kanwisher N. 2004. The fusiform facearea subserves face perception, not generic within-categoryidentification. Nat Neurosci. 7:555–562.
Grill-Spector K, Kushnir T, Edelman S, Avidan G, Itzchak Y,Malach R. 1999. Differential processing of objects under vari-ous viewing conditions in the human lateral occipital com-plex. Neuron. 24:187–203.
Grill-Spector K, Weiner KS. 2014. The functional architecture ofthe ventral temporal cortex and its role in categorization.Nat Rev Neurosci. 15:536–548.
Gschwind M, Pourtois G, Schwartz S, Van De Ville D,Vuilleumier P. 2012. White-matter connectivity between
face-responsive regions in the human brain. Cereb Cortex.22:1564–1576.
Harel A, Kravitz D, Baker CI. 2013. Beyond perceptual expertise:revisiting the neural substrates of expert object recognition.Front Hum Neurosci. 7:885.
Harel A, Kravitz DJ, Baker CI. 2014. Holding a stick at both ends: onfaces and expertise. Front Hum Neurosci. 8:442.
Harrison V, Hole GJ. 2009. Evidence for a contact-based explan-ation of the own-age bias in face recognition. Psychon BullRev. 16:5.
Hasson U, Levy I, BehrmannM, Hendler T, Malach R. 2002. Eccen-tricity bias as an organizing principle for human high-orderobject areas. Neuron. 34:479–490.
Haxby JV, Gobbini MI, Furey ML, Ishai A, Schouten JL,Pietrini P. 2001. Distributed and overlapping representa-tions of faces and objects in ventral temporal cortex. Science.293:2425–2430.
Hills PJ, LewisMB. 2011. The own-age face recognition bias in chil-dren and adults. Q J Exp Psychol (Hove). 64:17–23.
Ishai A, Ungerleider LG, Martin A, Schouten JL, Haxby JV. 1999.Distributed representation of objects in the human ventralvisual pathway. Proc Natl Acad Sci USA. 96:9379–9384.
Kail R, Salthouse TA. 1994. Processing speed as amental capacity.Acta Psychol (Amst). 86:199–225.
Kanwisher N, Chun MM, McDermott J, Ledden PJ. 1996. Function-al imaging of human visual recognition. Brain Res Cogn BrainRes. 5:55–67.
Kanwisher N, McDermott J, Chun MM. 1997. The fusiform facearea: a module in human extrastriate cortex specialized forface perception. J Neurosci. 17:4302–4311.
Konkle T, Caramazza A. 2013. Tripartite organization of the ven-tral stream by animacy and object size. J Neurosci.33:10235–10242.
Kriegeskorte N, MurM, Bandettini P. 2008. Representational simi-larity analysis - connecting the branches of systems neurosci-ence. Front Syst Neurosci. 2:4.
Levy I, Hasson U, Avidan G, Hendler T, Malach R. 2001. Center-periphery organization of human object areas. Nat Neurosci.4:533–539.
Lewin C, Herlitz A. 2002. Sex differences in face recognition–women’s faces make the difference. Brain Cogn. 50:121–128.
Macchi Cassia V, Bulf H, Quadrelli E, Proietti V. 2014. Age-relatedface processing bias in infancy: evidence of perceptual nar-rowing for adult faces. Dev Psychobiol 56(2):238–248.
MalachR, Reppas JB, Benson RR, Kwong KK, JiangH, KennedyWA,Ledden PJ, Brady TJ, Rosen BR, Tootell RB. 1995. Object-relatedactivity revealed by functional magnetic resonance imagingin human occipital cortex. Proc Natl Acad Sci USA. 92:8135–8139.
Martin E, Joeri P, Loenneker T, Ekatodramis D, Vitacco D, Hennig J,Marcar VL. 1999. Visual processing in infants and childrenstudied using functional MRI. Pediatr Res. 46:135–140.
McGugin RW, Gatenby JC, Gore JC, Gauthier I. 2012. High-reso-lution imaging of expertise reveals reliable object selectivityin the fusiform face area related to perceptual performance.Proc Natl Acad Sci USA. 109:17063–17068.
McGugin RW, Richler JJ, Herzmann G, Speegle M, Gauthier I. 2012.TheVanderbilt Expertise Test reveals domain-general and do-main-specific sex effects in object recognition. Vision Res.69:10–22.
McGugin RW, Tanaka JW, Lebrecht S, Tarr MJ, Gauthier I. 2011.Race-specific perceptual discrimination improvement follow-ing short individuation training with faces. Cogn Sci.35:330–347.
Experience Shapes the Development of Face Processing Golarai et al. | 15
at Stanford University on D
ecember 18, 2015
http://cercor.oxfordjournals.org/D
ownloaded from

McKone E, Kanwisher N, Duchaine BC. 2007. Can generic expert-ise explain special processing for faces? Trends Cogn Sci.11:8–15.
Meek JH, Firbank M, Elwell CE, Atkinson J, Braddick O, Wyatt JS.1998. Regional hemodynamic responses to visual stimulationin awake infants. Pediatr Res. 43:840–843.
Murphy K, Bodurka J, Bandettini PA. 2007. How long to scan? Therelationship between fMRI temporal signal to noise ratio andnecessary scan duration. Neuroimage. 34:565–574.
Nasr S, Echavarria CE, Tootell RB. 2014. Thinking outside the box:rectilinear shapes selectively activate scene-selective cortex.J Neurosci. 34:6721–6735.
Nasr S, Liu N, Devaney KJ, Yue X, Rajimehr R, Ungerleider LG,Tootell RB. 2011. Scene-selective cortical regions in humanand nonhuman primates. J Neurosci. 31:13771–13785.
Peelen MV, Glaser B, Vuilleumier P, Eliez S. 2009. Differential de-velopment of selectivity for faces and bodies in the fusiformgyrus. Dev Sci. 12:F16–F25.
Phillips JS, Greenberg AS, Pyles JA, Pathak SK, Behrmann M,Schneider W, Tarr MJ. 2012. Co-analysis of brain structureand function using fMRI and diffusion-weighted imaging.J Vis Exp. 69:4125.
Ratcliff R, Love J, Thompson CA, Opfer JE. 2012. Children are notlike older adults: a diffusionmodel analysis of developmentalchanges in speeded responses. Child Dev. 83:367–381.
Saygin ZM, Norton ES, Osher DE, Beach SD, Cyr AB, Ozernov-PalchikO,YendikiA, Fischl B,GaabN,Gabrieli JD. 2013. Trackingthe roots of reading ability: white matter volume and integritycorrelatewith phonological awareness in prereading and early-reading kindergarten children. J Neurosci. 33:13251–13258.
Sayres R, Grill-Spector K. 2006. Object-selective cortex exhibits per-formance-independent repetition suppression. J Neurophysiol.95:995–1007.
Scherf KS, Behrmann M, Dahl RE. 2012. Facing changes andchanging faces in adolescence: a new model for investigat-ing adolescent-specific interactions between pubertal,brain and behavioral development. Dev Cogn Neurosci.2:199–219.
Scherf KS, Behrmann M, Humphreys K, Luna B. 2007. Visual cat-egory-selectivity for faces, places and objects emerges alongdifferent developmental trajectories. Dev Sci. 10:F15–F30.
ShaL,Haxby JV,AbdiH,Guntupalli JS,OosterhofNN,HalchenkoYO,Connolly AC. 2015. The animacy continuum in the human ven-tral vision pathway. J Cogn Neurosci. 27:665–678.
SrihasamK,Mandeville JB, Morocz IA, Sullivan KJ, LivingstoneMS.2012. Behavioral and anatomical consequences of early versuslate symbol training in macaques. Neuron. 73:608–619.
Srihasam K, Vincent JL, Livingstone MS. 2014. Novel domain for-mation reveals proto-architecture in inferotemporal cortex.Nat Neurosci. 17:1776–1783.
Weiner KS, Golarai G, Caspers J, Chuapoco MR, Mohlberg H,Zilles K, Amunts K, Grill-Spector K. 2014. The mid-fusiformsulcus: a landmark identifying both cytoarchitectonic andfunctional divisions of human ventral temporal cortex.Neuroimage. 84:453–465.
Weiner KS, Grill-Spector K. 2010. Sparsely-distributed organiza-tion of face and limb activations in human ventral temporalcortex. Neuroimage. 52:1559–1573.
Wenger KK, Visscher KM, Miezin FM, Petersen SE, Schlaggar BL.2004. Comparison of sustained and transient activity in chil-dren and adults using amixed blocked/event-related fMRI de-sign. Neuroimage. 22:975–985.
Witthoft N, Nguyen ML, Golarai G, LaRocque KF, Liberman A,Smith ME, Grill-Spector K. 2014. Where is human V4? Predict-ing the location of hV4 and VO1 from cortical folding. CerebCortex. 24:2401–2408.
16 | Cerebral Cortex
at Stanford University on D
ecember 18, 2015
http://cercor.oxfordjournals.org/D
ownloaded from


![Neural substrates of global perception are modulated by local ......ARTICLES 299 verse[1].This global precedence effect occurs because distinct neural mechanisms are engaged in global](https://img.pdfslide.us/doc/110x75/60f7bd7b824fbd3cdd5b6b23/neural-substrates-of-global-perception-are-modulated-by-local-articles-299.jpg)