Embed Size (px)
Citation preview

Experience Rating Current Challenges
Presented by
Tony DiDonato, NCCI, Inc.
2003 CAS Seminar on Ratemaking
San Antonio, Texas
March 28, 2003
WCP-2
2
NCCI Perspective - Outline
I. ER Basics
II. Off-Balance in NCCI States
III. ERA – Experience Rating Adjustment
IV. Performance Testing Results for NCCI States
3
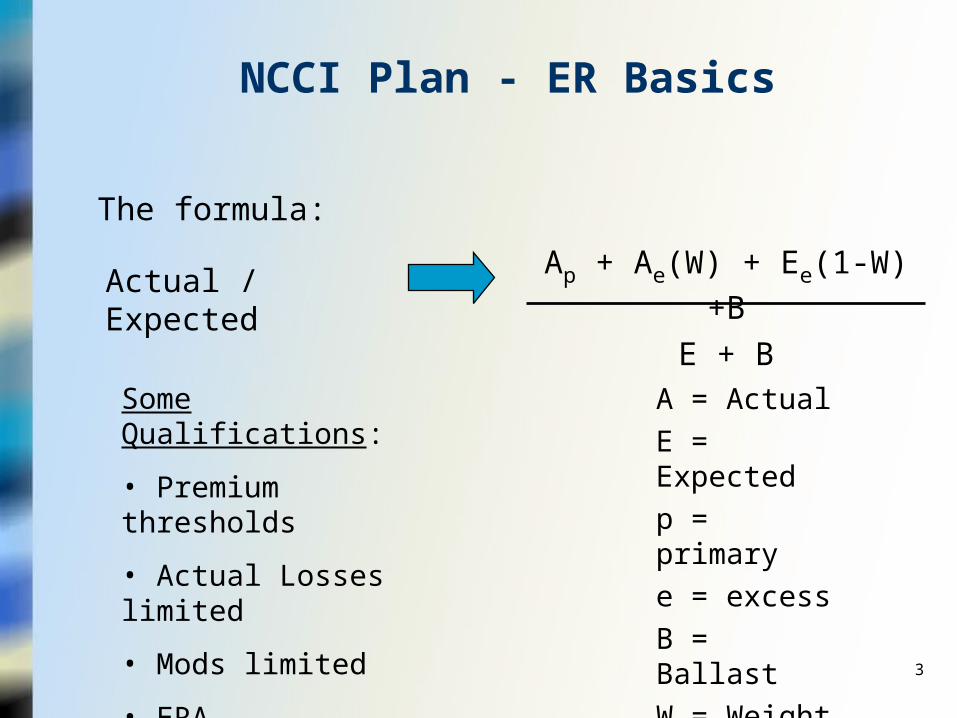
Actual / ExpectedAp + Ae(W) + Ee(1-W) +B
E + B
NCCI Plan - ER Basics
The formula:
A = Actual
E = Expected
p = primary
e = excess
B = Ballast
W = Weight
Some Qualifications:
• Premium thresholds
• Actual Losses limited
• Mods limited
• ERA
4
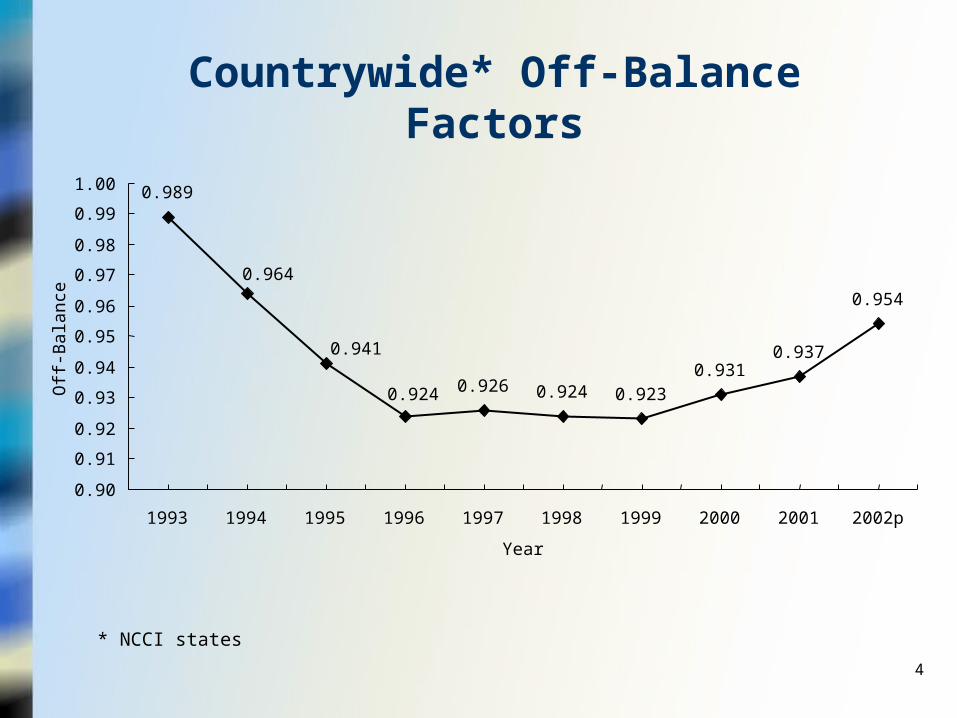
Countrywide* Off-Balance Factors
0.989
0.926 0.924 0.9230.931
0.937
0.954
0.941
0.964
0.924
0.90
0.91
0.92
0.93
0.94
0.95
0.96
0.97
0.98
0.99
1.00
1993 1994 1995 1996 1997 1998 1999 2000 2001 2002p
Year
Off-
Bal
ance
* NCCI states

5
Theoretical off-balance increases by about 0.0025 - 0.0035 for every percentage point of unanticipated frequency change.
Theoretical off-balance increases by about 0.002 - 0.003 for every percentage point of unanticipated severity change.
-20% -12% -4% 0% 4% 12% 20%
-20% 0.900 0.916 0.931 0.939 0.947 0.963 0.978
-12% 0.920 0.938 0.955 0.964 0.972 0.989 1.006
-4% 0.940 0.960 0.978 0.988 0.997 1.016 1.034
0% 0.951 0.970 0.990 1.000 1.010 1.029 1.049
4% 0.961 0.981 1.002 1.012 1.022 1.043 1.063
12% 0.981 1.003 1.025 1.036 1.047 1.069 1.091
20% 1.001 1.025 1.049 1.061 1.073 1.096 1.119
<-- Total Unanticipated % Change in Severity -->
Theoretical Off-balance
Tot
al U
nant
icip
ated
% C
hang
e in
Fre
quen
cy
Unanticipated Frequency and Severity: How is Off-Balance Impacted?
6
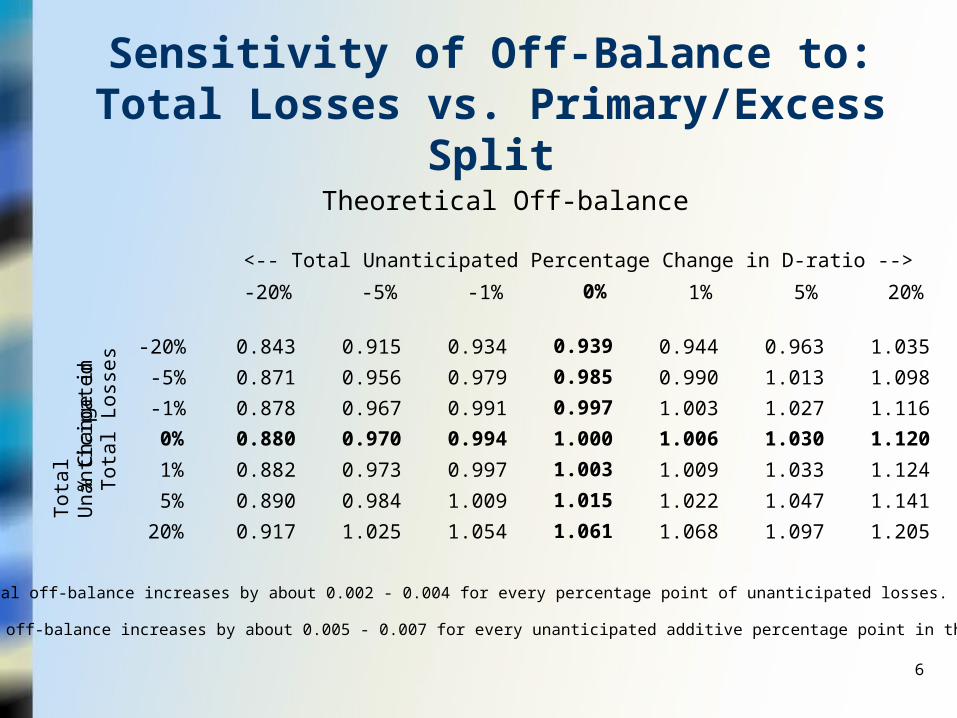
-20% -5% -1% 0% 1% 5% 20%
-20% 0.843 0.915 0.934 0.939 0.944 0.963 1.035
-5% 0.871 0.956 0.979 0.985 0.990 1.013 1.098
-1% 0.878 0.967 0.991 0.997 1.003 1.027 1.116
0% 0.880 0.970 0.994 1.000 1.006 1.030 1.120
1% 0.882 0.973 0.997 1.003 1.009 1.033 1.124
5% 0.890 0.984 1.009 1.015 1.022 1.047 1.141
20% 0.917 1.025 1.054 1.061 1.068 1.097 1.205
Theoretical off-balance increases by about 0.005 - 0.007 for every unanticipated additive percentage point in the D-ratio.
<-- Total Unanticipated Percentage Change in D-ratio -->
Theoretical Off-balance
Theoretical off-balance increases by about 0.002 - 0.004 for every percentage point of unanticipated losses.
To
tal U
na
ntic
ipa
ted
% C
ha
ng
e in
T
ota
l Lo
sse
s
Sensitivity of Off-Balance to:Total Losses vs. Primary/Excess Split
7
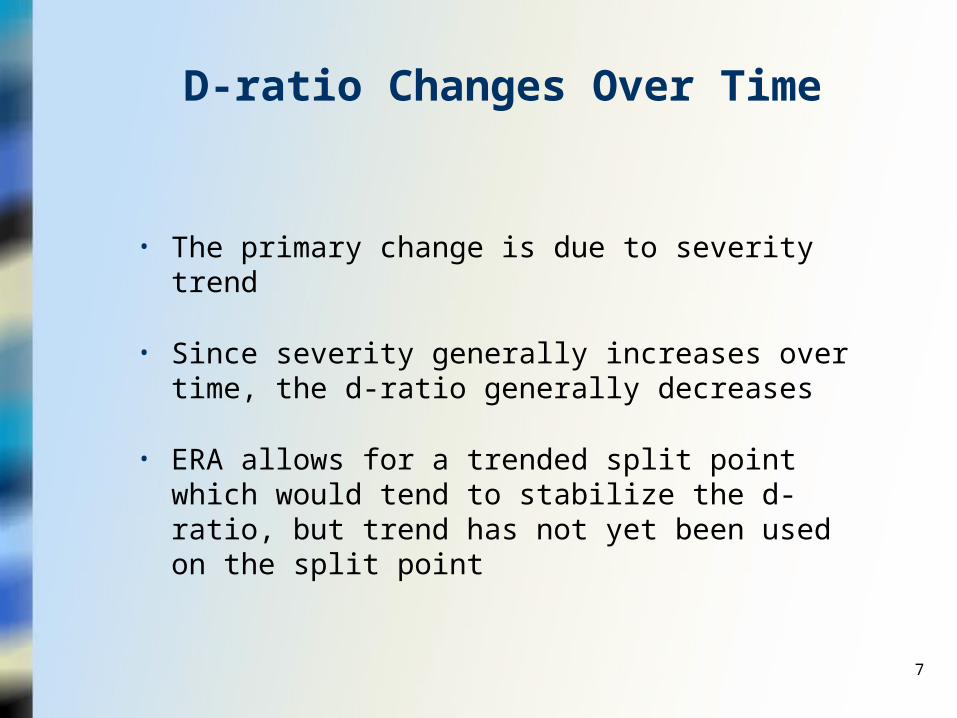
D-ratio Changes Over Time
• The primary change is due to severity trend
• Since severity generally increases over time, the d-ratio generally decreases
• ERA allows for a trended split point which would tend to stabilize the d-ratio, but trend has not yet been used on the split point

8
Primary Actual Primary Expected Difference BetweenExperience Total Actual / / Total Actual / Total Expected Actual D-ratio Average
Rating Years Total Expected (Actual D-ratio) (Expected D-ratio) Expected D-ratio Mod
1996 0.96
1997 0.95
1998 0.95
1999 0.94
2000 0.94
2001
0.84
0.85
0.87
0.84
0.88
0.89
0.30
0.30
0.30
0.27
0.26
0.25
0.28
0.29
0.30
0.28
0.28
0.28
0.02
0.02
0.00
(0.01)
(0.02)
(0.02) 0.95
Total Losses and Primary/Excess Split:Forecast vs. Actual Results
Intrastate Risks – NCCI States
9
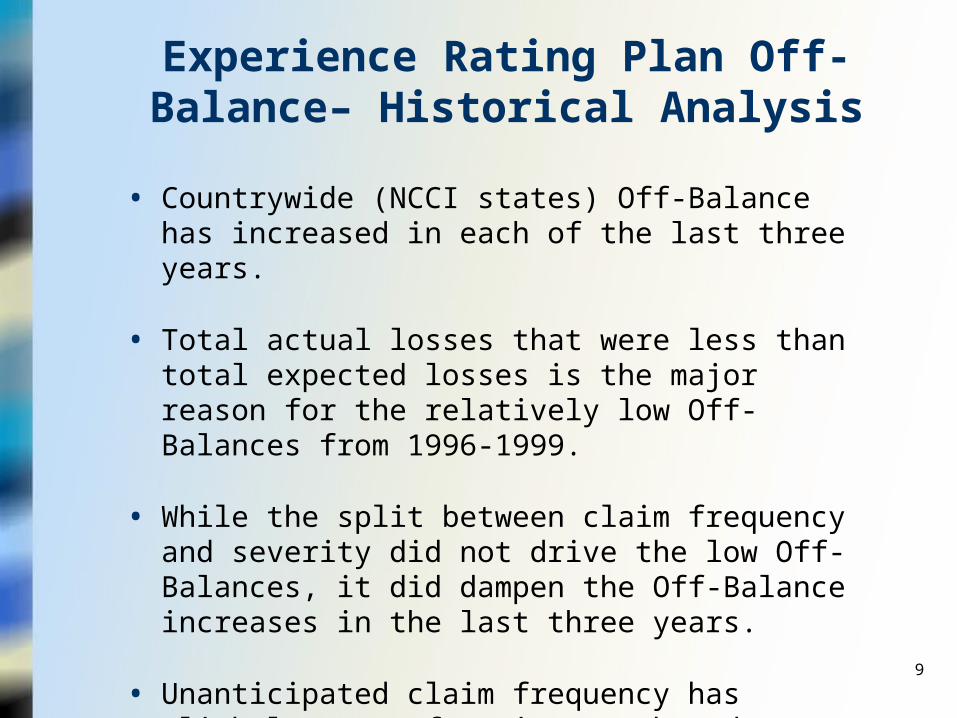
• Countrywide (NCCI states) Off-Balance has increased in each of the last three years.
• Total actual losses that were less than total expected losses is the major reason for the relatively low Off-Balances from 1996-1999.
• While the split between claim frequency and severity did not drive the low Off-Balances, it did dampen the Off-Balance increases in the last three years.
• Unanticipated claim frequency has slightly more of an impact than does unanticipated severity on Mods.
Experience Rating Plan Off-Balance– Historical Analysis
10
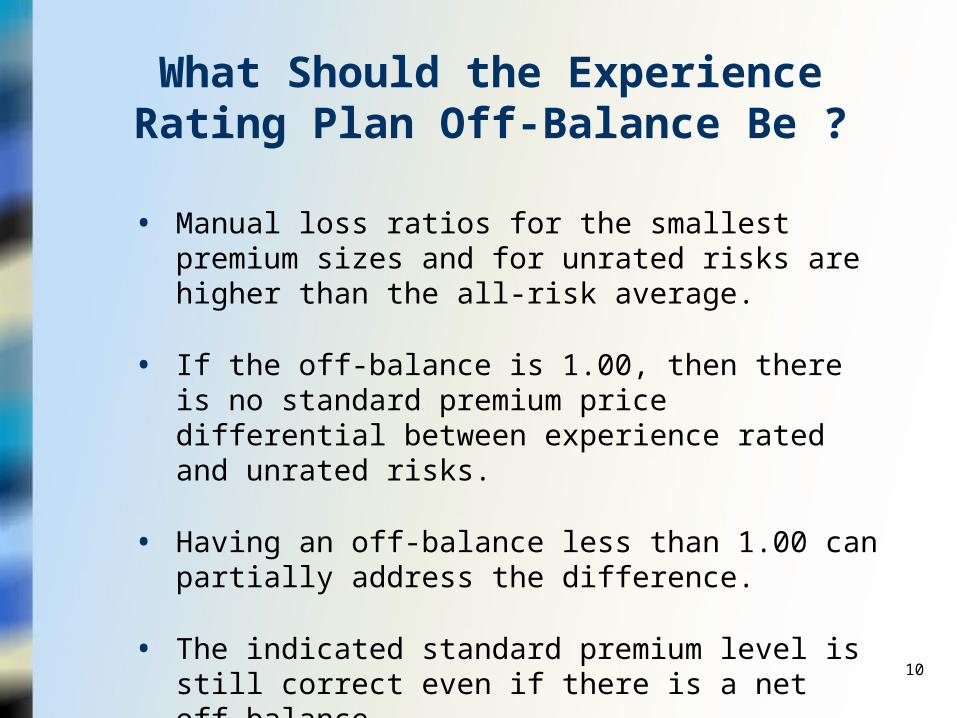
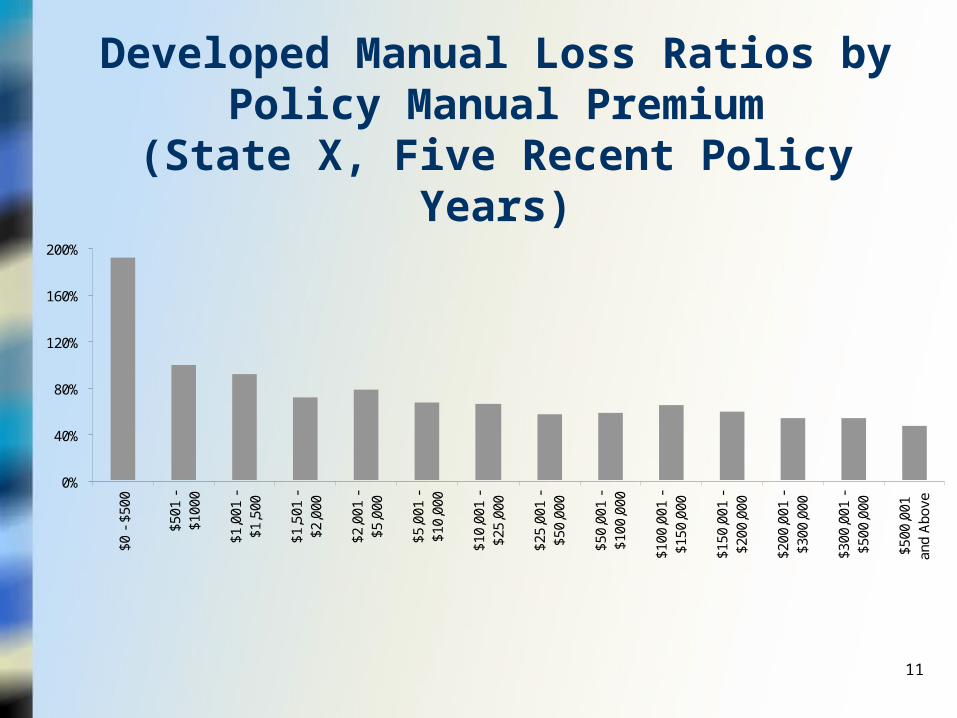
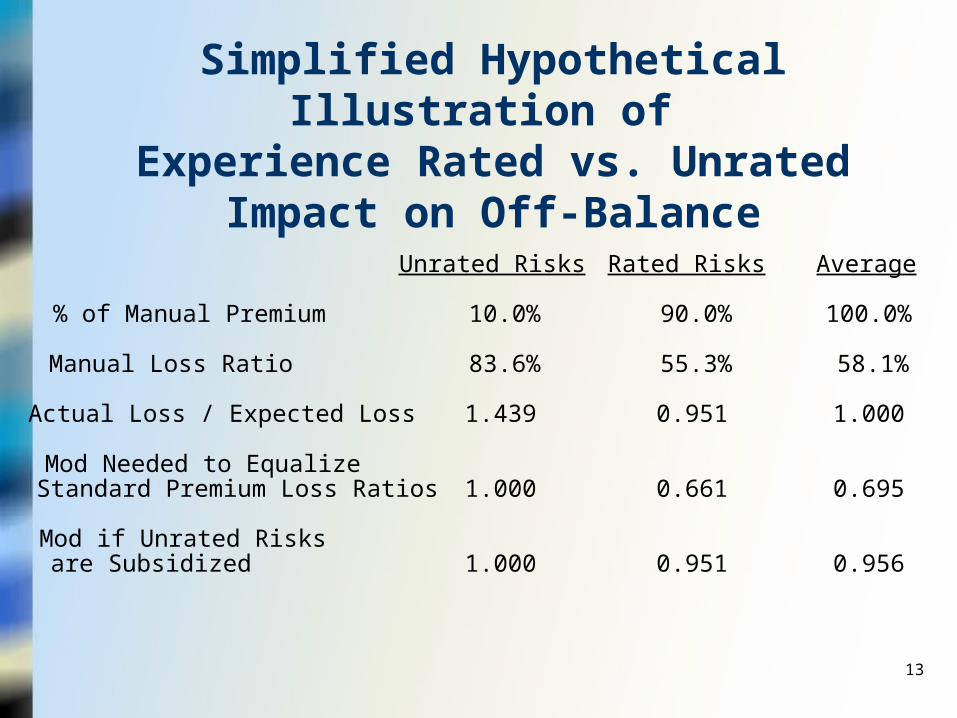
• Manual loss ratios for the smallest premium sizes and for unrated risks are higher than the all-risk average.
• If the off-balance is 1.00, then there is no standard premium price differential between experience rated and unrated risks.
• Having an off-balance less than 1.00 can partially address the difference.
• The indicated standard premium level is still correct even if there is a net off-balance.
What Should the Experience Rating Plan Off-Balance Be ?
11
Developed Manual Loss Ratios byPolicy Manual Premium
(State X, Five Recent Policy Years)
0%
40%
80%
120%
160%
200%
$0 -
$50
0
$501
-$1
000
$1,0
01 -
$1,5
00
$1,5
01 -
$2,0
00
$2,0
01 -
$5,0
00
$5,0
01 -
$10,
000
$10,
001
-$2
5,00
0
$25,
001
-$5
0,00
0
$50,
001
-$1
00,0
00
$100
,001
-$1
50,0
00
$150
,001
-$2
00,0
00
$200
,001
-$3
00,0
00
$300
,001
-$5
00,0
00
$500
,001
and
Abo
ve

12
Developed Manual Loss Ratios (State X, Five Recent Policy Years)
0%
20%
40%
60%
80%
100%
120%
1995 1996 1997 1998 1999 1995-1999
Unrated Intrastate Interstate
13
Unrated Risks Rated Risks
% of Manual Premium
Manual Loss Ratio
Actual Loss / Expected Loss
Mod Needed to EqualizeStandard Premium Loss Ratios
Mod if Unrated Risksare Subsidized
10.0%
83.6%
1.439
1.000
1.000
90.0%
55.3%
0.951
0.661
0.951
Average
100.0%
58.1%
1.000
0.695
0.956
Simplified Hypothetical Illustration of Experience Rated vs. Unrated
Impact on Off-Balance

14
Summary of ERA Changes
(1) Using only 30% of med-only claims in the Experience Rating formula
(2) The Weighting Value (W) was increased
(3) The primary/excess split point (currently $5,000) will be adjusted over time
ERA was designed to increase the incentive for employers to report small med-only claims and to improve the performance of the Plan. This was accomplished by the following three changes to the Plan:
The effective date of ERA varies by state. The earliest effective date is 7/1/98, which is applicable in several states.
15
• Compared changes in the proportion of med-only claims in states adopting ERA vs. states that had not
• Changes in the average severity of med-only claims were also reviewed
• This review did not reveal a significant impact on the reporting of med-only claims due to ERA
ERA Impact on Med-Only Losses
16
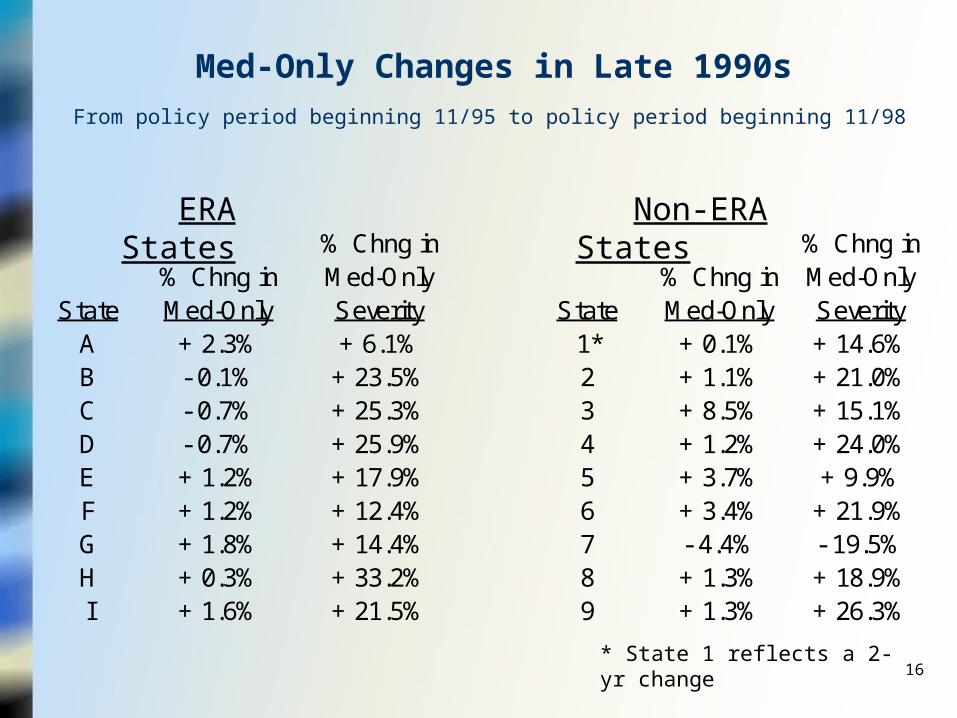
% Chng in % Chng in% Chng in Med-Only % Chng in Med-Only
State Med-Only Severity State Med-Only SeverityA + 2.3% + 6.1% 1* + 0.1% + 14.6%B - 0.1% + 23.5% 2 + 1.1% + 21.0%C - 0.7% + 25.3% 3 + 8.5% + 15.1%D - 0.7% + 25.9% 4 + 1.2% + 24.0%E + 1.2% + 17.9% 5 + 3.7% + 9.9%F + 1.2% + 12.4% 6 + 3.4% + 21.9%G + 1.8% + 14.4% 7 - 4.4% - 19.5%H + 0.3% + 33.2% 8 + 1.3% + 18.9%I + 1.6% + 21.5% 9 + 1.3% + 26.3%
* State 1 reflects a 2-yr change
Med-Only Changes in Late 1990s
From policy period beginning 11/95 to policy period beginning 11/98
ERA States Non-ERA States

17
• 1998 mods were calculated for intrastate risks in the 9 states adopting ERA on 7-1-98
• Initially all rated under GERT, then all re-rated under ERA
• ERA showed slightly more accurate results
Performance Testing: GERT vs. ERA

18
Actual ActualSubsequent Subsequent
Quintile Losses LossesStratum Divided by Squared Deviation Divided by Squared Deviation
Determined Manual from Mean of (2) Modified from Mean of (4)by Mod Expected x 10,000 Expected x 10,000
(1) (2) (3) (4) (5)
1 0.70 900 0.93 121
GERT 2 0.85 225 1.00 16
3 0.94 36 1.04 04 1.09 81 1.07 95 1.48 2,304 1.12 64
Mean or Total 1.00 3,546 1.04 210
0.059
1 0.72 784 0.97 64
ERA 2 0.88 144 1.04 1
3 0.93 49 1.04 14 1.08 64 1.07 45 1.44 1,936 1.09 16
Mean or Total 1.00 2,977 1.05 86
0.029
Test Statistic: (5)/(3)=
Test Statistic: (5)/(3)=
Performance Testing: GERT vs. ERA
19
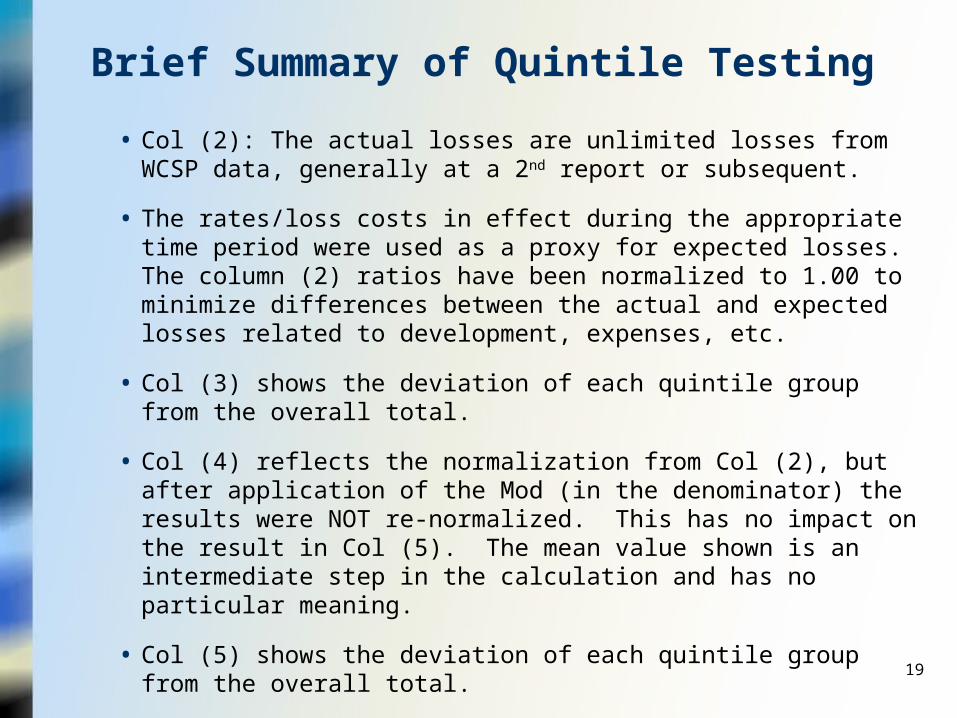
• Col (2): The actual losses are unlimited losses from WCSP data, generally at a 2nd report or subsequent.
• The rates/loss costs in effect during the appropriate time period were used as a proxy for expected losses. The column (2) ratios have been normalized to 1.00 to minimize differences between the actual and expected losses related to development, expenses, etc.
• Col (3) shows the deviation of each quintile group from the overall total.
• Col (4) reflects the normalization from Col (2), but after application of the Mod (in the denominator) the results were NOT re-normalized. This has no impact on the result in Col (5). The mean value shown is an intermediate step in the calculation and has no particular meaning.
• Col (5) shows the deviation of each quintile group from the overall total.
• The test statistics shown at the bottom of each analysis are key. A statistic less than 1.00 is expected from an Experience Rating Plan. Lower values of the statistic indicate better performance.
Brief Summary of Quintile Testing
20
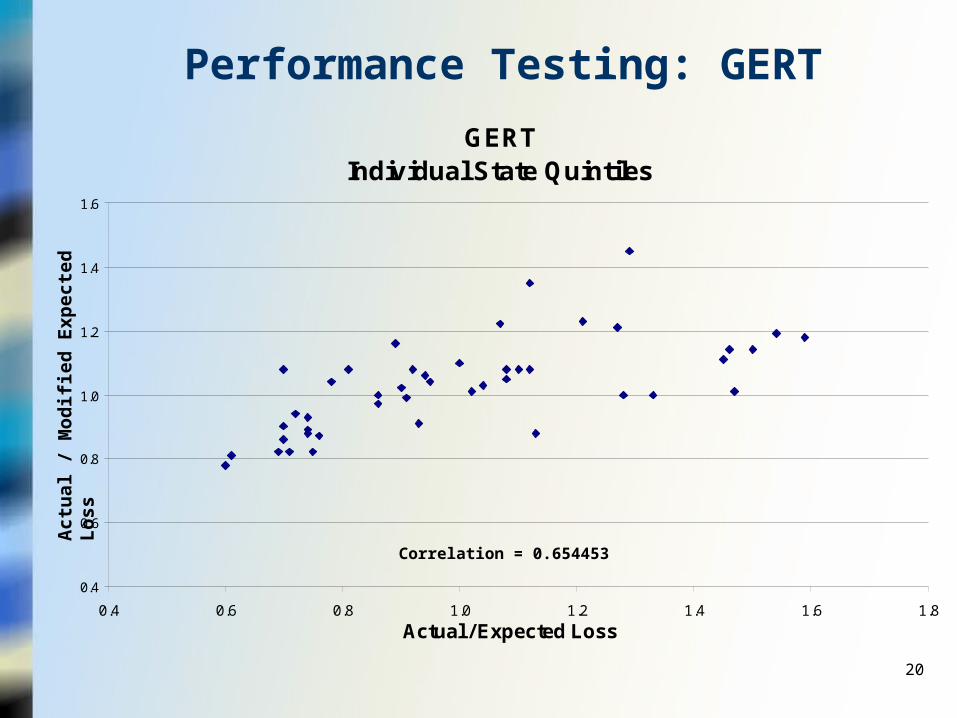
GERT Individual State Quintiles
0.4
0.6
0.8
1.0
1.2
1.4
1.6
0.4 0.6 0.8 1.0 1.2 1.4 1.6 1.8
Actual / Expected Loss
Act
ua
l /
Mo
dif
ied
Exp
ecte
d L
oss
Performance Testing: GERT
Correlation = 0.654453

21
ERAIndividual State Quintiles
0.4
0.6
0.8
1.0
1.2
1.4
1.6
0.4 0.6 0.8 1.0 1.2 1.4 1.6 1.8
Actual / Expected Loss
Ac
tua
l /
Mo
dif
ied
Ex
pe
cte
d L
os
sPerformance Testing: ERA
Correlation = 0.543165

22
Countrywide* Quintile Testing Results
• Includes Interstate and Intrastate Risks
• Policy periods 7/1/97–6/30/98 and 7/1/98–6/30/99 were reviewed
• Two quintile groupings were tested:
– quintile groups which equalized risk count
– quintile groups which equalized expected losses
* NCCI states

23
Actual ActualSubsequent Subsequent
Quintile Losses LossesStratum Divided by Squared Deviation Divided by Squared Deviation Percentage of Percentage of
Determined Manual from Mean of (2) Modified from Mean of (4) Expected Loss Risks Countby Prior Mod Expected x 10,000 Expected x 10,000 in Quintile in Quintile
(1) (2) (3) (4) (5) (6) (7)
Expected Losses Uniformly Distributed Among Quintiles
1 0.66 1,129 1.04 26 20.0% 8.9%2 0.82 324 1.03 34 20.0% 20.0%3 0.95 28 1.07 3 20.0% 30.3%4 1.13 163 1.14 22 20.0% 18.3%5 1.43 1,880 1.13 14 20.0% 22.6%
Mean or Total 1.00 3,524 1.09 100 100.0% 100.0%Test Statistic: (5) / (3) = 0.028
Risk Count Uniformly Distributed Among Quintiles
1 0.72 772 1.04 29 33.4% 20.0%2 0.88 141 1.05 16 14.1% 20.0%3 0.99 0 1.10 1 13.8% 20.0%4 1.13 173 1.12 9 21.4% 20.0%5 1.47 2,234 1.13 17 17.3% 20.0%
Mean or Total 1.00 3,319 1.09 73 100.0% 100.0%Test Statistic: (5) / (3) = 0.022
Countrywide* Quintile Testing ResultsALL RISK SIZES
Policy Effective Period 7/1/97 - 6/30/98
* NCCI states
24
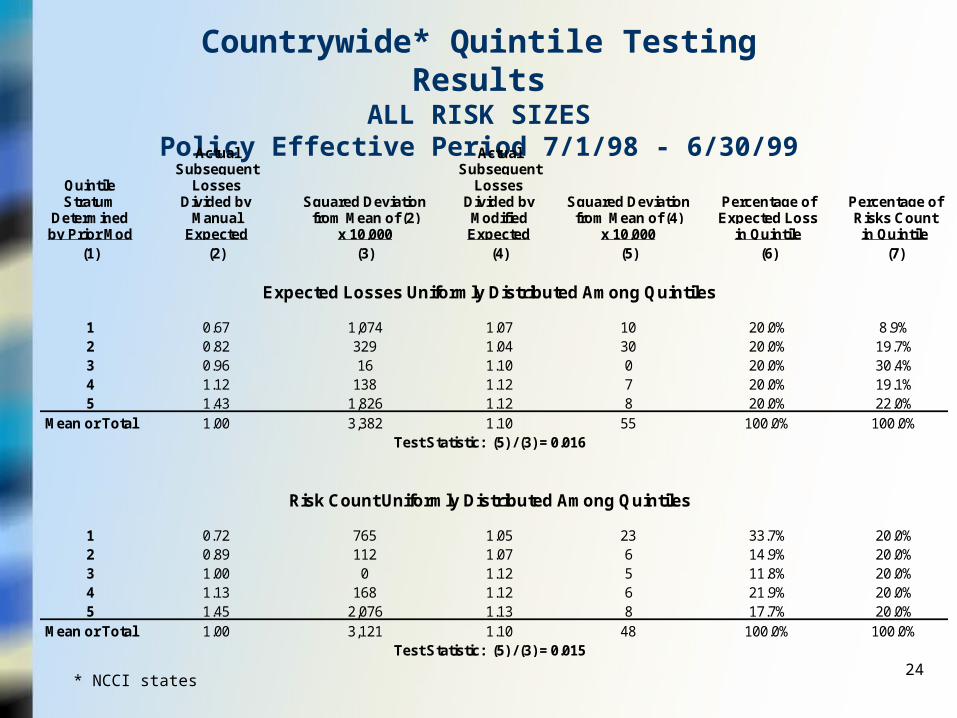
Countrywide* Quintile Testing ResultsALL RISK SIZES
Policy Effective Period 7/1/98 - 6/30/99
Actual ActualSubsequent Subsequent
Quintile Losses LossesStratum Divided by Squared Deviation Divided by Squared Deviation Percentage of Percentage of
Determined Manual from Mean of (2) Modified from Mean of (4) Expected Loss Risks Countby Prior Mod Expected x 10,000 Expected x 10,000 in Quintile in Quintile
(1) (2) (3) (4) (5) (6) (7)
Expected Losses Uniformly Distributed Among Quintiles
1 0.67 1,074 1.07 10 20.0% 8.9%2 0.82 329 1.04 30 20.0% 19.7%3 0.96 16 1.10 0 20.0% 30.4%4 1.12 138 1.12 7 20.0% 19.1%5 1.43 1,826 1.12 8 20.0% 22.0%
Mean or Total 1.00 3,382 1.10 55 100.0% 100.0%Test Statistic: (5) / (3) = 0.016
Risk Count Uniformly Distributed Among Quintiles
1 0.72 765 1.05 23 33.7% 20.0%2 0.89 112 1.07 6 14.9% 20.0%3 1.00 0 1.12 5 11.8% 20.0%4 1.13 168 1.12 6 21.9% 20.0%5 1.45 2,076 1.13 8 17.7% 20.0%
Mean or Total 1.00 3,121 1.10 48 100.0% 100.0%Test Statistic: (5) / (3) = 0.015
* NCCI states
25
0.4
0.6
0.8
1
1.2
1.4
1.6
0.25 0.5 0.75 1 1.25 1.5 1.75 2 2.25
Actual / Expected
Act
ual
/ M
od
ifie
d E
xpec
ted
(n
orm
aliz
ed b
y st
ate)
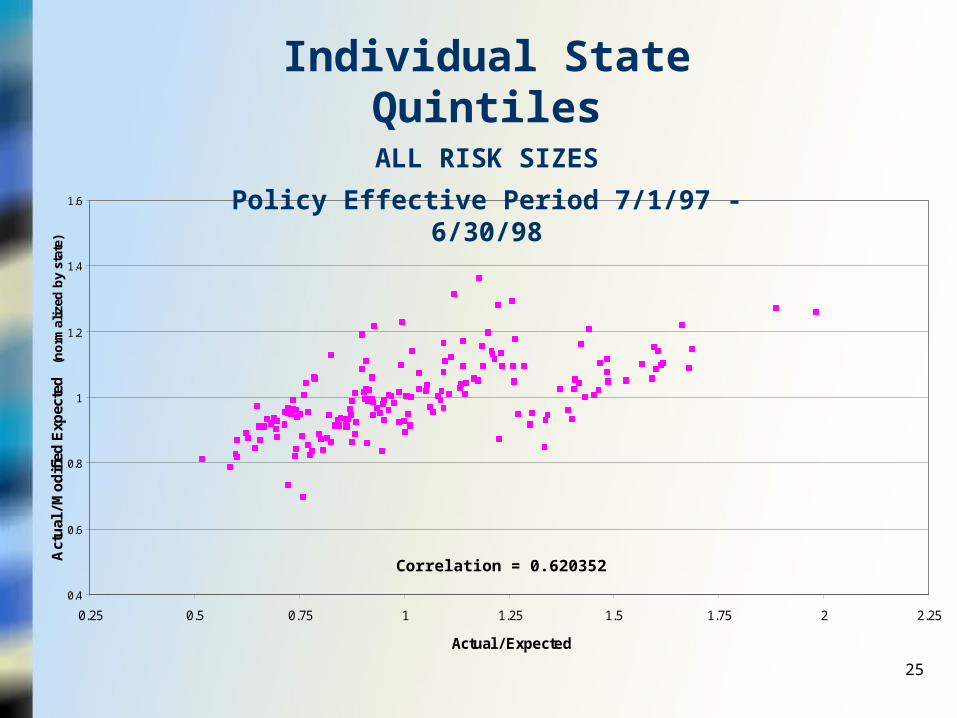
Individual State QuintilesALL RISK SIZES
Policy Effective Period 7/1/97 - 6/30/98
Correlation = 0.620352

26
0.4
0.6
0.8
1
1.2
1.4
1.6
0.25 0.5 0.75 1 1.25 1.5 1.75 2 2.25
Actual / Expected
Act
ual
/ M
od
ifie
d E
xpec
ted
(n
orm
aliz
ed b
y st
ate)
Correlation = 0.502986
Individual State QuintilesALL RISK SIZES
Policy Effective Period 7/1/98 - 6/30/99

27
Quintile* Test Quintile* TestStatistics for Statistics for
Expected Policy Period Policy PeriodLoss Range 7/1/97 - 6/30/98 7/1/98 - 6/30/99
$ 0 - $ 7,500 0.151 0.083
$ 7,500 - $ 15,000 0.051 0.060
$ 15,000 - $ 40,000 0.063 0.067
$ 40,000 - $ 100,000 0.040 0.027
$ 100,000 + 0.039 0.015
Quintiles by Risk CountTest Results by Size of Risk
* The risk count underlying each policy period and range is uniformly distributed among quintile stratum.

28
Quintiles by Expected LossesTest Results by Size of Risk
Quintile* Test Quintile* TestStatistics for Statistics for
Expected Policy Period Policy PeriodLoss Range 7/1/97 - 6/30/98 7/1/98 - 6/30/99
$ 0 - $ 7,500 0.155 0.080
$ 7,500 - $ 15,000 0.053 0.062
$ 15,000 - $ 40,000 0.064 0.066
$ 40,000 - $ 100,000 0.039 0.024
$ 100,000 + 0.040 0.009
* The expected loss volume underlying each policy period and range is uniformly distributed among quintile stratum.
29
Performance Testing: Next Steps
• Currently reviewing the 30% factor for Med-only claims under ERA
• Reviewing treatment of small risks
• Alternative performance measures are being reviewed
• Continued monitoring of ER Plan and performance