Embed Size (px)
Citation preview
Article
Experience in the Monitoring of HV Cable Systems
Authors W. KOLTUNOWICZ, U. BRONIECKI, D. GEBHARDT, O. KRAUSE
Date May 2019
Related OMICRON Product MONCABLO
Application Area Permanent partial discharge monitoring on cables
Keywords Partial discharge monitoring, PD monitoring, high-voltage power cables, cable terminations, cable joints
Version v1.0
Abstract
In this paper, an advanced concept for monitoring the insulation condition of high-voltage cross-linked polyethylene (XLPE) cable systems is described. The paper is based on an actual customer case study in which our MONCABLO on-line partial discharge (PD) monitoring system is used to continuously assess the insulation condition of an underground power cable system.
© OMICRON 2019 Page 2 of 15
Introduction Between 2000 and 2005, a total number of 119 failures in HV cable systems of rated voltages between 60 kV and 500 kV was reported by CIGRE. Approximately 50% of these failures is attributed to external factors (abnormal system conditions, other physical external parameters, mechanical damages caused by third parties, etc.). The same study indicates that direct buried cable systems are about 10 times more likely to be damaged by external conditions than cable systems installed in ducts or tunnels.
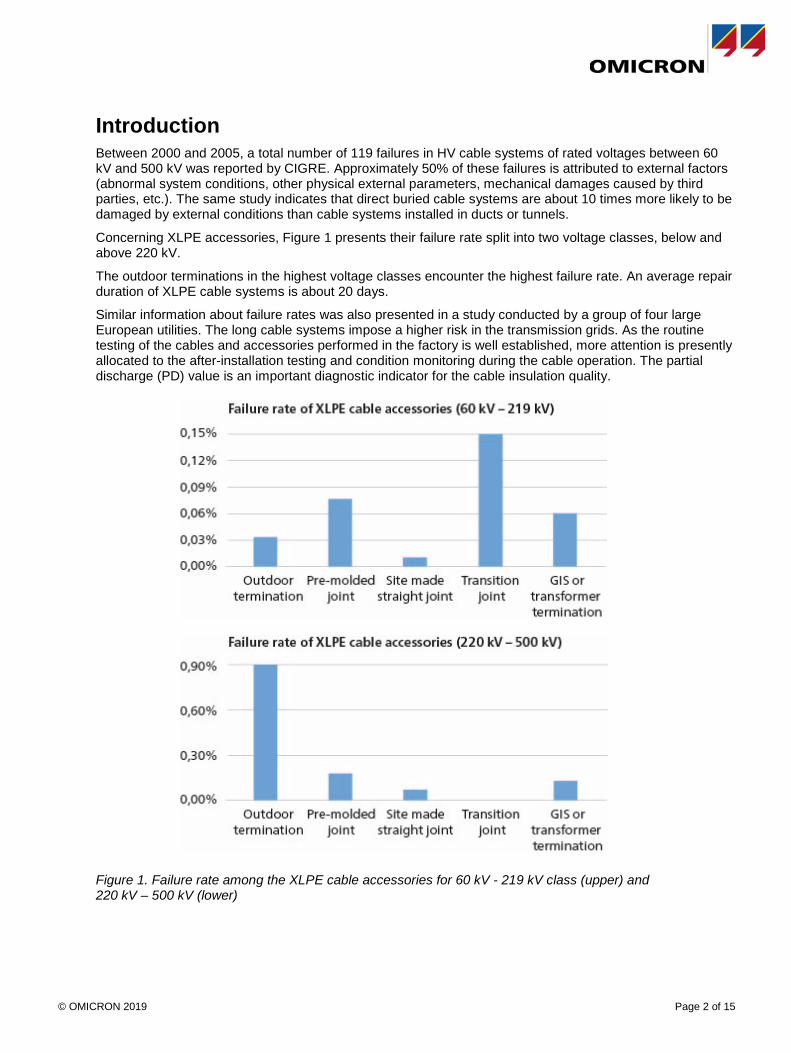
Concerning XLPE accessories, Figure 1 presents their failure rate split into two voltage classes, below and above 220 kV.
The outdoor terminations in the highest voltage classes encounter the highest failure rate. An average repair duration of XLPE cable systems is about 20 days.
Similar information about failure rates was also presented in a study conducted by a group of four large European utilities. The long cable systems impose a higher risk in the transmission grids. As the routine testing of the cables and accessories performed in the factory is well established, more attention is presently allocated to the after-installation testing and condition monitoring during the cable operation. The partial discharge (PD) value is an important diagnostic indicator for the cable insulation quality.
Figure 1. Failure rate among the XLPE cable accessories for 60 kV - 219 kV class (upper) and 220 kV – 500 kV (lower)

© OMICRON 2019 Page 3 of 15
PD measurements PD measurement is nowadays a worldwide accepted method for the condition-based assessment of the HV cable insulation and a required part of after-installation tests. Different solutions for sensors and acquisition techniques have been recommended, applied and lately acknowledged by international standards and technical bodies. For this reason, utilities need to be educated continuously on different technologies and in many cases, they are dependent on external expertise. Therefore, there is a strong need for a versatile PD monitoring system that can be used on different types of cables (XLPE, oil and gas pressure), with different rated voltages up to 500 kV and which are laid down in tunnels or directly buried. Additionally, the system should be able to accommodate other cable condition-relevant data, such as the oil pressure of sealing ends, the state of sheath voltage limiters at the cross-bonded joints, the sheath current, etc. The challenges of designing and installing such a PD monitoring system on buried and tunnel cable systems are discussed in this paper. The design and features of the monitoring system for buried and tunnel cables for after-installation testing and maintenance inspections during cable system operation (Figure 2) are described. The following aspects will be particularly addressed in this paper: sensor positioning and type testing of the link box, power supply for monitoring system installed at buried and tunnel cables, defect localization, and monitoring of additional parameters.
Figure 2. Project elements during the design, installation and operation of a cable monitoring system

© OMICRON 2019 Page 4 of 15
Monitoring system architecture The monitoring system architecture is presented for long cable systems in Figure 3a and for short cable links in Figure 3b. The PD signal is detected by inductive sensors installed in the link boxes and at the cable terminations. Information coming from the PD sensors is synchronously acquired by a multi-channel data acquisition unit. The synchronicity between channels is mandatory for advanced signal processing, leading to signal source separation, defect localization, etc. Further, the data acquisition unit extracts the main characteristics of the PD signal and transfers them to a computer that enables long-term data storage and further post-processing.
1) PD sensor (HFCT) 2) Data acquisition unit 3) Inductive power supply 4) Fiber optic cable 5) Control unit 6) Central computer with monitoring software
Figure 3a. Monitoring system architecture for a long cable system

© OMICRON 2019 Page 5 of 15
The acquisition units are configured and remotely controlled over TCP/IP by the monitoring system software. This allows operators to quickly react to detected problems and access the stored data from any remote location.
Figure 3b. Example of a monitoring system architecture for short cable links of 220 kV and 550 kV; links between GSU transformers and GIS in one power plant

© OMICRON 2019 Page 6 of 15
Arrangement of PD sensors For the PD signal detection, sensors integrated in the joints or external sensors installed on the cross-bonding links are the most common options. In the case of the tunnel cable systems, the installation of the PD sensors at the cable joints is done easily, however some precautions should be taken when sensors are installed in the cross-bonding boxes, as the installation of the PD sensors decreases the clearance between the cross-bonding links (Figure 4).
Figure 4. Installation of PD sensors at a tunnel cable joint (left) and in a link box of a buried cable (right) Therefore, the link box with installed PD sensors needs to be type-tested to guarantee safe and long-term operation. The ac and impulse voltage tests as well as short circuit current and internal arcing tests are required.
Power supply for monitoring system A real challenge that is faced in the case of monitoring long cable systems is the power supply of the acquisition units installed at the joints, which are generally located in remote areas without direct access or close to any source of power supply. Depending on the cable installation mode, different solutions can be adopted to overcome this challenge. For tunnel cable systems, specially developed inductive power supplies can be the solution. The inductive power supply provides the acquisition unit with enough power, even in the case of a very low load of the cable system. It is equipped with the necessary electronics to supervise and manage the dc current delivered at its output, depending on the various HV cable current load situations, and to filter any disturbances of the PD measurements close by.
PD Sensors

© OMICRON 2019 Page 7 of 15
Figure 5. Power supply solutions for tunnel (left) and buried cable systems
In case of buried cables, the laying of a low-voltage (LV) conductor together with the power cable is a common practice. To ensure safe operation, a specially-designed transient suppression circuitry needs to be installed at each joint (Figure 5 – right). It ensures protection in case of travelling over-voltages generated by lightning strikes at the cable terminations or near the link box, grid switching or inrush currents. During normal operation, the LV circuitry is supplied by the substation at one of the cable ends. In case of interruption, the circuitry supply is possible from both cable ends. In addition to the arrestors meant to suppress the common mode and differential mode voltages, a temperature controller is installed in the power supply cabinet.

© OMICRON 2019 Page 8 of 15
Monitoring software Software structure The software is a highly modular, scalable distributed system. Its architecture consists of a Windows-based core part and a web-based control part [8]. The core part of the Monitoring Software is realized as Windows services and runs continuously without any direct user interactions. The core system enables the collection and persistence of the measurement, data post-processing and analysis, security tasks for data access and system operations, as well as external interfaces for data exchange over Ethernet or a field bus. The monitoring system receives data from each acquisition unit in two modes: permanent mode and periodic mode. During the permanent mode, the data is acquired every second, compared with threshold values and displayed in the graphical user interface in real time. When this data is within normal margins, it will be colored in green. If the values exceed thresholds for "warning" or "alarm", they are colored in yellow or red accordingly. The permanent mode data can be visualized simultaneously for all monitored locations or individually for each location (Figure 6). A comparison of the scalar values for all cable accessories is also possible (comparative view).
Figure 6. Real time data visualization in the permanent mode of the Monitoring Software
Periodic measurements are initiated in equidistant time spans, such as every hour. The duration of the periodic measurement is normally 1 minute. During this time span, all mentioned scalar values are calculated and PRPD (Phase Resolved PD) and 3PARD (3 Pulse Amplitude Relation Diagram) diagrams are acquired [9]. This data is saved for post-processing and trend visualization. Unscheduled periodic measurements are triggered in case one or more measured quantities exceed the pre-set threshold levels. Additionally, the monitoring system records data sets (periodic basis or triggered by events) and performs automated separation between multiple signal sources, indicating the most probable phase of its origin to facilitate data interpretation by users without expert knowledge. Figure 7 presents the data (scalar values and images) that is stored for each point of the historical trend.

© OMICRON 2019 Page 9 of 15
The monitoring system software is also responsible for communication and data transfer to supervisory systems via universal physical interfaces and protocols. At the same time, the monitoring system is capable of processing and visualizing data coming from third-party sensors via the same web interface. The user can be notified anytime per email/SMS if the pre-set thresholds are exceeded, indicating the location and timestamp of the occurrence.
Figure 7. Visualization of scalar values and images stored for each point of the historical trend
Tools for automated data evaluation For automated PD evaluation, the software makes use of specific tools that enable the separation of PRPD clusters from different sources of PD signals on a regular basis (e.g. once per day), or when triggered by events and/or by the user. The 3PARD diagram generation is enabled by synchronous data acquisition. This diagram visualizes the relation among amplitudes of a single PD pulse in one phase and its crosstalk-generated signals in the other two phases [10]. By repetition of this procedure for a large number of PD pulses, PD sources within the test object as well as external noise appear as a clearly distinguishable concentration of dots (clusters) in a 3PARD diagram (Figure 8). The cluster separation is performed on a regular basis or when the alarm / warning thresholds are exceeded. In case of PD signals, the acquisition unit performs advanced pre-processing of the raw data. The disturbances are removed and main characteristics of the PD signal are determined and transferred to the computer, which enables long-term data storage. Data acquisition is synchronously performed at all channels of one acquisition unit and at all acquisition units of the monitoring system. The synchronicity among multiple acquisition units is achieved through their daisy-chain connection via fiber optic (FO) cable, which is pre-installed in the power cable. To prevent data loss due to FO interruptions, the daisy-chain starts and ends at the central computer. During normal operation, the data is transmitted on a single path, while in case of an FO interruption (whose location is indicated by the monitoring system) the data is transferred via two paths.

© OMICRON 2019 Page 10 of 15
Figure 8. Example of cluster separation using 3PARD
Defect localization The PD localization functionality is based on a unique algorithm that performs a statistical evaluation of the original pulses and their reflections at two different points of the cable where data acquisition units are installed. This functionality is enabled by synchronous data acquisition between all acquisition units. During cable operation, the acquisition units adjacent to the signal source to be investigated will be used as trigger and correlation sources. The distance from the trigger source to the location of the signal source is automatically calculated and displayed in the diagnosis software (Figure 9).
Figure 9. PD localization functionality of the monitoring system

© OMICRON 2019 Page 11 of 15
After installation testing HV tests are executed on site for all extruded HV cables, and usually on-site test procedures must be negotiated between the manufacturer and the user based on international and national standards.
Dielectric tests performed on site do not replace type tests and routine tests. They are supplementary to dielectric routine tests and aim at checking the dielectric integrity of the fully assembled cable line to eliminate defects such as damages during transportation and lay-out, or incorrect assembly of the accessories. On-site installation work has a residual risk of introducing faults, as conditions are not ideal for an installation of EHV accessories. Small particles, dust, moisture, droplets, etc., might lead to defects in electrically-critical locations of the accessories, possibly leading to a reduced lifetime of the cable system or to failure. Therefore, it is important to be able to detect, locate and identify the defect. Defects will generate partial discharges if the local electric field at the defect exceeds the PD inception value.
The preferred voltage for factory tests is the AC voltage of industrial frequency, which is standardized for laboratory testing in the range of 45 to 65 Hz. For on-site testing, a frequency tolerance between 20 and 300 Hz is acceptable. A frequency resonant reactor with fixed inductance and excitation by frequency-tuned voltage is typically used for applying the AC test voltage.
Figure 10. Resonance test set-up for testing of cable system
Figure 11. Example of after-installation PD measurements at all accessories of a cable system

© OMICRON 2019 Page 12 of 15
When an HV AC on-site test can be done in combination with PD measurements, all the experience from the routine testing in the factory can be transferred to on-site testing. Because HV cables must be tested at the manufacturing facility prior to shipping to the installation site, on-site PD measurements focus on the accessories installed in the field.
The continuous PD monitoring system is prepared to be used during after-installation dielectric testing. The complete simultaneous recording of PD activity at all accessories is performed and the PD signal is synchronized with the test voltage source.
© OMICRON 2019 Page 13 of 15
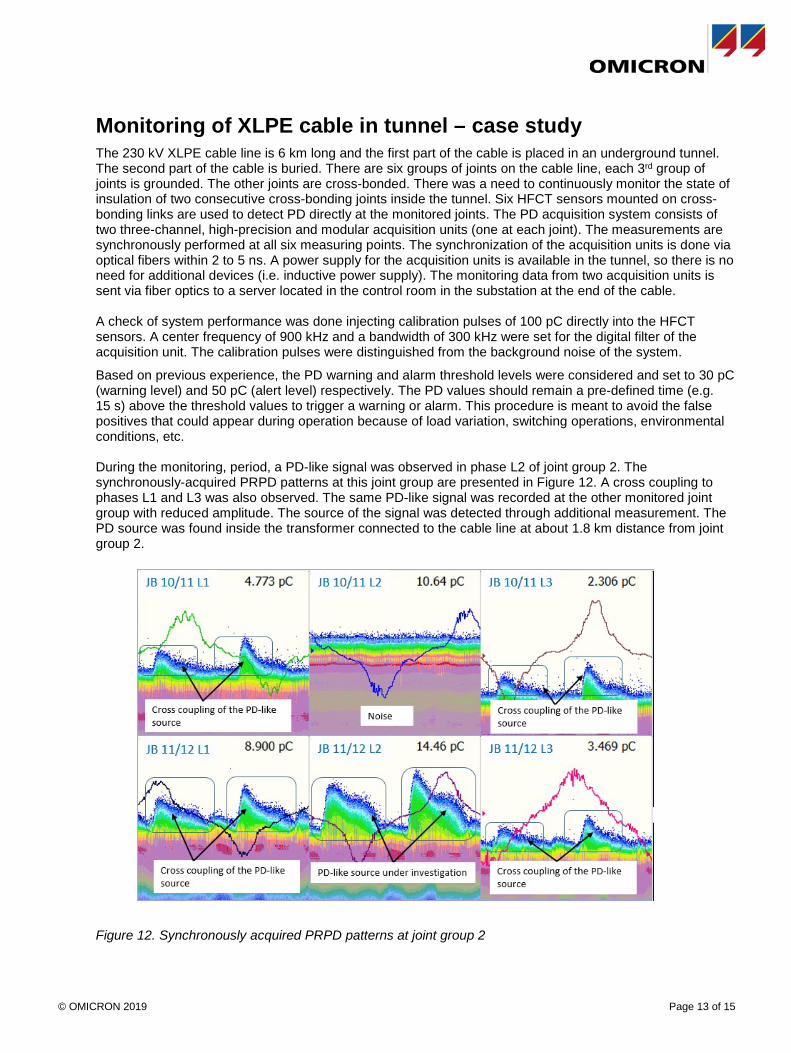
Monitoring of XLPE cable in tunnel – case study The 230 kV XLPE cable line is 6 km long and the first part of the cable is placed in an underground tunnel. The second part of the cable is buried. There are six groups of joints on the cable line, each 3rd group of joints is grounded. The other joints are cross-bonded. There was a need to continuously monitor the state of insulation of two consecutive cross-bonding joints inside the tunnel. Six HFCT sensors mounted on cross-bonding links are used to detect PD directly at the monitored joints. The PD acquisition system consists of two three-channel, high-precision and modular acquisition units (one at each joint). The measurements are synchronously performed at all six measuring points. The synchronization of the acquisition units is done via optical fibers within 2 to 5 ns. A power supply for the acquisition units is available in the tunnel, so there is no need for additional devices (i.e. inductive power supply). The monitoring data from two acquisition units is sent via fiber optics to a server located in the control room in the substation at the end of the cable. A check of system performance was done injecting calibration pulses of 100 pC directly into the HFCT sensors. A center frequency of 900 kHz and a bandwidth of 300 kHz were set for the digital filter of the acquisition unit. The calibration pulses were distinguished from the background noise of the system. Based on previous experience, the PD warning and alarm threshold levels were considered and set to 30 pC (warning level) and 50 pC (alert level) respectively. The PD values should remain a pre-defined time (e.g. 15 s) above the threshold values to trigger a warning or alarm. This procedure is meant to avoid the false positives that could appear during operation because of load variation, switching operations, environmental conditions, etc. During the monitoring, period, a PD-like signal was observed in phase L2 of joint group 2. The synchronously-acquired PRPD patterns at this joint group are presented in Figure 12. A cross coupling to phases L1 and L3 was also observed. The same PD-like signal was recorded at the other monitored joint group with reduced amplitude. The source of the signal was detected through additional measurement. The PD source was found inside the transformer connected to the cable line at about 1.8 km distance from joint group 2.
Figure 12. Synchronously acquired PRPD patterns at joint group 2

© OMICRON 2019 Page 14 of 15
Conclusions The monitoring system provider supported the asset owner in all stages of the monitoring project, from system design to maintenance of the monitoring system in service.
The modern HV cable PD monitoring system provided the asset owner with the following features:
> Automated separation of PD sources and noise suppression. Synchronous multi-channel evaluation techniques fulfilled these requirements.
> Localization of PD sources along the entire length of HV cable due to the successful application of dual-end statistical Time Domain Reflectometry.
> Monitoring of additional cable condition-relevant parameters such as, e.g. sheath current, status of sheath voltage limiters, and oil pressure in terminations. This enables the further reduction of the operation costs by eliminating some of the preventive maintenance activities (sheath and cross-bonding functionality verification).
> PD measurements of the cable system during after-installation dielectric tests. Performing PD measurements simultaneously at all cable accessories during the AC withstand voltage test is advantageous.
Additionally, proven solutions and expertise were delivered by the monitoring system provider in the following areas:
> Solutions for the monitoring system power supply. The low-voltage circuitry was proposed for buried cable systems and an inductive power supply for tunnel cable systems.
> Sensor positioning and the installation of PD sensors in the link boxes.

www.omicronenergy.com
© OMICRON Subject to change without notice.