Embed Size (px)
Citation preview
Prepared by the Banque De France
Twenty-Ninth Meeting of the
IMF Committee on Balance of Payments Statistics
Experience in Compiling Data on Financial Derivatives
Washington D.C., USA
October 24–26, 2016
BOPCOM—16/24

2
3
3
Directorate General Statistics
Directorate Balance of Payments François MOURIAUX1
September 2016
Experience in Compiling Data on Financial Derivatives
Summary
Starting in January 2011, Banque de France has implemented a specific survey on cross-border
derivatives as part of the changeover process to BPM6. This survey replaced a previous reporting based
on cross-border payments data. The new survey-based approach enabled to capture a more accurate
picture of instruments, counterparties, market values and allowed for a robust stock-flow reconciliation
on a yearly basis.
Over the years, French banks have secured a market share in the engineering of sophisticated
derivatives. This “supply capacity”, combined with a buy-side of corporates, asset managers and
insurance companies, is reflected by the significance of the derivative instruments in the BoP and IIP
statistics of France.
The experience in compiling derivative data for the BoP and IIP during the past five years underlines the
importance of understanding the business models that generate cross-border trades in derivatives. This
understanding proves helpful for the data quality management as well as for using BoP and IIP data for
macro-financial stability analysis.
In 2015 Banque de France engaged in a new round of discussions with banks to enhance the existing
survey. The purpose was to strengthen the benchmarks for the quarterly data quality management and
enhance the analytical value of the data, notably by collecting information on the underlying instrument.
Notional values will also be collected, thus enabling to fulfill all the items of the Table A9III of the Manual
– Notional Value of Foreign Currency and Foreign-Currency-Linked Contracts with Nonresidents.
The extension of the data collection started with the reference period T4 2015 (notional values package)
and the rest of the package will start as from January 2017. The outcome of the discussions with the
banks shows that – as far as France is concerned – the major reporting entities understand the rationale
and usefulness of providing the BoP compiler with a data collection including market value data on flows
and stocks, notional values and underlying instruments with a counterparty country breakdown. It
enables to strengthen the data quality management for the BoP and IIP statistics and improve the
understanding of the part played by these financial instruments in the cross-border flows and positions.
1 This paper has been prepared with extensive support and advice from Corinne DEVILLERS and Françoise Bernardin
4
4
Contents
1 - Characteristics of financial derivatives transactions in the BOP statistics of France
1.1 Methodology – some comments
1.2 Data collection
1.2.1 Features
1.2.2 Key figures 1.2.3 Economic significance
2 - Data Quality Management
2.1 – First level checks
2.2 – Second level checks 2.21 Comparison of data between reporting entities 2.22 “other changes” 2.23 Stocks and the joint stock-flow
2.3 – Comparisons with external data
2.31 Bilateral data 2.32 Legal entity-level data 2.33 Consolidated data
2.33.1 Consolidated data published by banking groups 2.33.2 Aggregated data published by the BIS
2.24 Use of market data
2.4 – Practical issues arising from the implementation of the data quality management
2.4.1 Accounting Compensation 2.4.2 Exchange rates 2.4.3 Criterion of residence 2.4.4 Derivatives flows with group entities
5
5
3 - Developments and prospects
3.1 Enhancements of the collection of derivatives at market value 3.1.1 Rationale 3.1.2 Enhancements : additional reporting requirements
3.2 New collection on notional values 3.3 Extending the data collection to other sectors
4 - Impacts of the development of clearing houses (CCP) on the registration of derivatives in balance of payments and international investment position
4.1 Margin calls 4.2 Identification of issuers and final holders
6
6
1 - Characteristics of financial derivatives transactions in BOP statistics
1.1 Methodology –some comments
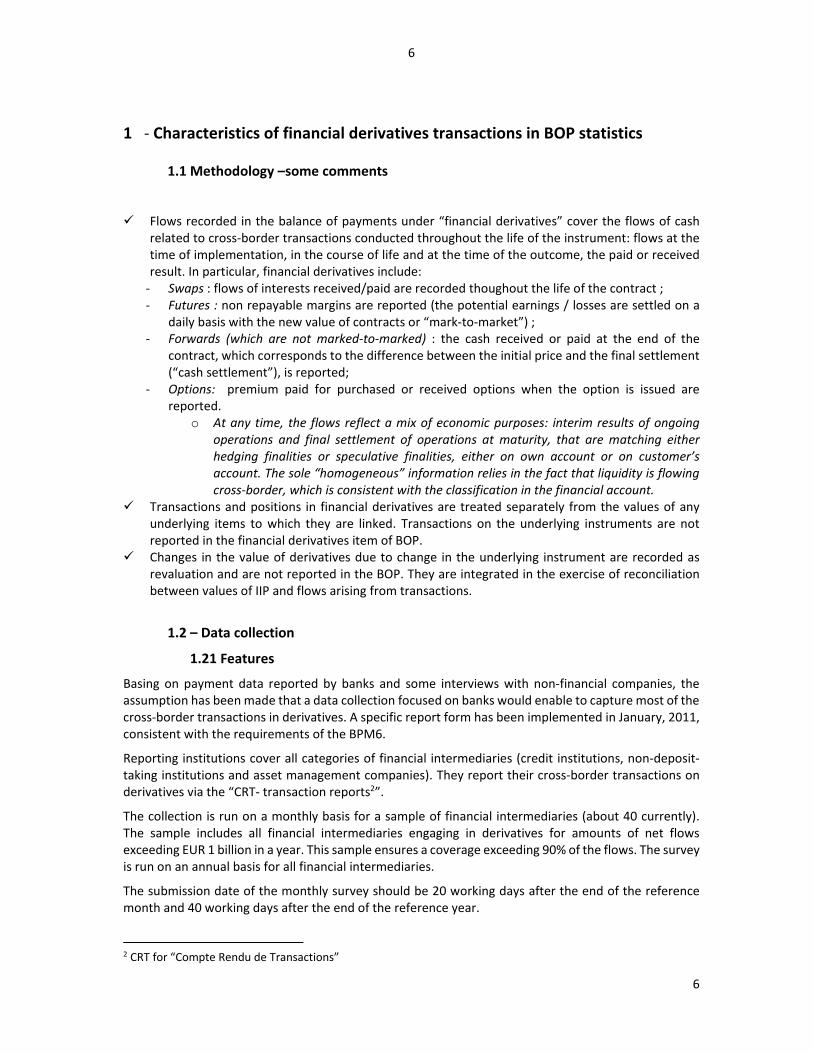
Flows recorded in the balance of payments under “financial derivatives” cover the flows of cash related to cross-border transactions conducted throughout the life of the instrument: flows at the time of implementation, in the course of life and at the time of the outcome, the paid or received result. In particular, financial derivatives include:
- Swaps : flows of interests received/paid are recorded thoughout the life of the contract ; - Futures : non repayable margins are reported (the potential earnings / losses are settled on a
daily basis with the new value of contracts or “mark-to-market”) ; - Forwards (which are not marked-to-marked) : the cash received or paid at the end of the
contract, which corresponds to the difference between the initial price and the final settlement (“cash settlement”), is reported;
- Options: premium paid for purchased or received options when the option is issued are reported.
o At any time, the flows reflect a mix of economic purposes: interim results of ongoing operations and final settlement of operations at maturity, that are matching either hedging finalities or speculative finalities, either on own account or on customer’s account. The sole “homogeneous” information relies in the fact that liquidity is flowing cross-border, which is consistent with the classification in the financial account.
Transactions and positions in financial derivatives are treated separately from the values of any underlying items to which they are linked. Transactions on the underlying instruments are not reported in the financial derivatives item of BOP.
Changes in the value of derivatives due to change in the underlying instrument are recorded as revaluation and are not reported in the BOP. They are integrated in the exercise of reconciliation between values of IIP and flows arising from transactions.
1.2 – Data collection
1.21 Features
Basing on payment data reported by banks and some interviews with non-financial companies, the assumption has been made that a data collection focused on banks would enable to capture most of the cross-border transactions in derivatives. A specific report form has been implemented in January, 2011, consistent with the requirements of the BPM6.
Reporting institutions cover all categories of financial intermediaries (credit institutions, non-deposit-taking institutions and asset management companies). They report their cross-border transactions on derivatives via the “CRT- transaction reports2”.
The collection is run on a monthly basis for a sample of financial intermediaries (about 40 currently). The sample includes all financial intermediaries engaging in derivatives for amounts of net flows exceeding EUR 1 billion in a year. This sample ensures a coverage exceeding 90% of the flows. The survey is run on an annual basis for all financial intermediaries.
The submission date of the monthly survey should be 20 working days after the end of the reference month and 40 working days after the end of the reference year.
2 CRT for “Compte Rendu de Transactions”
7
7
The purpose of this collection is to collect derivatives transactions and “other changes in assets and liabilities”. Stocks are reported on an annual basis.
Flows and stocks are reported at market value. Market value determines the accounting entry: if the market value is positive, then it is recorded under assets and if the market value is negative, then it is recorded under liabilities. Data reported have to follow the formula:
Former Stock (+ or -) Transactions flows (+or -) Revaluation flows = Next Stock.
Reporting institutions are requested to provide a breakdown of assets and liabilities by instrument, currency, country and kind of market.
Table 1
Instrument Swaps, options, futures and forwards
Country Counterparty country or issuer country or clearing house’s country or market country (ISO country code)
Currency 21 currencies and « other »
Kind of market Exchange-traded derivatives / Over-the-counter derivatives (including Centrally cleared derivatives)
1.22 Key figures
Flows recorded in the balance of payments :
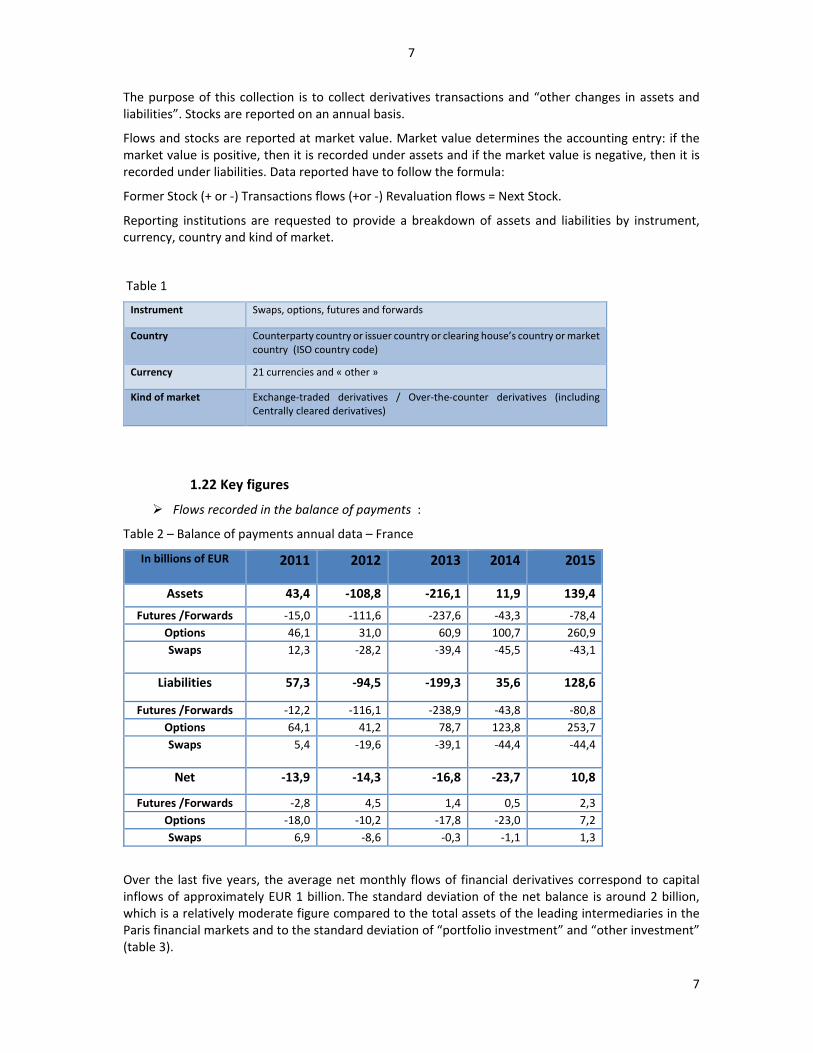
Table 2 – Balance of payments annual data – France
In billions of EUR 2011 2012 2013 2014 2015
Assets 43,4 -108,8 -216,1 11,9 139,4
Futures /Forwards -15,0 -111,6 -237,6 -43,3 -78,4
Options 46,1 31,0 60,9 100,7 260,9
Swaps
12,3 -28,2 -39,4 -45,5 -43,1
Liabilities 57,3 -94,5 -199,3 35,6 128,6
Futures /Forwards -12,2 -116,1 -238,9 -43,8 -80,8
Options 64,1 41,2 78,7 123,8 253,7
Swaps
5,4 -19,6 -39,1 -44,4 -44,4
Net -13,9 -14,3 -16,8 -23,7 10,8
Futures /Forwards -2,8 4,5 1,4 0,5 2,3
Options -18,0 -10,2 -17,8 -23,0 7,2
Swaps 6,9 -8,6 -0,3 -1,1 1,3
Over the last five years, the average net monthly flows of financial derivatives correspond to capital inflows of approximately EUR 1 billion.The standard deviation of the net balance is around 2 billion, which is a relatively moderate figure compared to the total assets of the leading intermediaries in the Paris financial markets and to the standard deviation of “portfolio investment” and “other investment” (table 3).
8
8
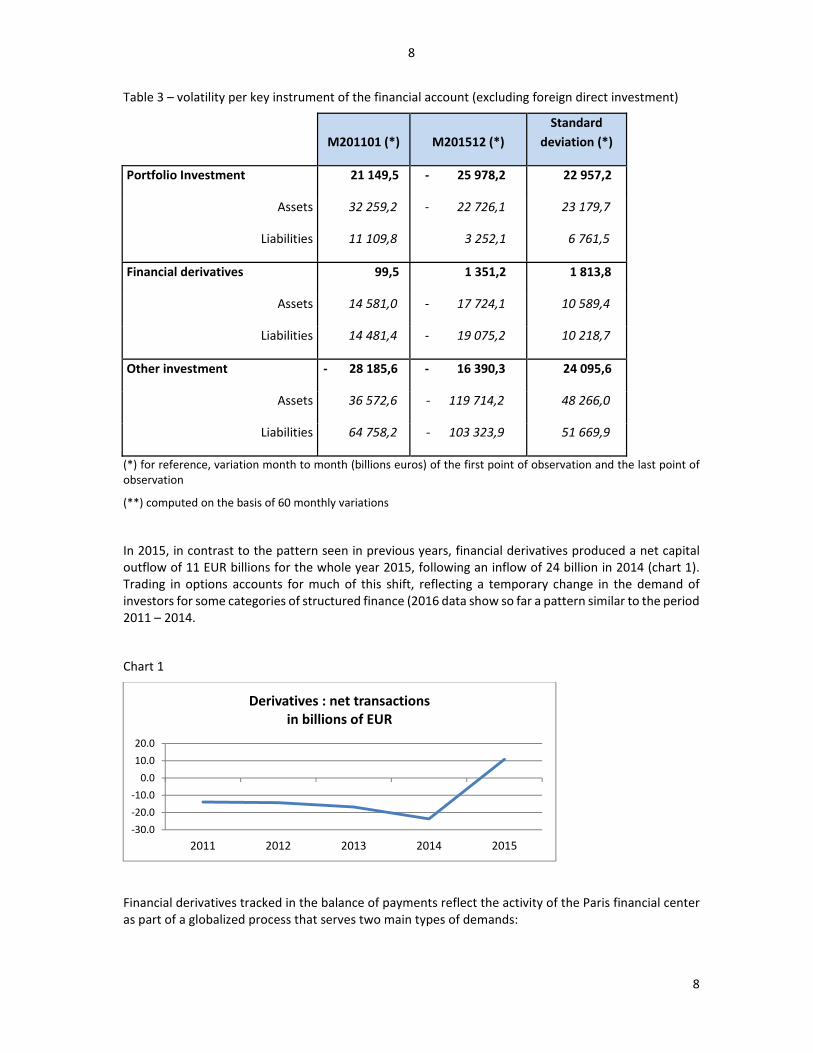
Table 3 – volatility per key instrument of the financial account (excluding foreign direct investment)
M201101 (*) M201512 (*)
Standard
deviation (*)
Portfolio Investment 21 149,5 - 25 978,2 22 957,2
Assets 32 259,2 - 22 726,1 23 179,7
Liabilities 11 109,8 3 252,1 6 761,5
Financial derivatives 99,5 1 351,2 1 813,8
Assets 14 581,0 - 17 724,1 10 589,4
Liabilities 14 481,4 - 19 075,2 10 218,7
Other investment - 28 185,6 - 16 390,3 24 095,6
Assets 36 572,6 - 119 714,2 48 266,0
Liabilities 64 758,2 - 103 323,9 51 669,9
(*) for reference, variation month to month (billions euros) of the first point of observation and the last point of observation
(**) computed on the basis of 60 monthly variations
In 2015, in contrast to the pattern seen in previous years, financial derivatives produced a net capital outflow of 11 EUR billions for the whole year 2015, following an inflow of 24 billion in 2014 (chart 1). Trading in options accounts for much of this shift, reflecting a temporary change in the demand of investors for some categories of structured finance (2016 data show so far a pattern similar to the period 2011 – 2014.
Chart 1
Financial derivatives tracked in the balance of payments reflect the activity of the Paris financial center as part of a globalized process that serves two main types of demands:
-30.0
-20.0
-10.0
0.0
10.0
20.0
2011 2012 2013 2014 2015
Derivatives : net transactionsin billions of EUR
9
9
hedging, as multinational enterprises aim at neutralizing all or part of their exposures to interest rate or foreign exchange risks ;
engineering services to structure products designed to offer a range of risk/returns, adjusted to the profile of the investors. This activity is narrowly related to the activity of asset management.
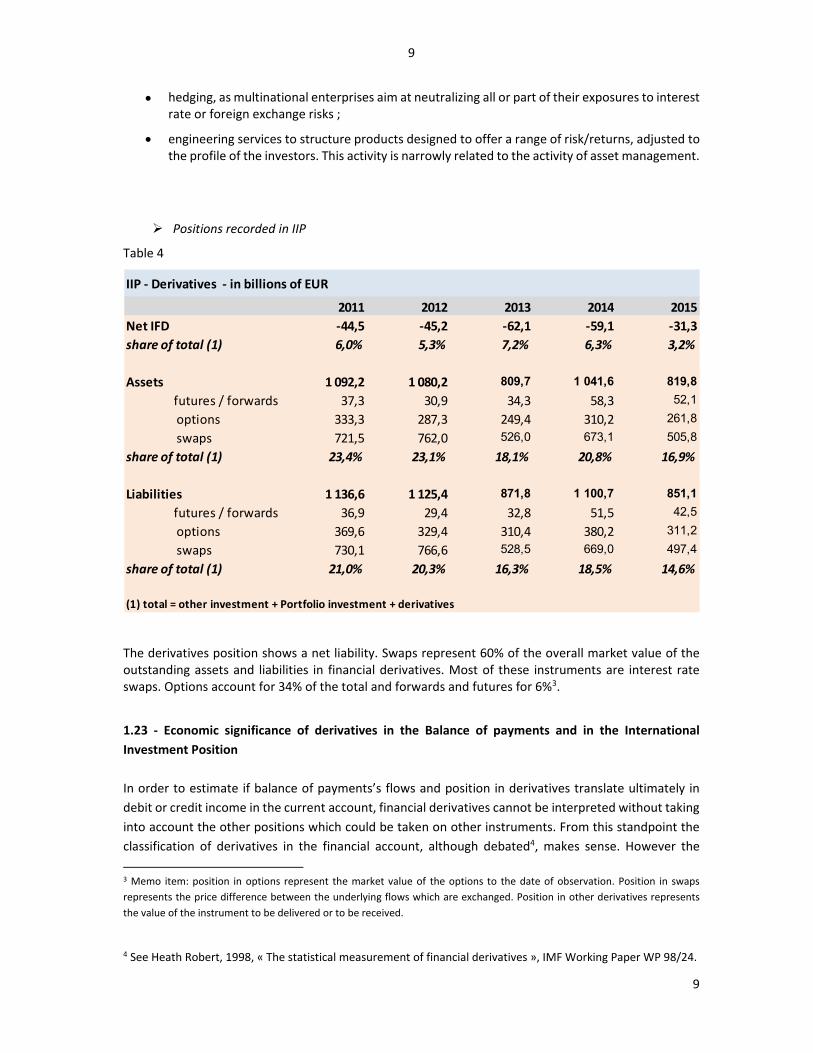
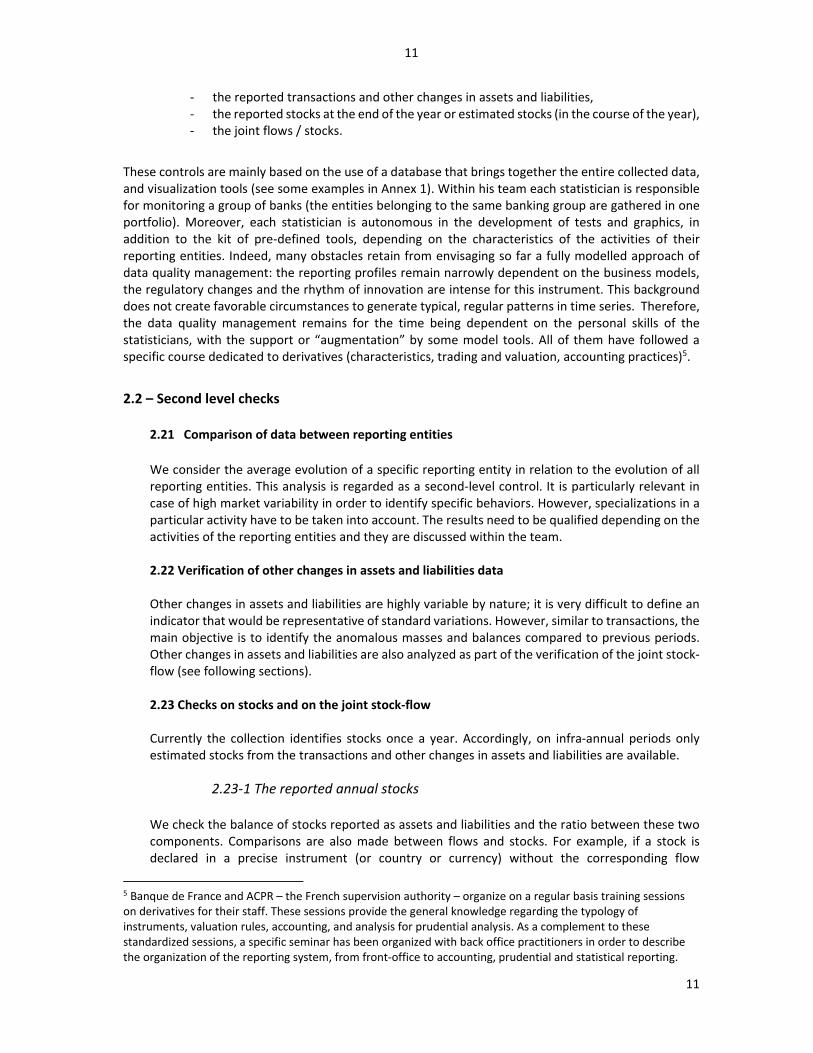
Positions recorded in IIP
Table 4
The derivatives position shows a net liability. Swaps represent 60% of the overall market value of the outstanding assets and liabilities in financial derivatives. Most of these instruments are interest rate swaps. Options account for 34% of the total and forwards and futures for 6%3.
1.23 - Economic significance of derivatives in the Balance of payments and in the International
Investment Position
In order to estimate if balance of payments’s flows and position in derivatives translate ultimately in
debit or credit income in the current account, financial derivatives cannot be interpreted without taking
into account the other positions which could be taken on other instruments. From this standpoint the
classification of derivatives in the financial account, although debated4, makes sense. However the
3 Memo item: position in options represent the market value of the options to the date of observation. Position in swaps
represents the price difference between the underlying flows which are exchanged. Position in other derivatives represents
the value of the instrument to be delivered or to be received.
4 See Heath Robert, 1998, « The statistical measurement of financial derivatives », IMF Working Paper WP 98/24.
IIP - Derivatives - in billions of EUR
2011 2012 2013 2014 2015
Net IFD -44,5 -45,2 -62,1 -59,1 -31,3
share of total (1) 6,0% 5,3% 7,2% 6,3% 3,2%
Assets 1 092,2 1 080,2 809,7 1 041,6 819,8
futures / forwards 37,3 30,9 34,3 58,3 52,1
options 333,3 287,3 249,4 310,2 261,8
swaps 721,5 762,0 526,0 673,1 505,8
share of total (1) 23,4% 23,1% 18,1% 20,8% 16,9%
Liabilities 1 136,6 1 125,4 871,8 1 100,7 851,1
futures / forwards 36,9 29,4 32,8 51,5 42,5
options 369,6 329,4 310,4 380,2 311,2
swaps 730,1 766,6 528,5 669,0 497,4
share of total (1) 21,0% 20,3% 16,3% 18,5% 14,6%
(1) total = other investment + Portfolio investment + derivatives
10
10
purpose of the BoP is not to enable this kind of analysis – enterprise level analysis seems for the time
being better fitted for such a purpose.
Good quality BoP and IIP derivative data can contribute to the analysis of financial stability by giving
insights into two types of risks:
- the risk of liquidity : large and irregular flows in derivatives in the financial account suggest a
stronger constraint for securing, on balance, a wide access to the international liquidity (this
need for liquidity appears all the more challenging as underlying assets are volatile and margin
calls are large);
- The "cost of replacement": the value of the derivatives position is a proxy, at a given date, to
the "cost of replacement ", if, under special market circumstances, positions have to be
unwinded.
As mentioned above, as far as the financial account of the balance of payments of France is concerned, derivatives are a secondary source of fluctuations in the liquidity exchanged with the "rest of the world" with regard to other components of the BOP -other investments and portfolio investments. Turning to the international investment position, in 2015 the net foreign liability on financial derivatives (- 31.3 billion) accounted for 3,2% of the total (portfolio investment + other investment + derivatives), the “max” being observed in 2013 (7.2%). Derivatives assets accounted for 17% of this total and derivatives liabilities accounted for 15% compared to 23% and 24% in 2011.
A large share of derivatives transactions in France involves the four “systemic banks”, although other actors have regular activities and sometimes hold a strong position on specific instruments or vis-à-vis counterparty countries. As a reference, 44 credit institutions were selected to participate in the BIS 2016 triennial OTC derivatives survey.
This activity is based both on the use of standardized products traded on platforms such as Eurex or Liffe, and the conception of “bespoke” instruments. Given the statistically significant impact of this activity on the BoP and IIP, Banque de France BoP department has regular conversations with the key market players to understand how their operations generally translate into cross-border flows and positions.
2 - Data Quality Management
Banque de France data quality management of BoP derivative data has four main objectives: - evaluate the size and activity of the reporting entities regarding financial derivatives, - assess the market values of financial derivatives both for assets and liabilities, - understand the temporal evolution of transactions of financial intermediaries in
financial derivatives, - map the geography of flows and benchmark the reporting entities.
Several tools have been developed in order to achieve these different goals. They can be classified into two main categories: internal checks and checks that use external sources.
2.1 – First level checks
First level checks are based on classical criteria (geographic, temporal, balance between assets and liabilities ...). Checks focus on:
11
11
- the reported transactions and other changes in assets and liabilities, - the reported stocks at the end of the year or estimated stocks (in the course of the year), - the joint flows / stocks.
These controls are mainly based on the use of a database that brings together the entire collected data, and visualization tools (see some examples in Annex 1). Within his team each statistician is responsible for monitoring a group of banks (the entities belonging to the same banking group are gathered in one portfolio). Moreover, each statistician is autonomous in the development of tests and graphics, in addition to the kit of pre-defined tools, depending on the characteristics of the activities of their reporting entities. Indeed, many obstacles retain from envisaging so far a fully modelled approach of data quality management: the reporting profiles remain narrowly dependent on the business models, the regulatory changes and the rhythm of innovation are intense for this instrument. This background does not create favorable circumstances to generate typical, regular patterns in time series. Therefore, the data quality management remains for the time being dependent on the personal skills of the statisticians, with the support or “augmentation” by some model tools. All of them have followed a specific course dedicated to derivatives (characteristics, trading and valuation, accounting practices)5.
2.2 – Second level checks
2.21 Comparison of data between reporting entities
We consider the average evolution of a specific reporting entity in relation to the evolution of all reporting entities. This analysis is regarded as a second-level control. It is particularly relevant in case of high market variability in order to identify specific behaviors. However, specializations in a particular activity have to be taken into account. The results need to be qualified depending on the activities of the reporting entities and they are discussed within the team. 2.22 Verification of other changes in assets and liabilities data
Other changes in assets and liabilities are highly variable by nature; it is very difficult to define an indicator that would be representative of standard variations. However, similar to transactions, the main objective is to identify the anomalous masses and balances compared to previous periods. Other changes in assets and liabilities are also analyzed as part of the verification of the joint stock-flow (see following sections). 2.23 Checks on stocks and on the joint stock-flow
Currently the collection identifies stocks once a year. Accordingly, on infra-annual periods only estimated stocks from the transactions and other changes in assets and liabilities are available.
2.23-1 The reported annual stocks
We check the balance of stocks reported as assets and liabilities and the ratio between these two components. Comparisons are also made between flows and stocks. For example, if a stock is declared in a precise instrument (or country or currency) without the corresponding flow
5 Banque de France and ACPR – the French supervision authority – organize on a regular basis training sessions on derivatives for their staff. These sessions provide the general knowledge regarding the typology of instruments, valuation rules, accounting, and analysis for prudential analysis. As a complement to these standardized sessions, a specific seminar has been organized with back office practitioners in order to describe the organization of the reporting system, from front-office to accounting, prudential and statistical reporting.
12
12
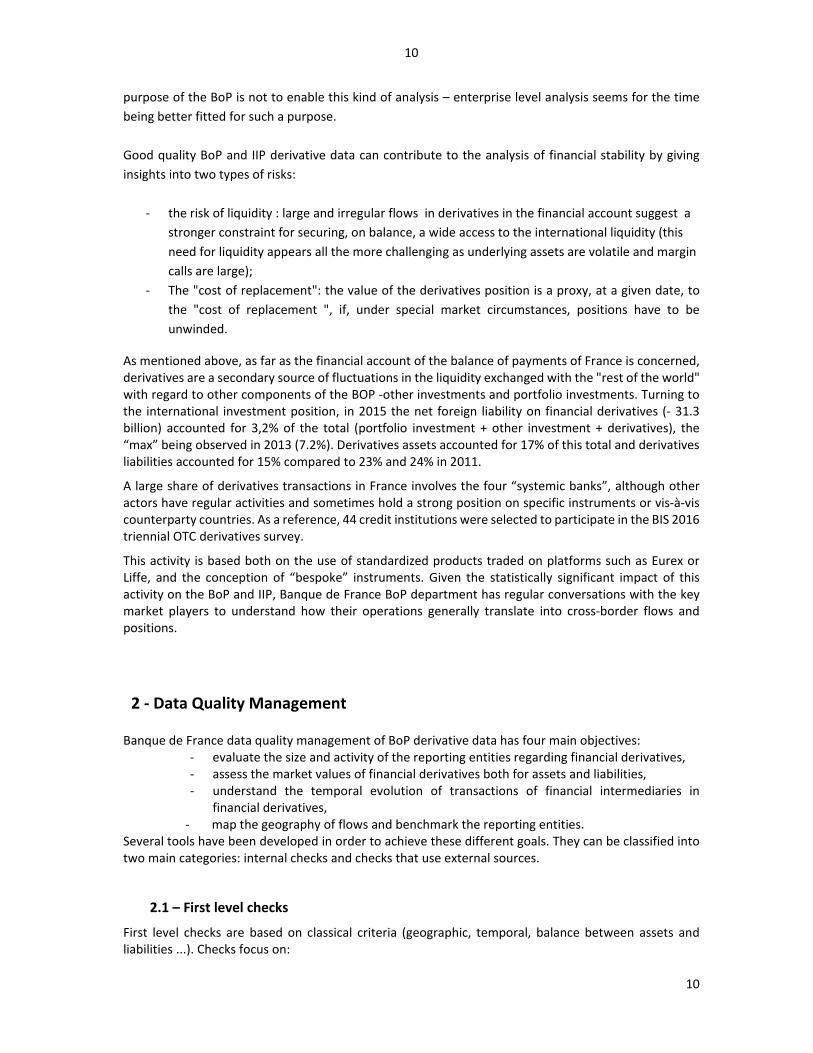
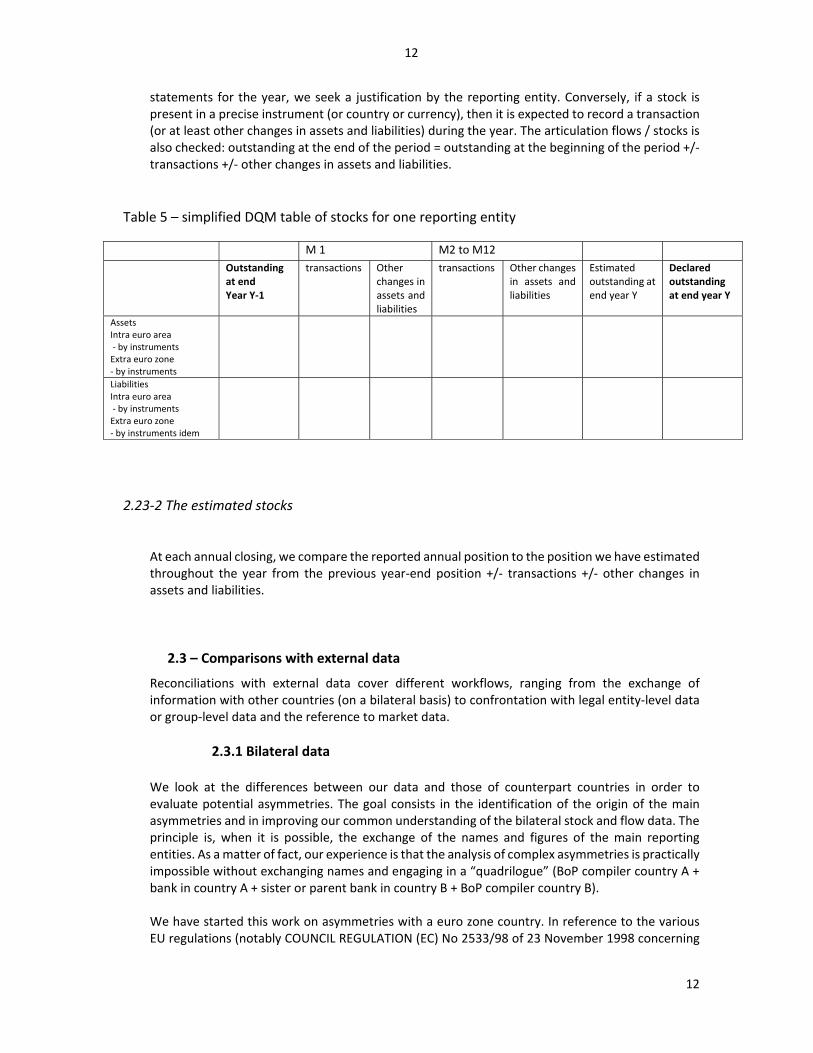
statements for the year, we seek a justification by the reporting entity. Conversely, if a stock is present in a precise instrument (or country or currency), then it is expected to record a transaction (or at least other changes in assets and liabilities) during the year. The articulation flows / stocks is also checked: outstanding at the end of the period = outstanding at the beginning of the period +/- transactions +/- other changes in assets and liabilities.
Table 5 – simplified DQM table of stocks for one reporting entity
M 1 M2 to M12 Outstanding at end Year Y-1
transactions Other changes in assets and liabilities
transactions Other changes in assets and liabilities
Estimated outstanding at end year Y
Declared outstanding at end year Y
Assets Intra euro area - by instruments Extra euro zone - by instruments
Liabilities Intra euro area - by instruments Extra euro zone - by instruments idem
2.23-2 The estimated stocks
At each annual closing, we compare the reported annual position to the position we have estimated throughout the year from the previous year-end position +/- transactions +/- other changes in assets and liabilities.
2.3 – Comparisons with external data
Reconciliations with external data cover different workflows, ranging from the exchange of information with other countries (on a bilateral basis) to confrontation with legal entity-level data or group-level data and the reference to market data.
2.3.1 Bilateral data
We look at the differences between our data and those of counterpart countries in order to evaluate potential asymmetries. The goal consists in the identification of the origin of the main asymmetries and in improving our common understanding of the bilateral stock and flow data. The principle is, when it is possible, the exchange of the names and figures of the main reporting entities. As a matter of fact, our experience is that the analysis of complex asymmetries is practically impossible without exchanging names and engaging in a “quadrilogue” (BoP compiler country A + bank in country A + sister or parent bank in country B + BoP compiler country B). We have started this work on asymmetries with a euro zone country. In reference to the various EU regulations (notably COUNCIL REGULATION (EC) No 2533/98 of 23 November 1998 concerning
13
13
the collection of statistical information by the European Central Bank – article 8 - ) we have the legal basis to exchange names and figures. Once the names and figures are exchanged, we ask the main reporting entities involved to work on the internal reconciliation of their reporting. We prepare with the partner country involved in the exchange a data set, for a given period, putting together the reported data on both sides and ask them to provide us with metadata information (how do they actually compile the data, how do they implement in detail our respective technical documentation). We do not exclude the analysis of bilateral asymmetries with non-EU countries; if a significant asymmetry issue arises, we would seek the permission of the potentially involved reporting entities to exchange names and data, on the basis of a reciprocal agreement with the bilateral partner. We are committed to use this information solely for the purpose of investigating and solving asymmetries in our respective statistics. These bilateral exchanges help to solve asymmetries, if any, or, at least, to improve our knowledge
of reporting practices and potential methodological differences. The ongoing experience with a EU country bilateral partner suggests that a working program of about two years is necessary before robust results are delivered.
2.3.2 Use of data at the legal entity-level
Basing on a National data arrangement between Banque de France and ACPR, we use the outstanding reported in a national prudential form (called IFTResNR) covering the balance sheet position of options in market value vis-à-vis non-residents on a legal entity-level basis. This is a quarterly report. We compare these figures to our quarterly estimated stocks.
2.3.3 Use of consolidated data
We use two data sources: available data at the micro level on banking groups and aggregate data published by the BIS.
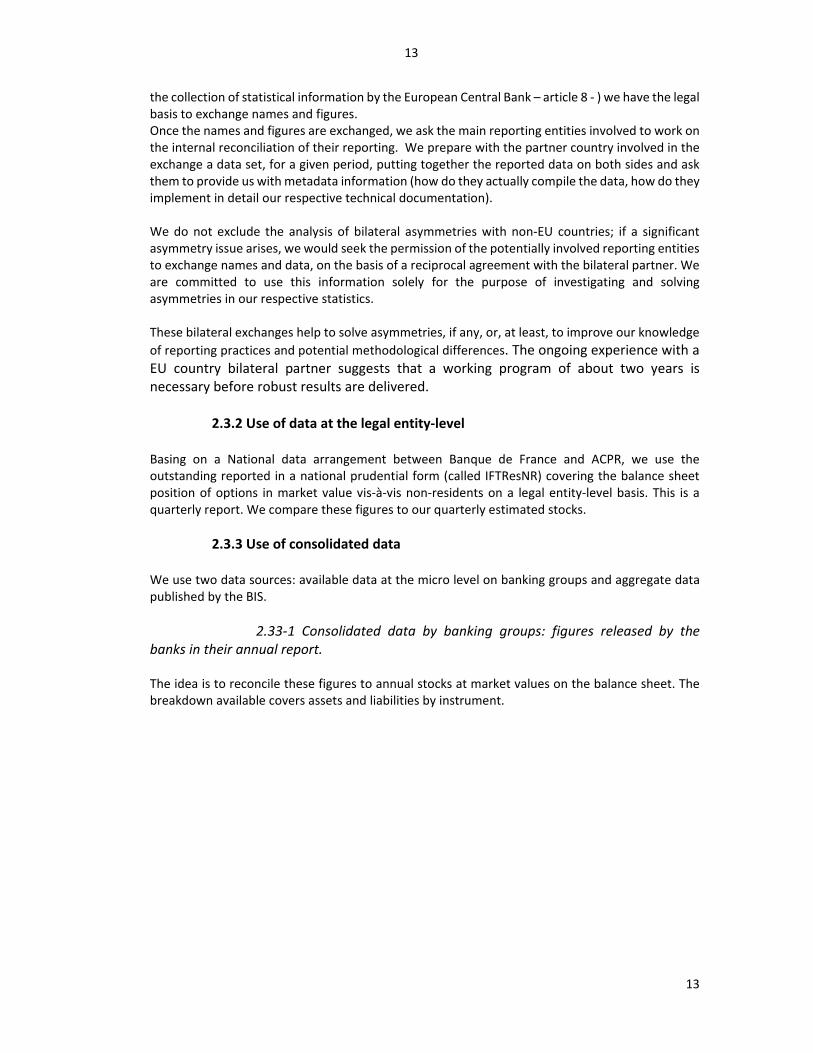
2.33-1 Consolidated data by banking groups: figures released by the banks in their annual report. The idea is to reconcile these figures to annual stocks at market values on the balance sheet. The breakdown available covers assets and liabilities by instrument.
14
14
Table 6 – example of reconciliation table for one banking group, assets side instruments Outstanding
publishedreported outstanding
differences % non resident / total
Interest rate derivatives currency derivatives Equity derivatives and indices Credit derivatives other
However, these consolidated reports are published with a low frequency (annual, sometimes biannual). The reporting institution takes into account all the subsidiaries within the scope of consolidation, excluding intra-firm trade. All counterparties of the reporting institution are taken into account, not only nonresident ones. These sources can be used only as “framework data” for validating changes and not levels. They are upper bounds6.
2.233-2 Aggregated data published by the BIS
BIS data provide an additional element of reference to challenge the relevance of the figures reported by banks on derivatives for the BoP and the IIP. Two elements have to be taken into account: the BIS data7 is prepared on a consolidated basis and they apply to OTC instruments outstanding exchanged with all counterparties resident and non-resident of the reporting institution. The scope for making consistency checks is as follows: - at the reporting entity level, - for OTC instruments, - By currency, possibly These rough reconciliations, although limited in scope, highlight potential inconsistencies on the orders of magnitude that legitimate further discussion with banks.
2.3.4 Use of market data
We look for explanatory factors in the evolution of outstanding derivatives, by analyzing the evolution of market parameters - such as swaps curves - that affect the price of derivatives. In practice, we have started developing operational tools to help control the collection of derivatives flows. The main financial intermediaries are subject to monthly reporting, making it possible to produce outstanding financial instruments at market value at the end of each month. Therefore, the tool generates theoretical values based on market prices to benchmark the evolution of the stocks of derivatives on a monthly basis. As far as France in concerned, our analysis shows that: - Changes in assets and liabilities stocks have a very similar profile for all banks; large variations are therefore explained by movements of market parameters; - Changes in stock are mainly explained by changes in the stocks of swaps; however, at bank level there may be significant differences in the portfolios; - Changes in stocks are mainly due to “other changes” (valuation effects) in assets and liabilities. Option contracts, however, generate more transactions than swaps;
6 Insofar as consolidated flows are expected to be larger than the sole resident (incl. intragroup) flows. 7 Semiannual OTC derivatives statistics.
15
15
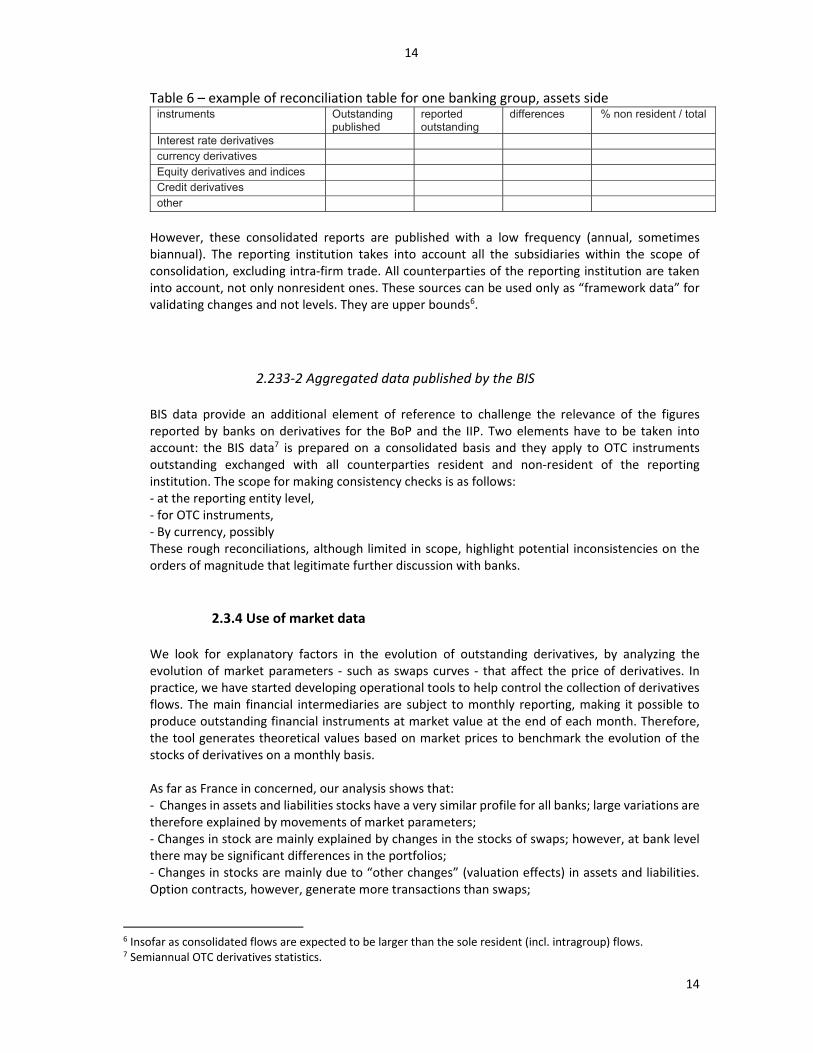
Outstanding derivatives being comprised primarily of interest rate instruments (interest rate swaps in particular), we can try to explain their evolution by movements in interest rate curves. In fact, we noticed that the developments in the swap rate 10 years, 5 years and 2 years were quite correlated, as well as correlated with the evolution of derivative stocks.
Chart 2
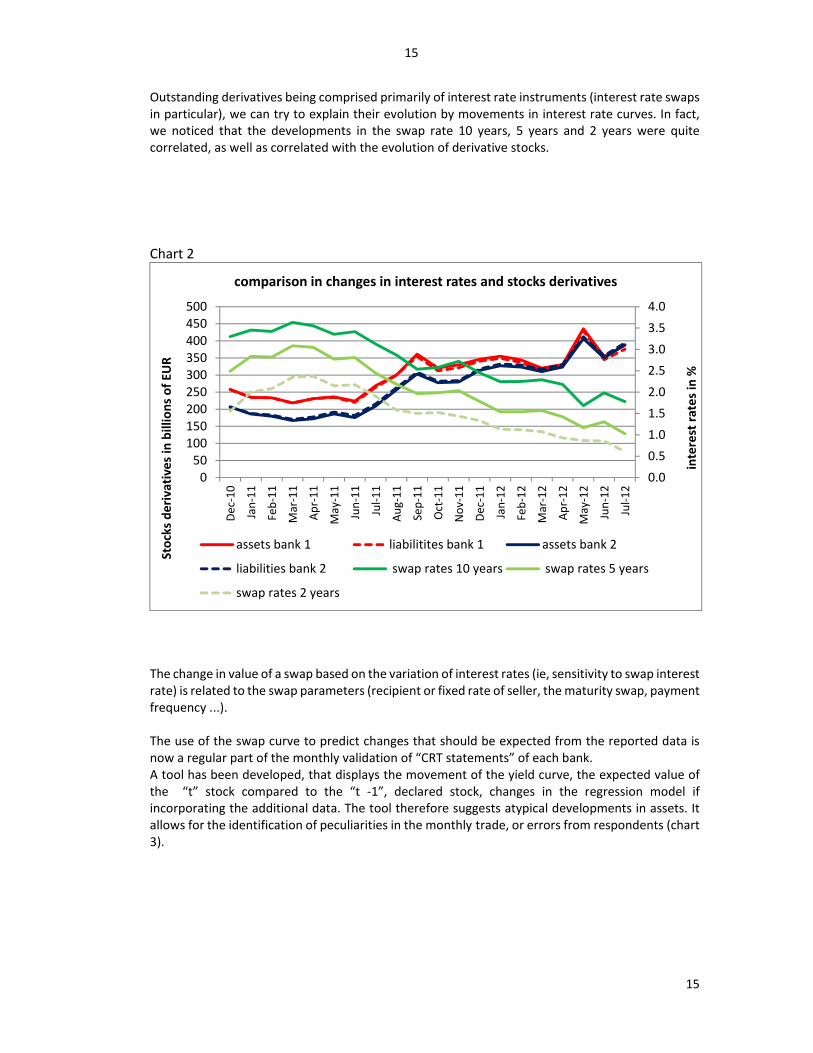
The change in value of a swap based on the variation of interest rates (ie, sensitivity to swap interest rate) is related to the swap parameters (recipient or fixed rate of seller, the maturity swap, payment frequency ...). The use of the swap curve to predict changes that should be expected from the reported data is now a regular part of the monthly validation of “CRT statements” of each bank. A tool has been developed, that displays the movement of the yield curve, the expected value of the “t” stock compared to the “t -1”, declared stock, changes in the regression model if incorporating the additional data. The tool therefore suggests atypical developments in assets. It allows for the identification of peculiarities in the monthly trade, or errors from respondents (chart 3).
0.0
0.5
1.0
1.5
2.0
2.5
3.0
3.5
4.0
050
100150200250300350400450500
Dec
-10
Jan
-11
Feb
-11
Mar
-11
Ap
r-1
1
May
-11
Jun
-11
Jul-
11
Au
g-1
1
Sep
-11
Oct
-11
No
v-1
1
Dec
-11
Jan
-12
Feb
-12
Mar
-12
Ap
r-1
2
May
-12
Jun
-12
Jul-
12
inte
rest
rat
es
in %
Sto
cks
de
riva
tive
s in
bill
ion
s o
f EU
R
comparison in changes in interest rates and stocks derivatives
assets bank 1 liabilitites bank 1 assets bank 2
liabilities bank 2 swap rates 10 years swap rates 5 years
swap rates 2 years
16
16
Chart 3
2.3 – Practical issues arising from the implementation of the data quality management
2.3.1 Accounting Compensation Accounting compensation (netting) is required by IFRS (IAS 32 & 42). Thus, a financial asset and a financial liability shall be offset and presented to the net in the balance sheet when an entity has the legal right to offset these amounts (legally enforceable right) and intends to close out on a base net, or to realize the asset and settle the liability simultaneously. Accounting compensation therefore impacts on the presentation of international flows of assets and liabilities and the constitution of the external position. The BPM6 (see Section 8.34) is not prescriptive in this specific case (the general rule is the valuation in gross). We defined the principle that reporting entities retain the most practical approach for them (with or without compensation accounting) but constant in time. Having said this implies that the statements are not harmonized (as regards the netting), therefore introducing a limitation as regards the comparative analysis. In our preparatory work for the enhancement of the data collection, the issue of requesting gross positions in order to improve comparability has been discussed. Although banks are generally able to provide this information on a “business line” basis, it would imply in many cases significant costs to provide the breakdown by country, applying the BoP residence criteria. We felt that efforts should be focused on other enhancements first (see section 3).
0
50
100
150
200
250
300
350
400
0.0 0.5 1.0 1.5 2.0 2.5 3.0 3.5 4.0
billions €
interest rates in %
stocks swaps based on swaps rates
assets swap bank 1 explained variable bank 1
assets swaps bank 2 explained variable bank 2
bank 1 : linear regression coefficient = -111
bank 2: linear regression coefficient = -69
17
17
2.3.2 Exchange rates
The exchange rate used for the transaction must be that of the day of transaction (if not possible, the average monthly price). To calculate the amount of the revaluation, reporters still use balance sheet items that have been established on the basis of the exchange rate at end of the month. This can disrupt the joint flows / stocks.
2.3.3 Criterion of residence
As part of OTC transactions, the residence that applies is that of the counterparty. In the particular case of cleared swaps, the counterparty is a non-resident clearing house (eg Germany Eurex Credit Clear). As far as transactions initiated on organized markets are concerned, the residency requirement that applies is that of the residence of the clearing house. Thus, the purchase of an option listed on EUREX results in a transaction (expense) on financial derivative with Germany, even if the operation is performed by a French investment services provider. We will return to this matter of clearing houses in section 4.
2.3.4 Intragroup derivatives trades
Intragroup transactions in derivatives make an important part of derivative transactions. This should be taken into account when we compare reportings at the legal-entity-level with data on a consolidated basis. In many instances, the identification of intra-group transactions is useful. It enables, notably, to isolate flows that are part of a more global, internationally structured operation. In practice, these flows relate to transactions carried out over-the-counter.
3 - Developments and prospects
3.1 Enhancements of the collection of derivatives at market value
These enhancements have been specified on the basis of the experience of the past five years. They cover both flows and stocks. Their contours and content have been defined following an extensive consultation with reporting entities.
3.1.1 The lessons of the Banque de France data quality management approach
The data quality management that has been developed over the past few years provides “on-the-field”’ insights regarding the way ahead:
the availability of data on the underlying instrument would have been helpful to better understand, or predict, the pattern of core reported data. The annual reports published by banks detail the positions by main underlying instrument but this information cannot be compared in a straightforward manner with the data collected ;
the availability of stocks data on a quarterly basis, rather than on a yearly basis, would have improved the robustness of the validation of the joint stock-flow for the quarter and thus the validation of quarterly transactions; it would have reduced lags in the identification of anomalies and questioning of reporting entities ;
18
18
the collection of data encompassing resident and non-resident activity would have
facilitated the analysis of consistency with other reportings – notably the BIS semi-annual OTC survey. It would have provided an additional support to the compilation of the national financial accounts8.
3.1.2 Additional reporting requirements at market value
Additional reporting requirements have been adapted to the specific features of financial derivatives in three fields:
information about the underlying financial derivatives: six classes of financial instruments have been created
- equities / funds : every type of equity derivatives, retail investment funds derivatives
- interest rates : interest rate derivatives - foreign exchange and gold : foreign exchange derivatives - credit : CDOs, CDS - commodity : commodity derivatives - others : other types of derivatives
reporting of quarterly stocks for the major reporting entities. The stocks will be reported with the same granularity as for transactions. Assets and liabilities should be broken down by instruments, counterparty country, currency and underlying items ;
for the quarterly stocks, the assets and liabilities vis-à-vis resident counterparties should also be reported ;
extension of the currency list (from 15 to 22 currencies) : the Renminbi, the Hong Kong dollar, the Singapore dollar and the Russian rouble have been added in the currency list.
These enhancements will be implemented as from January 2017. They are the result of a year-long series of consultations with reporting banks (from January to December 2015), including five meetings complemented by bilateral conversations. Key discussion points covered the categories of underlying instruments, the extension of the list of currencies and the reporting of derivatives positions on a quarterly basis especially for resident counterparties. Discussions also addressed the general principles about the reporting of transactions and of “other changes” in assets and liabilities. Banque de France put on the table one additional improvement that has not been included in the final decision because of significant implementation costs: transactions with residents. This would have provided a comprehensive view of the activity on derivatives, however the volume of data that it would entail was a strong obstacle. We have also put aside information on maturities and counterpart sectors, also taking into account the conceptual difficulty to set an efficient data quality management on these specific dimensions. Finally as mentioned above (2.31), we put aside the objective of getting a fully harmonized approach to “gross” or “net” values.
3.2 – Additional reporting requirement at notional values
8 The resident part of the activity on derivatives is currently the result of the difference between the full-balance-sheet data (i.e. transactions with all counterparties), and the transactions with NR counterparties compiled for the BoP. An “additive approach” would represent an additional layer of “consistency checks”, performed at the level of the reporting entity.
19
19
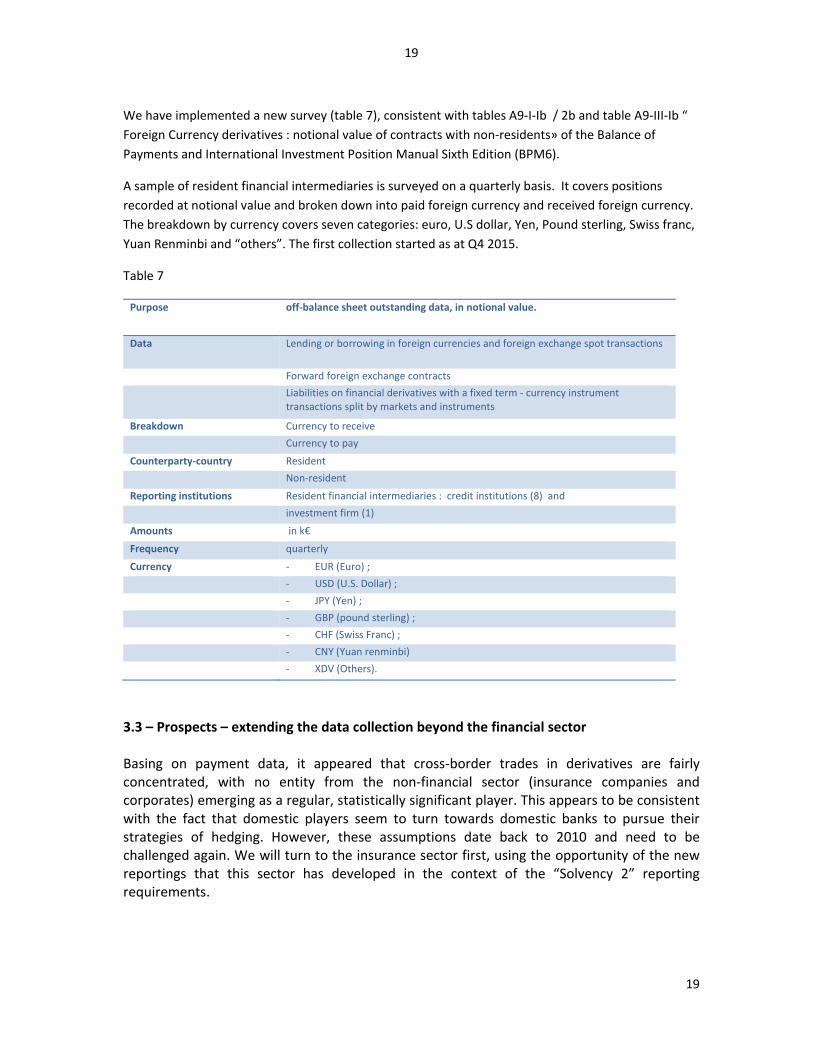
We have implemented a new survey (table 7), consistent with tables A9-I-Ib / 2b and table A9-III-Ib “
Foreign Currency derivatives : notional value of contracts with non-residents» of the Balance of
Payments and International Investment Position Manual Sixth Edition (BPM6).
A sample of resident financial intermediaries is surveyed on a quarterly basis. It covers positions
recorded at notional value and broken down into paid foreign currency and received foreign currency.
The breakdown by currency covers seven categories: euro, U.S dollar, Yen, Pound sterling, Swiss franc,
Yuan Renminbi and “others”. The first collection started as at Q4 2015.
Table 7
Purpose off-balance sheet outstanding data, in notional value.
Data Lending or borrowing in foreign currencies and foreign exchange spot transactions
Forward foreign exchange contracts
Liabilities on financial derivatives with a fixed term - currency instrument transactions split by markets and instruments
Breakdown Currency to receive
Currency to pay
Counterparty-country Resident
Non-resident
Reporting institutions Resident financial intermediaries : credit institutions (8) and
investment firm (1)
Amounts in k€
Frequency quarterly
Currency - EUR (Euro) ;
- USD (U.S. Dollar) ;
- JPY (Yen) ;
- GBP (pound sterling) ;
- CHF (Swiss Franc) ;
- CNY (Yuan renminbi)
- XDV (Others).
3.3 – Prospects – extending the data collection beyond the financial sector Basing on payment data, it appeared that cross-border trades in derivatives are fairly concentrated, with no entity from the non-financial sector (insurance companies and corporates) emerging as a regular, statistically significant player. This appears to be consistent with the fact that domestic players seem to turn towards domestic banks to pursue their strategies of hedging. However, these assumptions date back to 2010 and need to be challenged again. We will turn to the insurance sector first, using the opportunity of the new reportings that this sector has developed in the context of the “Solvency 2” reporting requirements.
20
20
4 - Impacts of the development of clearing houses (CCP) on the registration of derivatives in balance of payments and international investment position
In response to the financial crisis, the governments have undertaken to strengthen the overall robustness and resilience of the financial system, including promoting the clearing financial derivatives traded over-the-counter (mainly interest rate swaps and Credit Default Swaps). Adhesion to market infrastructures, CCP, is likely to generate, all things being equal, new flows of transactions in financial derivatives and other investments (security deposits). Depending on the geographical location of CCP, it will trigger the creation and / or rerouting of international flows: domestic bilateral transactions may become international, transactions may change of nationalities. All in all, the development in the use of CCPs is likely to impact on balance of payments and international investment position statistics. However, uncertainty remains about the impact of transactions with CCPs. In general, it may be difficult to identify the holders of financial products, especially securities. In the case of a CCP, they do not have readily the information to identify the issuer and the holder of financial derivatives because the core of the reporting system aims at collecting flows with the first-rank counterparty, i.e. the clearing members.
4.1 - Margin calls and flow balance of payments
According to BPM6, a non-repayable margin call must be registered as a transaction in financial derivatives (Article 5.94 & 8.39). In contrast, deposits and calls repayable margin, also called repayable margins, are not transactions in financial derivatives but transactions in other investments. Accordingly, in that margin calls are repayable or not, the transaction with the clearing house is considered as a transaction in financial derivatives or in other investment. All things being equal, the financial account of the structure of the balance of payments can be impacted by – and will reflect - changes in market practices. For instance, the non-resident assets and liabilities, which are valued at market value, will tend to decrease if margin calls made within the clearing of OTC derivatives are non-repayable margin calls, that is, classified as derivative transactions.
4.2 - Difficulties in identifying issuers and final holders
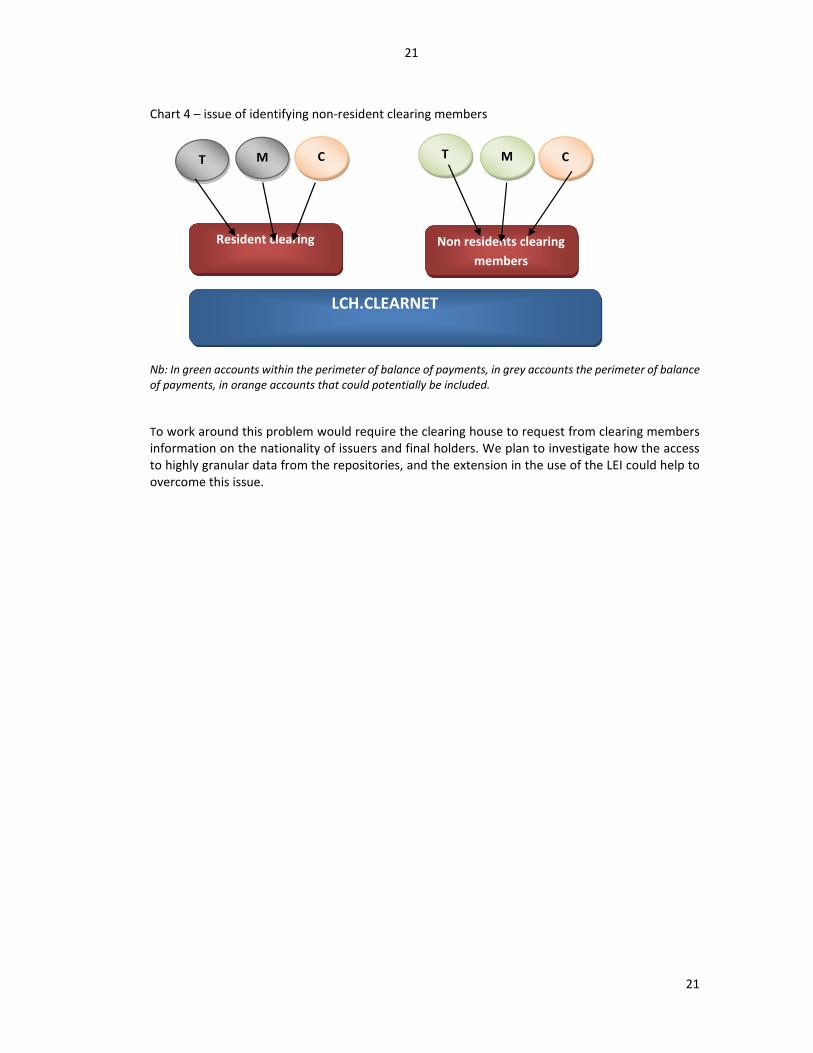
All transactions carried out by a resident financial intermediary vis-à-vis a non-resident CCP are identified (acquisition of a contract which initiates a transaction and a registration of a non-resident asset). However, the reverse is not necessarily true. Indeed, as far as the data collection for statistics is concerned, there is a need to investigate further how a resident CCP could report the proper identification of the final non-resident counterparty to the transaction. As a matter of fact, the clearing house is systematically intermediated by a clearing member who can be domestic or not. In France, LCH.Clearnet SA has agreed to provide, for statistical purposes, the identification of transactions with aggregated non-residents Clearing Members Firms (CMF). This can still lead to approximations if a non-resident customer of a clearing-member is an intermediate structure and has a resident as ultimate owner. Chart 4 provides an illustration : each clearing member has home accounts (M), market making accounts (T) and customer accounts (C). The latter category may be an issue as a resident clearing member may have non-resident customers and vice versa.
21
21
Chart 4 – issue of identifying non-resident clearing members
Nb: In green accounts within the perimeter of balance of payments, in grey accounts the perimeter of balance of payments, in orange accounts that could potentially be included.
To work around this problem would require the clearing house to request from clearing members information on the nationality of issuers and final holders. We plan to investigate how the access to highly granular data from the repositories, and the extension in the use of the LEI could help to overcome this issue.
LCH.CLEARNET
Resident clearing Non residents clearing
members
T M C T M C
22
22
ANNEX 1
SOME EXAMPLES OF “VIEWS” FOR DATA QUALITY MANAGEMENT
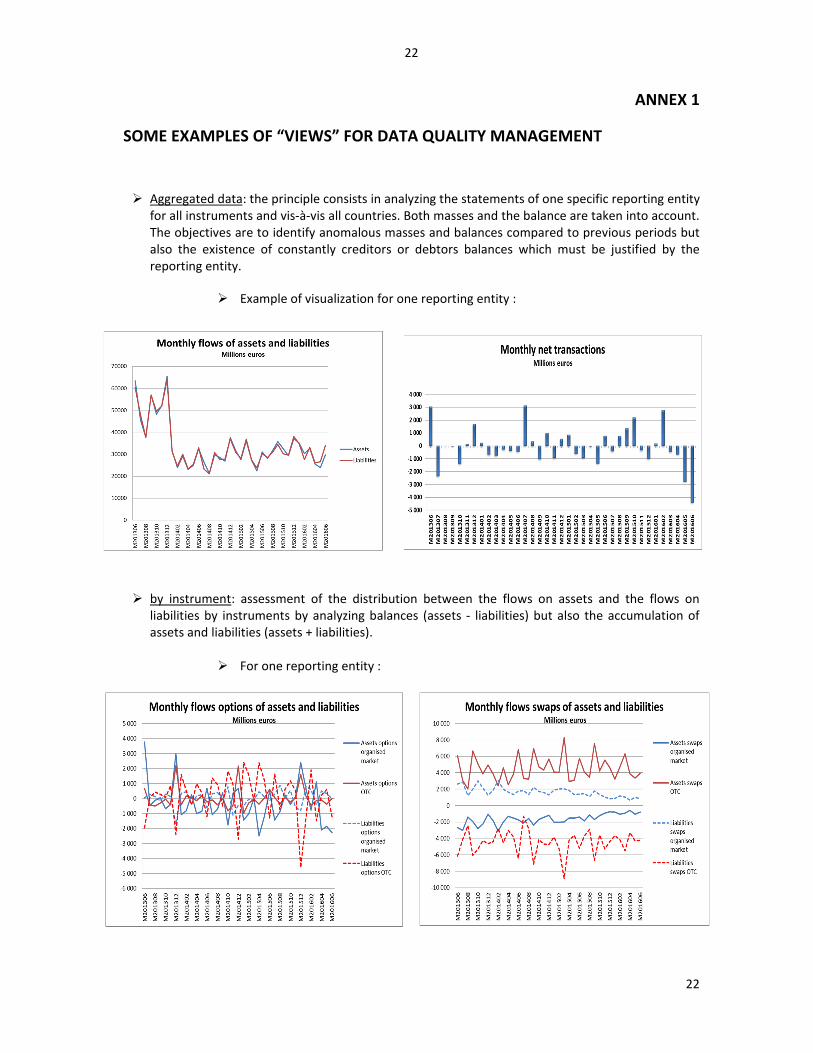
Aggregated data: the principle consists in analyzing the statements of one specific reporting entity for all instruments and vis-à-vis all countries. Both masses and the balance are taken into account. The objectives are to identify anomalous masses and balances compared to previous periods but also the existence of constantly creditors or debtors balances which must be justified by the reporting entity.
Example of visualization for one reporting entity :
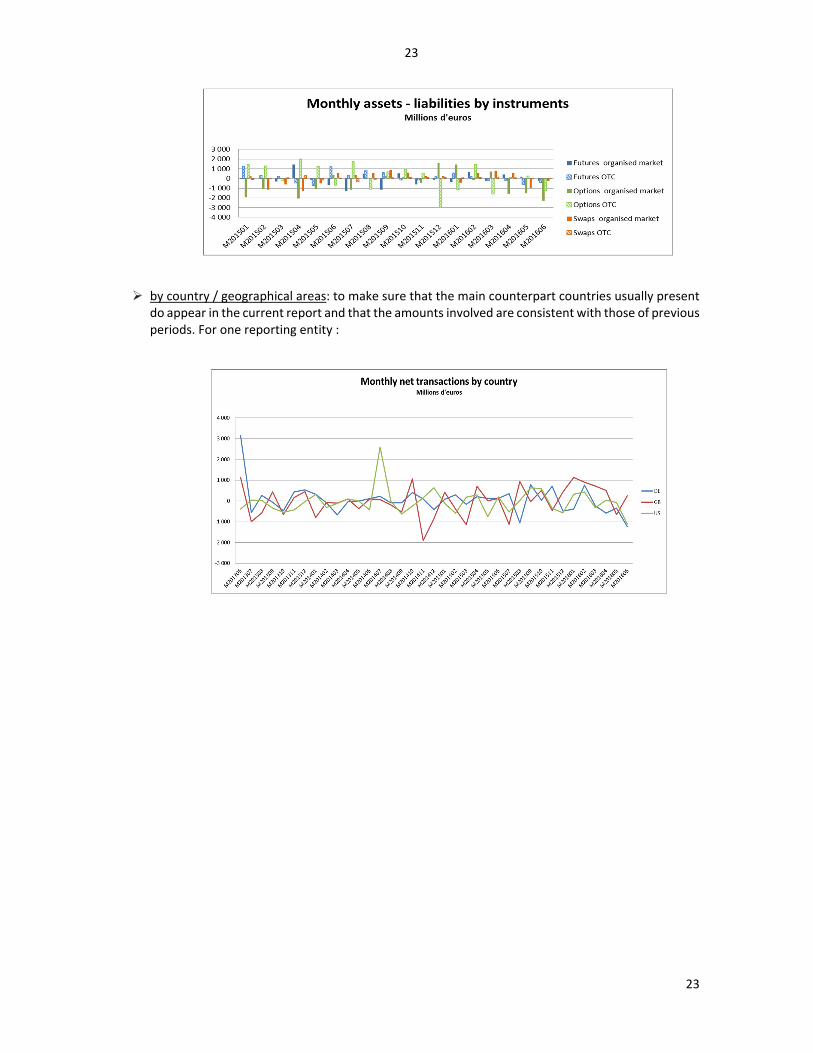
by instrument: assessment of the distribution between the flows on assets and the flows on liabilities by instruments by analyzing balances (assets - liabilities) but also the accumulation of assets and liabilities (assets + liabilities).
For one reporting entity :
23
23
by country / geographical areas: to make sure that the main counterpart countries usually present do appear in the current report and that the amounts involved are consistent with those of previous periods. For one reporting entity :