Embed Size (px)
Citation preview

Experience from IndiaFuture Perspectives
Prof. Shivanand SwamyExecutive Director
Centre of Excellence in Urban Transport, CEPT University
November 2014Delhi
BRTS Worldwide India
India initiatives NUTP JnNURM
India issues Future perspectives

Worldwide

Region Numberof cities
% Passengers perday
% Totallength in
km
%
Africa 3 1.92 238,000 1 62 1.53
Asia 30 19.23 6,275,622 24.5 1037 25.69
Europe 43 27.56 1,656,966 6.46 688 17.04
LatinAmerica
53 33.97 16,326,783 63.66 1347 33.37
NorthAmerica
20 12.82 819,685 3.19 576 14.27
Oceania 7 4.48 327,074 1.27 326 8.07
World 156 100 25,644,130 100 4036 100
http://brtdata.org, October 2013

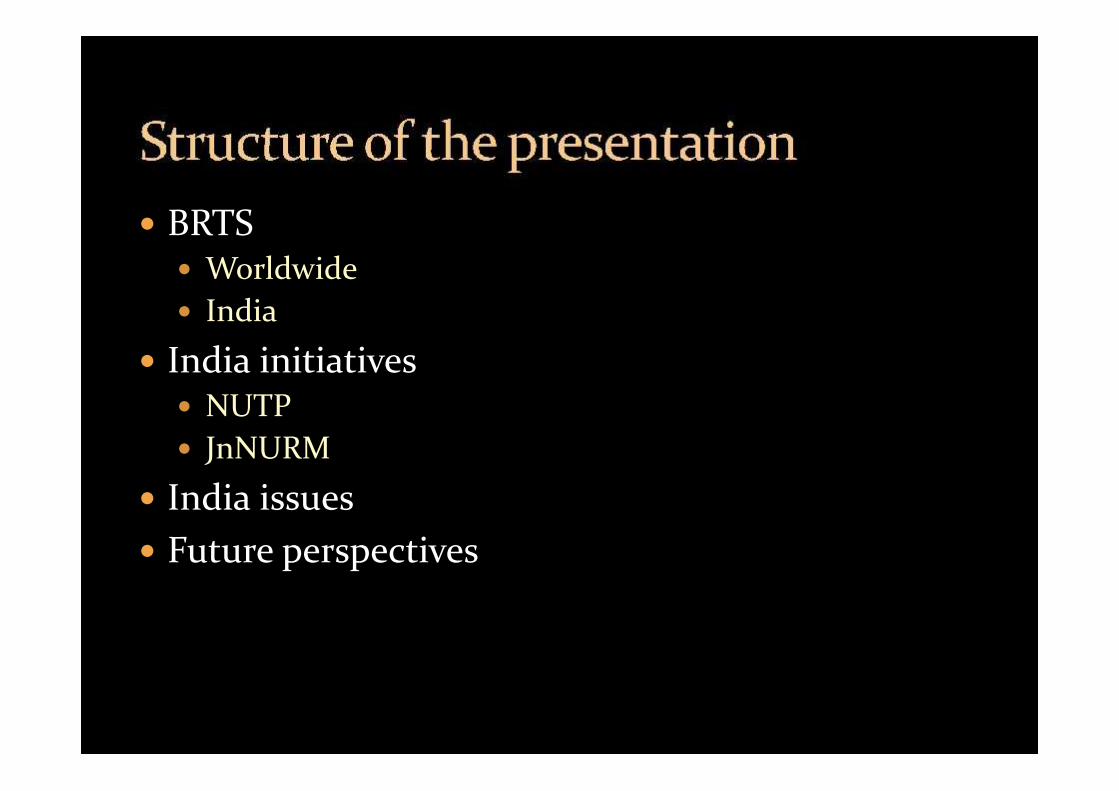
Total length
Before 1990 (16 cities)
1991 - 2000 (19 cities)
2001 - 2010 (103 cities)507 km
1025 km
3707 km
Since 2011 (22 cities)
4119 km
http://brtdata.org, October 2013
0
25
50
75
100
125
150
175
0
5
10
15
20
25
1970 1975 1980 1985 1990 1995 2000 2005 2010
Cum
ulat
ive
Num
ber o
f Citi
es
New
Citi
es
2008: Ahmedabad(Janmarg), India
2000: Bogotá(TransMilenio),
Colombia
1974/1991*: Curitiba
1972/2010*: Lima
http://brtdata.org, October 2013

0
200
400
600
800
1000
1200
140019
7219
7419
7619
7819
8019
8219
8419
8619
8819
9019
9219
9419
9619
9820
0020
0220
0420
0620
0820
1020
12
BR
TS N
etw
ork
Leng
th (i
n km
s)
Time Series
Latin America
North America
Europe
China
India
India

Delhi
Proposed networkof 257 km
City wide coverage
Designed as opensystem
5.5 km operationalin 2008
No addition tonetwork since
Map courtesy: TRIPP, IIT Delhi

In 2004, the Gujarat government initiated a feasibilitystudy for BRTS in Ahmedabad
In 2005, CEPT University’s feasibility studyrecommended BRTS in Ahmedabad
In 2005 and 2006, two initiatives by the CentralGovernment gave an impetus to BRTS The Jawaharlal Nehru National Urban Renewal Mission
(JnNURM) in 2005 The National Urban Transport Policy (NUTP) in 2006

Main focus on efficiency of urban infrastructure andservice delivery mechanisms
Identified requirement of 28 billion USD investmentin urban infrastructure in 63 cities
Urban infrastructure projects include water supply andsanitation, sewerage, solid waste management, roadnetwork and urban transport

Overarching objective: Safe, reliable, affordable, quick, comfortable, reliable and
sustainable access
Key Objectives To incorporate urban transport as an important parameter
in urban planning To bring about more equitable allocation of road space
with people rather than vehicles as the main focus To encourage greater use of public transport and non-
motorized modes of transport
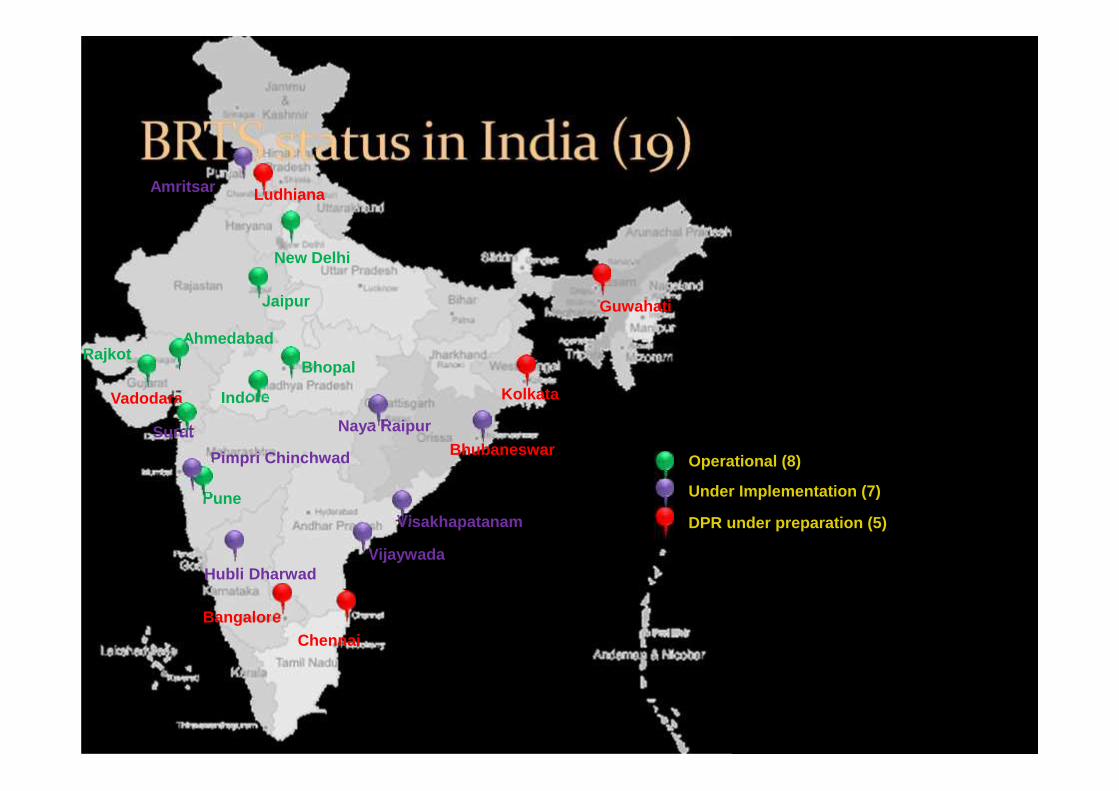
Under Implementation (7)
Indore
Surat
Rajkot
Vijaywada
Pimpri Chinchwad
Hubli Dharwad
Bhopal
Naya Raipur
Visakhapatanam DPR under preparation (5)
Chennai
Vadodara
Guwahati
Bangalore
Operational (8)
Pune
Jaipur
Ahmedabad
New Delhi
Bhubaneswar
Amritsar Ludhiana
Kolkata

City Lengthkm
Sanctiondate
Amount inRs crore
Progress Operational km
Indore 11.65 Aug 2006 98.45 complete 11.65
Bhopal 42.19 Nov 2006 247.12 85% 23
Pune 115.67 Aug 2006,Oct 2006Mar 2007Aug 2008
1050.46 95% 17
PimpriChinchwad
41.28 Dec 2007Nov 2008Nov 2008
738.16 70% 0
Ahmedabad 88.5 Aug 2006Oct 2006Aug 2008
981.45 90% 82
Surat 29.9 Mar 2008 469.02 55% 11

City Lengthkm
Sanctiondate
Amount inRs crore
Progress Operational km
Rajkot 10.7 Jul 2007 110 complete 10.7
Vijaywada 15.18 Mar 2007 151 70% 0
Vishakhapatnam
45.2 May 2007 452.93 75% 0
Jaipur 39.45 Jul 2007Dec 2007Nov 2009
479.54 NA 7
Amritsar 30 2013 459 NA 0
Delhi* 257 5.6
HubliDharwad
22.25 452 40 0
Naya Raipur 42.5 1791.93 NA 0
Total 534.47 157* Delhi’s network has not been added

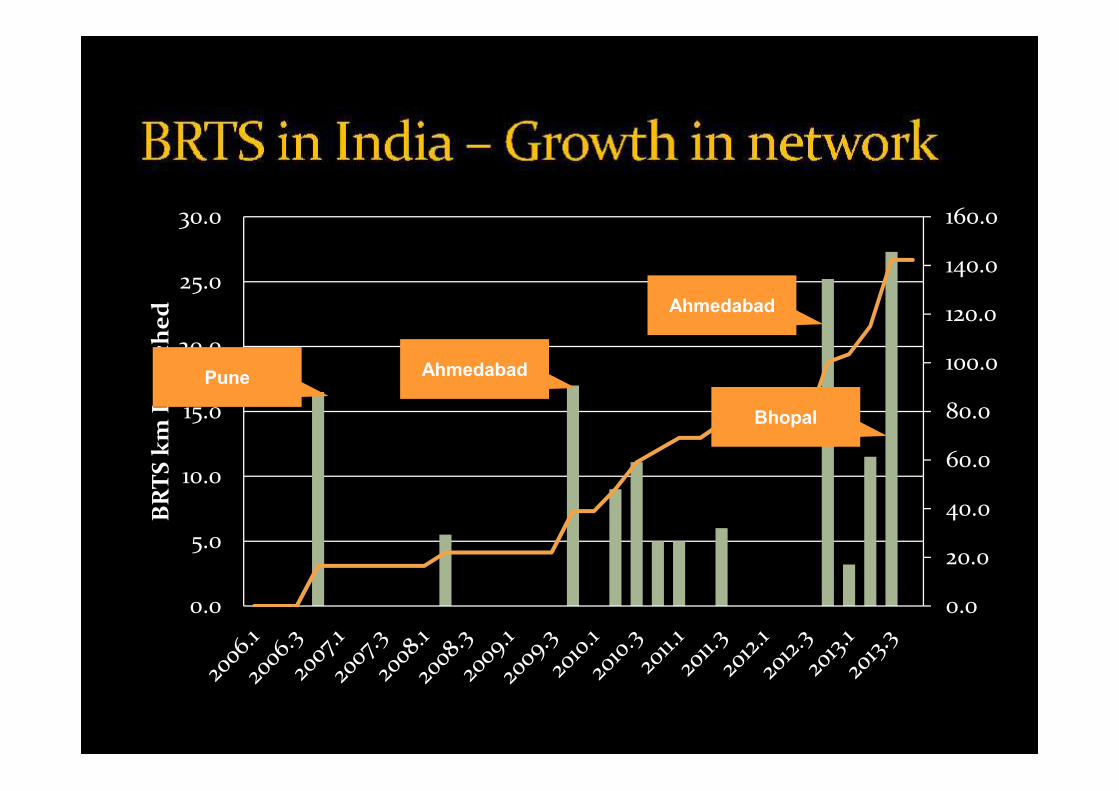
A total of 534.47 km BRTS network has beensanctioned in India, most of it under JnNURM, sinceAugust 2006
A total of 157 km of BRTS is operational in 2013, half ofwhich is in Ahmedabad
The first projects to be sanctioned were in Aug 2006(Indore, Pune and Ahmedabad) and the last in 2013(Amritsar)
0.0
20.0
40.0
60.0
80.0
100.0
120.0
140.0
160.0
0.0
5.0
10.0
15.0
20.0
25.0
30.0
BR
TS k
m L
aunc
hed
AhmedabadPune
Ahmedabad
Bhopal

City Operations PopulationKm
operationalDaily
ridership
Ahmedabad 2009 5,726,000 82 150,000Pune 2008 5,010,000 17 96,750Bhopal 2013 1,843,000 24 70,000New Delhi 2008 17,015,000 5 53,500Indore 2013 11 22,200Rajkot 2009 11 7,500Jaipur 2010 3,136,000 7 6,622Surat 2013 4,500,000 11 8,000
Total 157 396,572

Issues
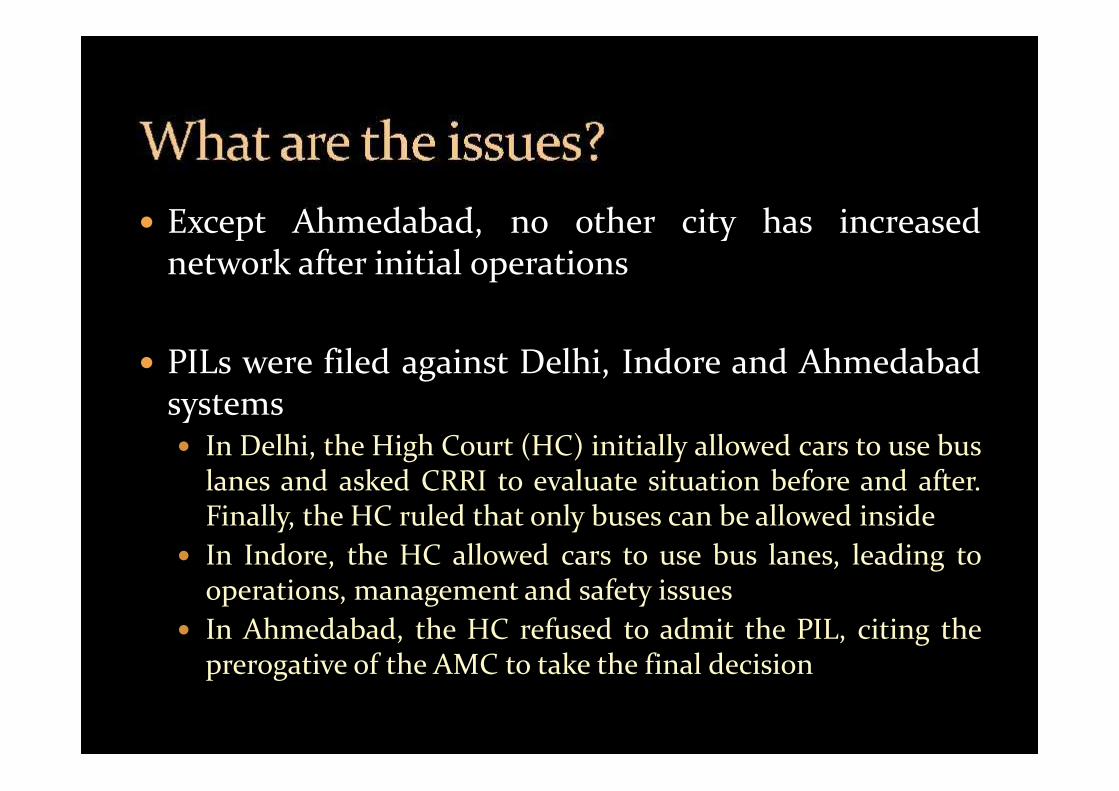
Except Ahmedabad, no other city has increasednetwork after initial operations
PILs were filed against Delhi, Indore and Ahmedabadsystems In Delhi, the High Court (HC) initially allowed cars to use bus
lanes and asked CRRI to evaluate situation before and after.Finally, the HC ruled that only buses can be allowed inside
In Indore, the HC allowed cars to use bus lanes, leading tooperations, management and safety issues
In Ahmedabad, the HC refused to admit the PIL, citing theprerogative of the AMC to take the final decision

Delhi BRTS after cars wereallowed inside bus lanes

Structural NUTP and JnNURM were central government initiatives Urban transport is a state subject Public Transport is not an obligatory function of ULB
Policy and plan non-integration There is no attempt to disincentivise private transport. On
the contrary, cities are funding road projects (widening,flyovers) through internal budgets
A pre-condition to JnNURM funding was that citiesimplement parking policies. No city has a comprehensiveparking policy
Development plans do not take into account specific needs ofBRTS projects
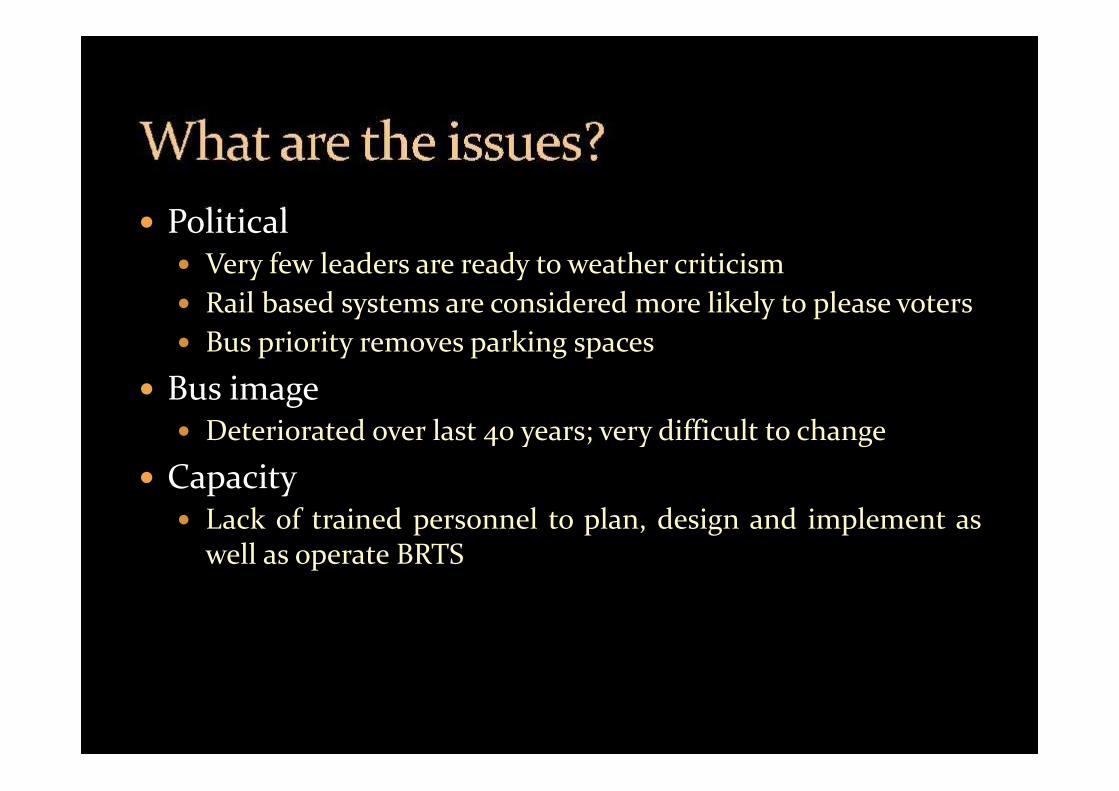
Political Very few leaders are ready to weather criticism Rail based systems are considered more likely to please voters Bus priority removes parking spaces
Bus image Deteriorated over last 40 years; very difficult to change
Capacity Lack of trained personnel to plan, design and implement as
well as operate BRTS

Bus supply Few bus manufacturers Very high demand from cities, especially after bus funding
scheme Tax issues with bus procurement Quality BRTS bus – It took AMC 5 long years to convince
manufacturers to make quality buses We still don’t have an Articulated Bus manufactured in India

We have made big strides in the last decade inbuilding infrastructure
However, maintenance is missing Infrastructure is crumbling There is no maintenance regime Budget for maintenance is minimal


Our cities may build metros, they may even benecessary
However, buses will always remain the backbone ofour PT systems
Buses and metros must co-exist, complement andsupport each other


Hubli to Dharwad
40.1
4
43.1
5
60.6
0
29.8
9 35.1
1
39.0
3
32.6
2
30.4
8 35.4
0
39.1
0
33.2
7
30.1
4 35.1
0
38.1
9
31.2
5
0.005.00
10.0015.0020.0025.0030.0035.0040.0045.0050.0055.0060.0065.00
Bike Car Regular Bus Express Bus
Existing Network BRT as per DFR 2 Lane at Midblock ElevatedBuses get the highest benefit
BRTS reduces journey times for all modes

0500
100015002000250030003500400045005000550060006500700075008000850090009500
1000010500110001150012000125001300013500140001450015000155001600016500170001750018000185001900019500200002050021000215002200022500230002350024000
1802
1996
2190
2384
2578
2772
2966
3160
3354
3548
3742
3936
4130
4324
4518
4712
4906
5100
5294
5488
5682
5876
6070
Dis
tanc
e Tr
avel
led
Distance Travelled
0500
100015002000250030003500400045005000550060006500700075008000850090009500
1000010500110001150012000125001300013500140001450015000155001600016500170001750018000185001900019500200002050021000215002200022500230002350024000
1802
1930
2058
2186
2314
2442
2570
2698
2826
2954
3082
3210
3338
3466
3594
3722
3850
3978
4106
4234
4362
4490
4618
4746
Distance Travelled
No BRT Scenario BRT scenario
Sample size: 10 BusesBunching of buses in noBRT scenario leads tohigher journey time.
Sample size: 12 BusesSegregated bus lanesreduce bunching byincreasing reliability
Average Journey Time:38 mins & 31 mins
Average Journey Time: 60 mins
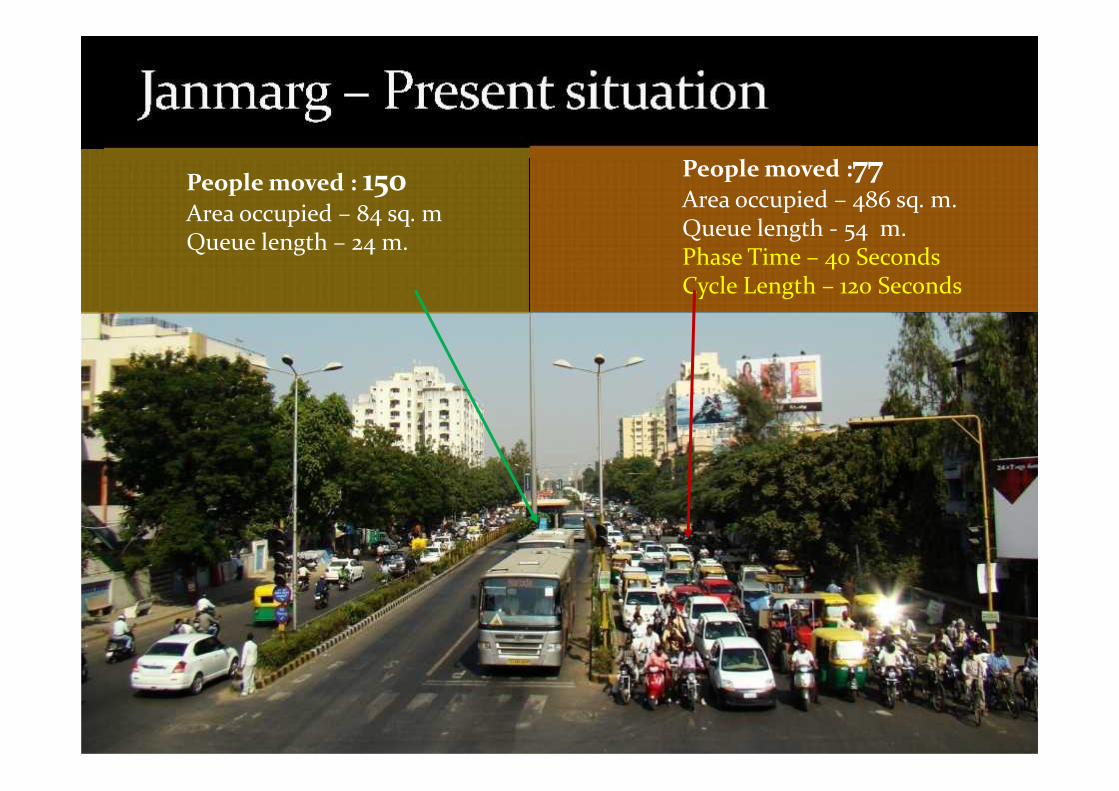
People moved : 150Area occupied – 84 sq. mQueue length – 24 m.
People moved :77Area occupied – 486 sq. m.Queue length - 54 m.Phase Time – 40 SecondsCycle Length – 120 Seconds

People moved – 150Area occupied – 84 sq. mQueue length – 24 m.
People moved -45(Reduction from 77)Area occupied – 486 sq. m.Queue length - 54 m.

People moved – 150Area occupied – 84 sq. mQueue length – 24 m.
People moved -77Queue length - 183 m.(Increase from 54 meters)Phase time – 70 SecondsCycle Length – 180 Seconds

People moved -240Queue length - 165 m.(Increase from 54 meters)Phase time – 180 SecondsCycle Length > 180 Seconds (Not Desirable)

People moved -610Queue length - 630 m.(Increase from 210 meters)Phase time – 200 + Seconds(At-grade operation impossible)
Total -Sectionlength –537m

People moved – 280Area occupied – 135 sq. mQueue length – 37 m.
People moved -155Queue length – 210 m.Phase time – 70 SecondsCycle Length – 180 Seconds
18 M ARTICULATED BUSCAPACITY- 140

Planned On site situation
Element Width % covered Width % covered
Footpath 2.25m 15 % 2.25m 15 %
Carriageway 9.25m 50% 7m 22%
BRT lane 3.65m25 %
3.65m25 %
BRT Stop 1.9m 1.9m
Parking 2.25 8 % 6m 36%
How do we use our roads?

Segregation is critical; stretches of mixed runningBRTS affect performance and efficiency
Bus stations are critical; segregated busways with nobus stations is as good as not having a BRTS!
Level alighting and boarding are critical;mismatched levels increase dwell times and havesafety implications

Experience suggests ‘supply’ of high quality BRTSneeds to be complemented by demand management Cities need to focus on parking restrictions (less on street
parking, time restrictions) and charging for parking
Cities need to balance their priorities. Public transit,NMT facilities should get higher share in municipalbudgets

Dearth of trained professionals to operate bussystems Frequent training programs for in-service officers Education programs
BRTS Design is not a traffic engineering exercise Dearth of consultants who understand BRTS and are not
‘usual’ traffic engineering consultants
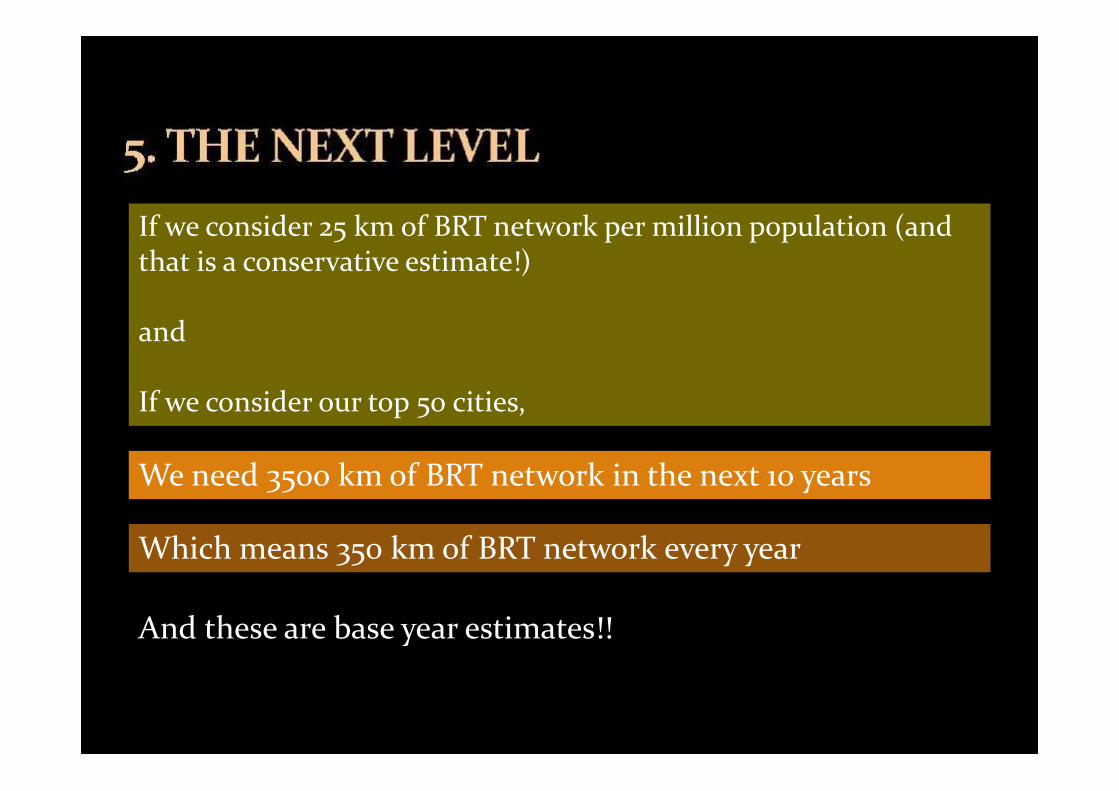
If we consider 25 km of BRT network per million population (andthat is a conservative estimate!)
and
If we consider our top 50 cities,
We need 3500 km of BRT network in the next 10 years
Which means 350 km of BRT network every year
And these are base year estimates!!

So,what are the next steps?
1. We need huge investments to build BRT systems Can the private sector invest in infrastructure? How can government make it viable for them? (especially with issues
in private sector participation in metro projects) How can government regulate such participation?

So,what are the next steps?
2. We need to create consultants and advisors to work withgovernment Can we create more institutes that offer post graduate programs in
urban transport? Can we create more dedicated training programs across India for in-
service professionals?
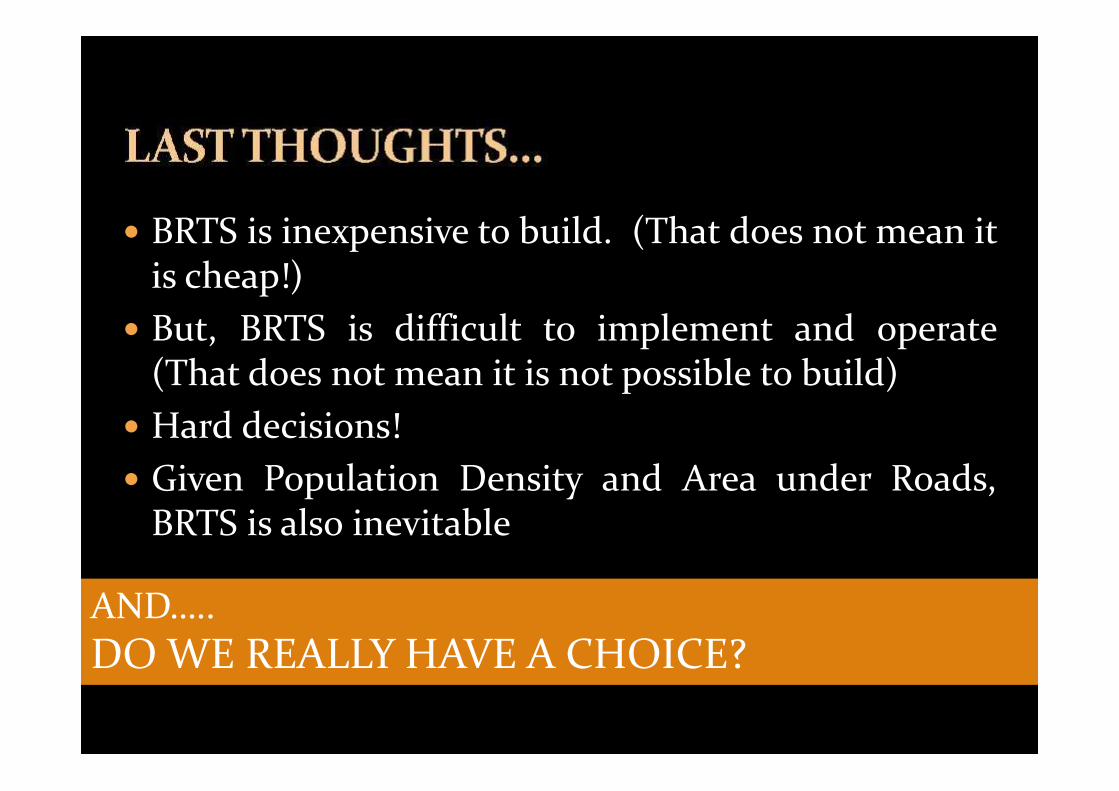
BRTS is inexpensive to build. (That does not mean itis cheap!) But, BRTS is difficult to implement and operate
(That does not mean it is not possible to build) Hard decisions! Given Population Density and Area under Roads,
BRTS is also inevitable
AND…..DO WE REALLY HAVE A CHOICE?

IS THIS IS A CHOICE?


This is quality Public Transport
Centre of Excellence in Urban Transport, CEPT University, Ahmedabad, India
•

Centre of Excellence in Urban Transport, CEPT University, Ahmedabad, India

Centre of Excellence in Urban Transport, CEPT University, Ahmedabad, India

No RoadsBefore BRTS - No Roads…2008This is what it was
Centre of Excellence in Urban Transport, CEPT University, Ahmedabad, India

Today…– With BRT (2014)
Transforming Constraints into OpportunitiesBRTS to be operational on this corridor by 2014.
BRTS bus lane
Existing Canal
Mixed trafficlanes
Pedestrian pathPedestrian path
BRTS bus laneMixed traffic lanes
No RoadsThis is what you can make
Centre of Excellence in Urban Transport, CEPT University, Ahmedabad, India

Thank you…