Embed Size (px)
Citation preview
8/8/2019 Expected Size of Shielded Fires in Sprinkle Red Office
http://slidepdf.com/reader/full/expected-size-of-shielded-fires-in-sprinkle-red-office 1/18
Expected size of shielded fires in sprinklered officebuildings
Lougheed, G.D.
A version of this document is published in / Une version de ce document se trouve dans :ASHRAE Transactions, v. 103, pt. 1, 1997, pp. 395-410
www.nrc.ca/irc/ircpubs
NRCC-40106
8/8/2019 Expected Size of Shielded Fires in Sprinkle Red Office
http://slidepdf.com/reader/full/expected-size-of-shielded-fires-in-sprinkle-red-office 2/18
The following paper was published in ASHRAE Transactions, Vol.103 , Pt. 1. © 199 7 American Society of Heating, Refrigeratingand Air-Conditioning Engineers, Inc.
This posting is by permission of ASHRAE and is presented for educational purposes only.
ASHRAE does not endorse or recommend commercial products or services. This paper may not be copied and/or distributedelectronically or in paper form without permission of ASHRAE.Contact ASHRAE at www.ashrae.org.
8/8/2019 Expected Size of Shielded Fires in Sprinkle Red Office
http://slidepdf.com/reader/full/expected-size-of-shielded-fires-in-sprinkle-red-office 3/18
ASHRAE Transactions: Symposia 395
ABSTRACT
As part of a joint research project between ASHRAE and the National Research Council of Canada (ASHRAE Research
project RP-838), the probability of occurrence and expected size of shielded fires in sprinklered high-rise office buildingswere investigated. Phase 1 of the project included surveys of typical office buildings to identify shielded fire situations and the fuel loads in the shielded areas. Based on these surveys,medium- and full-scale fire tests were conducted. The resultsof these investigations are summarized in this paper. In partic-ular, the effect of a sprinkler system on heat release rate, com-
partment temperatures, carbon monoxide (CO) production,and smoke generation and movement for fires in an open-planoffice scenario are discussed. An initial analysis of the impli-cations of a sprinkler system on a zoned smoke control systemis also provided.
INTRODUCTION
The ability of sprinkler systems to control and extinguishunshielded fires is well established. However, in recent years,concerns have been raised regarding shielded fires that are notrapidly extinguished by sprinklers (Klote 1990). It wassuggested that such fires could produce significant quantities of smoke and toxic fire gases; therefore, smoke control systems, inaddition to the automatic sprinkler systems, may be useful forlife safety of building occupants.
In 1991, a joint research project was initiated between theAmerican Society of Heating, Refrigerating and Air-Condition-ing Engineers, Inc. (ASHRAE) and the National ResearchCouncil of Canada (NRCC) to investigate the effects of sprin-klers on the performance of a zoned smoke control system(ASHRAE research project RP-677). The results are docu-mented in the final report for the project (Mawhinney et al. 1992)and are summarized in a paper by Mawhinney and Tamura(1994). These investigations indicated that with shielded fires
and only two operating sprinklers, the heat release rate, radiantflux, room temperatures, and buoyancy pressures were substan-tially reduced in a compartment. It was also noted that, althoughtotal smoke production was reduced by the sprinklers, there werestill significant quantities of “cold” smoke produced and that thissmoke contained potentially harmful concentrations of carbon
monoxide.The previous investigation (Mawhinney and Tamura 1994)
identified a number of areas in which additional research wasneeded. In 1994, a second joint research project was initiatedbetween ASHRAE and NRCC (ASHRAE research project RP-838). This current study was established to address one of thefundamental concerns about the previous study raised by the fireprotection engineering community—namely, what are the prob-ability of occurrence and probable size of shielded, sprinkleredfires in high-rise office buildings? The objective of the investi-gations conducted in this second project was to provide infor-mation that would answer those questions and thus improveconfidence in the design of smoke management systems in
buildings protected by sprinklers. In particular, in this paper, theeffect of a sprinkler system on heat release rate, compartmenttemperatures, CO production, and smoke generation and move-ment for fires in an open-plan office scenario are discussed. Aninitial analysis of the implications of the sprinkler system on azoned smoke control system is also provided.
SHIELDED FIRE SCENARIOS
In phase 1 of the project, three tasks were completed:• Surveys were conducted to quantify typical shielded fire
scenarios in high-rise office buildings.• A review of North American fire loss databases was
undertaken to identify shielded fire incidents in sprin-klered buildings.
• Recent literature on fire statistics and full-scale tests withsprinklers and smoke management systems wasreviewed.
Expected Size of Shielded Firesin Sprinklered Office Buildings
Gary D. Lougheed, Ph.D.Member ASHRAE
Gary D. Lougheed is a senior research officer at the National Fire Laboratory, Institute for Research in Construction, National Research Coun-cil Canada, Ottawa, Ont.
PH-97-2-1(RP-838)
8/8/2019 Expected Size of Shielded Fires in Sprinkle Red Office
http://slidepdf.com/reader/full/expected-size-of-shielded-fires-in-sprinkle-red-office 4/18
396 ASHRAE Transactions: Symposia
The results of the phase 1 studies are fully documented inLougheed and Mawhinney (1996). In the following sections,the typical fire scenarios found in high-rise office buildingsare summarized.
Shielding by Tables and Desks
This was the shielding scenario most frequently observed inoffice buildings (Lougheed and Mawhinney 1996). Typically,the shielded fire scenario consisted of a desk or table producinga shielded area of approximately 0.9 m 2 (9.6 ft 2). The fuel loadsunder a table or desk ranged between 30 and 150 kg (66 and 331lb), excluding the furnishings, with the fuel consisting primarilyof cellulosic material such as cardboard boxes, files, journals,and reports. Varying quantities of plastic materials, such as ringbinders and packing materials (bubble wrap and foam plastic),and textiles, including clothing and duffel bags, were also notedin many scenarios. In addition, a chair was often partly posi-tioned under the shielded area.
Miscellaneous StorageIn surveys of both multi-tenanted buildings and single-
occupant buildings, note was made of dedicated rooms or areasin buildings that were used for the storage of equipment andsupplies or the storage of documents and records. The storageareas in single-occupant buildings were frequently isolated fromthe main portion of the building; for example, large storage areaswere found on basement levels with limited access by personnel.There were also situations in which large records storagesystems were found in open-plan office areas. For multi-tenanted buildings, storage areas were found throughout thebuilding. The storage areas observed during the surveys wouldbe classified as “miscellaneous storage” based on section 1-4.2of NFPA 13 (NFPA 1994) and would be required to be protectedusing a sprinkler system designed for an ordinary hazard (group2) occupancy, as defined in NFPA 13.
Mercantile Occupancies
Retail and food services frequently occupy a portion of mixed-occupancy buildings or building complexes. Thisincludes those situations in which mercantile occupancies,including malls, are linked to office complexes, as well as thosecases in which the mercantile space is included in the lowerlevels of the building. In both situations, the mercantile areas arefrequently combined with walkways, concourses, and atrium
spaces and therefore constitute a problem that is outside thescope of this project. However, since mercantile occupancies areimportant elements in modern building complexes, typicalshielded fire situations noted in mercantile areas were describedin the phase 1 report (Lougheed and Mawhinney 1996).
Non-Code-Conformance
The site visits identified non-code-conformance as one of the critical issues that must be addressed in arriving at generaldesign criteria, not only for smoke management systems, but forall fire protection systems for high-rise office buildings. There
were a number of cases observed during the site visits where theuse of the space by the occupant did not conform to codes andstandards and thus created or exacerbated the potential fire chal-lenge to the sprinkler system. For example, it should not beexpected that a sprinkler system designed for a light hazard occu-pancy will provide adequate protection for areas that, in fact,pose a more severe challenge or, if the sprinkler system isdesigned and installed properly, that it will provide adequateperformance if it is handicapped to the extent observed in someof the site visits (Lougheed and Mawhinney 1996).
There were many examples of situations in which theassumed good performance of fire safety systems was compro-mised. That does not mean, however, that the design criteria forfire protection systems should be adjusted to take into account allthe extremes that can occur. In developing technical data forinput into design guides, a general application of good fireprotection practice must be assumed. This includes the use of “good housekeeping” and maintenance practices so that themore extreme situations illustrated in the site reports provided in
the phase 1 report will not occur (Lougheed and Mawhinney1996). Therefore, all the full-scale fire tests conducted as part of the investigations discussed in this paper conformed to the rele-vant standards in force at the time of the tests.
Fire Scenarios Used for Full-Scale Tests
Shielding of fuel loads by tables and desks represented themost common challenge observed during the site visits for a lighthazard sprinkler system in an office building. As such, theprimary series of full-scale tests was designed to investigate thisshielding scenario. An open-plan office furniture arrangementwas used to investigate the impact of various parameters, includ-ing fuel loading in the shielded areas, location of the test scenariorelative to the sprinklers, and location of the ignition source. Theresults of this series of tests are the basis for the discussions inthis paper.
In addition to the open-plan office tests, limited tests wereconducted with two other shielded fire scenarios:• Document Storage. A single test was conducted with a
document storage system similar to that observed in sev-eral site visits. The storage scenario used for the tests con-sisted of documents stored on back-to-back metal shelvingunits. The storage area was protected using an ordinaryhazard (group 2) sprinkler system. The sprinklers wereable to control and eventually extinguish the fire. The heat
release rate, CO, and smoke production were limited bythe sprinklers (Lougheed and Carpenter 1996).
• Single-Office Scenario. Two tests were conducted with afull-scale single-office arrangement. A single sprinklerwas used to protect the space. The sprinkler density wasapproximately double the design density for a light hazardoccupancy. The sprinkler limited the heat release rate pro-duced in this test to 250 kW or less. High CO and smokelevels were measured inside the compartment. However,limited smoke and CO were measured outside the com-partment (Lougheed and Carpenter 1996).
8/8/2019 Expected Size of Shielded Fires in Sprinkle Red Office
http://slidepdf.com/reader/full/expected-size-of-shielded-fires-in-sprinkle-red-office 5/18
ASHRAE Transactions: Symposia 397
In both these latter cases, the scenario as tested wouldproduce less of a challenge for a smoke control system in a sprin-klered building than the open-plan office tests. It should,however, be noted that the tests conducted on document storagesystems and single offices were limited and care should be takenin extrapolating the results to other scenarios. For document stor-age, this would include the use of nonmetal shelving units,compact storage systems, and archival storage in boxes(Lougheed and Carpenter 1996).
EXPERIMENT DESCRIPTION
Test Facility
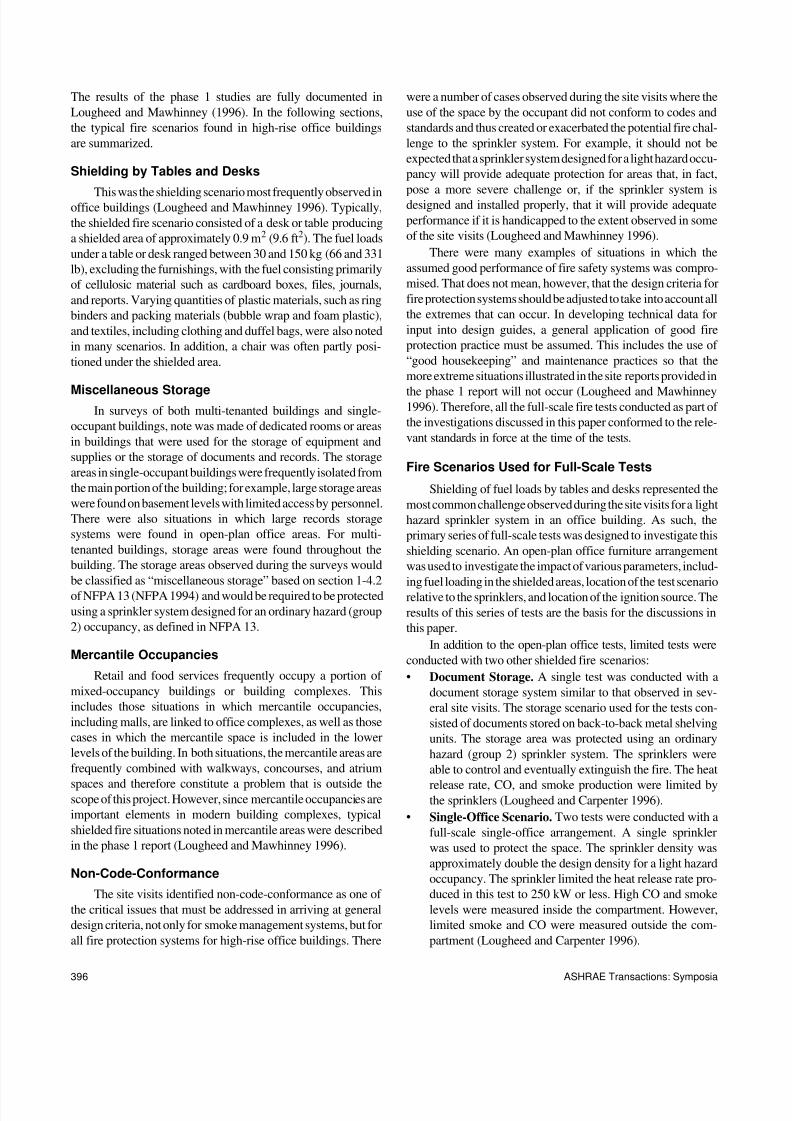
The test facility used for the previous investigations onshielded fires (Mawhinney et al. 1992; Mawhinney and Tamura1994) was modified and expanded for the full-scale tests. Theexpanded test facility, shown in Figure 1, had an overall floorarea of approximately 94 m 2 (1,012 ft 2). The only obstruction
was a structural column located near the center of the test area.This column consisted of a steel section protected by rock fiberinsulation and 6 mm (¼ in.) thick concrete board. The columnhad a square cross section of 455 mm by 455 mm (1.5 ft by 1.5ft). This column, and two columns located adjacent to the eastand west walls of the test facility, supported a structural steelbeam used to support the concrete slab ceiling of the test facility.
A suspended ceiling system, giving a clear height of approximately 2.74 m (9 ft), was installed throughout the testfacility. The concrete floor of the test facility was sloped towardthe east wall to allow water to drain into a central trench fordisposal. The ceiling height was 2.74 m (9 ft) at the west wall of the test facility and 2.8 m (9.1 ft) at the highest point in the south-east corner. The ceiling system was constructed using 0.6 m by1.2 m (2 ft by 4 ft) waterproof gypsum board panels mounted onsteel tracks.
Concrete board (6 mm [¼ in.] thick) was used to line the testfacility and the upper 1.2 m (4 ft) of the exhaust hood canopy
Figure 1 Sketch of test facility.Dimensions are in meters unless otherwise indicated.
8/8/2019 Expected Size of Shielded Fires in Sprinkle Red Office
http://slidepdf.com/reader/full/expected-size-of-shielded-fires-in-sprinkle-red-office 6/18
398 ASHRAE Transactions: Symposia
extension to the facility. The lower portion of the extension wasdesigned to be left open to provide ventilation air for the fire.However, an initial test with sprinklers indicated that, with thecooling and mixing produced by the sprinkler spray, thecombustion products were distributed over the height of the testspace and could have escaped through the opening and not beencollected by the hood system (Figure 1). As a result, the openingsin the east wall and the northeast and southeast corners werecovered by polyethylene sheeting, leaving only the ventilationopenings on the north and south sides of the facility as shown inFigure 1. These openings were approximately 1.43 m (4.7 ft)high and provided a total ventilation area of 15.2 m 2 (164 ft 2).The air inflow through these openings produced by the fan usedfor the products of the combustion system was sufficient to mini-mize the loss of combustion by-products through them.
Sprinkler System
With the expanded test facility, a four-sprinkler, light-hazard occupancy system could be installed using the maxi-mum spacing from the walls (2.3 m [7.5 ft]) and between sprin-klers (4.6 m [15 ft]) allowed by NFPA 13 (NFPA 1994). Thelocations of the four sprinklers in the test facility are shown inFigure 1. This sprinkler arrangement gave the maximumprotected area per sprinkler (20.9 m 2 [225 ft 2]) allowed byNFPA 13. By using the maximum sprinkler spacing and cover-age areas allowed by the installation standard, the shielding of
the fire by room contents was maximized, resulting in conser-vative test conditions.
Standard response 74°C (165°F) pendant sprinklers with a13-mm (½-in.) orifice were used for all tests. Water flow rateswere calculated on the basis that the water spray density shouldmeet the requirements of a light hazard sprinkler system. A
design density of 4.1 L/min·m2
was determined in consultationwith the ASHRAE project monitoring subcommittee prior to thetests. Using this design density, the calculated water flow rate persprinkler was 86 L/min.
Full-Scale Open-Plan Fire Test Scenarios
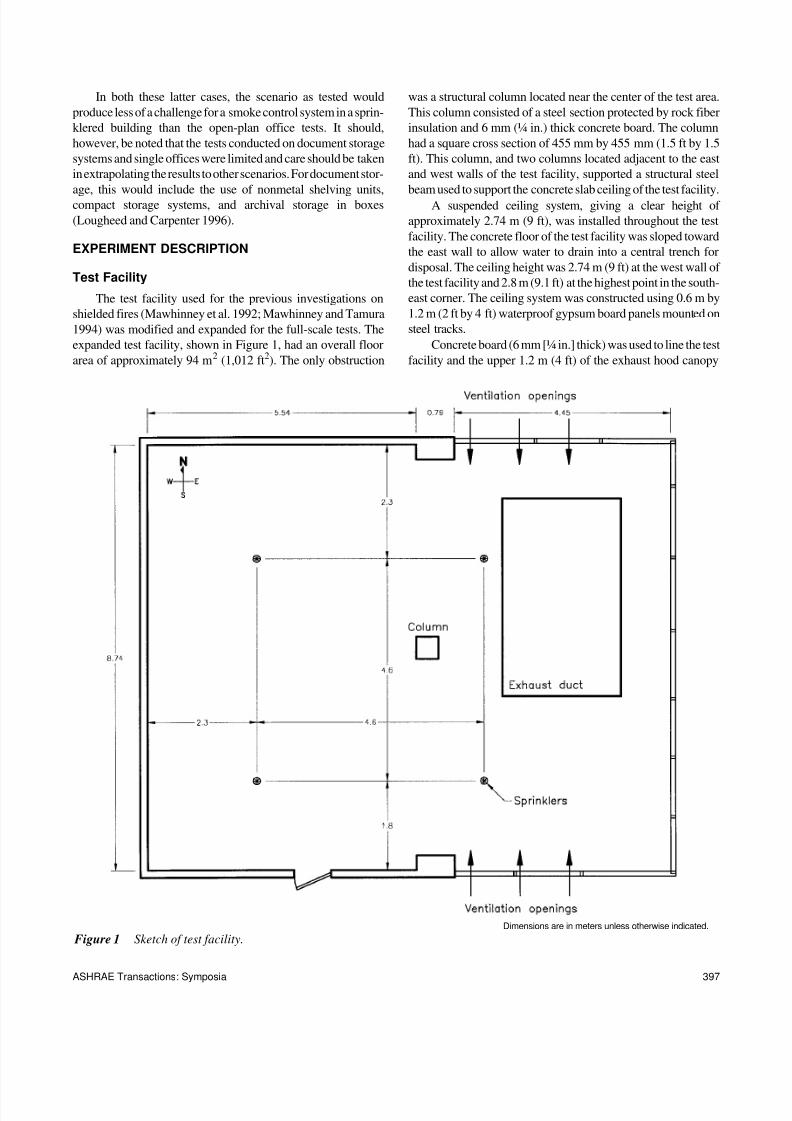
Seven full-scale fire tests were conducted using a “typical”open-plan office furniture arrangement. The test scenario wasrepresentative of that found in a standard 3 m by 3 m (10 ft by 10ft) open-plan office including 1.2 m (4 ft) high office partitions,a desk, a second desk or table used as a computer workstation, atable, bookshelves above the desk, two or three office chairs, andtwo four-drawer filing cabinets. A typical test arrangement isshown in Figure 2. Commercial-grade carpet was used to coverthe concrete floor in the 3 m by 3 m (10 ft by 10 ft) test area.Boxes containing paper stock were used as the fuel load undereach table and desk in the primary test area.
Typical furniture (desks, bookshelves, and filing cabinets)was also included in the adjacent office areas, as shown in Figure2. This furniture served two purposes:
Figure 2 Test room layout and instrumentation.
8/8/2019 Expected Size of Shielded Fires in Sprinkle Red Office
http://slidepdf.com/reader/full/expected-size-of-shielded-fires-in-sprinkle-red-office 7/18
ASHRAE Transactions: Symposia 399
• additional shielding from the sprinkler spray for the fireload, including by the office partitions used as the bound-ary for the primary fire test area; and
• as a target for potential office-to-office fire spread.
There is a wide variation in materials used for office furni-ture, including solid wood (desks and tables), mixed materials(e.g., steel-framed desks with wood tops and drawers), and solidmetal. For the tests conducted in this project, furniture withmixed materials was selected in the 3 m by 3 m (10 ft by 10 ft)fire area as being reasonably representative of the mix. Thisincluded the following:
1. A single- or double-pedestal desk with steel frame and woodtop and drawers (the total weight of the combustible mate-rials was approximately 57 kg [126 lb] for a single-pedestaldesk and 82 kg [181 lb] for a double-pedestal desk).
2. A table with a wood top (37 kg [81.5 lb] combustible mate-rial) or a single-pedestal desk (57 kg [126 lb]) with a woodtop and drawers used as a computer workstation.
3. A table with a metal frame and a wood top (37 kg [81.5 lb]combustible material).
4. Two or three upholstered pedestal chairs with metal base(9.5 kg [21 lb] combustible material in each chair).
5. Two four-drawer metal filing cabinets.6. Fabric-covered office partition (1.2 m by 1.5 m [4 ft by 5 ft])
with fiber insulation, a wood frame, and a heavy metal meshstructural element (the textile covering and insulation werefire retarded and were difficult to burn in tests withoutsprinklers).
7. A computer including monitor and keyboard (the computersused for all except one test were of recent vintage and hadsteel cases).
Details regarding the dimensions and location of the furnitureand other fuel loads for each full-scale open-plan office testare provided in the report for phase 2 of the project (Lougheedand Carpenter 1996).
Instrumentation for Open-Plan Office Fire Tests
Instrumentation for the full-scale open-plan fire testsincluded the following:
• Seven thermocouple trees were located in the test facilityas shown in Figure 2. The thermocouples on each treewere located 0.15, 0.61, 1.22, and 1.83 m (0.5, 2, 4, and
6 ft) below the ceiling. Metal shields (approximately 400mm by 400 mm [1.3 ft by 1.3 ft]) were placed above eachthermocouple to shield it from direct water spray fromthe sprinkler.
• Thermocouples were located adjacent to the fusible ele-ment of each of the four sprinklers (Figure 1).
• Pressure taps to measure the differential pressurebetween the test facility and the burn hall were located atthree heights on the west wall of the test facility (Figure2). The pressure taps were located 0.15, 1.22, and 2.29 m(0.5, 4, and 7.5 ft) below the ceiling.
• Gas inlets for acquiring gas samples to determine CO andcarbon dioxide (CO 2) concentrations were located atthree points in the test facility (Figure 2). The inlets were0.15 and 1.2 m (0.5 and 4 ft) below the ceiling.
• Thermocouples were placed under each table and desk located in the central fire area. The thermocouples were
located 50 mm (2 in.) below the desk or table top.Products of Combustion Collector and Calorimeter
There was a 2.4 m by 4 m (7.8 ft by 13.1 ft) opening in theceiling in the southwest corner of the test facility connecting toa hood/duct system for a products-of-combustion calorimeter(Figure 1). The bottom edge of the hood was flush with theunderside of the ceiling. The hood was connected through a 1.2-m3 (42.3-ft 3) plenum to a 13 m (42.6 ft) long, 0.56 m (1.8 ft)diameter horizontal duct. A two-speed fan with a capacity of 3to 4 m 3 /s (106 to 141 ft 3 /s) was connected to the downstream endof the duct. A thermocouple and a pitot-static velocity probewere installed in the center of the exhaust duct, approximately 9m (29.5 ft) from the center of the plenum. A pitot tube traversetest was conducted and a flow shape factor of 0.91 determined.
An infrared smoke meter was located in the duct approxi-mately 0.2 m (0.6 ft) downstream from the thermocouple loca-tion. Provisions were made to continuously monitor CO, CO 2,and O 2 concentrations at the centerline of the duct, 9.3 m (30.5ft) from the center of the plenum. The duct measurements wereused to determine the heat release rate using the oxygen deple-tion method (Huggett 1980).
Test Procedure
All tests were conducted using the same procedure.
1. The data-acquisition system was started at time zero andrecorded ambient conditions for two minutes prior to igni-tion of a propane T-burner used as the ignition source. Allplots provided in this paper include data taken during thetwo-minute pretest period.
2. At two minutes, the propane burner was ignited. The burnerdesign and heat release rate (approximately 25 kW) werebased on the ignition source used for standard tests forfurniture (ASTM 1994).
3. At five minutes, the propane burner was shut off.
4. The sprinklers were allowed to activate normally and thewater flow rate was adjusted manually to provide therequired flow rate.
5. All tests were continued until the temperatures measured inthe shielded areas indicated minimal fire remained in theselocations.
MEDIUM-SCALE FIRE TEST RESULTS
A series of 23 medium-scale fire tests was conducted witha horizontal shielded area representative of a typical table or desk (0.9 m 2 [9.6 ft 2]). The medium-scale tests were conducted withselected portions of the fuel packages used for the full-scale fire
8/8/2019 Expected Size of Shielded Fires in Sprinkle Red Office
http://slidepdf.com/reader/full/expected-size-of-shielded-fires-in-sprinkle-red-office 8/18
8/8/2019 Expected Size of Shielded Fires in Sprinkle Red Office
http://slidepdf.com/reader/full/expected-size-of-shielded-fires-in-sprinkle-red-office 9/18
ASHRAE Transactions: Symposia 401
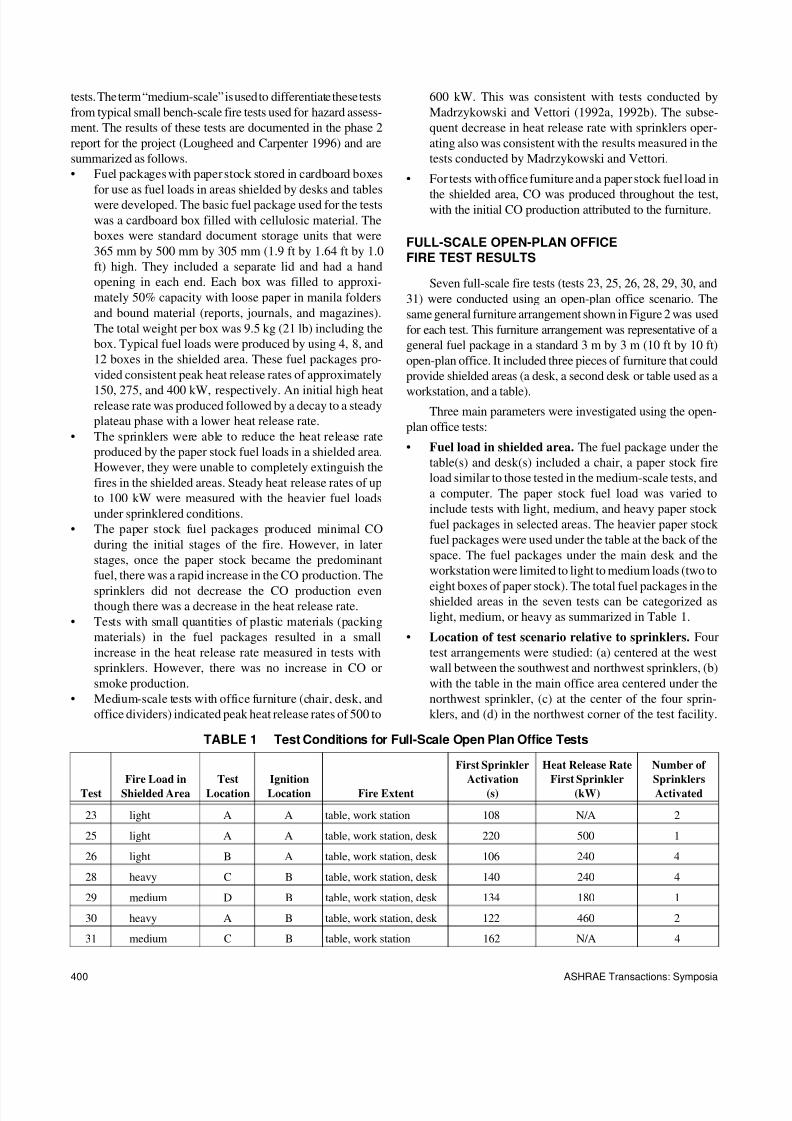
The locations of the test arrangements used for the testsare summarized in Table 1.
• Location of ignition source. All seven tests were con-ducted using a propane T-burner as an ignition source.Two different ignition scenarios were used in the full-scale tests. In scenario A, the propane burner was placednear the center of the paper stock fuel load located underthe table at the back of the test arrangement. The burnerwas located approximately 25 mm (1 in.) from the face of the boxes and approximately 50 mm (2 in.) above thefloor. With this scenario, the initial fire involved a singleshielded area and could subsequently spread to the twoother areas, depending on the effectiveness of the sprin-kler system. In scenario B, the propane burner ignitionsource was used to ignite two boxes containing paperstock in the northwest corner of the test arrangementbetween the table and the table/desk used as the worksta-tion. With this scenario, the initial fire spread simulta-neously into two shielded areas before sprinkler
activation. The fire could subsequently spread to the thirdarea, depending on the effectiveness of the sprinkler incontrolling fire spread. The location of the ignitionsource for each test is summarized in Table 1.
The other parameters that impacted on the test results were theextent of fire spread during the tests and the number of sprin-klers activated. The number of sprinklers activated and theshielded areas involved in the fire in each test are noted inTable 1.
The results of the full-scale open-plan office tests are docu-mented in the report for phase 2 of the project (Lougheed andCarpenter 1996). In this paper, the discussion is limited to the
general trends for those parameters that can have an impact onthe design of a smoke control system for a high-rise office build-ing. This includes the sprinkler activation time and the extent of fire spread, compartment temperatures, heat release rate, COproduction rate, smoke generation, and smoke movement.
Sprinkler Activation
The time and approximate heat release rate at which the firstsprinklers activated are shown in Table 1. The sprinkler activa-tion times noted in the table are relative to the ignition time,which was two minutes after the start of the test.
The activation time for the first sprinkler depended on thelocation of the test scenario and ranged from 106 to 220 seconds.
The heat release rate at activation of the first sprinkler wasbetween 200 and 500 kW. In several tests, the first sprinkler acti-vated was able to localize the fire to the shielded areas but wasunable to stop fire growth and spread in the shielded area. Withthe continued increase in heat release rate, further sprinklerswere activated, with up to four sprinklers operating in some tests(Table 1).
In all tests, the fire did not spread beyond the boundary of the 3 m by 3 m (9.8 ft by 9.8 ft) office area, even though thetemperatures in the shielded areas reached up to 800°C(1472°F). It should be noted, however, that the materials used in
the office dividers were heavily fire resistant (textile coveringand fiber insulation). It required considerable time (more than 10minutes) to penetrate the barriers under nonsprinklered condi-tions with direct fire exposure. It may be possible that, with otheroffice dividers, the fire could spread through the barriers to theshielded areas in adjacent offices. However, the fire scenariosused for the open-plan office tests were arranged such that thefire could propagate to at least two, and in some cases three,shielded areas. As such, the results of these tests are representa-tive of situations in which the sprinkler system is placed under asevere challenge. The probability is considered low, even withlower fire-resistant office dividers, that the fire would involvemore than three shielded areas. This assumption is consistentwith the results of a post-fire analysis conducted in the U.K.(Morgan and Hansell 1985). Those studies indicated that anoffice fire in a sprinklered building was typically limited to anarea of 16 m 2 (172 ft 2) or less.
Heat Release Rate
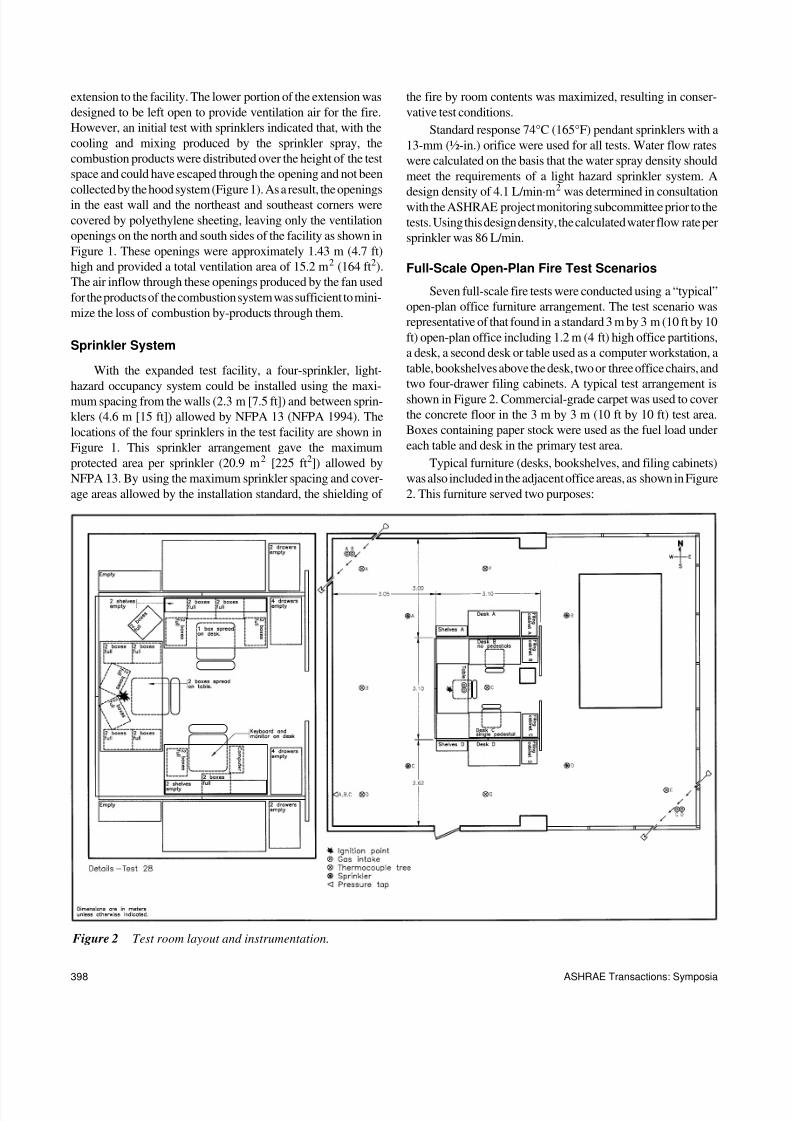
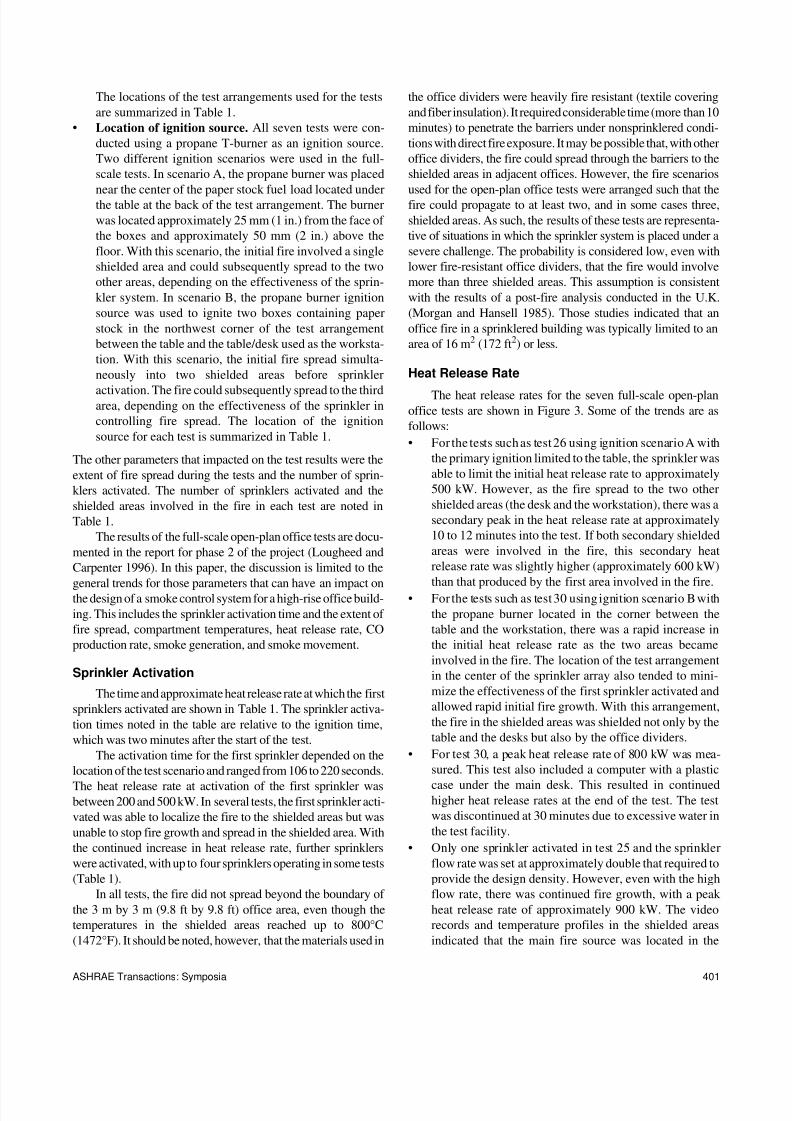
The heat release rates for the seven full-scale open-planoffice tests are shown in Figure 3. Some of the trends are asfollows:• For the tests such as test 26 using ignition scenario A with
the primary ignition limited to the table, the sprinkler wasable to limit the initial heat release rate to approximately500 kW. However, as the fire spread to the two othershielded areas (the desk and the workstation), there was asecondary peak in the heat release rate at approximately10 to 12 minutes into the test. If both secondary shieldedareas were involved in the fire, this secondary heatrelease rate was slightly higher (approximately 600 kW)than that produced by the first area involved in the fire.
• For the tests such as test 30 using ignition scenario B withthe propane burner located in the corner between thetable and the workstation, there was a rapid increase inthe initial heat release rate as the two areas becameinvolved in the fire. The location of the test arrangementin the center of the sprinkler array also tended to mini-mize the effectiveness of the first sprinkler activated andallowed rapid initial fire growth. With this arrangement,the fire in the shielded areas was shielded not only by thetable and the desks but also by the office dividers.
• For test 30, a peak heat release rate of 800 kW was mea-sured. This test also included a computer with a plastic
case under the main desk. This resulted in continuedhigher heat release rates at the end of the test. The testwas discontinued at 30 minutes due to excessive water inthe test facility.
• Only one sprinkler activated in test 25 and the sprinklerflow rate was set at approximately double that required toprovide the design density. However, even with the highflow rate, there was continued fire growth, with a peak heat release rate of approximately 900 kW. The videorecords and temperature profiles in the shielded areasindicated that the main fire source was located in the
8/8/2019 Expected Size of Shielded Fires in Sprinkle Red Office
http://slidepdf.com/reader/full/expected-size-of-shielded-fires-in-sprinkle-red-office 10/18
402 ASHRAE Transactions: Symposia
workstation area that was on the side of the test arrange-ment with the active sprinkler. As such, the fire wasshielded from the sprinkler spray not only by the desk butalso by the office divider, minimizing the sprinkler sprayable to reach the fire zone.
• The lowest heat release rates were measured in test 29.
In this case the test arrangement was located in thenorthwest corner of the test facility. The protection wasprovided solely by the northwest sprinkler. However,this sprinkler was located within the perimeter of thetest arrangement and the sprinkler spray had goodaccess to the fire under the table and the workstation.The highest heat release rate was measured later in thetest when the fire propagated to the main desk area clos-est to the sprinkler.
• During the initial fire growth phase, the fire did involvefuel placed on the desk and table surfaces. Once the sprin-klers activated, the fires in the full-scale tests were limited
to the fuel packages under the shielded areas. As such, theheat release rates measured in the full-scale tests can beconsidered a superposition of the heat release rates pro-vided by fires in two or more shielded fuel packages.
The heat release rates measured in the full-scale tests areconsistent with those obtained in the medium-scale tests. Themedium-scale tests indicated a peak heat release rate in the rangeof 300 to 600 kW for each shielded area, depending on the timeof activation and effectiveness of the sprinkler(s). The medium-scale tests also indicated a decay in the heat release rate to 50 to100 kW for a shielded area at 15 to 20 minutes after ignition.
Three heat release rate models are proposed in the litera-ture for sprinklered office fires. In the following, the results of the full-scale open-plan office tests are compared to each of those models.
1. U.K. Design Fire (Hansell and Morgan 1994). In theU.K., steady-state fires for use in the design of smoke control
systems have been developed. These fires were based on areview of fire incidents in the U.K. A steady-state fire isassumed, as it is considered to provide a conservative basis forthe design of a smoke control system. For an office building, thedesign fire is assumed to be 6 MW for a nonsprinklered buildingand 1 MW for a sprinklered building (Morgan and Hansell1985). The area of the fire is assumed to be 16 m 2 (172 ft 2) and47 m 2 (506 ft 2) for the sprinklered and nonsprinklered cases,respectively. A comparison with the full-scale test results shownin Figure 3 indicates that, in the initial phase, the U.K. design fireprovides a conservative estimate (10% to 20% higher) of theinitial peak heat release rate. However, at the later stages, thereis a continuous decrease in the measured heat release rate, withthe result that the steady-state design curve becomes increas-ingly conservative.
2. NFPA 92B (NFPA 1995). In NFPA 92B, it is suggestedfor atrium applications that, for sprinklered buildings, anincreasing heat release rate should be assumed for a fire until thesprinklers are activated. Subsequently, the heat release rate isassumed to be constant. For the present tests, the first sprinkleractivated for heat release rates in the range of 200 to 500 kW,depending on the location of the ignition source relative to thesprinkler. This is assuming that a steady-state heat release rate inthis range would not provide a conservative estimate of the heat
Figure 3 Heat release rates.
8/8/2019 Expected Size of Shielded Fires in Sprinkle Red Office
http://slidepdf.com/reader/full/expected-size-of-shielded-fires-in-sprinkle-red-office 11/18
ASHRAE Transactions: Symposia 403
release rates measured in the full-scale tests. In particular, theNFPA procedure would not take into account the continued firegrowth after first sprinkler activation and the potential for the firespreading to secondary shielded areas. It should be noted,however, that the NFPA 92B design fire for sprinklered appli-cations was developed for atrium applications and not necessar-ily for office areas.
3. NIST Office Tests (Madrzykowski and Vettori 1992a,1992b). Based on a series of office fire tests, Madrzykowski andVettori developed an estimate for the heat release rate from asprinklered office scenario. An empirically based sprinkler firesuppression algorithm was developed in which it was assumedthat, subsequent to sprinkler activation, the heat release ratewould decrease exponentially. This estimate for the heat releaserate provided a conservative estimate for all the tests conductedby Madrzykowski and Vettori except the secretarial scenario,which included a paper stock fuel package under a desk. Thismodel, in its present form, would not provide a conservative esti-mate of the heat release rates measured in the full-scale open-
plan office tests. As with the NFPA 92B model, this model doesnot take into account the continued fire growth after first sprin-kler activation and the potential for the fire spreading to second-ary shielded areas. Also, as discussed by Madrzykowski andVettori, the sprinkler fire suppression algorithm they developeddid not take into account fuel loads stored under desks and tables.
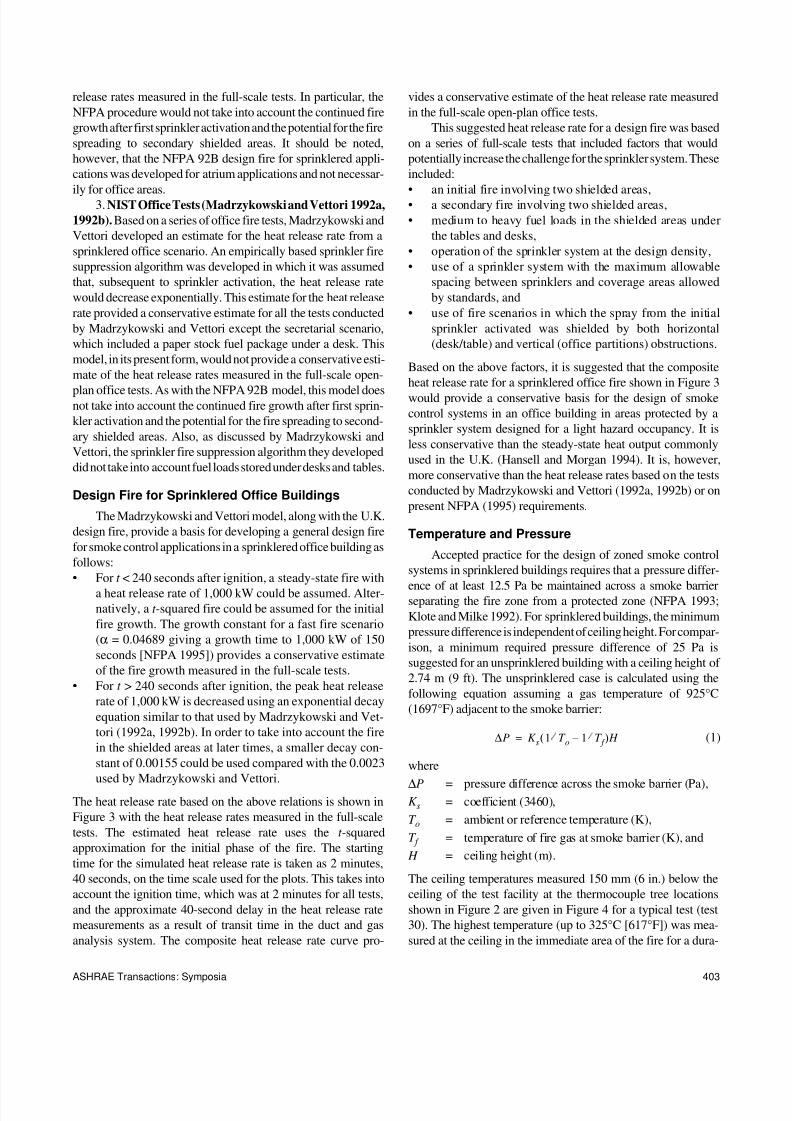
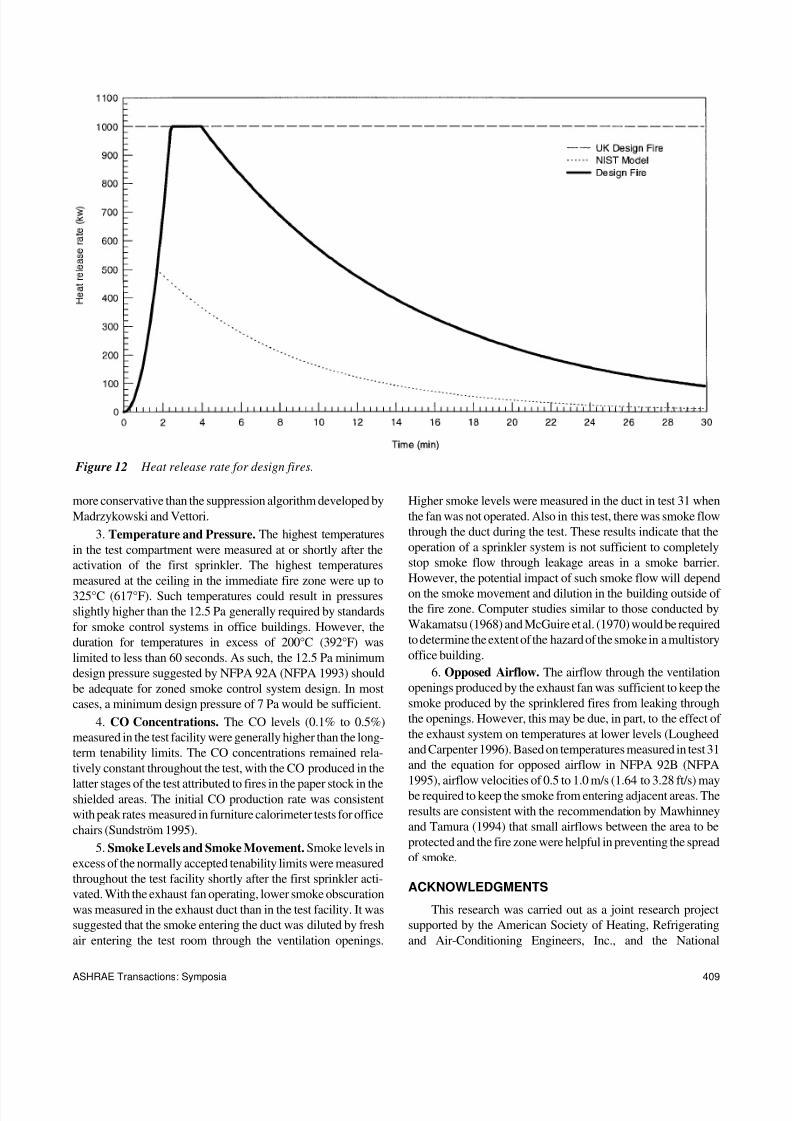
Design Fire for Sprinklered Office Buildings
The Madrzykowski and Vettori model, along with the U.K.design fire, provide a basis for developing a general design firefor smoke control applications in a sprinklered office building asfollows:• For t < 240 seconds after ignition, a steady-state fire with
a heat release rate of 1,000 kW could be assumed. Alter-natively, a t -squared fire could be assumed for the initialfire growth. The growth constant for a fast fire scenario(α = 0.04689 giving a growth time to 1,000 kW of 150seconds [NFPA 1995]) provides a conservative estimateof the fire growth measured in the full-scale tests.
• For t > 240 seconds after ignition, the peak heat releaserate of 1,000 kW is decreased using an exponential decayequation similar to that used by Madrzykowski and Vet-tori (1992a, 1992b). In order to take into account the firein the shielded areas at later times, a smaller decay con-stant of 0.00155 could be used compared with the 0.0023used by Madrzykowski and Vettori.
The heat release rate based on the above relations is shown inFigure 3 with the heat release rates measured in the full-scaletests. The estimated heat release rate uses the t -squaredapproximation for the initial phase of the fire. The startingtime for the simulated heat release rate is taken as 2 minutes,40 seconds, on the time scale used for the plots. This takes intoaccount the ignition time, which was at 2 minutes for all tests,and the approximate 40-second delay in the heat release ratemeasurements as a result of transit time in the duct and gasanalysis system. The composite heat release rate curve pro-
vides a conservative estimate of the heat release rate measuredin the full-scale open-plan office tests.
This suggested heat release rate for a design fire was basedon a series of full-scale tests that included factors that wouldpotentially increase the challenge for the sprinkler system. Theseincluded:• an initial fire involving two shielded areas,• a secondary fire involving two shielded areas,• medium to heavy fuel loads in the shielded areas under
the tables and desks,• operation of the sprinkler system at the design density,• use of a sprinkler system with the maximum allowable
spacing between sprinklers and coverage areas allowedby standards, and
• use of fire scenarios in which the spray from the initialsprinkler activated was shielded by both horizontal(desk/table) and vertical (office partitions) obstructions.
Based on the above factors, it is suggested that the compositeheat release rate for a sprinklered office fire shown in Figure 3would provide a conservative basis for the design of smokecontrol systems in an office building in areas protected by asprinkler system designed for a light hazard occupancy. It isless conservative than the steady-state heat output commonlyused in the U.K. (Hansell and Morgan 1994). It is, however,more conservative than the heat release rates based on the testsconducted by Madrzykowski and Vettori (1992a, 1992b) or onpresent NFPA (1995) requirements.
Temperature and Pressure
Accepted practice for the design of zoned smoke controlsystems in sprinklered buildings requires that a pressure differ-
ence of at least 12.5 Pa be maintained across a smoke barrierseparating the fire zone from a protected zone (NFPA 1993;Klote and Milke 1992). For sprinklered buildings, the minimumpressure difference is independent of ceiling height. For compar-ison, a minimum required pressure difference of 25 Pa issuggested for an unsprinklered building with a ceiling height of 2.74 m (9 ft). The unsprinklered case is calculated using thefollowing equation assuming a gas temperature of 925°C(1697°F) adjacent to the smoke barrier:
(1)
where
∆P = pressure difference across the smoke barrier (Pa),K s = coefficient (3460),T o = ambient or reference temperature (K),T f = temperature of fire gas at smoke barrier (K), and
H = ceiling height (m).
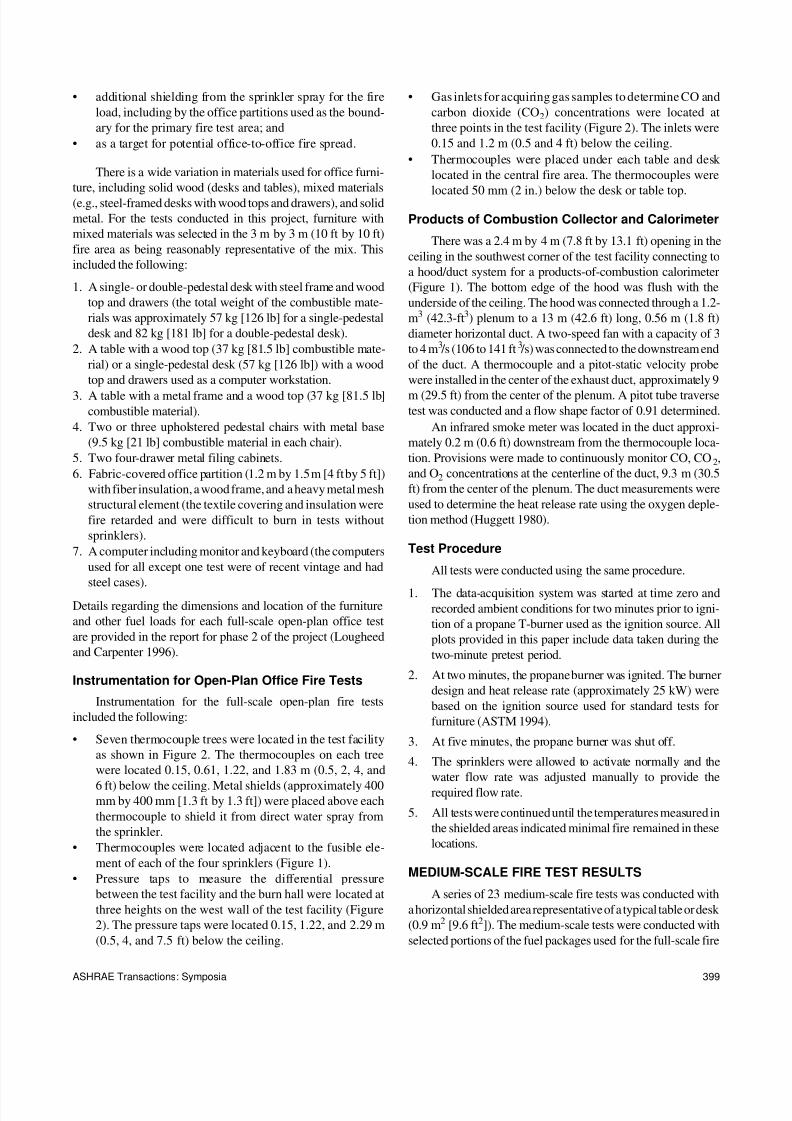
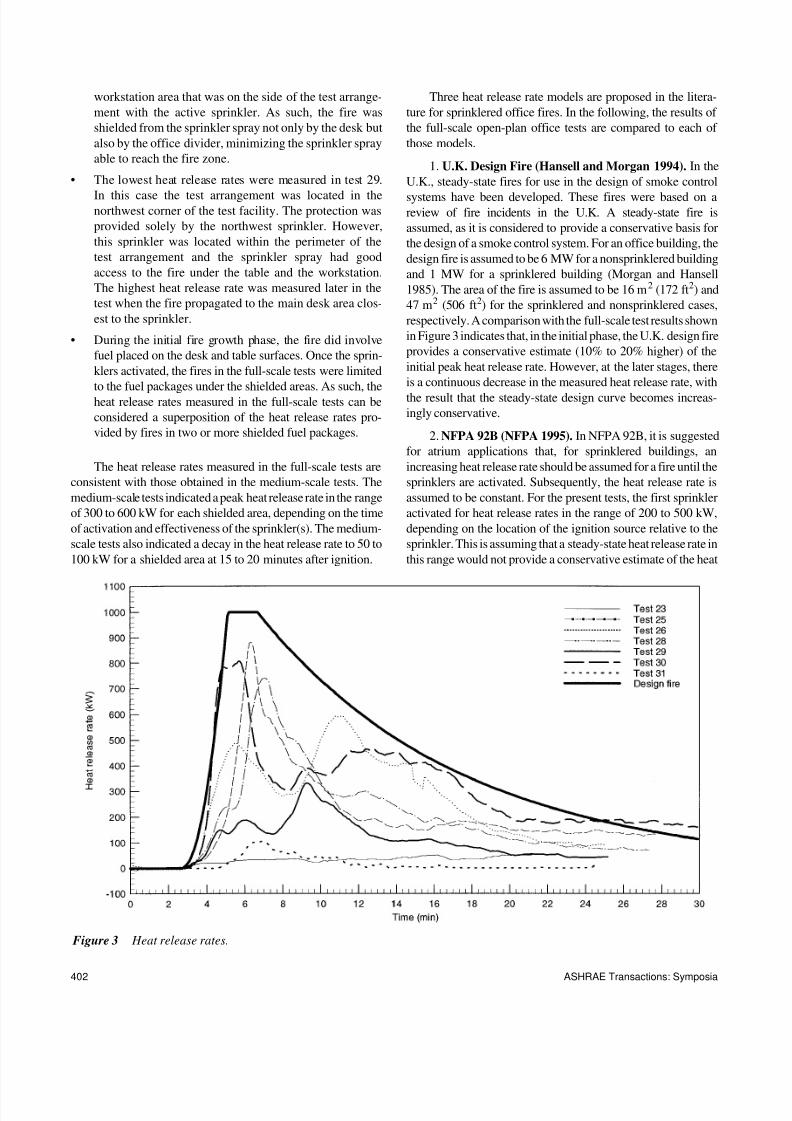
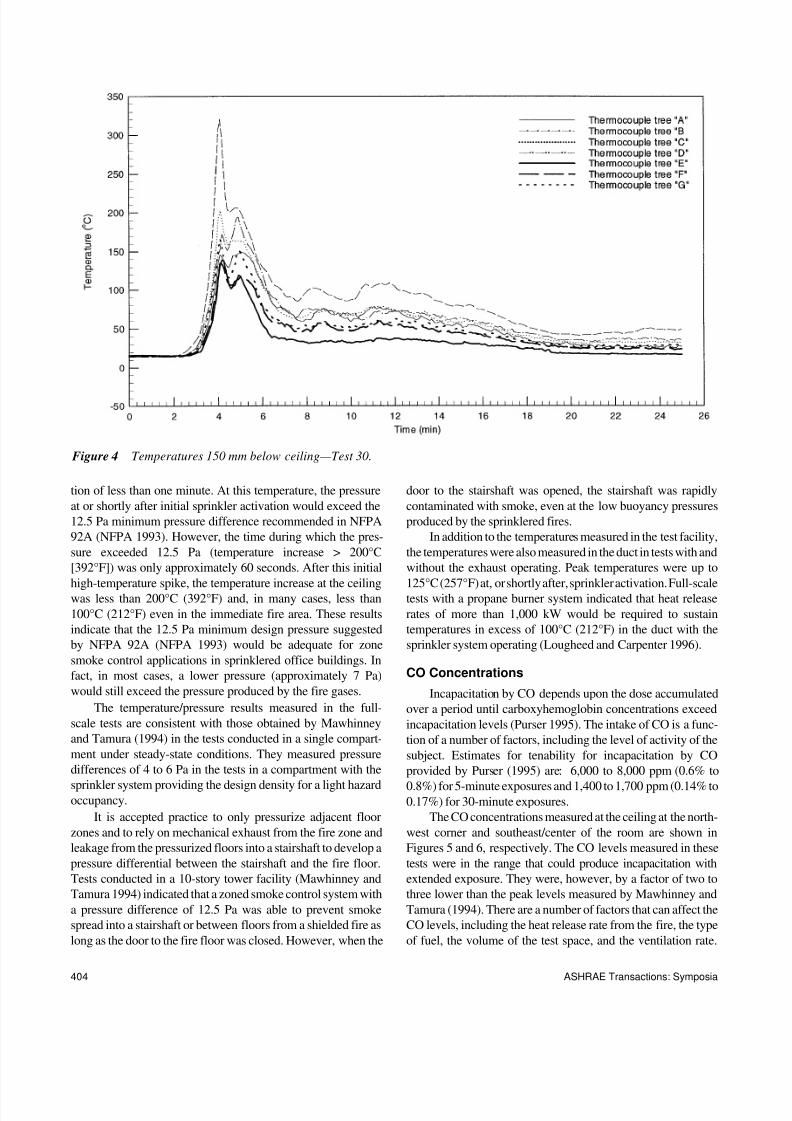
The ceiling temperatures measured 150 mm (6 in.) below theceiling of the test facility at the thermocouple tree locationsshown in Figure 2 are given in Figure 4 for a typical test (test30). The highest temperature (up to 325°C [617°F]) was mea-sured at the ceiling in the immediate area of the fire for a dura-
∆ P K s 1 T o 1 T f –( ) H =
8/8/2019 Expected Size of Shielded Fires in Sprinkle Red Office
http://slidepdf.com/reader/full/expected-size-of-shielded-fires-in-sprinkle-red-office 12/18
404 ASHRAE Transactions: Symposia
tion of less than one minute. At this temperature, the pressureat or shortly after initial sprinkler activation would exceed the12.5 Pa minimum pressure difference recommended in NFPA92A (NFPA 1993). However, the time during which the pres-sure exceeded 12.5 Pa (temperature increase > 200°C[392°F]) was only approximately 60 seconds. After this initial
high-temperature spike, the temperature increase at the ceilingwas less than 200°C (392°F) and, in many cases, less than100°C (212°F) even in the immediate fire area. These resultsindicate that the 12.5 Pa minimum design pressure suggestedby NFPA 92A (NFPA 1993) would be adequate for zonesmoke control applications in sprinklered office buildings. Infact, in most cases, a lower pressure (approximately 7 Pa)would still exceed the pressure produced by the fire gases.
The temperature/pressure results measured in the full-scale tests are consistent with those obtained by Mawhinneyand Tamura (1994) in the tests conducted in a single compart-ment under steady-state conditions. They measured pressuredifferences of 4 to 6 Pa in the tests in a compartment with the
sprinkler system providing the design density for a light hazardoccupancy.
It is accepted practice to only pressurize adjacent floorzones and to rely on mechanical exhaust from the fire zone andleakage from the pressurized floors into a stairshaft to develop apressure differential between the stairshaft and the fire floor.Tests conducted in a 10-story tower facility (Mawhinney andTamura 1994) indicated that a zoned smoke control system witha pressure difference of 12.5 Pa was able to prevent smokespread into a stairshaft or between floors from a shielded fire aslong as the door to the fire floor was closed. However, when the
door to the stairshaft was opened, the stairshaft was rapidlycontaminated with smoke, even at the low buoyancy pressuresproduced by the sprinklered fires.
In addition to the temperatures measured in the test facility,the temperatures were also measured in the duct in tests with andwithout the exhaust operating. Peak temperatures were up to
125°C (257°F) at, or shortly after, sprinkler activation. Full-scaletests with a propane burner system indicated that heat releaserates of more than 1,000 kW would be required to sustaintemperatures in excess of 100°C (212°F) in the duct with thesprinkler system operating (Lougheed and Carpenter 1996).
CO Concentrations
Incapacitation by CO depends upon the dose accumulatedover a period until carboxyhemoglobin concentrations exceedincapacitation levels (Purser 1995). The intake of CO is a func-tion of a number of factors, including the level of activity of thesubject. Estimates for tenability for incapacitation by COprovided by Purser (1995) are: 6,000 to 8,000 ppm (0.6% to
0.8%) for 5-minute exposures and 1,400 to 1,700 ppm (0.14% to0.17%) for 30-minute exposures.
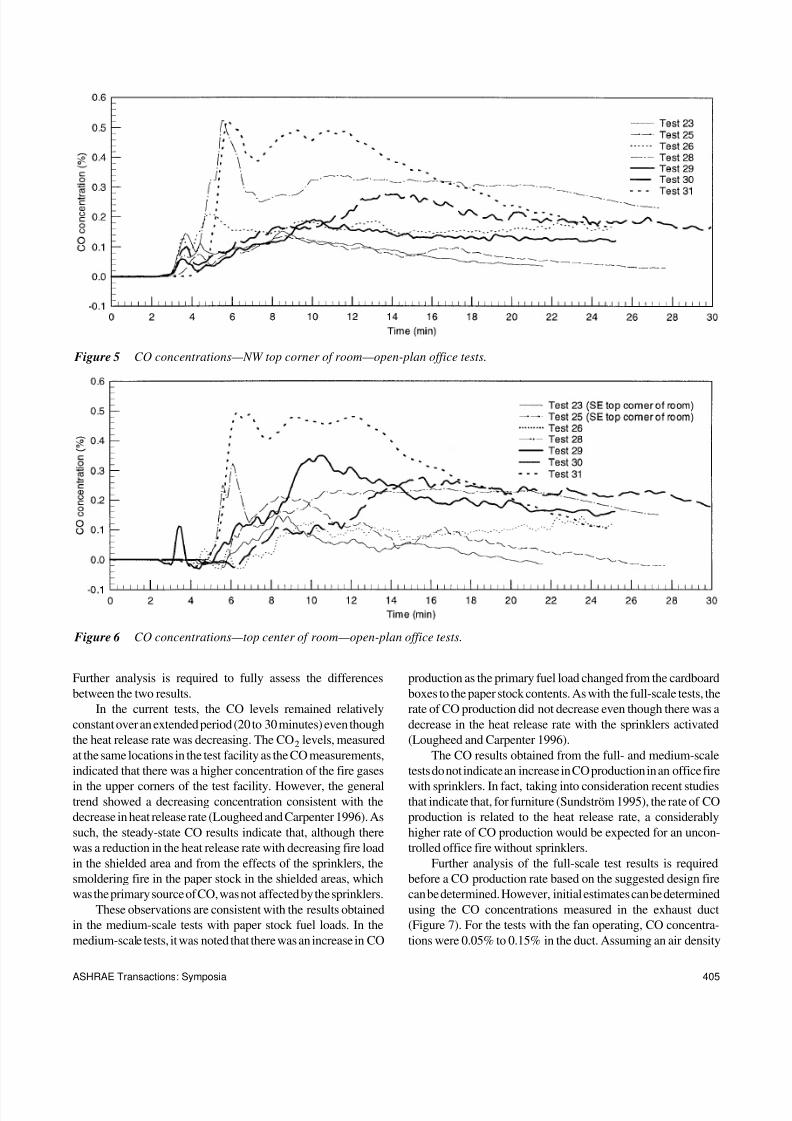
The CO concentrations measured at the ceiling at the north-west corner and southeast/center of the room are shown inFigures 5 and 6, respectively. The CO levels measured in thesetests were in the range that could produce incapacitation withextended exposure. They were, however, by a factor of two tothree lower than the peak levels measured by Mawhinney andTamura (1994). There are a number of factors that can affect theCO levels, including the heat release rate from the fire, the typeof fuel, the volume of the test space, and the ventilation rate.
Figure 4 Temperatures 150 mm below ceiling—Test 30.
8/8/2019 Expected Size of Shielded Fires in Sprinkle Red Office
http://slidepdf.com/reader/full/expected-size-of-shielded-fires-in-sprinkle-red-office 13/18
ASHRAE Transactions: Symposia 405
Further analysis is required to fully assess the differencesbetween the two results.
In the current tests, the CO levels remained relativelyconstant over an extended period (20 to 30 minutes) even thoughthe heat release rate was decreasing. The CO 2 levels, measuredat the same locations in the test facility as the CO measurements,indicated that there was a higher concentration of the fire gases
in the upper corners of the test facility. However, the generaltrend showed a decreasing concentration consistent with thedecrease in heat release rate (Lougheed and Carpenter 1996). Assuch, the steady-state CO results indicate that, although therewas a reduction in the heat release rate with decreasing fire loadin the shielded area and from the effects of the sprinklers, thesmoldering fire in the paper stock in the shielded areas, whichwas the primary source of CO, was not affected by the sprinklers.
These observations are consistent with the results obtainedin the medium-scale tests with paper stock fuel loads. In themedium-scale tests, it was noted that there was an increase in CO
production as the primary fuel load changed from the cardboardboxes to the paper stock contents. As with the full-scale tests, therate of CO production did not decrease even though there was adecrease in the heat release rate with the sprinklers activated(Lougheed and Carpenter 1996).
The CO results obtained from the full- and medium-scaletests do not indicate an increase in CO production in an office fire
with sprinklers. In fact, taking into consideration recent studiesthat indicate that, for furniture (Sundström 1995), the rate of COproduction is related to the heat release rate, a considerablyhigher rate of CO production would be expected for an uncon-trolled office fire without sprinklers.
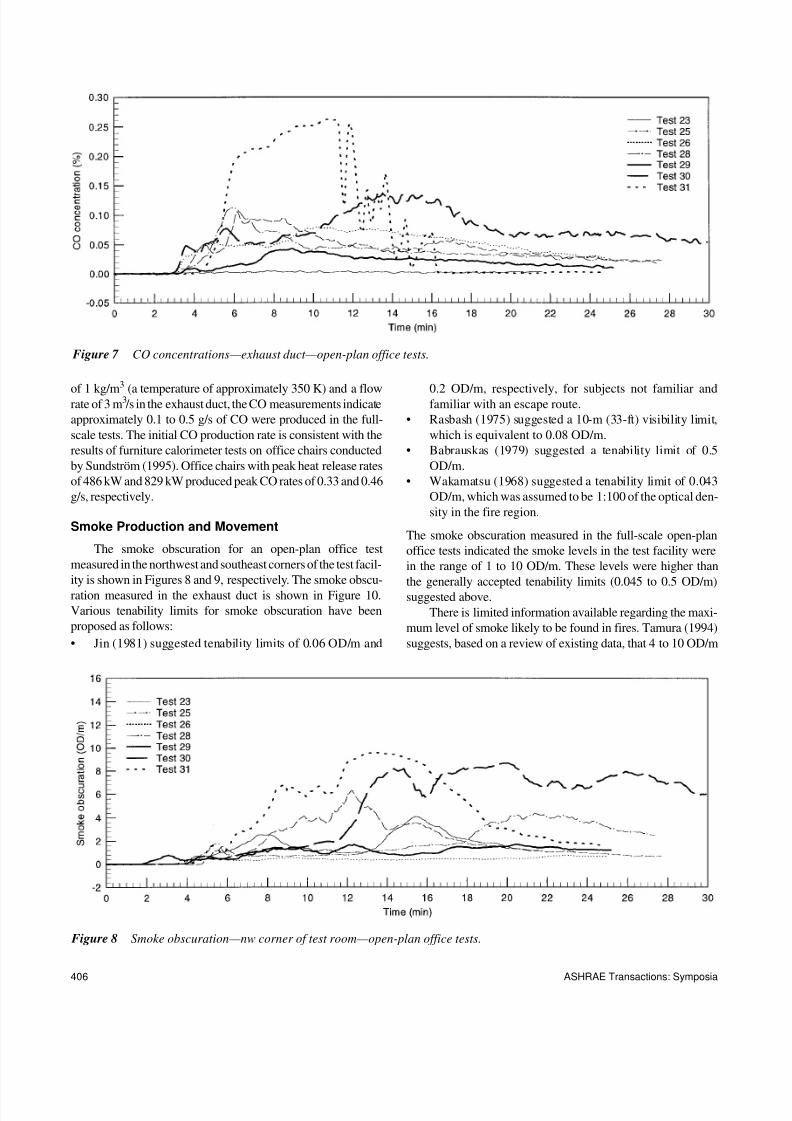
Further analysis of the full-scale test results is requiredbefore a CO production rate based on the suggested design firecan be determined. However, initial estimates can be determinedusing the CO concentrations measured in the exhaust duct(Figure 7). For the tests with the fan operating, CO concentra-tions were 0.05% to 0.15% in the duct. Assuming an air density
Figure 5 CO concentrations—NW top corner of room—open-plan office tests.
Figure 6 CO concentrations—top center of room—open-plan office tests.
8/8/2019 Expected Size of Shielded Fires in Sprinkle Red Office
http://slidepdf.com/reader/full/expected-size-of-shielded-fires-in-sprinkle-red-office 14/18
406 ASHRAE Transactions: Symposia
of 1 kg/m3
(a temperature of approximately 350 K) and a flowrate of 3 m 3 /s in the exhaust duct, the CO measurements indicateapproximately 0.1 to 0.5 g/s of CO were produced in the full-scale tests. The initial CO production rate is consistent with theresults of furniture calorimeter tests on office chairs conductedby Sundström (1995). Office chairs with peak heat release ratesof 486 kW and 829 kW produced peak CO rates of 0.33 and 0.46g/s, respectively.
Smoke Production and Movement
The smoke obscuration for an open-plan office testmeasured in the northwest and southeast corners of the test facil-ity is shown in Figures 8 and 9, respectively. The smoke obscu-ration measured in the exhaust duct is shown in Figure 10.Various tenability limits for smoke obscuration have beenproposed as follows:• Jin (1981) suggested tenability limits of 0.06 OD/m and
0.2 OD/m, respectively, for subjects not familiar andfamiliar with an escape route.• Rasbash (1975) suggested a 10-m (33-ft) visibility limit,
which is equivalent to 0.08 OD/m.• Babrauskas (1979) suggested a tenability limit of 0.5
OD/m.• Wakamatsu (1968) suggested a tenability limit of 0.043
OD/m, which was assumed to be 1:100 of the optical den-sity in the fire region.
The smoke obscuration measured in the full-scale open-planoffice tests indicated the smoke levels in the test facility werein the range of 1 to 10 OD/m. These levels were higher thanthe generally accepted tenability limits (0.045 to 0.5 OD/m)suggested above.
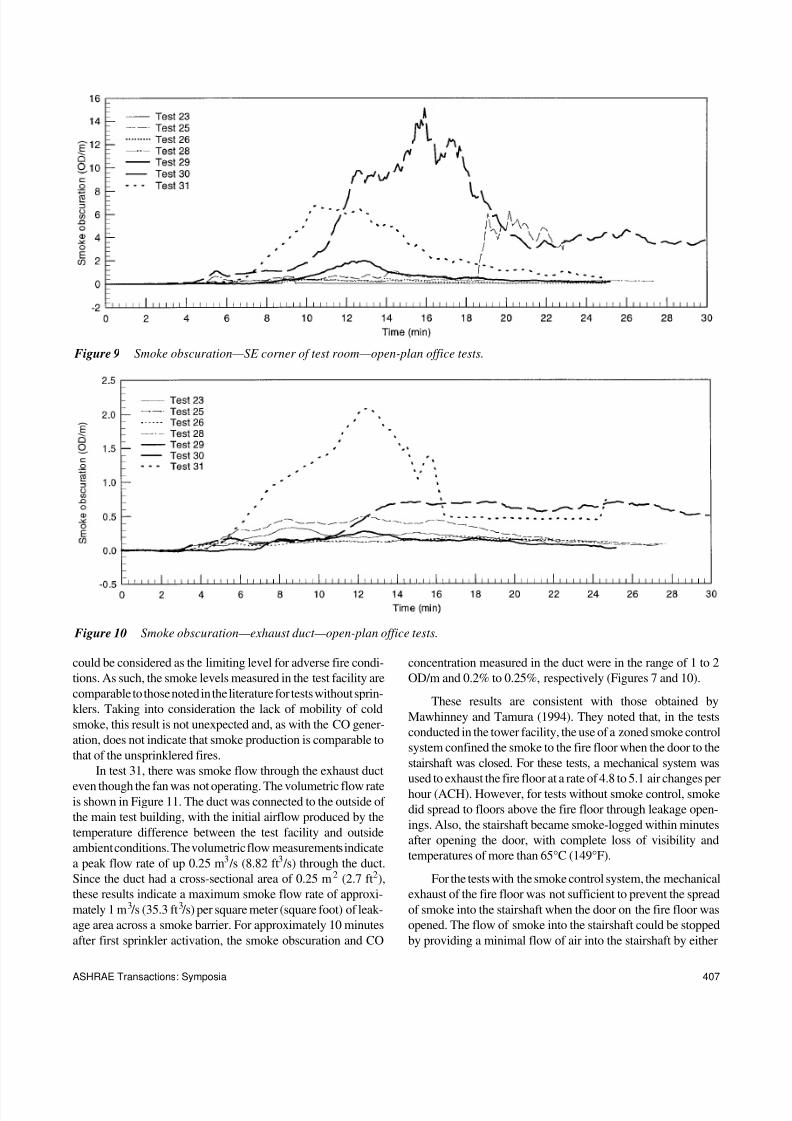
There is limited information available regarding the maxi-mum level of smoke likely to be found in fires. Tamura (1994)suggests, based on a review of existing data, that 4 to 10 OD/m
Figure 7 CO concentrations—exhaust duct—open-plan office tests.
Figure 8 Smoke obscuration—nw corner of test room—open-plan office tests.
8/8/2019 Expected Size of Shielded Fires in Sprinkle Red Office
http://slidepdf.com/reader/full/expected-size-of-shielded-fires-in-sprinkle-red-office 15/18
ASHRAE Transactions: Symposia 407
could be considered as the limiting level for adverse fire condi-tions. As such, the smoke levels measured in the test facility arecomparable to those noted in the literature for tests without sprin-klers. Taking into consideration the lack of mobility of coldsmoke, this result is not unexpected and, as with the CO gener-ation, does not indicate that smoke production is comparable tothat of the unsprinklered fires.
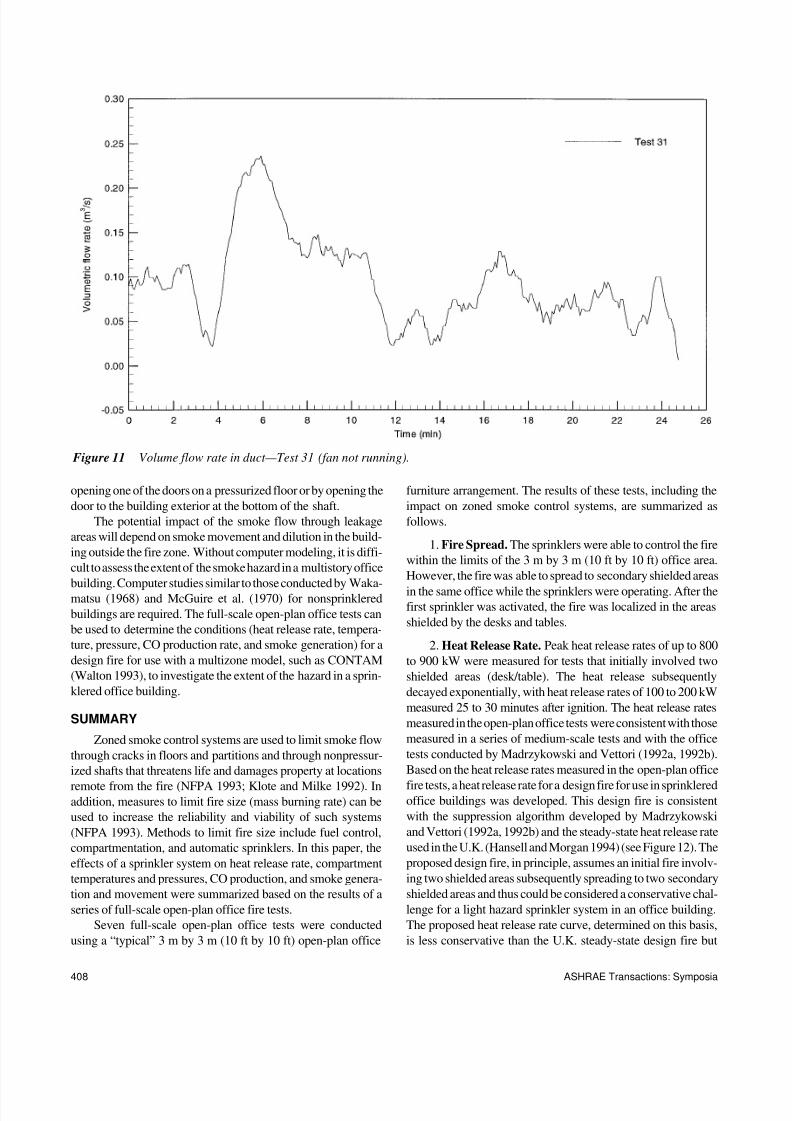
In test 31, there was smoke flow through the exhaust duct
even though the fan was not operating. The volumetric flow rateis shown in Figure 11. The duct was connected to the outside of the main test building, with the initial airflow produced by thetemperature difference between the test facility and outsideambient conditions. The volumetric flow measurements indicatea peak flow rate of up 0.25 m 3 /s (8.82 ft 3 /s) through the duct.Since the duct had a cross-sectional area of 0.25 m 2 (2.7 ft 2),these results indicate a maximum smoke flow rate of approxi-mately 1 m 3 /s (35.3 ft 3 /s) per square meter (square foot) of leak-age area across a smoke barrier. For approximately 10 minutesafter first sprinkler activation, the smoke obscuration and CO
concentration measured in the duct were in the range of 1 to 2OD/m and 0.2% to 0.25%, respectively (Figures 7 and 10).
These results are consistent with those obtained byMawhinney and Tamura (1994). They noted that, in the testsconducted in the tower facility, the use of a zoned smoke controlsystem confined the smoke to the fire floor when the door to thestairshaft was closed. For these tests, a mechanical system wasused to exhaust the fire floor at a rate of 4.8 to 5.1 air changes perhour (ACH). However, for tests without smoke control, smokedid spread to floors above the fire floor through leakage open-ings. Also, the stairshaft became smoke-logged within minutesafter opening the door, with complete loss of visibility andtemperatures of more than 65°C (149°F).
For the tests with the smoke control system, the mechanicalexhaust of the fire floor was not sufficient to prevent the spreadof smoke into the stairshaft when the door on the fire floor wasopened. The flow of smoke into the stairshaft could be stoppedby providing a minimal flow of air into the stairshaft by either
Figure 9 Smoke obscuration—SE corner of test room—open-plan office tests.
Figure 10 Smoke obscuration—exhaust duct—open-plan office tests.
8/8/2019 Expected Size of Shielded Fires in Sprinkle Red Office
http://slidepdf.com/reader/full/expected-size-of-shielded-fires-in-sprinkle-red-office 16/18
408 ASHRAE Transactions: Symposia
opening one of the doors on a pressurized floor or by opening thedoor to the building exterior at the bottom of the shaft.
The potential impact of the smoke flow through leakageareas will depend on smoke movement and dilution in the build-ing outside the fire zone. Without computer modeling, it is diffi-cult to assess the extent of the smoke hazard in a multistory office
building. Computer studies similar to those conducted by Waka-matsu (1968) and McGuire et al. (1970) for nonsprinkleredbuildings are required. The full-scale open-plan office tests canbe used to determine the conditions (heat release rate, tempera-ture, pressure, CO production rate, and smoke generation) for adesign fire for use with a multizone model, such as CONTAM(Walton 1993), to investigate the extent of the hazard in a sprin-klered office building.
SUMMARY
Zoned smoke control systems are used to limit smoke flowthrough cracks in floors and partitions and through nonpressur-ized shafts that threatens life and damages property at locations
remote from the fire (NFPA 1993; Klote and Milke 1992). Inaddition, measures to limit fire size (mass burning rate) can beused to increase the reliability and viability of such systems(NFPA 1993). Methods to limit fire size include fuel control,compartmentation, and automatic sprinklers. In this paper, theeffects of a sprinkler system on heat release rate, compartmenttemperatures and pressures, CO production, and smoke genera-tion and movement were summarized based on the results of aseries of full-scale open-plan office fire tests.
Seven full-scale open-plan office tests were conductedusing a “typical” 3 m by 3 m (10 ft by 10 ft) open-plan office
furniture arrangement. The results of these tests, including theimpact on zoned smoke control systems, are summarized asfollows.
1. Fire Spread. The sprinklers were able to control the firewithin the limits of the 3 m by 3 m (10 ft by 10 ft) office area.However, the fire was able to spread to secondary shielded areasin the same office while the sprinklers were operating. After thefirst sprinkler was activated, the fire was localized in the areasshielded by the desks and tables.
2. Heat Release Rate. Peak heat release rates of up to 800to 900 kW were measured for tests that initially involved twoshielded areas (desk/table). The heat release subsequentlydecayed exponentially, with heat release rates of 100 to 200 kWmeasured 25 to 30 minutes after ignition. The heat release ratesmeasured in the open-plan office tests were consistent with thosemeasured in a series of medium-scale tests and with the officetests conducted by Madrzykowski and Vettori (1992a, 1992b).Based on the heat release rates measured in the open-plan office
fire tests, a heat release rate for a design fire for use in sprinkleredoffice buildings was developed. This design fire is consistentwith the suppression algorithm developed by Madrzykowskiand Vettori (1992a, 1992b) and the steady-state heat release rateused in the U.K. (Hansell and Morgan 1994) (see Figure 12). Theproposed design fire, in principle, assumes an initial fire involv-ing two shielded areas subsequently spreading to two secondaryshielded areas and thus could be considered a conservative chal-lenge for a light hazard sprinkler system in an office building.The proposed heat release rate curve, determined on this basis,is less conservative than the U.K. steady-state design fire but
Figure 11 Volume flow rate in duct—Test 31 (fan not running).
8/8/2019 Expected Size of Shielded Fires in Sprinkle Red Office
http://slidepdf.com/reader/full/expected-size-of-shielded-fires-in-sprinkle-red-office 17/18
ASHRAE Transactions: Symposia 409
more conservative than the suppression algorithm developed byMadrzykowski and Vettori.
3. Temperature and Pressure. The highest temperaturesin the test compartment were measured at or shortly after theactivation of the first sprinkler. The highest temperaturesmeasured at the ceiling in the immediate fire zone were up to325°C (617°F). Such temperatures could result in pressuresslightly higher than the 12.5 Pa generally required by standardsfor smoke control systems in office buildings. However, theduration for temperatures in excess of 200°C (392°F) waslimited to less than 60 seconds. As such, the 12.5 Pa minimumdesign pressure suggested by NFPA 92A (NFPA 1993) shouldbe adequate for zoned smoke control system design. In mostcases, a minimum design pressure of 7 Pa would be sufficient.
4. CO Concentrations. The CO levels (0.1% to 0.5%)measured in the test facility were generally higher than the long-term tenability limits. The CO concentrations remained rela-tively constant throughout the test, with the CO produced in the
latter stages of the test attributed to fires in the paper stock in theshielded areas. The initial CO production rate was consistentwith peak rates measured in furniture calorimeter tests for officechairs (Sundström 1995).
5. Smoke Levels and Smoke Movement. Smoke levels inexcess of the normally accepted tenability limits were measuredthroughout the test facility shortly after the first sprinkler acti-vated. With the exhaust fan operating, lower smoke obscurationwas measured in the exhaust duct than in the test facility. It wassuggested that the smoke entering the duct was diluted by freshair entering the test room through the ventilation openings.
Higher smoke levels were measured in the duct in test 31 whenthe fan was not operated. Also in this test, there was smoke flowthrough the duct during the test. These results indicate that theoperation of a sprinkler system is not sufficient to completelystop smoke flow through leakage areas in a smoke barrier.However, the potential impact of such smoke flow will dependon the smoke movement and dilution in the building outside of the fire zone. Computer studies similar to those conducted byWakamatsu (1968) and McGuire et al. (1970) would be requiredto determine the extent of the hazard of the smoke in a multistoryoffice building.
6. Opposed Airflow. The airflow through the ventilationopenings produced by the exhaust fan was sufficient to keep thesmoke produced by the sprinklered fires from leaking throughthe openings. However, this may be due, in part, to the effect of the exhaust system on temperatures at lower levels (Lougheedand Carpenter 1996). Based on temperatures measured in test 31and the equation for opposed airflow in NFPA 92B (NFPA
1995), airflow velocities of 0.5 to 1.0 m/s (1.64 to 3.28 ft/s) maybe required to keep the smoke from entering adjacent areas. Theresults are consistent with the recommendation by Mawhinneyand Tamura (1994) that small airflows between the area to beprotected and the fire zone were helpful in preventing the spreadof smoke.
ACKNOWLEDGMENTS
This research was carried out as a joint research projectsupported by the American Society of Heating, Refrigeratingand Air-Conditioning Engineers, Inc., and the National
Figure 12 Heat release rate for design fires.
8/8/2019 Expected Size of Shielded Fires in Sprinkle Red Office
http://slidepdf.com/reader/full/expected-size-of-shielded-fires-in-sprinkle-red-office 18/18
Research Council of Canada. Appreciation is extended to J.R.Mawhinney for his help in conducting the studies in phase 1 of the project and in setting up the sprinkler system for the full-scaletests. Appreciation is also extended to D.W. Carpenter, M.Wright, M. Ryan, R. Onno, P. Richardson, and P. Leroux, whowere instrumental in setting up the test facility, conducting thetests, and plotting the data.
REFERENCES
ASTM. 1994. Test method for fire testing of real scaleupholstered furniture items. E 1537. Philadelphia:American Society for Testing and Materials.
Babrauskas, V. 1979. Technical note 1103. Gaithersburg,Md.: National Institute of Standards and Technology.
Hansell, G.O., and H.P. Morgan. 1994. Design approachesfor smoke control in atrium buildings. BR 258. Bore-hamwood, U.K.: Building Research Establishment.
Huggett, C. 1980. Estimation of heat release by means of
oxygen consumption measurements. Fire and Materials4: 61.
Jin, T. 1981. Studies of emotional instability in smoke fromfire. Journal of Fire and Flammability 12: 130-142.
Klote, J.H. 1990. Fire experiments of zoned smoke control atthe Plaza Hotel in Washington, DC. NISTIR 90-4253.Gaithersburg, Md.: National Institute of Standards andTechnology.
Klote, J.H., and J.A. Milke. 1992. Design of smoke manage-ment systems . Atlanta: American Society of Heating,Refrigerating and Air-Conditioning Engineers, Inc.
Lougheed, G.D., and D.W. Carpenter. 1996. Probability of
occurrence and expected size of shielded fires in sprin-klered buildings—ASHRAE RP-838—Phase 2, Full-scale fire tests. Report A4201.10. Ottawa, Ont.:National Research Council Canada.
Lougheed, G.D., and J.R. Mawhinney. 1996. Probability of occurrence and expected size of shielded fires in sprin-klered buildings—ASHRAE RP-838—Phase 1. ReportA4201.5. Ottawa, Ont.: National Research Council Can-ada.
Madrzykowski, D., and R. Vettori. 1992a. A sprinkler firesuppression algorithm for the GSA engineering fireassessment system. NISTIR 4833. Gaithersburg, Md.:National Institute of Standards and Technology.
Madrzykowski, D., and R. Vettori. 1992b. A sprinkler firesuppression algorithm. J. of Fire Prot. Engr . 4: 151-164.
Mawhinney, J.R., and G.T. Tamura. 1994. The effect of automatic sprinkler protection on smoke control sys-tems. ASHRAE Transactions 100(1): 494-513.
Mawhinney, J.R., D.W. Carpenter, R.A. MacDonald, andG.T. Tamura. 1992. Experiments involving shielded,sprinklered fires in a building equipped with a zonedsmoke control system. Report CR-6470.7. Ottawa, Ont.:National Research Council Canada.
McGuire, J.H., G.T. Tamura, and A.G. Wilson. 1970. Fac-tors in controlling smoke in high buildings. In ASHRAE Symposium Bulletin SF-70-2, Fire Hazards in Build-ings , pp. 8-13. Atlanta: American Society of Heating,Refrigerating and Air-Conditioning Engineers, Inc.
Morgan, H.P., and G.O. Hansell. 1985. Fire sizes and sprin-kler effectiveness in offices—Implications for smokecontrol design. Fire Safety Journal 8: 187-198.
NFPA. 1993. NFPA 92A, Recommended practice for smoke-
control systems . Quincy, Mass.: National Fire Protec-tion Association.
NFPA. 1994. NFPA 13, Standard for the installation of sprinkler systems . Quincy, Mass.: National Fire Protec-tion Association.
NFPA. 1995. NFPA 92B, Guide for smoke management sys-tems in malls, atria, and large areas . Quincy, Mass.:National Fire Protection Association.
Purser, D. 1995. Toxicity assessment of combustion prod-ucts, The SFPE handbook of fire protection engineer-ing . Quincy, Mass.: National Fire ProtectionAssociation.
Rasbash, D.J. 1975. Sensitivity criteria for detectors used to
protect life. Fire International 5: 30.Sundström, B. 1995. Fire safety of upholstered furniture—
Final report on the CBUF research programme. London:Interscience Communications Limited.
Tamura, G.T. 1994. Smoke movement and control in high-rise office buildings . Quincy, Mass.: National Fire Pro-tection Association.
Wakamatsu, T. 1968. Calculation of smoke movement inbuildings. Research Paper Number 34. Tokyo: BuildingResearch Institute.
Walton, G. 1993. CONTAM93: User manual . NISTIR 5385.Gaithersburg, Md.: National Institute of Standards andTechnology.