Embed Size (px)
Citation preview
Expectations and the Post Transition
of Young Adults with an Autism Spectrum Disorder
to Post-Secondary Education
by
Catherine Fox
A Dissertation Presented in Partial Fulfillment of the Requirements for the Degree
Doctor of Philosophy
Approved April 2011 by the Graduate Supervisory Committee:
Kathleen McCoy, Chair
Sarup Mathur Morgan Olsen
ARIZONA STATE UNIVERSITY
May 2011
i
ABSTRACT
Over the past two decades, substantial research has documented the
increase of students with disabilities enrolling in post-secondary education. The
purpose of the study was to examine factors identified as significant in preparing
individuals who fall on the autism spectrum for post-secondary experiences. The
study was exploratory in nature and designed to identify perceived critical
program elements needed to design successful post-secondary transition programs
for students with an autism spectrum disorder (ASD). The study used archival
research and grounded theory to look at expectations of parents with young adults
with an ASD and young adults with an ASD on post-secondary transition and to
discern whether expectations impact the successful post transition of young
adults. More than likely, due to an overall increase in the prevalence of ASDs,
many more students with an ASD will be attending a post-secondary educational
setting in the near future. Understanding expectations and particular challenges
faced by students with an ASD will be necessary for colleges to meet the unique
needs of this population.
ii
DEDICATION
This dissertation is dedicated to my family. To my parents for their love,
support and encouragement throughout my life; to my son Adam, who is autistic,
passionate and apt to change the world; and to my son Jason, who is one of a kind
and makes a difference. May your eyes be open to the world, may you each be
motivated to reach for the stars and encouraged to pursue your dreams.
iii
ACKNOWLEDGMENTS
I want to thank my family and friends for their patience, support and
understanding during this long arduous journey. I owe my deepest gratitude and
appreciation to Dr. Kathleen McCoy for having faith in me taking me under her
wing by stepping in as advisor and committee chair at the tail end; I will be
forever grateful. I am thankful for the valuable advice and critique of committee
members Dr. Morgan Olsen and Dr. Sarup Mathur who also believed in me.
To my son Adam, who is autistic and sparked my interest and now my
passion in the research problem and inspired the course of my dissertation’s work.
A very special acknowledgement of gratitude and love go to my sons and soon to
be husband for their patience, understanding and support.
A very special thank you to my very good long time friend, Nicholas
Toronto for his persistence, encouragement and use of office space in which to
write. Thank you for being a sounding board, technical advisor, editor and always
willing to help and give suggestions.

iv
TABLE OF CONTENTS
Page
LIST OF TABLES ..................................................................................................... vii
LIST OF FIGURES .................................................................................................. viii
CHAPTER
1 INTRODUCTION ................................................................................ 1
Problem Statement/Issue .................................................................... 3
2 LITERATURE REVIEW ..................................................................... 5
Background Information .................................................................... 5
Autism spectrum disorder ...................................................... 5
Legislation .............................................................................. 6
Review .................................................................................... 8
Research Questions ............................................................................. 8
Purpose of Study ................................................................................. 9
Limitations ........................................................................................ 10
Conceptual Frameworks ................................................................... 11
Family systems theory.......................................................... 11
Ecological systems theory .................................................... 13
Consciousness competence theory ...................................... 19
Expectancy theory ................................................................ 21
Self efficacy .......................................................................... 23
Self-determination ................................................................ 26
Summary ............................................................................... 28
v
Page
3 METHODOLOGY ............................................................................. 30
Research Design and Theoretical Framework ................................. 30
Evaluation Methods .......................................................................... 31
Participants ........................................................................... 31
Surveys ................................................................................. 32
Procedures ............................................................................ 33
Theory and Needs Assessment ......................................................... 33
4 DATA COLLECTION AND ANALYSIS ........................................ 37
Data Collection ................................................................................. 37
Data Analysis and Discussion .......................................................... 39
Demographics ....................................................................... 48
Survey responses .................................................................. 56
Programmatic needs assessment .......................................... 59
Expectations ......................................................................... 65
Discussion ............................................................................. 66
New Theory – Adam’s Web ............................................................. 70
Educational Implications .................................................................. 72
Educational implications for practice/training .................... 72
Educational implications for legislation .............................. 74
Educational implications for strategic leadership ............... 76
Educational implications for resources and cost ................. 79
Other educational implications ............................................ 79

vi
Page
Limitations ........................................................................................ 80
Future Research ................................................................................ 81
5 CONCLUSIONS AND RECOMMENDATIONS ............................ 85
REFERENCES ........................................................................................................ 88
APPENDIX
A. COPYRIGHT PERMISSION .............................................................. 103
B. DEMOGRAPHICS – YOUNG ADULT DETAIL ........................... 106
C. DEMOGRAPHICS – YOUNG ADULT DETAIL SUMMARY ...... 108
D. DEMOGRAPHICS – PARENT DETAIL .......................................... 110
E. DEMOGRAPHICS – PARENT DETAIL SUMMARY .................... 112
F. YOUNG ADULT DEMOGRAPHICS – DESCRIPTIVE STATISTICS
SUMMARY ......................................................................................... 114
G. PARENT DEMOGRAPHICS – DESCRIPTIVE STATISTICS
SUMMARY ......................................................................................... 116
H. SURVEY QUESTIONS – RESPONSES/CORRELATION ............ 118
I. SURVEY QUESTIONS–RESPONSES/STATS SUMMARY ......... 122
J. SURVEY QUESTIONS – RESPONSES/CONF INTERVAL ........ 126
K. SURVEY QUESTIONS ...................................................................... 130
L. PROGRAMMATIC NEEDS ASSESSMENT – CORRELATION
STATISTICS ........................................................................................ 134
M. PROGRAMMATIC NEEDS ASSESSMENT – PEARSON’S
ANALYSIS ........................................................................................... 137
vii
LIST OF TABLES
Table Page
1. Demographics of Survey Participants ................................................... 49
2. Programmatic Needs Assessment – Critical Program Elements .......... 61
3. Mean Scores and Skewness of Program Elements Perceived Not Critical
................................................................................................................. 62
4. Program Components that Determine Suitability for Post-Secondary
Programs ................................................................................................. 64
5. Pearson’s Test ........................................................................................ 69
viii
LIST OF FIGURES
Figure Page
1. Family Systems Theory ...................................................................... 12
2. Bronfenbrenner’s Ecological Systems Theory .................................... 16
3. Conscious-Competence Model ........................................................... 21
4. Development through Self-Determination .......................................... 27
5. Skewness and Kurtosis ........................................................................ 42
6. Adam’s Web ......................................................................................... 71

1
Chapter 1
INTRODUCTION
The number of individuals diagnosed with autism is double the rate of a
decade ago (Fischbach, 2011). In the early 1990’s the incidence of autism was
one in 10,000; in 2000, prevalence averaged six in 1,000 (Centers for Disease
Control and Prevention [CDC], 2009). This alarming rise in diagnoses has now
given autism the undesired ranking as the most prevalent childhood
developmental disorder in the U.S. for which no known cause or cure has been
established (Agnello, 2010). Since first being described by Leo Kanner in 1943,
the CDC began collecting data on autism spectrum disorders (ASDs) in 1996 and
then only in selected areas in the United States since 2000. The incidence of
ASDs has also exploded in the past decade with the latest studies revealing that
approximately one in 100 children are affected by an ASD (CDC, 2009; Wright,
2010 ), including one in 70 boys.
Among those completing high school, students with disabilities are less
likely to enroll in post-secondary education than their peers without disabilities.
Research has shown that most students with a disability are leaving secondary
environments lacking preparedness for post-secondary education and are less
likely to complete a full secondary school academic curriculum (National Center
for Education Statistics [NCES] 1996, 2000; National Council on Disability
[NCD], 2003; Ponticelli, 2009). Over the past two decades, however, substantial
research has documented the increase of students with disabilities enrolling in
post-secondary education and namely, community colleges (Mull, Sitlington, &
2
Alper, 2001; NCES, 1996, 2000; Nuebert, Moon & Grigal, 2004; Ponticelli,
2009). More than likely, due to an overall increase in the prevalence of ASDs,
many more students with an ASD will be attending a post-secondary educational
setting in the near future (Adreon & Durocher, 2007, CDC, 2005). Understanding
the disorder and the particular challenges faced by students with an ASD will be
necessary for colleges to meet the unique needs of this population.
The purpose of this study is to examine factors identified as significant in
preparing individuals who fall on the autism spectrum for post-secondary
experiences. This study is exploratory in nature and designed to identify
perceived critical program elements to be included in designing successful post-
secondary transition programs for students with an autism spectrum disorder
(ASD) and to be done in an effort so that post-secondary institutions can better
accommodate and serve what is a growing influx of students from this population.
This study is to be a means to discern and generate theory regarding expectations
of parents with young adults with an ASD and young adults with an ASD on post-
secondary transition and whether their expectations align with each other. The
study also looks at expectations of both groups to discern whether expectations
impact the successful post transition of young adults.
Research shows that when the influential people in a child’s life do not
believe that he or she has the potential to achieve an outcome, the outcome is not
likely to be realized (Donahue, 2000; Ivey, 2004). This study compares and
contrasts what parents and young adults believe are necessary elements in
designing post-secondary programs that would be successful for their transition
3
and whether evidentiary support or theory that supports such conclusions exist.
The nature of self efficacy and unconscious incompetence are showcased and the
concept of self-determined behavior that students with disabilities may need to
exercise if they are to realize a successful post-secondary experience is examined.
Additionally, this study will enlighten policy and practice for educational leaders
and add to the body of research in the area of disability and post-secondary
education.
Problem Statement/Issue
Post-secondary transition is not only difficult for adolescents on the autism
spectrum, but is also extremely stressful for parents and caregivers. Worries
about what the future holds for their child with an ASD often burden parents, who
are frequently life-long primary advocates for individuals on the spectrum and
often the main financial resource (Hubert, 2009; Baskin, 2008; Volkmar &
Weisner, 2009; Hendricks, 2009).
Despite legislation, civil rights advocacy, monumental expenditure of state
and federal dollars, advanced technology and disability rights policy, students
with disabilities in general and ASD in particular, attempting post-secondary
education do not successfully complete their educational goals at the same rate as
students without disabilities and as such are typically not succeeding in their
education. Such knowledge is disconcerting given that research shows the
improved employment status for students with disabilities who have completed a
college education increases more sharply than for those without disability (NCD,

4
2003; NCES, 1996, 2000; Ponticelli, 2009). The dropout rate of individuals who
have disabilities at the post-secondary level is a growing national crisis that calls
out for system change (Disability, 2003). As Ponticelli (2009) points out, a step
in this direction is to have quality research that can inform decision makers how
best to serve and promote students with disabilities in their academic institutions.
Previous research provides a small window of insight, but extensive research is
still lacking to inform practitioners about what appears to be effective versus
ineffective policy and practice.
Attempting to understand key relationships affecting the academic
performance of students with disabilities makes this study particularly timely and
answers the first question, “What critical program elements are perceived to be
necessary to develop successful post-secondary transition programs for students
with an autism spectrum disorder (ASD)?” The program elements identified and
program components that influence the decision making process for both parents
and students with an ASD will aid in the planning and development of post-
secondary programs that are successful for the post transition of students with an
ASD. The second question in this study pertains to the expectations of parents
and young adults and asks, “How do the expectations of either the parents or
young adult impact the successful post-secondary transition of a young adult with
an autism spectrum disorder?” This study is also a means to discern and generate
theory regarding expectations of parents with young adults with an ASD and
young adults with an ASD on post-secondary transition and whether their
expectations align with each other.
5
Chapter 2
LITERATURE REVIEW
Background Information
Autism spectrum disorders
The term autism spectrum disorder (ASD) refers to a group of
neurodevelopment disorders that affect development in the areas of social
interaction, communication, and behavior (Adreon et al., 2007). ASD includes
diagnoses of autism, Asperger’s Syndrome (AS) and pervasive development
disorder not otherwise specified (PDD_NOS). Individuals with an ASD appear to
process information in their brain differently than neurotypical people, and might
have unusual ways of learning, paying attention, and reacting to different
sensations (CDC, 2006) As the word spectrum implies, ASD affects each
individual differently and to varying degrees of severity. Because symptoms fall
along a spectrum or continuum, symptoms can occur in any combination and can
range from very mild to severe and differ significantly in their overall language
and cognitive abilities.
Diagnostic criteria for AS and autistic disorder are identical with respect
to symptoms of social impairment and restricted and repetitive behaviors,
however, students with AS do not demonstrate delay in the development of
spoken language or in their cognitive development. The ability to reliably
differentiate the diagnostic distinction among these specific forms of ASDs is
unclear and considered controversial (Adreon et al., 2007; Klin & Volkmar, 1995;
6
Macintosh & Dissanayake, 2004). For purposes of this research, the study
combines and summarizes those who have an ASD to include those identified as
autistic, with AS, and PDD_NOS and meant to apply to individuals who fall
within the high functioning end of the autism spectrum. Although people of all
ages are diagnosed with an ASD, this study is only concerned with young adults
who have been diagnosed with an ASD and parents of young adults with an ASD.
Legislation
The Americans with Disabilities Act (ADA) of 1990, as amended and
Section 504 of the Rehabilitation Act of 1973 are major federal legislative acts
that are designed to protect the civil rights of individuals with disabilities and
have begun to have a major impact on schools across the United States (ADA,
2008). Section 504 of the Rehabilitation Act (Smith, 2001) created and extended
civil rights to people with disabilities, prohibits discrimination on the basis of
disability and applies to entities that receive federal funds. The ADA applies to
virtually every entity except churches and private clubs.
At the secondary level, the reauthorization of the Individuals with
Disabilities Education Act (IDEA) in 2004 mandates the provision of assistance
for students with disabilities which is available in middle school and high school.
IDEA applies to the public school system and is usually geared around services.
IDEA no longer protects these students once they graduate or leave the school
system or if they become ineligible at age 22. Services that were being provided
in high school will not automatically carry over to the post-secondary setting
(IDEA, 2004).

7
At the post-secondary level, the American with Disabilities Act (ADA,
1990) and Section 504 of the Rehabilitation Act (504, 1973) are the primary
mandates for the provision of assistance, usually in the form of accommodations
and services (Graetz & Spaminato, 2008). The American Disabilities Act of 1990
and Section 504 of the Rehabilitation Act of 1973 are intended to prevent any
form of discrimination against individuals with disabilities and ensure that
persons cannot be discriminated against in obtaining higher education simply
based on their disability. Any university or college receiving federal support is
required to provide services for individuals with disabilities. Most personnel in
college or university offices of disability support may not understand the
complexities of the ASD diagnosis and although the academic supports may
provide some assistance, the greater issues of social and emotional well-being and
coping with feelings of fear, anxiety and excessive stress may go unaddressed,
especially for those with an ASD (Graetz et al, 2008).
Previous research showed that young adults with disabilities were
experiencing poor post school integration, high dropout rates, high
unemployment, low rates of post-secondary education, and low quality
independent living and community participation outcomes (Blackorby & Wagner,
1996; Chadsey-Rusch, Rusch, & O’Reilly, 1991; Edgar, 1987; Haring, Lovett, &
Smith, 1990; Hasazi, Gordon, & Roe, 1985; Retish, 1989; Roessler, Brolin, &
Johnson, 1990; Scuccimarra & Speece, 1990). In turn, the research resulted in
IDEA initiating the requirement that public schools develop a transition plan for
students with individual education programs (IEPs) aged 16 or older (IDEA,
8
1990). Far less is known about the transition process for individuals with an ASD
therefore, educational professionals are faced with a distinct disadvantage in their
efforts to address the needs of this particular population.
Review
The research project uses archival data that was compiled using both
qualitative and quantitative research methods and analyzes data gathered from
survey based instruments. For purposes of the study that was implemented by
Hanish et al. (2010) and the subsequent archival data that was used for this
research, two survey instruments were used; one for parent/caregiver and one for
young adults. Participants were selected from across the greater Phoenix
metropolitan area.
One of the findings of the original study was that the majority of research
concluded that current transition programs were not sufficient enough to meet the
present and future needs of the autistic population. Effective post-secondary
transition programs would need to identify and address the complex needs of this
growing population (Hanish et al., 2010).
Research Questions
Two research questions guide this study. The second question is the primary
question that guides this research.
1. What critical program elements are perceived to be necessary to develop
successful post-secondary transition programs for students with an autism
spectrum disorder (ASD)?
9
2. How do the expectations of either the parents or young adult impact the
successful post transition of a young adult with an autism spectrum
disorder?
Purpose of Study
The purpose of this study is to identify what specific elements are
perceived to be necessary to develop successful post-secondary transition
programs for students with an autism spectrum disorder (ASD). This study
compares and contrasts the beliefs of parents of young adults with an ASD and
young adults with an ASD report are necessary elements in designing post-
secondary programs that would be successful for their transition and whether
evidentiary support or theory exists that supports such conclusions. The study
looks at the expectations of parents and the young adults in an attempt to discern
through theory whether expectations impact the successful post transition of
young adults. The concepts of self efficacy and self-determined behavior are
discussed and examined to determine the requisite need for students with an ASD
to exercise if they are to realize a successful post-secondary experience.
An outcome of this study is to create a needs assessment based on archival
research and existing data that was gathered by Hanish et al., (2010). A
fundamental step in developing effective post-secondary programs for the
successful transition of students with ASD is to examine what parents, caregivers
and young adults believe are the critical program elements of such programs for
this population. Parents are typically the caregivers and often have the means and
10
ethical responsibility for continued support of their adult children with an ASD,
therefore, their voice should be included.
The research questions explore and identify critical program elements
perceived to be necessary for successful post-secondary transition programs for
students with an ASD.
An additional function of this research is to discern and generate theory
regarding alignment of expectations related to post-secondary transition with
those of young adults with an ASD and parents of adolescents and young adults
who fall on the autism spectrum.
Limitations
One of the limitations of this study is that the researcher had no control
over how data was collected as archival data was used. Evidence of reliability and
evidence of validity are assumed as written. Although safeguards for the
collection and integrity of the data appeared to be in place, some data elements
were missing from some of the records, but these were fields not used in the
present study. The type of demographic information collected and other questions
asked, limited the ability to determine if the archival data can support and give
credence in identifying whether various levels of the ecological systems in theory
actually existed. If so, at what level and at what point did the levels break down?
Another limitation was that the population sample was small so that
generalizations to larger populations may prove to be limited. In addition, the
11
geographical span of the survey was limited to the greater Phoenix metropolitan
area.
Conceptual Frameworks
In an effort to better understand child, parent and family functioning and
influence, the conceptual frameworks and theories that contribute to the
understanding of how expectations of parents, families and children develop and
impact decisions and outcomes is examined. The conceptual frameworks being
reviewed in this study include: family systems theory, ecological systems theory,
expectancy theory and the theory of consciousness and competence. In addition,
the behavior theories of self-efficacy and self-determination are discussed. All of
the theories presented both challenge and support the idea that by changing or
influencing how an individual learns behaviors, especially in the early stages of
mental development, can have a large impact on their mental processes in later
stages of development and at later stages in their lives. Brief descriptions of these
conceptual frameworks/theories follow.
Family Systems Theory
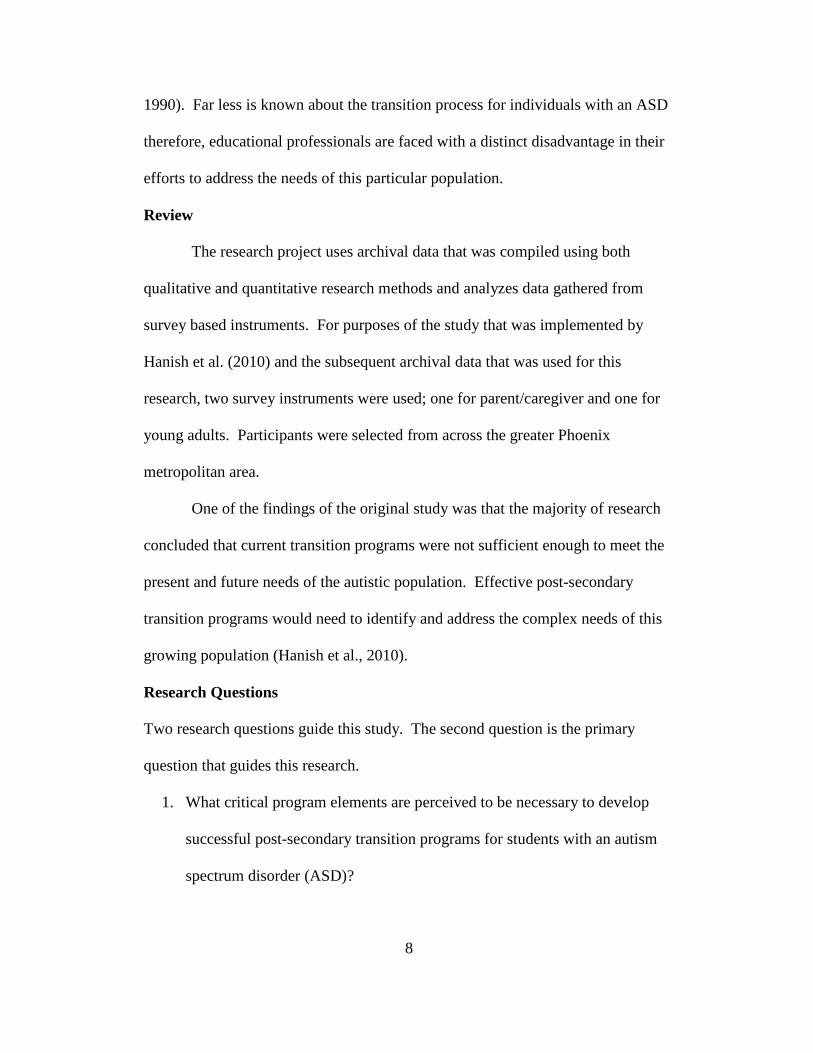
Family systems theory consists of eight stages and recognizes that the
family is a system and that actions affecting any one member affect all of the
members (Minuchin, 1974; Wehman, 1998). A family systems perspective
examines the individual structure, roles, values, beliefs, stresses, coping
strategies, resources, and social networks of each family (Guralnick & Bennett,
1987; Wehman, 1998). Figure 1 identifies the eight stages of the family life cycle

12
represented by family systems theory. Primary importance is put on the
interactional nature of the family unit. The family is seen as consisting of a series
of subsystems whose roles change over the life cycle the family (McGoldrick &
Carter, 1980; Wehman, 1998).
Figure 1. Family Systems Theory
FAMILY SYSTEMS THEORY
Stages of the Family Life Cycle
• Stage 1: Married Couples o (without children)
• Stage 2: Childbearing Families
o (oldest child, birth-30 months)
• Stage 3: Families with Pre-School Children o (oldest child, 2 1/2-6years)
• Stage 4: Families with School Children
o (oldest child, 6-13 years)
• Stage 5: Families with Teenagers o (oldest child, 13-20 years)
• Stage 6: Families Launching Young Adults
o (first child gone to last child leaving home)
• Stage 7: Middle-age Parents o (“empty nest” to retirement)
• Stage 8: Aging Family Members
o (retirement to death of both spouses)
Family Systems Theory. (1977) Retrieved from http://www.csun.edu/~whw2380/542/Family%20Developmental%20Theory.htm
13
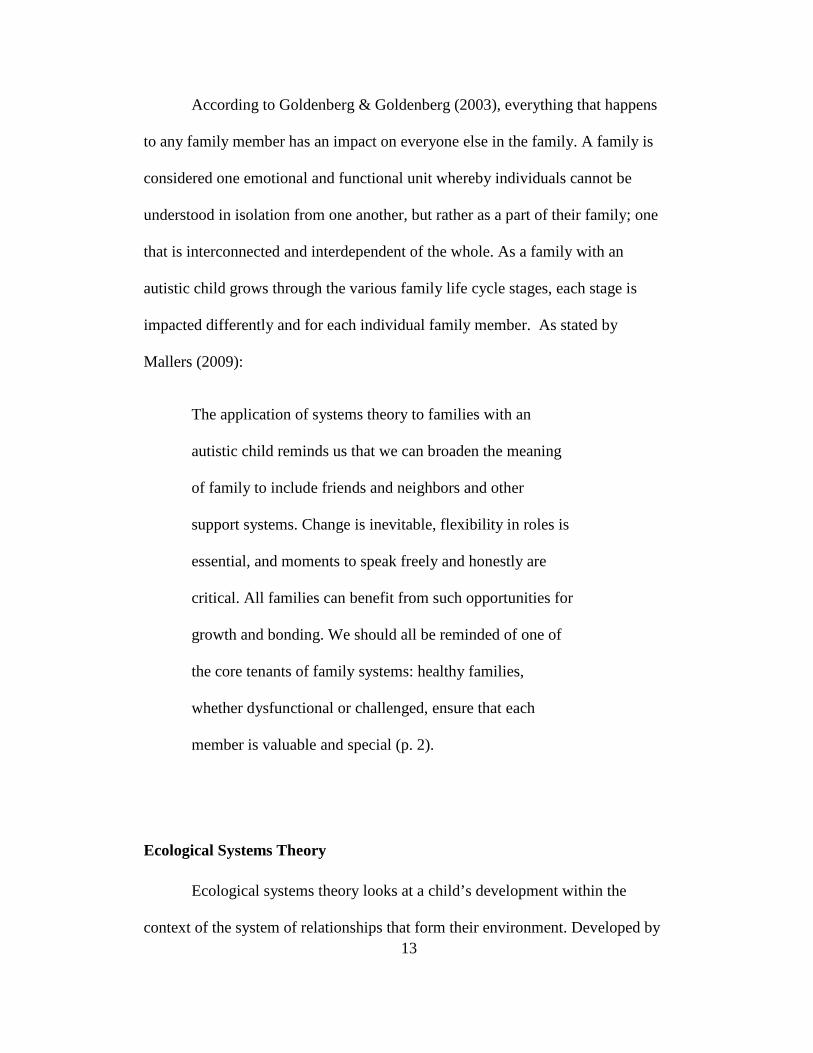
According to Goldenberg & Goldenberg (2003), everything that happens
to any family member has an impact on everyone else in the family. A family is
considered one emotional and functional unit whereby individuals cannot be
understood in isolation from one another, but rather as a part of their family; one
that is interconnected and interdependent of the whole. As a family with an
autistic child grows through the various family life cycle stages, each stage is
impacted differently and for each individual family member. As stated by
Mallers (2009):
The application of systems theory to families with an
autistic child reminds us that we can broaden the meaning
of family to include friends and neighbors and other
support systems. Change is inevitable, flexibility in roles is
essential, and moments to speak freely and honestly are
critical. All families can benefit from such opportunities for
growth and bonding. We should all be reminded of one of
the core tenants of family systems: healthy families,
whether dysfunctional or challenged, ensure that each
member is valuable and special (p. 2).
Ecological Systems Theory
Ecological systems theory looks at a child’s development within the
context of the system of relationships that form their environment. Developed by
14
Bronfenbrenner (1979) (co-founder of Head Start), this theory defines complex
“layers” of environment, each having an effect on a child’s development, and
emphasizes that a child’s own biology is a primary environment fueling their
development. The interaction between factors in the child’s maturing biology,
their immediate family/community environment, and the societal landscape fuels
and steers their development. Changes or conflict in any one layer will ripple
throughout other layers (Paquette & Ryan, 2001).
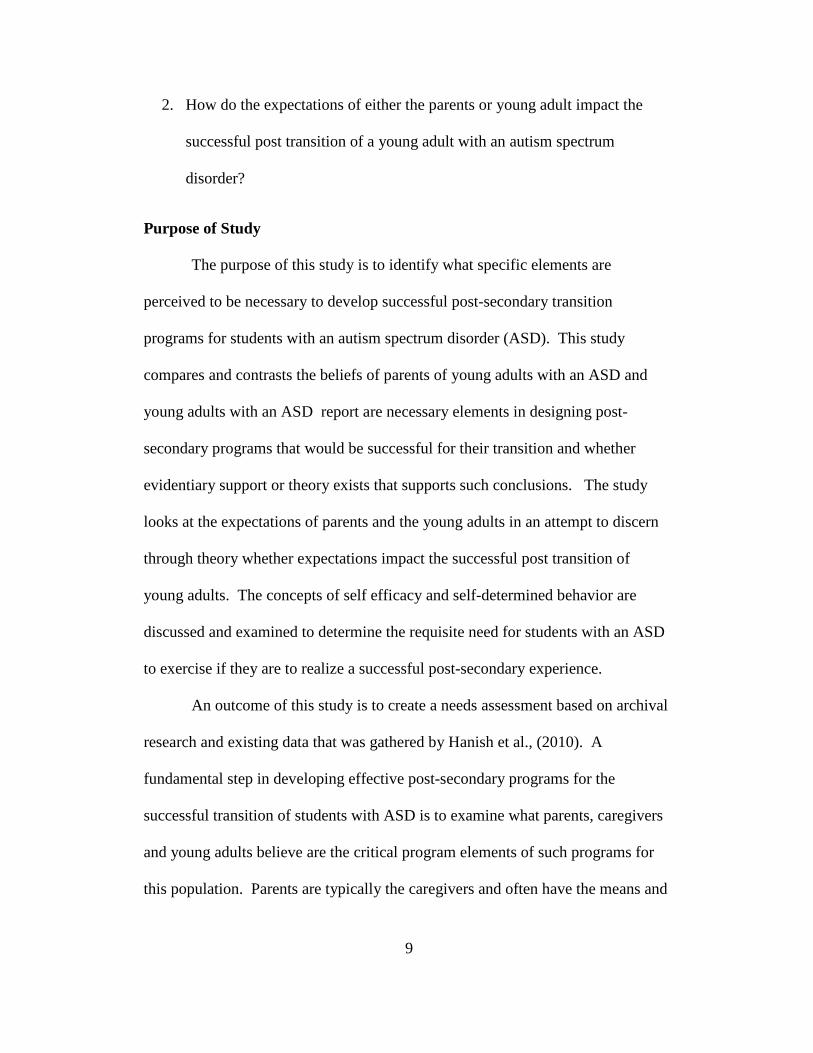
The human ecology model of human development (Bronfenbrenner, 1979)
proposed that four sources or layers of influences impact a child’s development:
microsystem, mesosystem, exosystem, and the macrosystem. The microsystem is
the level where interactions and influences are within immediate settings and
include the child’s immediate relationships with family members, caregivers and
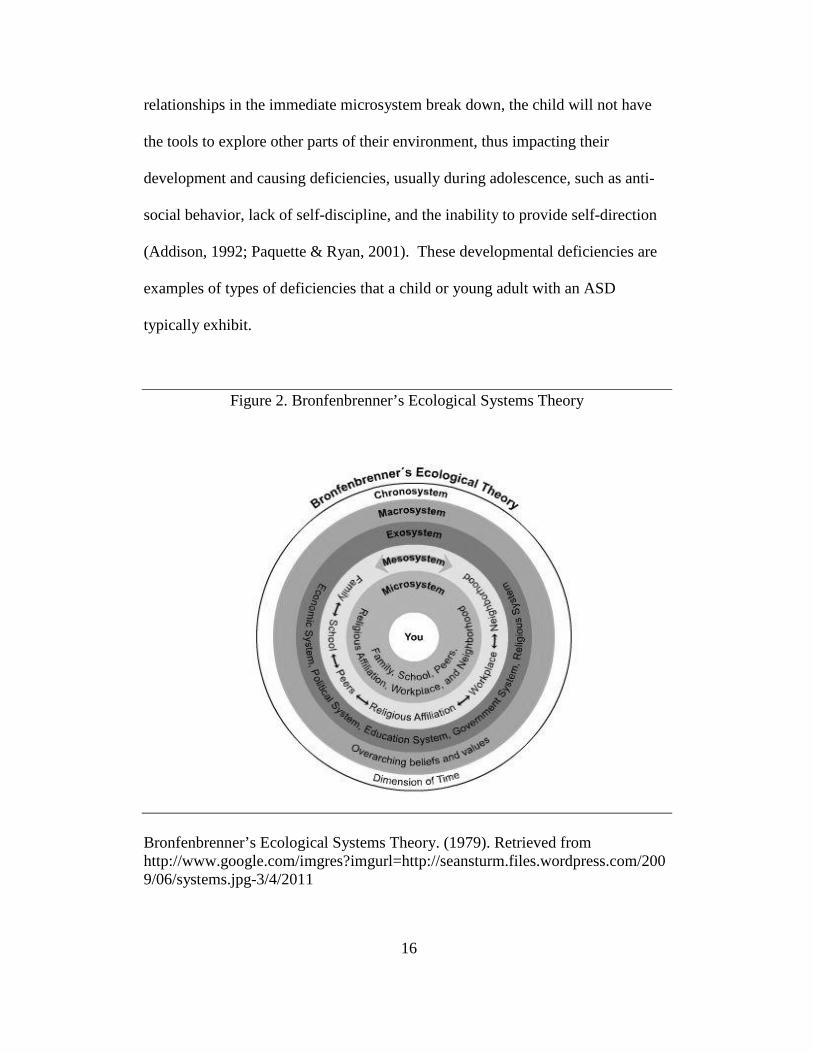
school. Figure 2 contains a picture of Bronfenbrenner’s Ecological Systems
Theory model (1979). The influences are bi-directional in that not only do the
parents affect the child’s beliefs and behaviors, but the child also impacts the
behavior and beliefs of the parent. At this level, influences are strongest and have
the greatest impact on the child (Berk, 2000; Paquette & Ryan, 2001). As
Dombeck (2005) suggests, the interactions of these groups will strongly influence
how the child develops (Barclift, 2010).
Mesosystem is the layer that provides the connection between the
structures of the child’s microsystem and is the interactions and influences among
major settings which is inclusive of the microsystem parts and how they work
together. An example of this is parent involvement with the school teacher. If the
15
parent actively participates in communication with the teacher and school, the
overall growth of the child is impacted (Berk, 2000; Paquette & Ryan, 2001).
Exosystem defines the formal and informal social structures that affect
the child and includes other places and people that the child may or may not
interact with. Exosystem defines the larger social system in which the child does
not function directly but impacts the child’s development by interacting with
some structure in their microsystem. An exosystem would include, for example,
extended family members, peers, neighbors, church members, community based
resources and parent workplace. The child may not be directly involved at this
level, but does feel the positive or negative force involved in their system (Berk,
2000; Paquette &Ryan, 2001).
The final level is the macrosystem which is the layer considered to be the
outermost layer in the child’s development (Berk, 2000; Paquette & Ryan, 2001).
The macrosystem is where the ideological patterns of the various cultures in
which the child functions exist. The macrosystem is comprised of customs, laws
and cultural values and is influenced by the economy, government and culture.
Each system contains roles, norms and rules that shape an individual’s
development (Barclift, 2010; Berk, 2000; Brofenbrenner, 1996; Paquette & Ryan
2001).
Bronfenbrenner’s ecological systems theory (1979) focuses on the quality
and context of the child’s environment. He states that as a child develops and
their physical and cognitive structures grow and mature, the interaction within
these environments becomes more complex. According to his theory, if the
16
relationships in the immediate microsystem break down, the child will not have
the tools to explore other parts of their environment, thus impacting their
development and causing deficiencies, usually during adolescence, such as anti-
social behavior, lack of self-discipline, and the inability to provide self-direction
(Addison, 1992; Paquette & Ryan, 2001). These developmental deficiencies are
examples of types of deficiencies that a child or young adult with an ASD
typically exhibit.
Figure 2. Bronfenbrenner’s Ecological Systems Theory
Bronfenbrenner’s Ecological Systems Theory. (1979). Retrieved from http://www.google.com/imgres?imgurl=http://seansturm.files.wordpress.com/2009/06/systems.jpg-3/4/2011
17
To study a child’s development, the child and their immediate
environment must be considered, and the interaction of the larger environment
must be looked at. Raising a child takes cooperation and involvement from
educators, parents, families and the community. Although research has
demonstrated that parent involvement is an important influence on a child’s
success (LaBahn, 1995), a significant increase in the number of children raised for
some period of their childhood in less than ideal conditions has been reported. At
least one in five children in the U.S. lives in a family with an income below
poverty level, at least one-fourth of children live with one parent and more and
more mothers are working outside the home, meaning that many parents cannot
be as involved in their child’s life as they should be (Edwards & Young, 1992).
Research shows that the cost to raise and support an individual with
autism is substantial. Without the help of direct or indirect supports, families are
left to bare the fiscal responsibility thus impacting every aspect of family living
and their environment. Often these challenges have the potential to strain the
marriage, the family and the overall well being and functionality of the family
(Edwards & Young, 1992). When a family lives with an individual with a
disorder such as ASD, the disorder usually magnifies stress associated with daily
tasks and extends timeframes of parenting responsibilities again impacting every
aspect of family living and the environment. Many times, parents and the young
adults are found to be angry, fearful and frustrated simply due to a lack of
knowledge and understanding of the disorder or ability to obtain information
which, in turn can impact the emotional state of the parent, the individual and the
18
environment in which they all live (Edwards & Young, 1992). ASDs provide
unique opportunities for parents and individuals with an ASD to develop
unrealistic expectations that can in turn impact future outcomes. Understanding
how the impact of environments and environmental issues facilitate in
establishing the emotional well being of the family and give rise to the
development of realistic expectations that can effect transition and post-secondary
opportunities. Bronfenbrenner’s theory (1979) highlights the notion that a child’s
development is influenced and shaped by their environments which include parent
involvement and influence and discusses the impact when the relationships in the
immediate microsystem breaks down.
The ecological systems theory perspective complements a family systems
focus by including the community as an integral context in which a family
functions and can be used in part as a conceptual framework for the research
questions identified in this study (Weissbourd & Patrick, 1988; Wehman, 1998).
Communities that support families and individuals with autism can include:
community based resources, church communities, and places of worship, social
networks, social workers, therapists, support groups, practitioners, physicians,
neighbors, schools and educators. Families and individuals with autism typically
encounter a high number of “interventionists” more frequently than those families
and individuals without autism. Community supports can be are usually are a
very integral part of the functionality of a family living with autism as it takes
cooperation and involvement from educators, parents, families and the
community to raise a child with autism.
19
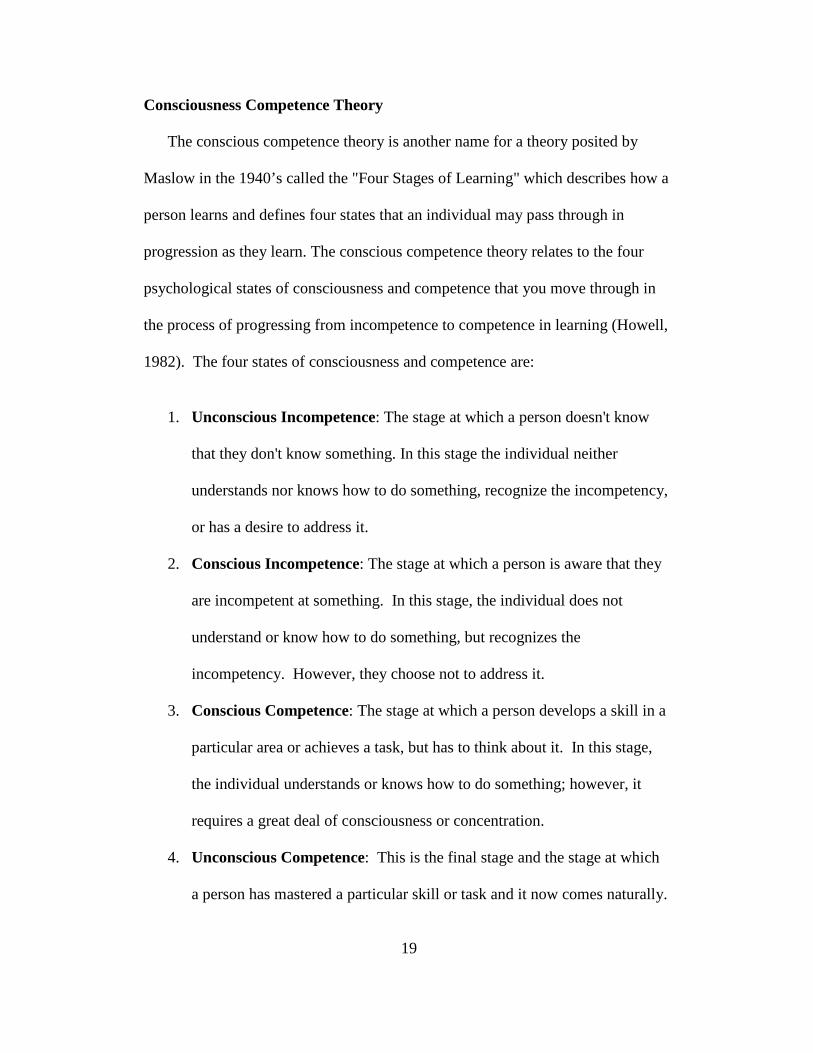
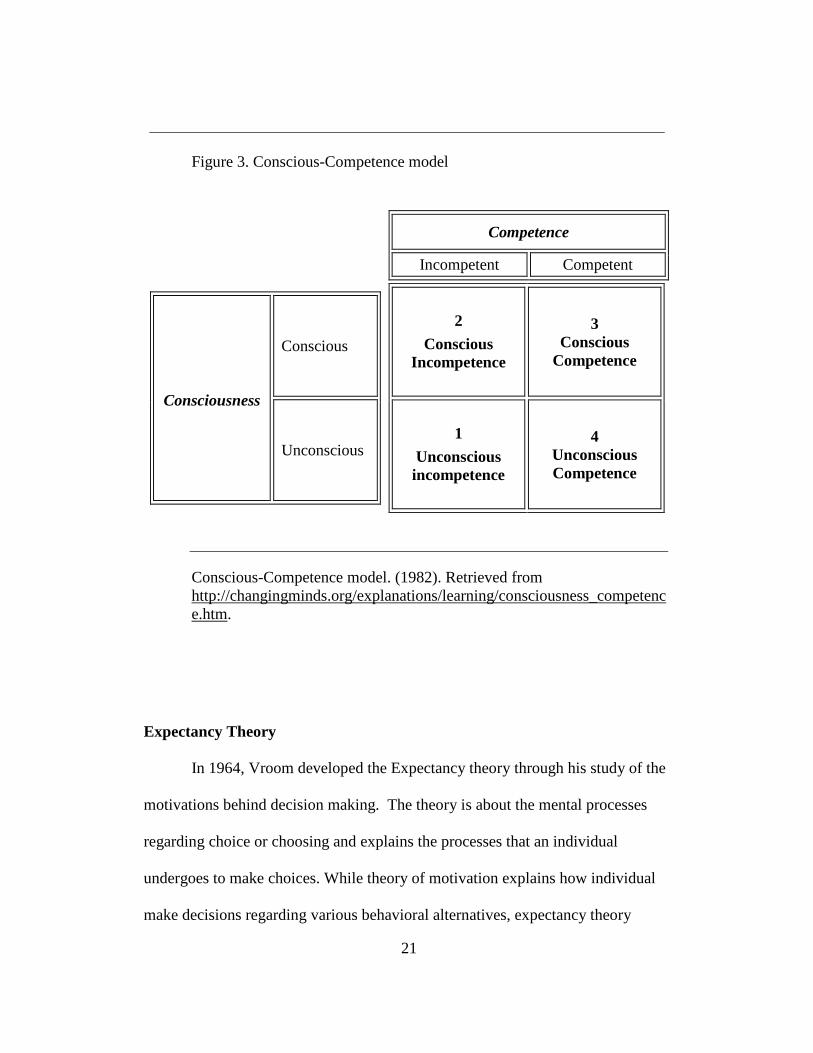
Consciousness Competence Theory
The conscious competence theory is another name for a theory posited by
Maslow in the 1940’s called the "Four Stages of Learning" which describes how a
person learns and defines four states that an individual may pass through in
progression as they learn. The conscious competence theory relates to the four
psychological states of consciousness and competence that you move through in
the process of progressing from incompetence to competence in learning (Howell,
1982). The four states of consciousness and competence are:
1. Unconscious Incompetence: The stage at which a person doesn't know
that they don't know something. In this stage the individual neither
understands nor knows how to do something, recognize the incompetency,
or has a desire to address it.
2. Conscious Incompetence: The stage at which a person is aware that they
are incompetent at something. In this stage, the individual does not
understand or know how to do something, but recognizes the
incompetency. However, they choose not to address it.
3. Conscious Competence: The stage at which a person develops a skill in a
particular area or achieves a task, but has to think about it. In this stage,
the individual understands or knows how to do something; however, it
requires a great deal of consciousness or concentration.
4. Unconscious Competence: This is the final stage and the stage at which
a person has mastered a particular skill or task and it now comes naturally.
20
In this stage the individual has had so much practice with a particular skill
that it becomes "second nature" and can be performed easily with minimal
concentration. Dependent upon how and when it was learned, the
individual may or may not be able to teach it to others (Howell, 1982).
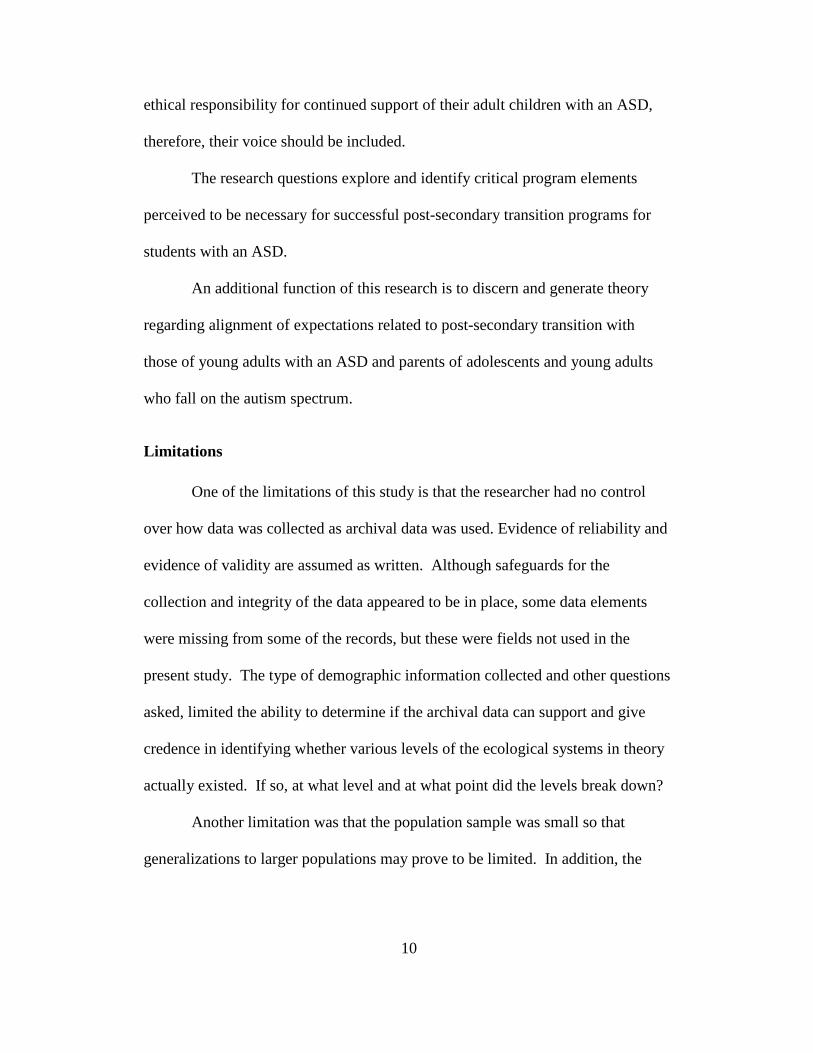
Figure 3 depicts the four stages of the conscious-competence model.
Research has proven that many individuals with a disability in a secondary
environment are not equipped to transition to post-secondary programs (NCD,
2003; Ponticelli, 2009). Individuals may be in the state of unconscious
incompetence and therefore unaware of what they don’t know. Individuals may
believe that they are prepared and equipped with the skill base necessary to
succeed, but are unaware of the supports that have been provided throughout their
high school curriculum and regimen. Conscious-Competence theory provides a
framework of how an individual might choose certain critical program elements
over others that are necessary for transition and could explain negative
correlations that exist. The Conscious–Competence theory illustrates that the
stage or state, of where the young adult with an ASD is located on the model,
could impact some or many of the outcomes of the choices or expectations that
the individual makes.
21
Figure 3. Conscious-Competence model
Competence
Incompetent Competent
Consciousness
Conscious
Unconscious
2
Conscious Incompetence
3 Conscious
Competence
1
Unconscious incompetence
4 Unconscious Competence
Conscious-Competence model. (1982). Retrieved from http://changingminds.org/explanations/learning/consciousness_competence.htm.
Expectancy Theory
In 1964, Vroom developed the Expectancy theory through his study of the
motivations behind decision making. The theory is about the mental processes
regarding choice or choosing and explains the processes that an individual
undergoes to make choices. While theory of motivation explains how individual
make decisions regarding various behavioral alternatives, expectancy theory
22
proposes that individuals will decide to behave or act in a certain way because
they are motivated to select a specific behavior over other behaviors due to what
they expect the result of that selected behavior to be. In essence, the motivation
of the behavior selection is determined by the desirability of the outcome.
Motivation is the driving force which helps us to achieve goals and comes
from two sources: oneself, and other people; intrinsic motivation and extrinsic
motivation, respectively. If a reward, tangible or intangible, is the motivation for
an outcome, and is presented after the occurrence of an action (i.e. behavior) with
the intent to cause the behavior to occur again, the person receiving the reward
immediately is more likely to repeat the behavior and less likely as duration of the
receipt of the reward. However, repetitive action-reward combination can cause
the action to become habit or expected. For an individual with an ASD who tends
to learn through repetitive behavior, applying proper motivational techniques can
be much harder than it seems. Kerr (1995) notes that when creating a reward
system, providing rewards to A can be easy, while hoping for B, and in the
process, reap harmful effects that can jeopardize goals.
At the core of the Expectancy theory is the cognitive process of how an
individual processes the different motivational elements (Condrey, 2005). Vroom
(1964) defines motivation as a process governing choices among alternative forms
of voluntary activities, a process controlled by the individual (Condrey, 2005).
The motivational force for a behavior is a function of three distinct perceptions:
expectancy (E), instrumentality (I) and valance (V). The motivational force is the
product of the three factors:
23
MF = E x I x V
When deciding among behavioral options, individuals select the option
with the greatest motivational forces. The expectancy (E) factor is the expectancy
that one’s effort will lead to the desired performance and is based on past
experience, self-confidence, and perceived difficulty of the performance goal
(2010). The instrumentality (I) factor is the belief that if one does meet
performance expectations, they will receive a greater reward. Valance (V) refers
to the value the individual personally places on the rewards and is a function of
their own values, needs, and goals. If any one of these values is zero, the whole
equation becomes zero.
Vroom’s (1964) theory has been relevant to the study of management and
can be correlated to the importance in understanding what motivates students with
disabilities and why they may behave in a certain way (self-efficacy). Expectancy
theory is an approach to understanding a person’s expectations of specific
outcomes, and the values a person places on those outcomes (Bandura, 1995;
Ivey, 2004). Thus, expectancy theory is critical to the discussion in the
comparison and contrast of expectations of parent and young adults with an ASD
and in understanding those expectations.
Self Efficacy
Bandura, a psychologist, defined self-efficacy as one’s belief in one’s own
ability to succeed in specific situations or as more commonly defined: the belief
in one's capabilities to achieve a goal or an outcome (Bandura, 1977). Self-
24
efficacy represents the personal perception of external social factors, is developed
from external experiences, and is influential in determining the outcome of many
events. A sense of self-efficacy can be key in how one approaches goals, tasks,
and challenges.
Bandura points to four factors affecting self-efficacy:
1. Experience (Mastery Experience). Experience is the most important
factor deciding a person's self-efficacy. Simply put, student’s
successful experiences raises self-efficacy, failure lowers it (Bandura,
1977; Margolis & McCabe, 2006).
2. Modeling (Vicarious Experience). Modeling is observing a peer
succeed at a task which, in turn can strengthen beliefs in one's own
abilities. “If they can do it, I can do it as well.” This is a process of
comparison between oneself and someone else. Although not as
influential as experience, modeling is a powerful influence when a
person is particularly unsure of him- or herself (Bandura, 1977;
Margolis & McCabe, 2006).
3. Social Persuasions (Verbal Persuasion). Social persuasions relate to
encouragements and discouragements. Teachers can boost self-
efficacy with credible communication and feedback to guide the
student through the task or motivate them to make their best effort.
25
Positive persuasions increase self-efficacy; negative persuasions
decrease it (Bandura, 1977; Margolis & McCabe, 2006).
4. Physiological Factors (Emotional state). Physiological factors can
create an energizing feeling that can contribute to strong performances.
A positive mood can boost one's beliefs in self-efficacy. In a
classroom setting, teachers can help by reducing stressful situations
and lowering anxiety surrounding events like exams or presentations
(Bandura, 1977; Margolis & McCabe, 2006).
Bandura’s theory of self-efficacy has important implications with regard to
motivation in that his basic principle is that people are likely to engage in
activities to the extent that they perceive themselves to be competent at those
activities. With regard to education, this means that learners will be more likely to
attempt, to persevere, and to be successful at tasks at which they have a sense of
efficacy (1986, 1993, and 1997).
The assumption that an individual with disabilities cannot do something is
so easy that people often do not stop to question why they do not do something
never considering the possibility that the individual chooses not to perform. Take
the example of catching a ball. The individual with a disability is unable to catch
a ball. Many people who make up the external social world of this individual will
assume not being able to catch a ball is part of the disability and therefore accept
not being able to catch and do not expect the individual to be able to catch.
26
However, throw the individual a bag of chips and the individual catches the bag
of chips. Expectancy theory recognizes that an individual’s motivation and
influence on expectancies are driven by self-efficacy. Self efficacy beliefs can
hinder our expectations and influence decision-making. (Betz & Hackett, 1981;
Ivey, 2004; Matsui, Ikeda, & Ohnishi, 1989).
Self-Determination
Self-determination is the ability to take primary control of one’s own life
and to do so in personally meaningful ways. Recognized as an important
educational outcome for both youth with and without disabilities, self-
determination has drawn attention in recent years especially as it relates to
students with disabilities (Field, Martin, Miller, Ward, & Wehmeyer, 1988;
Karvonene, Test, Wood, Browder, & Algozzine, 2004; Pierson, Carter, Lane &
Glaeser, 2008).
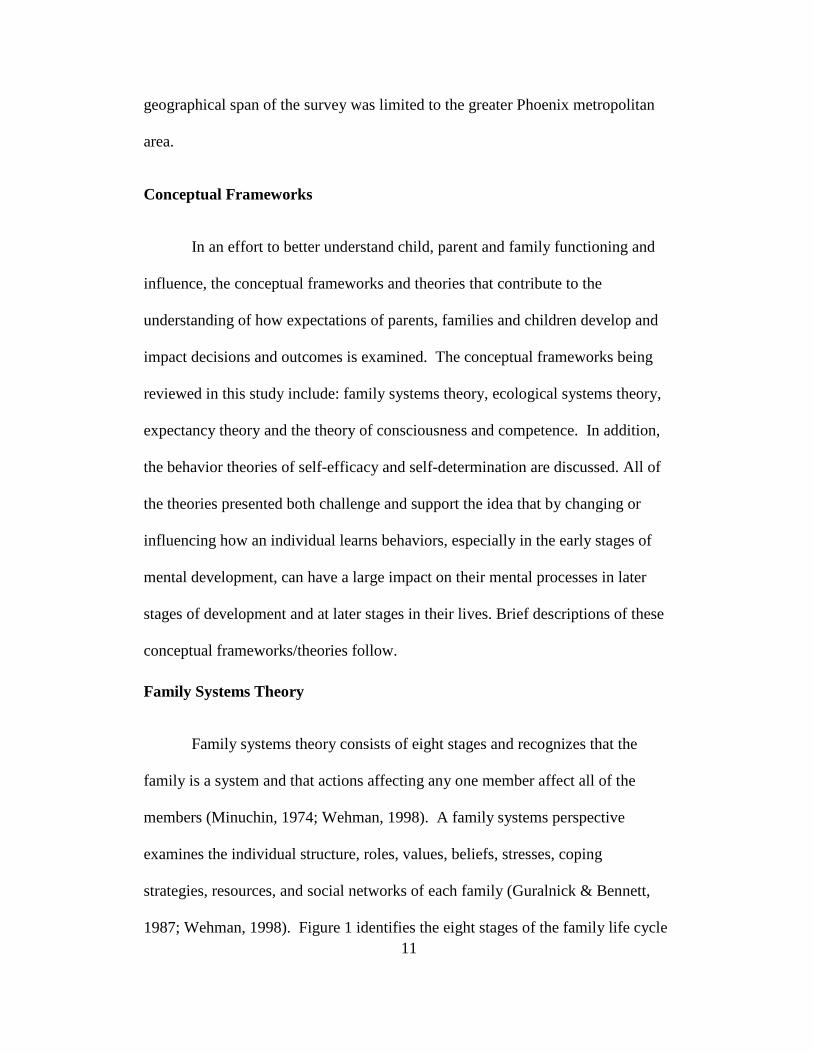
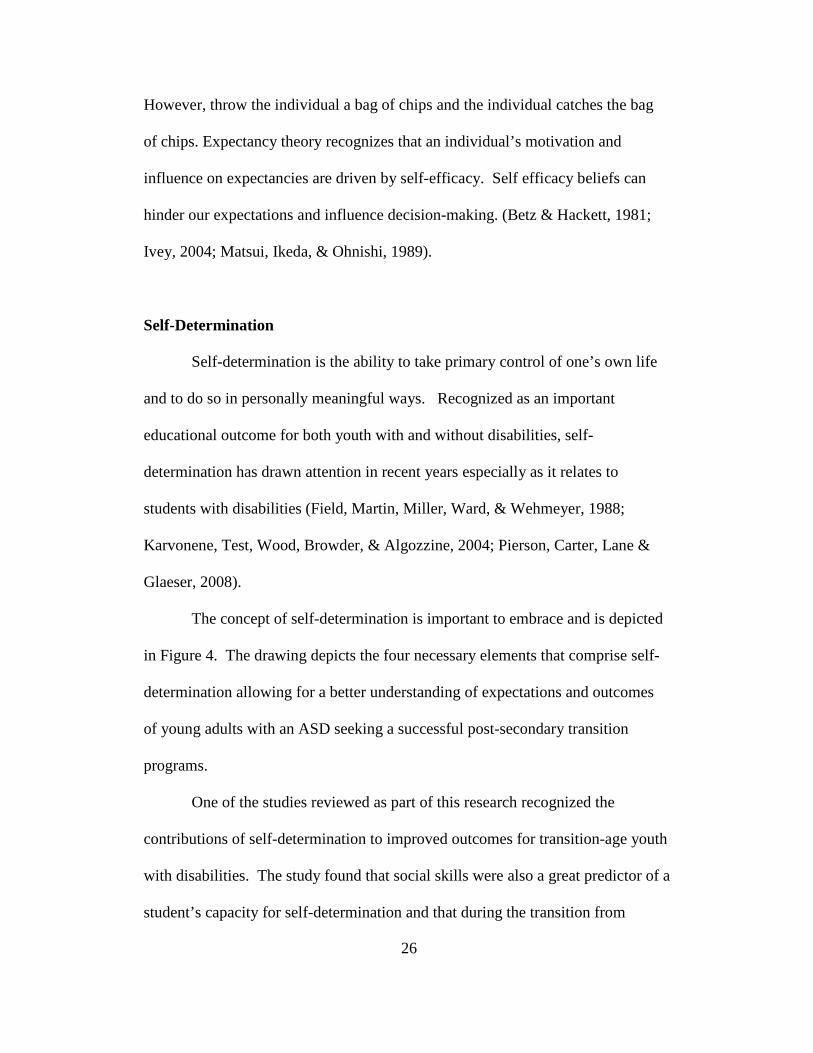
The concept of self-determination is important to embrace and is depicted
in Figure 4. The drawing depicts the four necessary elements that comprise self-
determination allowing for a better understanding of expectations and outcomes
of young adults with an ASD seeking a successful post-secondary transition
programs.
One of the studies reviewed as part of this research recognized the
contributions of self-determination to improved outcomes for transition-age youth
with disabilities. The study found that social skills were also a great predictor of a
student’s capacity for self-determination and that during the transition from
27
adolescence through high school and into young adulthood, self-determination is
most profound. The extent to which an individual demonstrates this concept of
self-determination will certainly have impact on their later life outcomes (Hadre
& Reeve, 2003; Pierson et al., 2008; Wehmeyer & Palmer, 2003; Wehmeyer &
Schwartz, 1997, 1998).
Figure 4. Development through Self-Determination
Retrieved (n.d.) from www.selfdetermination%dlfidfn20.djg.org
Self-determination has clear implications for transition planning, but is far
more relevant when the ability of youth to make sound choices, work toward self-
selected goals, solve unexpected problems, recognize and communicate their
strengths, advocate for needed services and supports and self-assess their progress
can directly influence their engagement and success in school, as well as the
outcomes they later achieve (Pierson et al., 2008).
28
This study will contribute to a beginning body of research that examines
the concept of self-determined behavior that students with an ASD may need to
exercise if a successful post-secondary experience is to be realized.
Summary
Through advances in the development in theory and passage of legislation
over the past three decades, education professionals have come to realize that the
child with disabilities has become inextricably embedded within families
(Wehman, 1998). The influence parents have on their children, particularly those
with disabilities, cannot be overlooked. A child’s development is critically
influenced by judgments that parents make as demonstrated by all of the theories
discussed. Parental expectations can not only predict children’s self-perceptions
but have been shown to predict actual achievement (Eccles, 1983; Entwisle &
Baker, 1983; Ivey, 2004; Phillips, 1987; Reynolds & Gill, 1994).
Comprehension of the various theories that give credence to the parents,
the individuals, the families and the environments is pivotal to understanding and
establishing the emotional well being of the family and give rise to the
development of realistic expectations that can effect transition and post-secondary
opportunities. All of the theories presented in this review challenge and support
the idea that how individuals learn their behaviors, especially in the early stages
of mental development, can have a large impact on their mental processes in later
stages of development and at future stages in their lives.
29
Mull (2001) stated earlier that over the past two decades the number of
students with disabilities that have been attending post-secondary education has
increased and the CDC reports that it is more likely that many more students with
an ASD will be attending post-secondary educational setting in the near future
(Adreon et al., 2007; CDC, 2005; Mull et al., 2001; Nuebert et al., 2004).
Understanding the disorder, the challenges faced by students with an ASD, the
transition process for these individuals and the expectations of both the parents of
these young adults and the young adults is imperative if there is to be any impact
and implication for practice that will drive post-secondary institutions to meet the
unique needs of this population.
This study, when completed, will enlighten policy and practice for
educational leaders and add to the body of research in the area of disability and
post-secondary education. If students with an ASD are to be successful in their
transition to post-secondary programs, a need for additional research, new
legislation, awareness education of all educational professionals and leaders, and
implementation of new programs exists that will impact policy and practices for
what could be a tumultuous future. In higher education, not the disability must be
accommodated but rather the individual needs of each student (Ivey, 2004).
30
Chapter 3
METHODOLOGY
Research Design and Theoretical Framework
In this section, an examination of the methods, procedures and theoretical
framework that were used to design the current study is presented. This research
project used archival data that was compiled using both qualitative and
quantitative research methods and analyzed data gathered from survey based
instruments. The use of archival research as a research method is a means in
which to use and analyze existing studies that have been conducted by other
researchers for the purpose of new primary analyses. Advantages of an archival
method of research are that changes in participant behavior or responses cannot be
changed and a different view of trends, relationships and outcomes of data that
has already been collected is offered (Whitlow, 2001).
Grounded theory was an appropriate methodology to be used in
constructing a theoretical framework for this study as the data was already
collected and archival. The use of grounded theory as a means in which to
conduct research provided an inductive methodology that emphasized the
systematic generation of theory from data. Grounded theory operates almost in
the reverse fashion of traditional research or that of the scientific method. Instead
of developing a hypothesis and collecting data to support it in a theoretical
framework, data is collected first, coded, and then concepts are generated which
form a basis to create a theory and thus create a theoretical framework which
supports the research or allows the researcher to review for contradiction.
31
In creating a theoretical framework for this study, the problem needed to
be identified to determine why the approach chosen was feasible. My initial
analysis provided evidence that the expectations of the parents did not necessarily
correlate with that of the young adults. Although many areas of agreement
existed in identifying critical program elements that would be necessary to
include in the development of post-secondary programs by the parents and the
young adults, the effects of whether demographics impacted positive or negative
correlations of either the critical program elements or expectations was unclear.
The research question that guides this study is, “Do the expectations of
either the parents or young adults impact the successful post transition of a young
adult with an autism spectrum disorder?” Conceptual frameworks and theories,
such as expectancy theory and Bronfenbrenner’s ecological systems theory (1979)
have been reviewed and discussed as potential theoretical frameworks to further
guide this research. The review of various conceptual frameworks and theories
allow the researcher to determine which factors need to be measured, what
statistical relationships to look for and ultimately contribute to a body of research
in the area of disability and post-secondary education involving individuals with
an ASD.
Evaluation Methods
Participants
A total of 16 young adults and 27 parents/caregivers participated in the
study. All young adult participants were diagnosed with a specific diagnosis that
32
fell on the autism spectrum and were between the ages of 18 and 27. Eleven of
these participants were male and five were female. Parents/caregivers
participating in the survey had to have a child who was diagnosed with an autism
spectrum disorder and the child must have been between the ages of 13 to 25
years. Of the parents/caregivers who participated in the study, 22 were female
and five were male. Both sets of participants were selected from across the greater
Phoenix metropolitan area.
Surveys
For purposes of the study that was implemented by Hanish et al. (2010)
and the subsequent archival data that was used for this research, two survey
instruments were used; one for parent/caregiver and one for young adults. The
surveys were adapted from the survey instrument developed by the Tennessee
Task Force for Post-Secondary Education for Students with Intellectual
Disabilities for a study conducted through Vanderbilt Kennedy Center (Griffin,
McMillan & Godapp, 2009). The surveys were modified to fit individuals with
an ASD through minimal word changes (Hanish et al, 2010).
The parent and young adult survey were essentially identical with
modifications relating only to the targeted group, e.g., “as a parent of” compared
to “as a student who.” The surveys consisted of five sections. On both surveys,
section one addressed demographics of the parent/caregiver(s). Second two
addressed information regarding characteristics of the young adult with an ASD.
Section three measured the secondary experience of individuals with an ASD and
section four measured the perceptions of each on post-secondary education and
33
what characteristics each felt were the most vital to consider when selecting a
post-secondary education option. The last section of the survey included open
ended questions that were not included or analyzed as part of the original study,
but have been reviewed for generalities concerning parent and young adult
expectations within the current study.
Procedures
A lead researcher from the transition team was identified for each site
selected to administer the surveys to the participants. Surveys were administered
one to one. A brief description of the study and explanation of procedures that
were being followed to ensure confidentiality and integrity of data collected were
given to each participant. Survey participants were given a consent form, the
survey and an envelope for submitting the forms. Parent participants were given
the option of completing the survey in person or through the mail; young adult
participants completed the survey in person. Each survey participant sealed their
own envelope and returned it to the lead researcher. A coding system was
developed to code each survey to protect survey participant confidentiality.
Theory and Needs Assessment
As previously discussed, an outcome of this study was to perform a needs
assessment based on archival research and existing data gathered by Hanish et al.,
(2010). A fundamental step in developing effective post-secondary programs for
the successful transition of students with an ASD is to examine what parents,
caregivers and young adults believe are the perceived critical program elements of
34
such programs for this population. As no standardized means in which to create
post-secondary transition programs for this population exists, a needs assessment
helps to establish basic criteria to aid in the development of such programs.
A needs assessment is a process for determining and addressing needs, or
"gaps" between current conditions and desired conditions. The need can be a
desire to improve current performance or to correct a deficiency (Barbazette,
2006).
A needs assessment answers five basic questions: who, what, when, how
and why and is typically a three phase process that includes: gathering of
information, analyzing the information and creating a plan. Based on the
analyses, parents/caregivers had identified four areas as critical program elements
of post-secondary programs that would be successful in the post transition of
young adults with an ASD: environment, opportunities, outcomes and overall
experience. In addition, factors that influenced such decisions were identified and
measured which included items such as the high school experience prior to post-
secondary transition. After analyzing, interpreting and providing conclusions, the
information from the needs assessment becomes a basis for the development of a
program plan for how best to resolve the deficiency.
Bronfenbrenner’s Ecological Systems Theory (1979) supports the concept
that the expectations of children influenced by their immediate relationships, such
as their parents should have similar expectations as those of their parents. Data is
reviewed for high correlations that exist between expectations and elements
deemed critical to include in developing successful transition programs.
35
The ecological systems theory perspective complements a family systems
focus by including the community as an integral context in which a family
functions. The literature on family systems theory supports the concept that
individuals learn and evolve through the various stages of life and identifies
expectations that exist due to where at the point in life an individual is. Data is
reviewed for correlations between expectations using the Pearson test.
Expectations that are found to be associated with other integral family members
should have higher correlation variables.
Expectancy theory supports the concept that individuals are motivated to
perform based on what is assumed or expected to be a reward, opportunity or
outcome. Data is reviewed for high correlation of expectancy and outcome.
Elements identified as opportunity, outcome or reward are reviewed for mean,
skewness and correlation which should provide listing of critical program
elements to be included in programming.
Conscious competence theory is the ability to understand that individuals
move through four stages of learning with everything that is encountered.
Conscious competence theory is used to support and give reasons for items that
do not necessary fit. Data is reviewed for items that have a negative correlation
and if future decisions or items result in the movement from one stage of learning
to the next stage.
Linking theory to needs assessments provides a more in depth
understanding of why participants may have responded the way they did.
36
Understanding the reason for the responses should have implications for future
policy development.
37
Chapter 4
DATA COLLECTION AND ANALYSIS
Data Collection
Archival data was coded and entered into Excel worksheets by the
researcher and then analyzed for trends and relationships. Various analyses
including ANOVA, Pearson’s, paired t-tests and statistical tests were performed
to determine the means and standard deviations of desired elements and the
relationship between the variables. The data was entered into SPSS (Statistical
Package for Social Sciences). Cross tabulations were performed to compare
different variables that could impact the criticality of the four specific elements
identified by the participants as necessary for post-secondary programs and aid in
the potential to develop such programs. Paired t-tests were used to determine
whether variables differ from each other in a significant way under the
assumptions that the paired differences are independent and identically normally
distributed. Pearson’s chi-square tests were used to test a null hypothesis that
stated that the frequency distribution of certain events observed was consistent
with a particular theoretical distribution. For example, did the fact that the
student liked the high school experience increase the likelihood of actually
graduating? The 95% confidence interval was calculated for each comparison and
determination made if the results were considered statistically significant. The
confidence interval was used to indicate the reliability of an estimate with the
intention to give the assurance that, if the statistical model was correct, the
38
procedure for constructing the interval would deliver a confidence interval that
included the true value of the parameter the proportion of the time set by the
confidence level interval; in this case 95% of the time.
The data was examined for differences as whole constructs and on an item
by item level. Based on the analyses, the researcher was able to determine
positive and negative correlations that existed between items, whether statistical
significance existed between identified variables, if the differences between
constructs significantly differed from zero and whether certain elements impacted
the outcome of other pertinent data items in answering certain questions. The
means and standard deviations for all responses, in addition to other relevant
information have been included.
This archival study examined factors perceived significant in preparing
individuals who fall on the autism spectrum for post-secondary experiences. One
of the major goals of the study was to provide post-secondary institutions with
direction for program development linking theory with perceptions of parents and
youth with autism spectrum disorders. The study analyzed the relationship
between expectations of each group and in what manner such perceptions could
impact successful post transition practices.
The research question that guided this study was, “How do the
expectations of parents or young adult impact the successful post transition of a
young adult with an autism spectrum disorder?” Multiple theories were reviewed
and discussed as potential theoretical frameworks allowing the researcher to

39
determine which factors needed to be measured and what statistical relationships
to look for.
Data Analysis and Discussion
Various analyses including ANOVA, Pearson’s, paired t-tests and other
statistical tests were performed using archival data that was coded and entered
into Excel worksheets and SPSS. Throughout the data analysis, a number of
variable tests were applied across the different analyses and are displayed in
various tables included in the appendix. The various analyses gave the researcher
the ability to understand the data in a quantitative manner enabling interpretation,
assumptions and generalizations to be made and applied to a larger group from
the sample data. Some of the tests employed, give confidence to a certain degree
that the data as applied in larger studies will garner the same results thereby
validating the significance of the study. Tests described below provide a more
detailed explanation.
Standard deviation measures how much variation from the average mean
and is a statistic that tells how tightly the data is clustered around the mean in the
data set. A low standard deviation indicates that the data points tend to be very
close to the mean and the bell-shaped curve is steep while a high standard
deviation indicates the data are spread out over a large range of values and the
bell curve is relatively flat. Understanding standard deviation accounts for what
percentage of the sample population is represented is important. For example,
one (1.00) standard deviation away from the mean in either direction accounts for
40
approximately 68 percent of the people in the group surveyed. A standard
deviation of two (2.00) away from the mean accounts for roughly 95 percent of
the people sampled and three (3.00) standard deviations away from the mean
accounts for approximately 99% of the population sampled. In the current study,
the standard deviation ranged from .40 to 1.48 the majority of the time (95%)
meaning that the data peaked in many of the cases on the bell curve representing
the majority of the entire population surveyed responding in the same manner.
Understanding standard deviation and other statistical tests gives the ability to
quickly understand the population and data in relation to larger sets of data
without having to do a detailed analysis.
The 95% confidence interval was used to express the variability of the
population by margin of error by calculating the expected standard deviation of
the results for conducting the sample test multiple times. The confidence interval
indicates the reliability of an estimate with the intention to give assurance that, if
the statistical model was correct, the procedure for constructing the interval would
deliver a confidence interval that included the true value of the parameter the
proportion of the time set by the confidence level interval; in this case 95% of the
time. In the current study, the 95% confidence interval was applied to the survey
response data. The confidence interval (CI) statistic represents the range of the
upper and lower limits and gives 95% confidence that the population sampled
would respond within the lower and upper limits 95% of the time if the test were
replicated to a different population. For example, the CI 95% for the question,
“Do you think your child would be interested in attending this type of program
41
after high school?” is .317. The .317 represents the distance from the mean with
the range of the limits (4.3354, 4.9689) and indicates that 95% of the time the
population will respond to within the limit. As the level of confidence decreases,
the size of the corresponding interval will decrease. An increase in sample size
will decrease the length of the confidence interval without reducing the level of
confidence. Understanding the use confidence intervals gives a certain level of
assurance that the estimated ranges for unknown populations can be achieved.
Confidence intervals were used for the response data and can be correlated to
larger data sets and other populations that should likely achieve the same ranges
based on the percent confidence interval. The data presented in Appendix J shows
that the confidence coefficient ranges from .352 to .980 for the young adults, and
.163 to .687 for the parents. The ranges limits for the adults are smaller than
those of the young adults. This finding suggests that the adults are a relatively
homogenous group whereas the perceptions of the youth are heterogeneous. The
adults as a group have essentially similar responses to key ideas regarding post-
secondary transition practices. In contrast, the youth have a wider range of
thoughts. A quick interpretation and assumption can be made of future responses
in anticipating the results of replicated studies to new populations or new
geographical areas.
Skewness measures symmetry or lack of symmetry as related to the
distribution on a bell curve. Kurtosis is a measure of whether the data are peaked
or flat relative to a normal distribution. Data sets with high kurtosis have a peak
at the middle of the distribution and data sets with a low kurtosis are flat at the
42
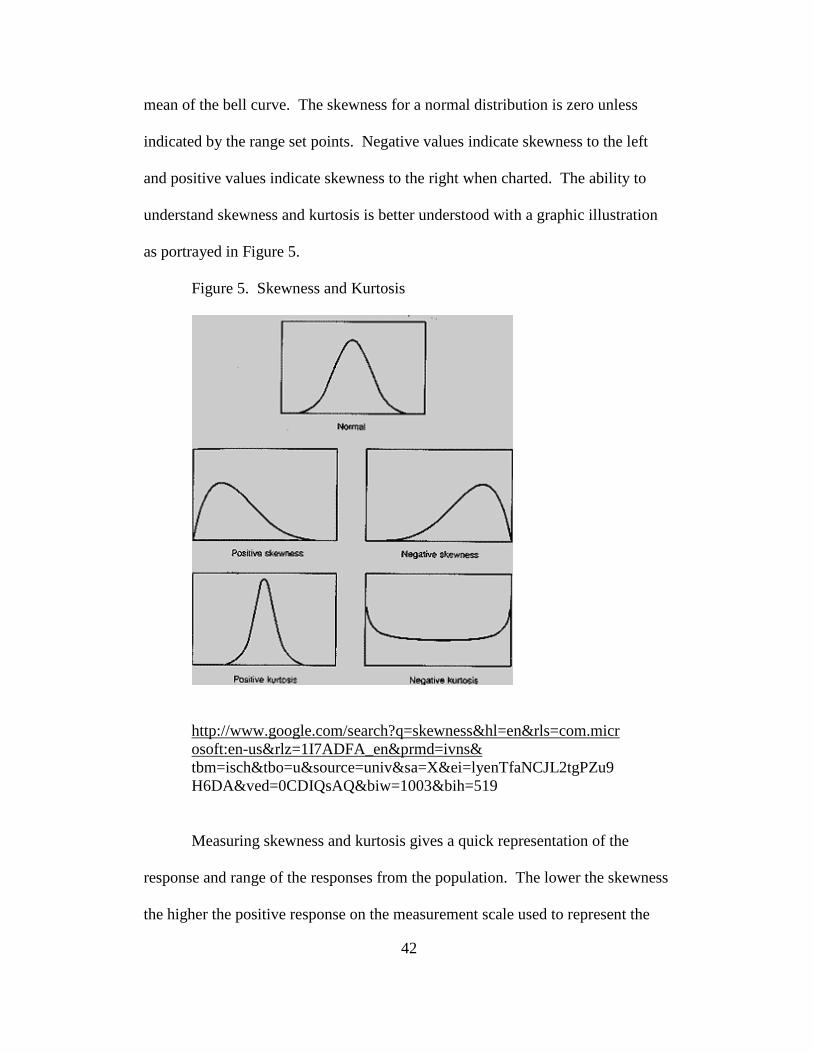
mean of the bell curve. The skewness for a normal distribution is zero unless
indicated by the range set points. Negative values indicate skewness to the left
and positive values indicate skewness to the right when charted. The ability to
understand skewness and kurtosis is better understood with a graphic illustration
as portrayed in Figure 5.
Figure 5. Skewness and Kurtosis
http://www.google.com/search?q=skewness&hl=en&rls=com.microsoft:en-us&rlz=1I7ADFA_en&prmd=ivns& tbm=isch&tbo=u&source=univ&sa=X&ei=lyenTfaNCJL2tgPZu9H6DA&ved=0CDIQsAQ&biw=1003&bih=519
Measuring skewness and kurtosis gives a quick representation of the
response and range of the responses from the population. The lower the skewness
the higher the positive response on the measurement scale used to represent the
43
responses. The current study used a Likert scale with responses ranging from one
(1) to five (5) with one being, “no/not at all” and five, “yes/very.” The majority
of the responses (95%) for the entire population to the survey questions were
negatively skewed, which means that the population in this study answered the
survey questions more often with a four (4) or five (5) rather than a one (1) or two
(2). Determination of the responses to be more positive than negative could be
made quickly. Skewness was calculated for demographics and survey responses
and can be found in Appendix I and Appendices F and G. Skewness and Kurtosis
are two important analytical tests that can be applied to have an understanding
rather quickly of the responses without having to perform a detailed analysis.
Skewness for the demographic data is determined by how the category descriptors
are organized and by the responses on the Likert scale for the survey questions.
The category descriptors for the counts for the various demographical data started
with “0” or “1,” and are labeled as such on the x-axis when plotted. Skewness
correlates to how the categories were numbered on the x-axis. The data when
represented graphically can reside near the y-axis because the corresponding
answers for many of the categories were “0” or “1” resulting in data that when
charted to be positively skewed. The data can also reside away from the y-axis
resulting in the data when charted to be positively negatively skewed. If the data
is not evenly distributed, the result will be a high kurtosis; if the data is evenly
distributed, the result will be a negative kurtosis.
Skewness and kurtosis for demographic data can be found in Appendix F
and Appendix G. Skewness correlates to how the categories were numbered on
44
the x-axis resulting in both positive and negative skewness dependent of the
organization of the descriptors for the categories. Kurtosis for the demographic
data in this study suggest that young adults were well represented and balanced in
gender and age having a negative kurtosis; however, ethnicity, education and
employment were homogeneous and had a positive kurtosis. Kurtosis for the
demographic data for the parents suggest age count groups, education,
employment were well balance having a negative kurtosis; however, gender, age,
ethnicity and marital status were homogeneous and had a positive kurtosis.
Interpretation of the skewness for the survey questions is that the majority
of the responses to the survey questions for the entire population were negatively
skewed meaning, which means that the population in this study answered the
survey questions more often with a four (4) or five (5) rather than a one (1) or two
(2). The only survey questions that were positively skewed were:
1. Social skills (0.640 - young adults);
2. Inclusion of transition planning in the IEP (0.734 - parents);
3. Passing of the AIMS test (0.631 - parents)
The young adult response for social skill was an anomaly as the mean was
4.375 with 65% responding with a “4” and 35% responding with “5.” For
Inclusion of transition planning in the IEP and passing of the AIMS test, the
majority of the parents responded “no”. Based on the overall results and
comparison of responses, interpretation could be made that responses between the
parents and young adults were similar thus supporting Bronfenbrenner’s
ecological systems theory (1979) and family systems theory that an alignment of
45
the expectations are shared between the family members and are a result of the
stage in life that the individual may be at. In addition, expectancy theory is
supported as a result of the responses for the alignment of expectations of
potential outcomes or opportunities in the study and supports the concept that
students may be motivated to engage if they believe a reward or outcome will be
forthcoming.
A t-test uses two data sets to compute a non-negative t-statistic to
determine whether two samples are likely to have come from the same two
underlying populations that have the same mean. The t-tests used in the current
study uses the two-tailed distribution and because the data sets contain a different
number of responses uses a heteroscedastic type test meaning the sample means
are assumed unequal. The use of the t-test can quickly allow the research to
understand how the means of the population sample are associated. A value near
1.00 indicates the means of the two populations to be equal while a low value
indicates the means of the two populations are varied and the statistic gives
reference to how great the variance is. An example from the current study is the
question, “Do you think your child likes high school?” The t-test variable was
.9911 and the means of the youth and parent population were 3.688 and 3.692
respectively. The t-test variable is close to 1.00 and indicates the means are
almost equal. The t-test was used in this study and applied to all the responses
(see Appendix J). The t-test shows very quickly whether parent and young adults
agree in their responses. The following responses had t-test values close to 1.000,
meaning the means are almost equal:
46
1. Do you think your child like high school? (0.991);
2. Does your child seem interested in educational opportunities after high
school? (0.980);
3. How likely do you think it is that your child might actually enroll in a
post-secondary program after exiting high school? (.949)
4. Do you think your child would be interested in attending a post-
secondary program after high school? (.779)
5. Do you think that educational opportunities after high school would
help your child transition to adulthood? (.712)
This analysis revealed that parents and young adults with an ASD do agree
in their responses and share beliefs that opportunities for post-secondary transition
programs are of interest. Bronfenbrenner’s ecological systems theory (1979),
family systems theory and expectancy theory, supports the findings that the
alignment of expectations are shared between the family members and that
students may be motivated to engage if they believe a reward or outcome will be
forthcoming.
Continued review of the data found the following responses had t-test
values that were low, meaning that the means of the two populations are varied
and the parents and young adults with an ASD to not agree in their responses.
The closer the value is to 0.00, the less agreement there is.
1. How aware do you think you are of the different options that are
available to your child after high school? (0.117);
47
2. Has the high school staff encouraged your child to continue in an
educational setting after high school? (0.058).
3. Does your child’s IEP include a transition plan? (0.036)
4. Do you think the high school has helped prepare your child for the
future? (0.0219)
5. Do you expect to pass AIMS? (0.015)
Further analysis revealed that parents and young adults with an ASD do
not agree in their responses in relation to high school experiences. Items one
(1), two (2) and three (3) are relative to the relationships that are experienced
in the high school and supporting the family systems theory that relationships
are varied as are expectations, values and beliefs throughout the different
stages of lives. The relationships established within the context of the student
and the high school is with the student and not the adult. The expectation is
that the responses will vary and not be highly correlated and have a low t-test
score, because the individual in the relationship is impacted by the
relationship.
A higher percentage of students believed “yes” they would pass the AIMS
test as compared to the majority of parents indicating “no”. The same was
true of a high percentage of students believing “yes” their IEP included a
transition plan compared to the majority of parents indicating “no”. The
ability to understand the conscious competence theory allows for explanation
of why the data presents as such. In the conscious competence theory, the
48
individual may be in the stage of unconscious incompetence and therefore not
know what they do not know. As the individual progresses through the
“stages of learning” knowledge and understanding is embodied by the
individual. The concept of self efficacy acknowledges that a student believes
what they perceive is possible even though achievement may not be
attainable. Students watch peers and see the need to pass AIMS to graduate
and therefore assume that they will pass, while parents may have a more
realistic expectation. The result thus being a low t-test score meaning that the
parents and young adults with an ASD do not agree. This is the same result
that is found when a correlation analysis was performed and is discussed at a
later point in the chapter.
Demographics
The literature provides a framework for how these two populations
interact and relate with one another throughout a variety of environmental layers,
family stages, learning stages which ultimately gives rise to a new way of
interpreting the theories. Development of policy dictates the need to know who
policy is being created for and who will be impacted. Any suggested policy
development from this study will impact young adults with an ASD, parents of
young adults with ASD and all of the individuals and organizations throughout
the environmental layers.
Tables found in Appendix B through Appendix G represent detailed
demographic information of the young adults with an ASD, detailed demographic
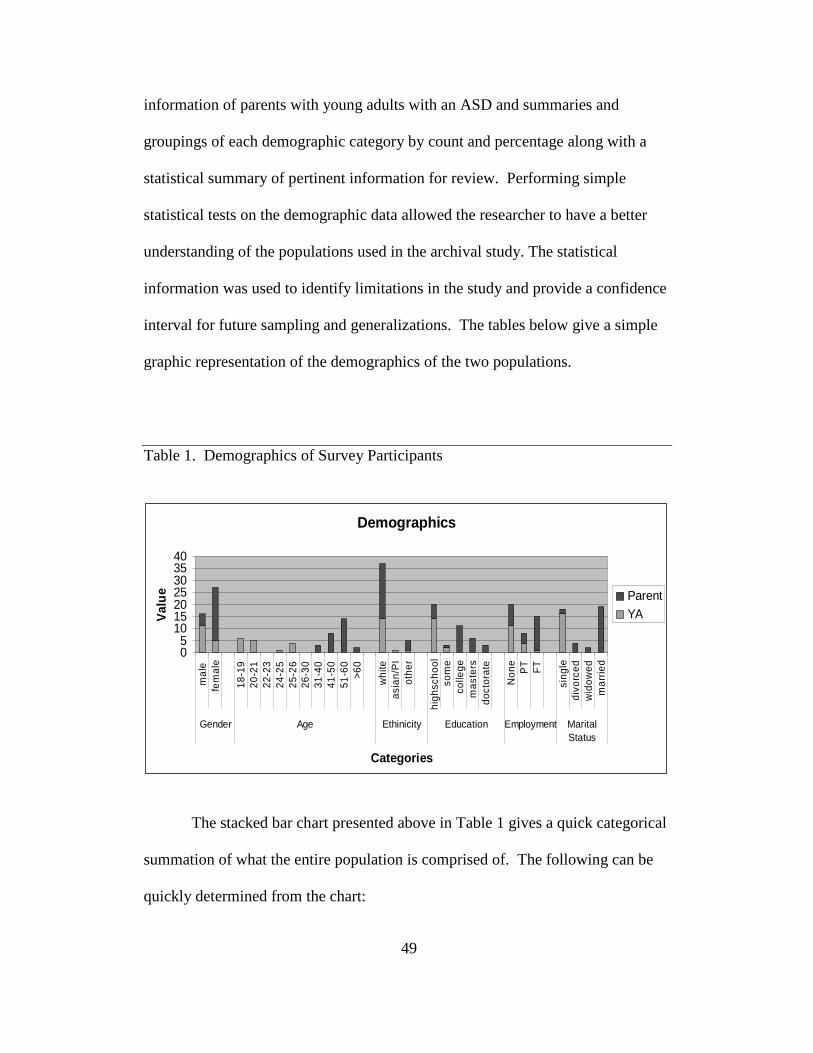
49
information of parents with young adults with an ASD and summaries and
groupings of each demographic category by count and percentage along with a
statistical summary of pertinent information for review. Performing simple
statistical tests on the demographic data allowed the researcher to have a better
understanding of the populations used in the archival study. The statistical
information was used to identify limitations in the study and provide a confidence
interval for future sampling and generalizations. The tables below give a simple
graphic representation of the demographics of the two populations.
Table 1. Demographics of Survey Participants
Demographics
05
10152025303540
ma
le
fem
ale
18-1
920
-21
22-2
324
-25
25-2
626
-30
31-4
041
-50
51-6
0>6
0
whi
teas
ian/
PI
othe
r
high
scho
olso
me
colle
gem
aste
rsdo
ctor
ate
Non
eP
TF
T
sing
ledi
vorc
edw
idow
edm
arrie
d
Gender Age Ethinicity Education Employment MaritalStatus
Categories
Val
ue Parent
YA
The stacked bar chart presented above in Table 1 gives a quick categorical
summation of what the entire population is comprised of. The following can be
quickly determined from the chart:
50
1. The ethnicity of the majority of the responders is white;
2. The number of female responders was greater than male responders;
3. The highest level of education for the group as a whole was high
school;
4. The majority of parent responders were married and all of the young
adult responders were single.
Development of policy dictates the need to know who policy is being
created for and who will be impacted. Looking at the demographics as a whole in
one chart helps to determine who the audience is for policy and program
development.
The table in Appendix F is a summary of descriptive statistics for the
young adults and the table in Appendix G is a summary of descriptive statistics
for the parents. In Appendix F gender, age and age groups for young adults:
1. Are positively skewed (0.895, 0.705, 0.732);
2. Have a low kurtosis (-1.391, -1.260, -1.269), and
3. When graphed, have flat bell curve meaning that the ages were evenly
distributed resulting in a negative kurtosis.
The category descriptors for the counts for the various demographical data
started with “0” or “1,” and are labeled as such on the x-axis when plotted.
Skewness correlates to how the categories were numbered on the x-axis. The data
51
when represented graphically resides near the y-axis giving the data when charted
to be positively skewed. The skewness for the demographic data is determined by
how the category descriptors are organized. The data for the above categories was
evenly distributed, thus resulting in a negative kurtosis. The need to understand
the demographic makeup of the populations that policy and program development
will impact is imperative to the success of the implementation of the programs
and policy.
In Appendix F, education, ethnicity and employment for young adults:
1. Are positively skewed (2.509, 3.030, 1.505);
2. Have a high kurtosis (4.898, 9.093, 1.580); and
3. When graphed, peak at the middle of the bell curve meaning that
the responses were not evenly distributed resulting in a high
kurtosis.
The category descriptors for the counts for the various demographical data
started with “0” or “1,” and are labeled as such on the x-axis when plotted.
Skewness correlates to how the categories were numbered on the x-axis. The data
when represented graphically resides near the y-axis because the corresponding
answers for many of the categories were “0” or “1” giving the data when charted
to be positively skewed. The skewness for the demographic data is determined by
how the category descriptors are organized. The data for the above categories has
a high kurtosis and was not evenly distributed. The need to understand the
demographic makeup of the populations that policy and program development
52
will impact is imperative to the success of the implementation of the programs
and policy.
The results suggest a review of the populations that is to be served by
future program development to ensure that program and policy implementation
are designed for benefit of all and not select categorical groups.
Age is the only descriptive element that has a high standard deviation for
the young adults meaning that the distribution of the data is spread across the
range (see Appendix C). In this case, the standard deviation for age is 3.425.
Implications for this age spread suggest that the individuals may be at different
stages in their lives. Although the actual range of age is relatively small (18 –
26), when the theoretical framework of family systems theory is reviewed, the age
group of 18-26 can be applied in multiple stages of the framework.
In Appendix G, age count and employment for parents:
1. Have a negative skewness (-0.438, -0.395);
2. Have a low kurtosis (-0.127, -1.771); and
3. When graphed, have a flat bell curve meaning the category
responses were equally distributed.
The category descriptors for the counts for the various demographical data
started with “0” or “1,” and are labeled as such on the x-axis when plotted.
Skewness correlates to how the categories were numbered on the x-axis. The data
when represented graphically does not reside near the y-axis giving the data when
charted to be negatively skewed. The skewness for the demographic data is

53
determined by how the category descriptors are organized. The data for the above
categories was evenly distributed, thus resulting in a negative kurtosis. In the
case of employment, 1= Part Time and 2= Full Time. 14 of the 27 respondents
were employed full time representing 52% of the population (see Appendix E).
The need to understand the demographic makeup of the populations that
policy and program development will impact is imperative to the success of the
implementation of the programs and policy.
In Appendix G, age and number of children:
1. Are positively skewed (0.399, 2.442);
2. Have a high kurtosis (0.368, 8.606); and
3. When graphed, peak at the middle of the bell curve meaning that
the responses were not evenly distributed resulting in a high
kurtosis.
In Appendix G, education and divorce status;
1. Are positively skewed (0.046, 0.079);
2. Have a low kurtosis (-0.755, -2.160); and
3. When graphed, have a flat bell curve meaning the category
responses were equally distributed.
In Appendix G, gender, ethnicity and marital status:
1. Are negatively skewed (-1.718, -2.099, -1.421);
2. Have a high kurtosis (1.021, 2.594, and 0.592); and
54
3. When graphed, peak at the middle of the bell curve meaning that
the responses were not evenly distributed resulting in a high
kurtosis.
In all of the above, the category descriptors for the counts for the various
demographical data started with “0” or “1,” and are labeled as such on the x-axis
when plotted. Skewness correlates to how the categories were numbered on the
x-axis. The data when represented graphically can reside near the y-axis because
the corresponding answers for many of the categories were “0” or “1” resulting in
data that when charted to be positively skewed. The data can also reside away
from the y-axis resulting in the data when charted to be positively negatively
skewed. The skewness for the demographic data is determined by how the
category descriptors are organized. If the data is not evenly distributed, the result
will be a high kurtosis; if the data is evenly distributed, the result will be a
negative kurtosis.
Age and education have high standard deviations (8.924, 2.231) meaning
that the distribution of the data is spread across the range of the data. The range
for age is 31 to >60 and education ranges from high school diploma to doctorate.
Implications for this age spread suggest that the individuals may be at different
stages in their lives. The actual range of age is quite large (36-75) and when the
theoretical framework of family systems theory is used, the level where
individuals are at can be applied on multiple stages in the framework.
55
Values, beliefs and expectations as related to the family systems theory
will be different at each level potentially having impact on how program
development and policy implications are received and perceived. The need to
understand the demographic makeup of the populations, the potential limitations
of populations of data and the populations that policy and program development
will impact is imperative to the success of the implementation of the programs
and policy.
The literature provided a framework for how these two populations
interact and relate with one another throughout a variety of environmental layers,
family stages, learning stages which ultimately gives rise to a new way of
interpreting the theories. The demographic data presented gives rise to potential
limitations of current study due to analysis of the sample populations and offers
recommendations for future study.
The two categories that stand out are gender and ethnicity. The parent
responses are not balanced in gender with 81% of the responders being female.
Ethnicity in both the young adults and parents are homogeneous with 85% of the
parent responders being white and 88% of the young adults being white. The
question presented is whether gender or ethnicity impacts the responses.
Balanced representation in gender and ethnicity should be an identified outcome
for future studies.
56
Survey Responses
A review of the archival data in Appendix H addresses the expectations of
parents and young adults in each of the answers presented. In reviewing the
correlation analysis results of the young adult and parent responses, the items with
the highest correlation and alignment of expectations were:
1. Considering post-secondary programs after high school (.985);
2. Interest in educational opportunities after high school (.973);
3. Would child be interested in attending post-secondary program after
high school (.945); and
4. Educational opportunities after high school would help transition to
adult hood (.923).
Data from this study support the shared beliefs of parents and youth with
ASD that post-secondary transition programs are important to future success.
Based on Bronfenbrenner’s ecological systems theory (1979), family systems
theory and expectancy theory, the alignment of expectations of potential
outcomes or opportunities in the study supports the data that expectations are
shared between the family members and that students may be motivated to engage
if they believe a reward or outcome will be forthcoming.
A continued review of the correlation analysis of the young adult and
parent responses, the following results were found to have neither a high
correlation nor negative correlation:
1. Do you think the high school has helped prepare your child for the
future? (0.673);
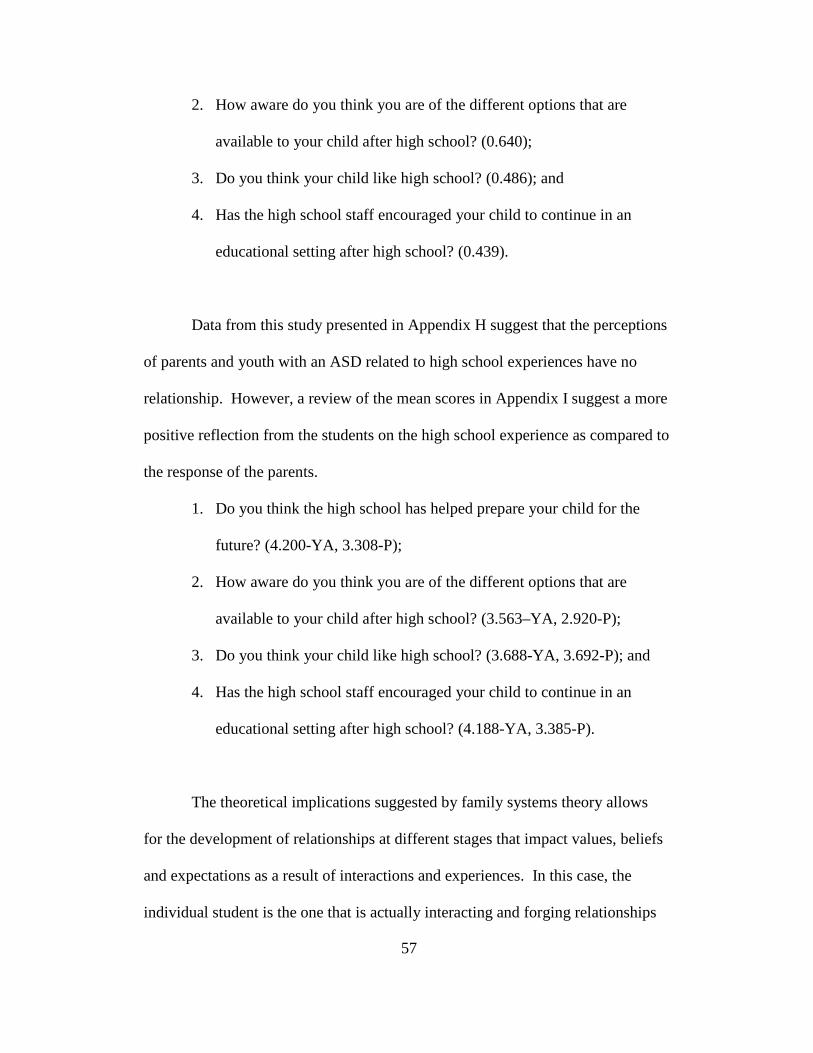
57
2. How aware do you think you are of the different options that are
available to your child after high school? (0.640);
3. Do you think your child like high school? (0.486); and
4. Has the high school staff encouraged your child to continue in an
educational setting after high school? (0.439).
Data from this study presented in Appendix H suggest that the perceptions
of parents and youth with an ASD related to high school experiences have no
relationship. However, a review of the mean scores in Appendix I suggest a more
positive reflection from the students on the high school experience as compared to
the response of the parents.
1. Do you think the high school has helped prepare your child for the
future? (4.200-YA, 3.308-P);
2. How aware do you think you are of the different options that are
available to your child after high school? (3.563–YA, 2.920-P);
3. Do you think your child like high school? (3.688-YA, 3.692-P); and
4. Has the high school staff encouraged your child to continue in an
educational setting after high school? (4.188-YA, 3.385-P).
The theoretical implications suggested by family systems theory allows
for the development of relationships at different stages that impact values, beliefs
and expectations as a result of interactions and experiences. In this case, the
individual student is the one that is actually interacting and forging relationships

58
with the school teachers and administrators as compared to either minimal or no
interaction with the teachers and administrators from the parent. Given that the
parent may not have a relationship with school officials provides an
understanding of the responses to high school experiences. Regardless of either
review, the implications for policy are the same.
• The process for transition planning for post graduation needs to be
reviewed to ensure that transition planning is included in the IEP;
• The expectation of high school teachers and administrators and the
responsibility for dissemination of information as it relates to post-
secondary programs needs to be addressed;
• Training for the transition of students should be incorporated into
teacher prep programs and professional development opportunities;
and
• Educational awareness programs for the parents of the young
adults with an ASD should be offered.
Transition from secondary to post-secondary settings are key milestones
for any student, but is a more significant process and achievement for students
with an ASD. The development of successful post-secondary transition programs
is critical, not only for growth and development of the individual, but for ultimate
integration of the individual into society as a productive and capable citizen.

59
The two items that had a negative correlation were:
1. Do you expect to pass the AIMS test? (-.311); and
2. Does the IEP include a transition plan? (-.898).
A higher percentage of students believed “yes” they would pass the AIMS
test as compared to the majority of parents indicating “no”. The same was
true of a high percentage of students believing “yes” their IEP included a
transition plan compared to the majority of parents indicating “no”. The
ability to understand the conscious competence theory allows for explanation
of why the data presents as such. In the conscious competence theory, the
individual may be in the stage of unconscious incompetence and therefore not
know what they do not know. As the individual progresses through the
“stages of learning” knowledge and understanding is embodied by the
individual. The concept of self efficacy acknowledges that a student believes
what they perceive is possible even though achievement may not be
attainable. Students watch peers and see the need to pass AIMS to graduate
and therefore assume that they will pass, while parents may have a more
realistic expectation. Having high expectations of students with an ASD can
result in higher expectations being achieved than originally perceived.
Programmatic Needs Assessment
An outcome of this study was to perform a programmatic needs
assessment based on data gathered by Hanish et al., (2010). Based on the
60
analyses, four areas were identified as functional categories to sort the perceived
critical program elements of post-secondary transitions programs. The categories
identified were: environment, opportunities, outcomes, and overall experience. In
addition, factors that influenced such decisions were identified and measured.
Appendix P displays the young adult and parent responses along with a
correlation analysis on critical program elements to include. Table 4 provides a
summary of the data describing the correlation between the perceived needs of
parents and young adults with an ASD relative to programmatic elements or
program components for future success in post-secondary settings.
Table 2 identifies perceived critical program elements that had a
correlation of .8000 or higher and lists the top nine elements in descending order
to include in developing post-secondary transition programs. The data is a result
of correlation analysis to identify items deemed critical program elements to
include in the development of post-secondary transition programs.
Literature presents theory that children’s expectations, beliefs and values
are heavily influenced by their parents, thus expecting that children should want
for them what their parents want. The items deemed critical are suggested to be
included in development of post-secondary transition programs and will be
subject to policy implication and practices. Policy implications include how the
post-secondary transition programs are developed, funded and where the
programs are offered. The option to fund post-secondary transition programs and
offer the programs on a college campus utilizing IDEA should be explored.
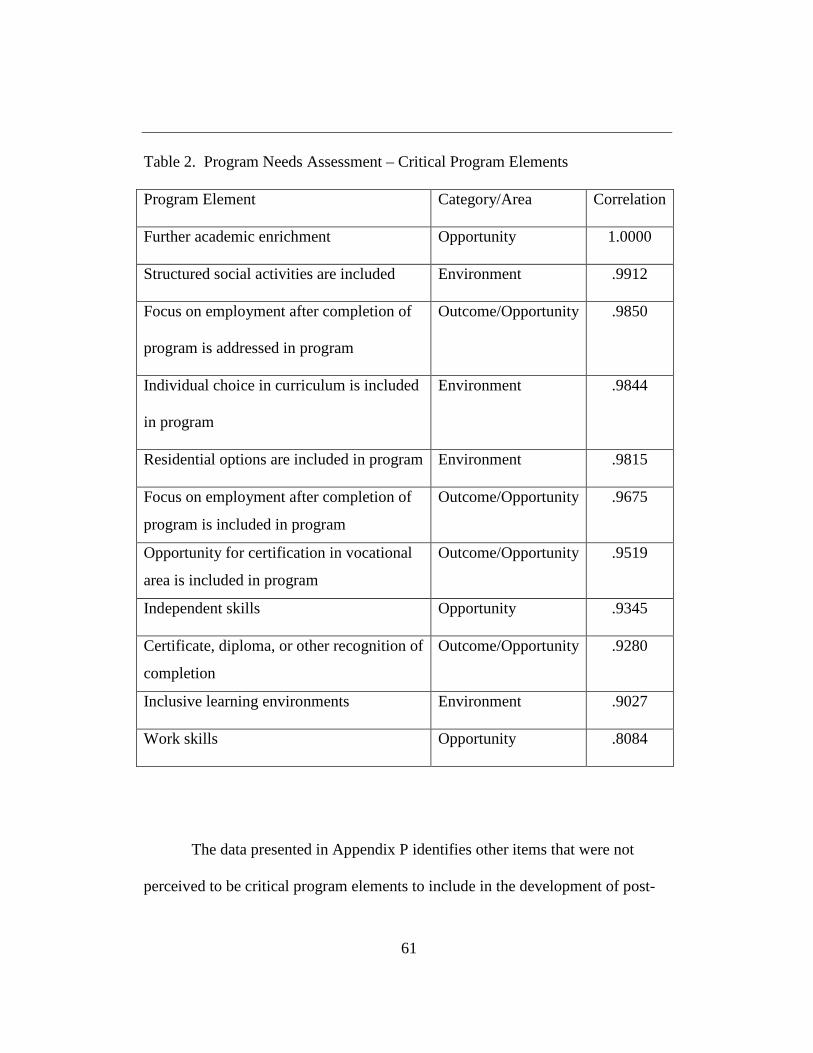
61
Table 2. Program Needs Assessment – Critical Program Elements Program Element Category/Area Correlation
Further academic enrichment Opportunity 1.0000
Structured social activities are included Environment .9912
Focus on employment after completion of
program is addressed in program
Outcome/Opportunity .9850
Individual choice in curriculum is included
in program
Environment .9844
Residential options are included in program Environment .9815
Focus on employment after completion of
program is included in program
Outcome/Opportunity .9675
Opportunity for certification in vocational
area is included in program
Outcome/Opportunity .9519
Independent skills Opportunity .9345
Certificate, diploma, or other recognition of
completion
Outcome/Opportunity .9280
Inclusive learning environments Environment .9027
Work skills Opportunity .8084
The data presented in Appendix P identifies other items that were not
perceived to be critical program elements to include in the development of post-
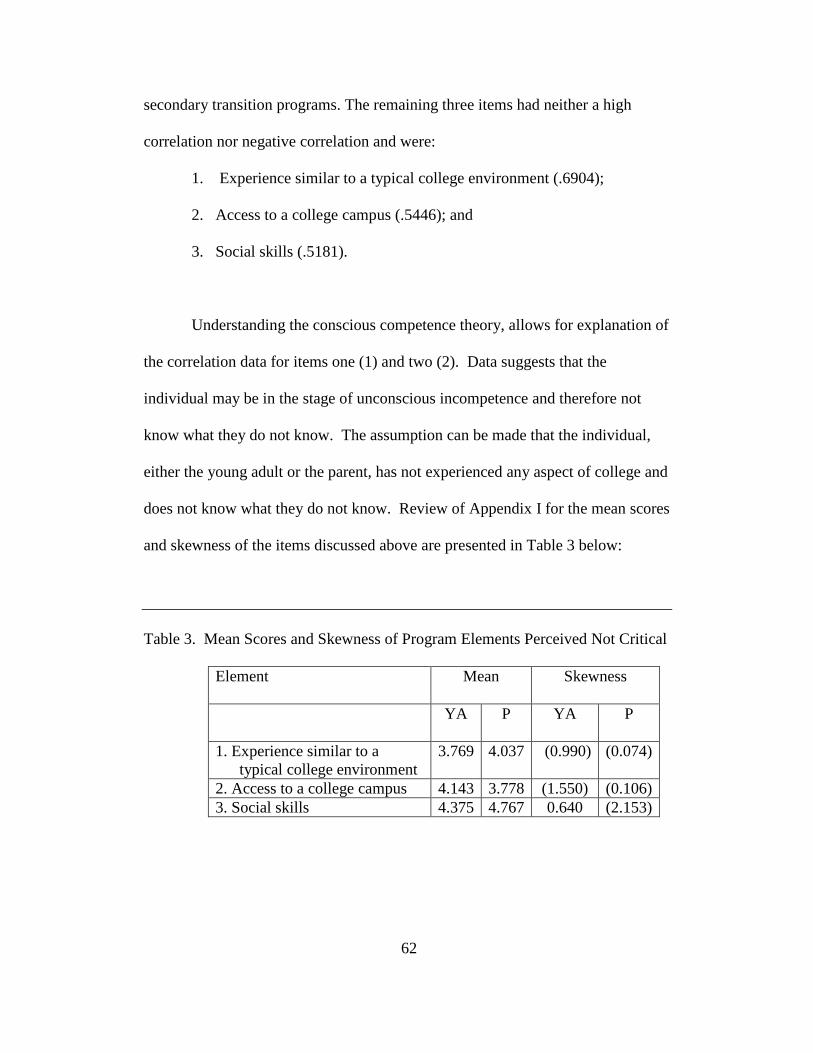
62
secondary transition programs. The remaining three items had neither a high
correlation nor negative correlation and were:
1. Experience similar to a typical college environment (.6904);
2. Access to a college campus (.5446); and
3. Social skills (.5181).
Understanding the conscious competence theory, allows for explanation of
the correlation data for items one (1) and two (2). Data suggests that the
individual may be in the stage of unconscious incompetence and therefore not
know what they do not know. The assumption can be made that the individual,
either the young adult or the parent, has not experienced any aspect of college and
does not know what they do not know. Review of Appendix I for the mean scores
and skewness of the items discussed above are presented in Table 3 below:
Table 3. Mean Scores and Skewness of Program Elements Perceived Not Critical
Element Mean Skewness
YA P YA P
1. Experience similar to a typical college environment
3.769 4.037 (0.990) (0.074)
2. Access to a college campus 4.143 3.778 (1.550) (0.106) 3. Social skills 4.375 4.767 0.640 (2.153)
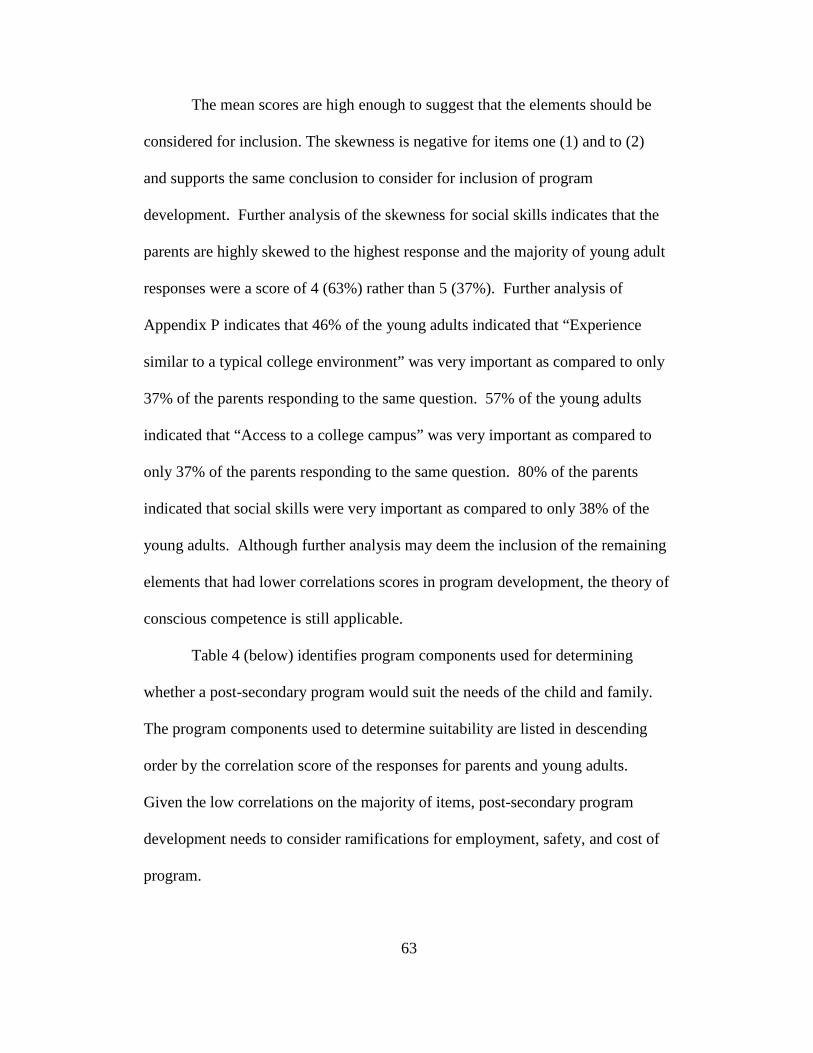
63
The mean scores are high enough to suggest that the elements should be
considered for inclusion. The skewness is negative for items one (1) and to (2)
and supports the same conclusion to consider for inclusion of program
development. Further analysis of the skewness for social skills indicates that the
parents are highly skewed to the highest response and the majority of young adult
responses were a score of 4 (63%) rather than 5 (37%). Further analysis of
Appendix P indicates that 46% of the young adults indicated that “Experience
similar to a typical college environment” was very important as compared to only
37% of the parents responding to the same question. 57% of the young adults
indicated that “Access to a college campus” was very important as compared to
only 37% of the parents responding to the same question. 80% of the parents
indicated that social skills were very important as compared to only 38% of the
young adults. Although further analysis may deem the inclusion of the remaining
elements that had lower correlations scores in program development, the theory of
conscious competence is still applicable.
Table 4 (below) identifies program components used for determining
whether a post-secondary program would suit the needs of the child and family.
The program components used to determine suitability are listed in descending
order by the correlation score of the responses for parents and young adults.
Given the low correlations on the majority of items, post-secondary program
development needs to consider ramifications for employment, safety, and cost of
program.
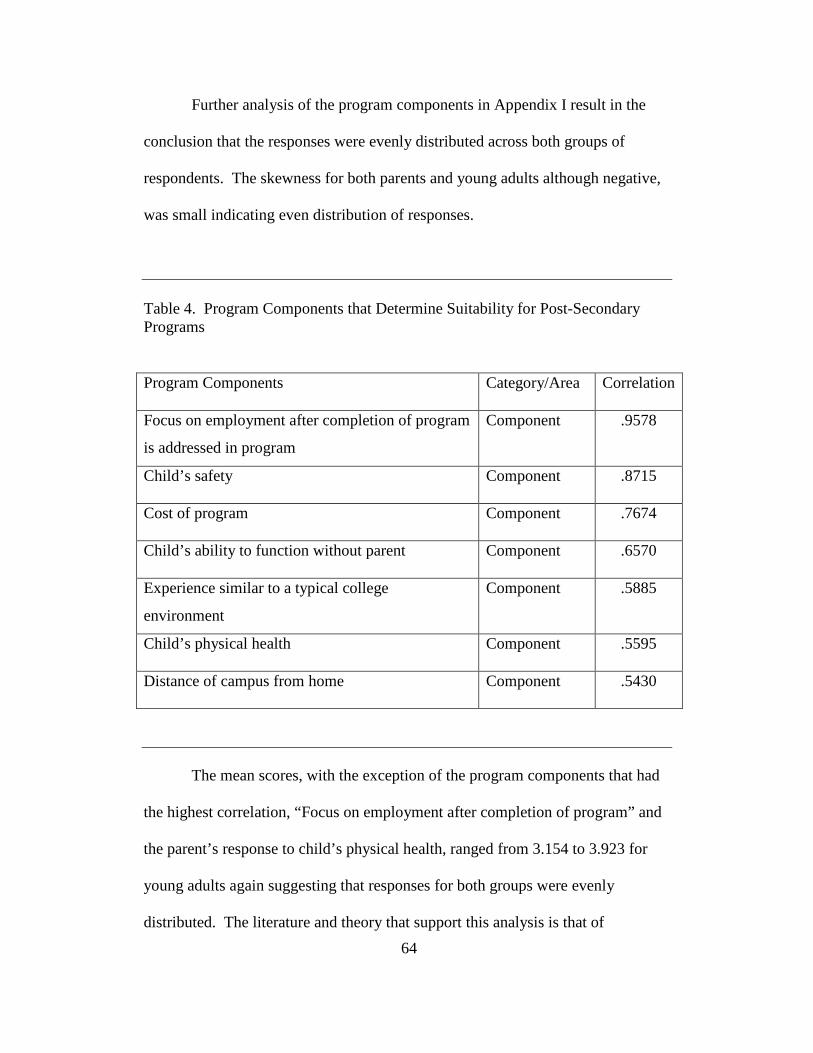
64
Further analysis of the program components in Appendix I result in the
conclusion that the responses were evenly distributed across both groups of
respondents. The skewness for both parents and young adults although negative,
was small indicating even distribution of responses.
Table 4. Program Components that Determine Suitability for Post-Secondary Programs
Program Components Category/Area Correlation
Focus on employment after completion of program
is addressed in program
Component .9578
Child’s safety Component .8715
Cost of program Component .7674
Child’s ability to function without parent Component .6570
Experience similar to a typical college
environment
Component .5885
Child’s physical health Component .5595
Distance of campus from home Component .5430
The mean scores, with the exception of the program components that had
the highest correlation, “Focus on employment after completion of program” and
the parent’s response to child’s physical health, ranged from 3.154 to 3.923 for
young adults again suggesting that responses for both groups were evenly
distributed. The literature and theory that support this analysis is that of
65
expectancy theory and conscious competence theory. Expectancy theory supports
motivations for outcomes and opportunities noting the high correlation for
employment opportunity after the program. The other components are not
motivators and therefore would be expected to have lower correlations. The
components with lower correlations are supported by the conscious competence
theory in that an individual is not aware of what they do not know. Policy
implications include how the post-secondary transition programs are developed
and whether the inclusion of components perceived critical in the development of
programs takes priority over the program components perceived important in
determining whether the program would suit the needs of the child and family.
Funding of post-secondary transition programs and delivery of method and
location also will impact policy decisions and educational practices.
The data contained within the above tables and associated analysis can
become a basis for the development of a program plan of what to include and
address in the development of post-secondary transition programs.
Expectations
The Pearson analysis (see Appendix M) was used to compare the
responses of expectations by correlating the responses of selected expectations
deemed pertinent to elements to be included in the development of post-secondary
transition programs and program components used for determining whether a
post-secondary program would suit the needs of the child and family. The
66
responses of selected expectations that were deemed pertinent to review does
impact the outcome of the perceived critical program elements to be included in
post-secondary transition programs and the program components used for
determining whether a post-secondary program would suit the needs of the child
and family. The results of the data show a high correlation between liking high
school and whether high school has helped prepare the child for the future with
those elements that are perceived to be attainable outcomes and opportunities that
relate to expectancy theory.
Discussion
Research shows that when the influential people in a child’s life do not
believe that he or she has potential to achieve an outcome, the outcome is unlikely
to be realized (Donahue, 2000; Ivey, 2004). The inverse is demonstrated to also
be true, thus if a belief that educational opportunities after high school would help
the transition of young adults with an ASD, the ability to develop programs that
include the expectations of critical program elements that were identified by the
parents and the young adults is necessary. Although more than half of the parents
(64%) surveyed indicated that they did not believe or were uncertain that their
child would graduate from high school, the vast majority (77%) believed that
post-secondary programs would help their young adult transition into their adult
life (see Appendix H)
According to the literature, the “Four Stages of Learning” or the conscious
competence theory can be used to explain this result. Expectations change as we
67
move through the various stages of the conscious competence theory and gain
further understanding and knowledge of the situation at hand. The parents may
not believe that their children are capable of graduating high school or
accomplishing other tasks due to the stage they are in at the present time. As the
parents are given an option to review what could be necessary for their child to
transition into adulthood, they gain further knowledge and understanding of what
it will take thereby seeking out opportunities that will be necessary and move to a
new stage of awareness and consciousness of what they did not know. The state
of movement through the various “Stages of Learning” happens multiple times
throughout lives. Every environmental layer that exists and all the stages of
relationships that individuals engage in continually change beliefs, values and
expectations as individuals move and grow.
What makes the theoretical frameworks in the literature exciting is that
each one supports the data in a similar fashion. The theoretical frameworks
guided the research allowing the researcher to determine what needed to be
measured, what statistical relationships to look for and ultimately contribute to the
body of research in the area of disability and post-secondary.
Bronfenbrenner’s Ecological Systems Theory model (1979) outlines the
four layers of influences that impact a child’s development, their beliefs, and
behaviors. Interactions and influences are bi-directional and are strongest at the
micro-system layer which includes immediate relationships with family members,
school and caregivers. The literature supports that the expectations of children
influenced by their immediate relationships, such as their parents should have

68
similar expectations as those of their parents. High correlations on the survey
responses existed among the expectations of opportunities after high school. As
individuals continue to grow, develop and expand the layers of environmental
surroundings, values, beliefs and expectations change.
The ecological systems theory perspective complements a family systems
focus by including the community as an integral context in which a family
functions and can be used in part as a conceptual framework for the research
questions identified in this study (Weissbourd & Patrick, 1988; Wehman, 1998).
Community as an integral context includes the relationships of school. The
literature on family systems theory that supports the concept that we learn and
evolve through the various stages of life can defend the data found in the original
study. The Pearson test was used to look at expectations in relation to “How
likely do you think it is that your child might actually enroll in a post-secondary
program?” The outcome of the highest Pearson variable resulted in similar
expectations for the top five expectations that had to do with family and high
school support systems (see Table 5).
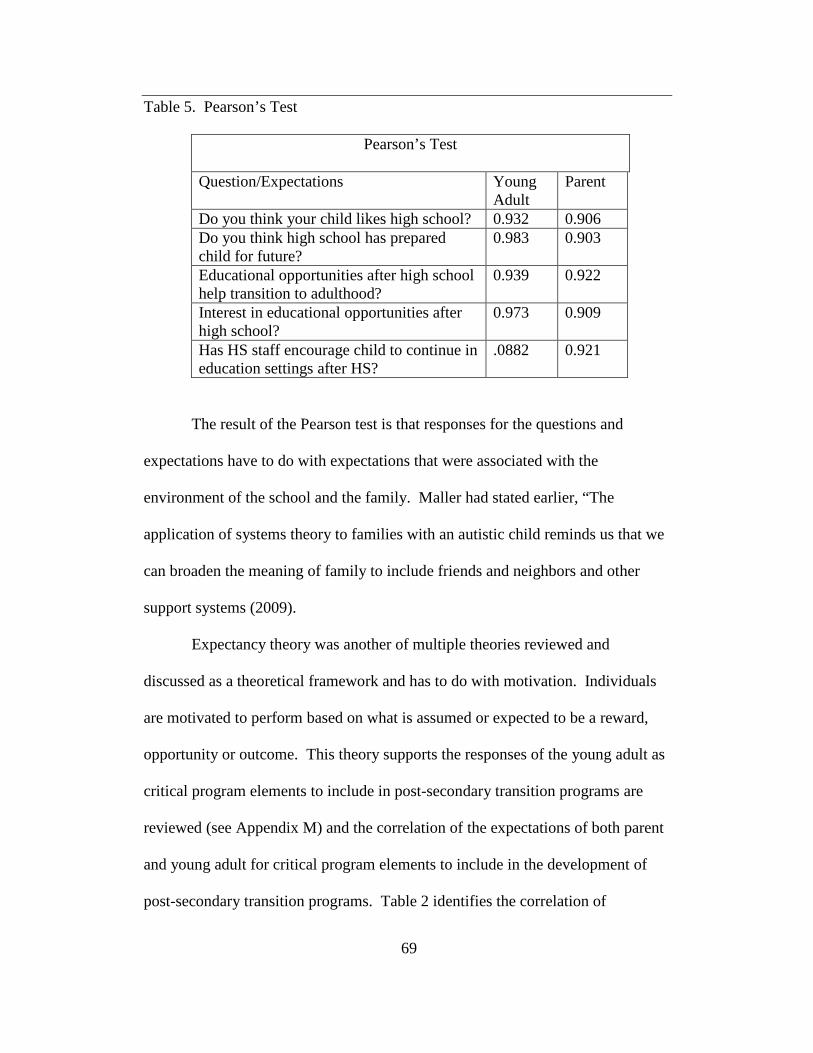
69
Table 5. Pearson’s Test
Pearson’s Test
Question/Expectations Young Adult
Parent
Do you think your child likes high school? 0.932 0.906 Do you think high school has prepared child for future?
0.983 0.903
Educational opportunities after high school help transition to adulthood?
0.939 0.922
Interest in educational opportunities after high school?
0.973 0.909
Has HS staff encourage child to continue in education settings after HS?
.0882 0.921
The result of the Pearson test is that responses for the questions and
expectations have to do with expectations that were associated with the
environment of the school and the family. Maller had stated earlier, “The
application of systems theory to families with an autistic child reminds us that we
can broaden the meaning of family to include friends and neighbors and other
support systems (2009).
Expectancy theory was another of multiple theories reviewed and
discussed as a theoretical framework and has to do with motivation. Individuals
are motivated to perform based on what is assumed or expected to be a reward,
opportunity or outcome. This theory supports the responses of the young adult as
critical program elements to include in post-secondary transition programs are
reviewed (see Appendix M) and the correlation of the expectations of both parent
and young adult for critical program elements to include in the development of
post-secondary transition programs. Table 2 identifies the correlation of
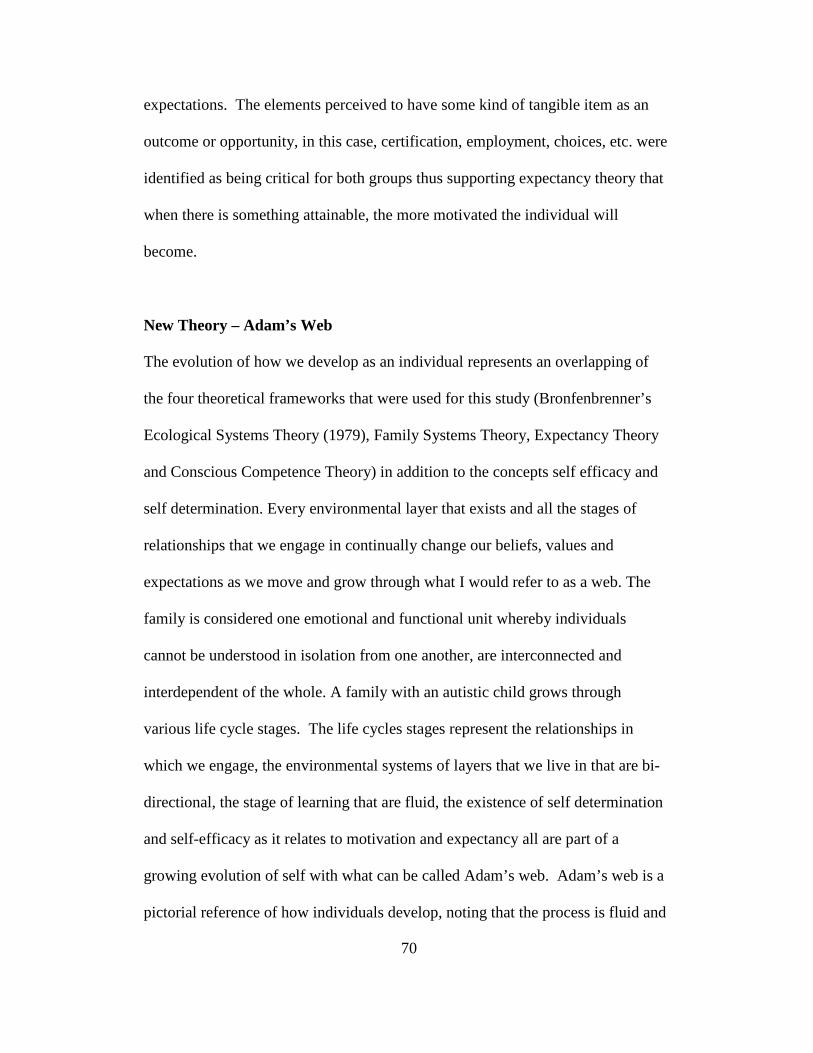
70
expectations. The elements perceived to have some kind of tangible item as an
outcome or opportunity, in this case, certification, employment, choices, etc. were
identified as being critical for both groups thus supporting expectancy theory that
when there is something attainable, the more motivated the individual will
become.
New Theory – Adam’s Web
The evolution of how we develop as an individual represents an overlapping of
the four theoretical frameworks that were used for this study (Bronfenbrenner’s
Ecological Systems Theory (1979), Family Systems Theory, Expectancy Theory
and Conscious Competence Theory) in addition to the concepts self efficacy and
self determination. Every environmental layer that exists and all the stages of
relationships that we engage in continually change our beliefs, values and
expectations as we move and grow through what I would refer to as a web. The
family is considered one emotional and functional unit whereby individuals
cannot be understood in isolation from one another, are interconnected and
interdependent of the whole. A family with an autistic child grows through
various life cycle stages. The life cycles stages represent the relationships in
which we engage, the environmental systems of layers that we live in that are bi-
directional, the stage of learning that are fluid, the existence of self determination
and self-efficacy as it relates to motivation and expectancy all are part of a
growing evolution of self with what can be called Adam’s web. Adam’s web is a
pictorial reference of how individuals develop, noting that the process is fluid and
71
continually changing and allows for a better understanding of expectations and
outcomes (see Figure 6).
Figure 6. Adam’s Web
72
Educational Implications
The marked increase in the number of children diagnosed with ASD has
had a profound effect on families, schools, and communities (Simpson, 2008).
The ability to provide educational services and positive experiences for what is a
growing population at a post-secondary level is a challenge and an opportunity.
The results of this archival study can impact the education practices for post-
secondary transition for individuals on the ASD by providing suggestions for
policy and practice for educational leaders and adds to the body of research in the
area of disability and post-secondary education.
Educational Implications for Practice/Training
Low average means values and low skewness variables support the need
for training of educators in preparing students for post-secondary outcomes. This
has educational impact on teacher education programs and professional
development at both the secondary and post-secondary levels.
The ability of young adults with ASD’s to advocate for themselves with
the disability resource center and with professors to ensure they receive
appropriate accommodations is an important transition related issue opportunity
to provide development for young adults and college students with ASD with the
integrative self-determination themes of persistence, competence, career decision
making and self-realization. IDEA guarantees special education services for all
eligible students in high school, but no longer applies once a student leaves the
public school system. Although services are available at the post-secondary level,
73
disclosure is necessary to receive accommodations based on the ADA. In most
college settings, and often an overlooked fact, students are responsible for
advocating for themselves, meaning that they must initiate contact with the
school’s disabilities office to disclose their disability and must approach
professors to indicate the accommodations that they will need to be successful
(Williams & Palmer, 2004).
Promoting self-determination has emerged relatively recently as a
recommended practice for equipping young adults with disabilities for life after
high school (Pierson, Carter, Lane & Glaeser, 2008). Efforts to enhance self-
determination should be woven throughout multiple transition domains, promoted
in diverse settings, and addressed in conjunction with other related skill deficits
combining instruction into a more comprehensive intervention approach (Pierson
et al., 2008).
Although secondary education teachers must incorporate self-knowledge
opportunities and competencies into transition planning, monitor social support
development, and teach and evaluate students’ self advocacy skills, awareness
training, understanding of the disorder and challenges faced by students with an
ASD for all faculty, administrators and staff who interact with and serve these
young adults in a post-secondary environment are critically needed at the post-
secondary level.
Awareness and training for faculty of how to teach and deal with
behavioral issues for students with an ASD is vital. Faculty and educators need a
better understanding of strength-based approaches that accentuate the positive and
74
more time to compare observations, develop common understandings and mutual
expectations (Anderson, Meyer & Somers, 2006). Opportunities exist for post-
secondary institutions to be a driver in meeting the unique needs of this
population by creating and implementing training programs and professional
development opportunities at the post-secondary level that require the
participation of all faculty, staff and administrators thus constructing the ability to
have impact and implication on existing practices.
Another impact on education would be for the state department of
education to require teachers working with students with an ASD to hold a
certificate of teaching specifically in the area of autism spectrum disorders. The
requirement would provide opportunity for colleges and universities to offer
programs and courses for credit or professional development for students in the
area of autism spectrum disorders. The requirement by the department of
education and program of study at the college level would provide more specified
training for teachers working with this population of students.
Educational Implication for Legislation
The data suggests that students are interested in post-secondary education
as indicated by high correlation values. The data also provides a listing of
elements supported by theory that are perceived critical to include in the
development of post-secondary transition programs for students with an ASD.
At the post-secondary level, the American with Disabilities Act (ADA,
1990) and Section 504 of the Rehabilitation Act of 1973 (504, 1973) are the
75
primary mandates for the provision of assistance, usually in the form of
accommodations and services (Graetz & Spaminato, 2008). The American
Disabilities Act of 1990 and Section 504 of the Rehabilitation Act of 1973 are
intended to prevent any form of discrimination against individuals with
disabilities and ensure that persons cannot be discriminated against in obtaining
higher education simply based on their disability. Any university or college
receiving federal support is required to provide services for individuals with
disabilities. Most personnel in college or university offices of disability support
may not understand the complexities of the ASD diagnosis and although the
academic supports may provide some assistance, the greater issues of social and
emotional well-being and coping with feelings of fear, anxiety and excessive
stress may go unaddressed, especially for those with an ASD (Graetz et al, 2008).
However, there is great opportunity to impact education by exploring the
opportunity for collaboration between high schools and post-secondary
institutions to offer college level courses to those students ages 18-21 who are still
covered under IDEA. As discussed earlier, IDEA mandates the provision of
assistance for students with disabilities at the secondary level and applies to the
public school system, but no longer protects students once they graduate, leave
the school system or become ineligible at age 22. The ability to offer college
level courses to students with an ASD while still covered under IDEA provides
opportunity to minimize costs usually borne by the college, maximize post-
secondary educational opportunities for a student with an ASD and aid in
transitional issues. As Zager (2006) indicates:
76
Legislation does not specify a particular setting for the
provision of secondary services for students with
disabilities, but does direct educators to offer services in the
least restrictive environment possible……and in proximity
to non-disabled peers.…..College-based inclusion programs
offer opportunities for the continuation of academic and
communication instruction in the presence of
chronologically age-appropriate peers……It is possible to
provide a full array of education services on college
campuses, to students with an ASD, aged 18-21, using
funds available through students' public schools ( p.432).
Through collaborative planning among public school personnel and
university personnel, students with ASD can participate in the selection of college
classes, engage in vocational training experiences, receive speech-language and
counseling services, and participate in college-sponsored social activities (Alpern,
Salisch, Klainberg, & Zager, 2006).
Educational Implications for Strategic Leadership
Low average means values and low skewness variables support the need
for training of educators in preparing students for post-secondary outcomes. This
has educational impact on teacher education programs and professional
77
development providing education leaders the ability to meet the needs of what is a
growing population.
As more students with an ASD are attending post-secondary institutions,
the potential to open the door to higher education and raise the often low
expectations that are placed on students with as ASD is great (Grigal, et al.,
2004). The potential to raise the bar for the professionals serving these students
and eliminating real or perceived inflexibility in structures that persist can be
achieved. Post-secondary institutions have the ability to challenge and create
educational opportunities that not only include the critical program elements
perceived necessary to include in the development of successful post-secondary
transition programs for young adults with an ASD, but quash a common
misunderstanding among secondary teachers that have difficulty seeing the wide
array of possibilities for students in post-secondary education and therefore focus
on those activities with which they are most comfortable, such as employment
(Neubert et al., 2004).
Post-secondary institutions should be challenged to create programs and
awareness that aid in the ability to understand students' lack of participation in
college courses, campus activities including social and recreational opportunities,
and other factors that may influence enrollment, including student goals, family
values, teacher priorities, and, of course, the attitudes and level of acceptance of
college personnel. Other areas to review in the creation of successful transition
programs would be scheduling, transportation and residential options. In
addition, understanding that an increased reliance on structures, systems, and
78
people that remain with the student after high school is the heart of transition
planning and the need to know more about how to monitor and evaluate the
practices that are occurring in post-secondary settings for young adults with an
ASD is imperative.
Post-secondary institutions have the opportunity to respond to the unique
needs of this growing population by reviewing the services and supports provided
through the disability resource offices. Post-secondary institutions can offer
additional services and supports that will aid in the success, retention and
graduation of this group of students and ultimately impact overall retention and
graduation rates of the institution. As Adreon and Durocher (2007) indicate:
Many individuals with an ASD need the type of supports
commonly provided to students with learning disabilities which
include: preferential seating, note takers, tape-recorded lectures,
ability to take exams in quiet and less distracting environments,
and extra time for exam taking. Other accommodations that could
be helpful beyond the scope of what universities typically provide
include: additional assistance with course selection; course
exemptions or substitutions; permission to avoid group projects,
group discussions, laboratory assignments and group seating
arrangements; oral exams rather than written exams; flexibility in
assignment due dates; flexibility in scheduling of classes and
“permission to attend other sections of the same course” if “you
suffer anxiety attacks or bouts with depression that interfere with
79
your ability to function;” Assistance in developing study skills and
organizational skills as well as assistance with long term projects
might be necessary. (p.276)
Educational Impact for Resources and Cost
The cost to implement successful post-secondary programs for young
adults with an ASD and professional development opportunities for faculty and
staff will face higher education leaders for the foreseeable future. Inconsistencies
among the varied post-secondary institutions in the ability to meet the needs of
students with ASD’s continue (Agnello, 2010) and while how important decisions
are made from institution to institution, resources tend to be political and
ultimately in need of support from the policy makers to develop change. The
initiative for post-secondary institutions is to begin to recognize and address how
to accommodate the needs of this growing population and make the needs a
priority.
Other Educational Impacts
Other educational impacts include the opportunities to partner with
community agencies and organizations to develop stronger links with community
personnel affording students and their families the opportunity to become better
prepared for transition from high school to post-secondary education experiences.
80
Limitations
One of the limitations of this study is that the researcher had no control
over how data was collected as archival data was used. Evidence of reliability and
evidence of validity are assumed as written. Although safeguards for the
collection and integrity of the data appeared to be in place, some data elements
were missing from some of the records, but these were fields not used in the
present study. The type of demographic information collected and other questions
asked, limited the ability to determine if the archival data could support and give
credence in identifying whether various levels of the ecological systems in theory
actually existed.
Another limitation was that the population sample was small so that
generalizations to larger populations may prove to be limited. The geographical
span of the survey was limited to the greater Phoenix metropolitan area and the
populations of both groups were homogeneous in ethnicity. The ethnicity of the
populations sampled was 88% white for the young adults sampled and 85% white
for parents. 81% of the parent responders were female. The high percentage of
homogeneous representation in both gender and ethnicity questions whether the
responses can be applied to larger non-homogenous populations.
Additional research can replicate the original study to verify these results,
determine whether similar findings can be obtained in different geographical
settings and whether balanced ethnic representation can be found. The majority
of the parent responders were married (.70), but only one parent of the young
adult with an ASD responded. The response of the other spouse is unknown and
81
questions whether the spouse of the married respondent would respond in the
same manner. Future studies should include both parents as responders, if they
are married. Although not a limitation, the original study surveyed students who
had already graduated from high school. Future studies could include a survey of
high school seniors and the expectations of post-secondary transition programs.
The ability to understand whether pre-high school graduates and high school
graduates share the same expectations relating to post-secondary education and
opportunities may prove to be irrelevant.
Future Research
If students with an ASD are to be successful in their transition to post-
secondary programs, a need for additional research, new legislation, awareness
education of all educational professionals and leaders, and implementation of new
programs exists which in turn will impact current policies and practices for post-
secondary institutions.
Part of the conclusions and recommendations of this study is to
recommend additional research, new legislation, and future education of all
educational professionals and leaders giving rise to new ways in which to impact
policy and practices in the area of disability and post-secondary education.
For future studies, controls for evidence of reliability and validity need to
be reviewed. The type of demographic information to be collected in future
studies should be reviewed in relation to theoretical frameworks to give credence
to understanding various levels of the theory. For example in the mesosystem of
82
the ecological theory, understanding expectations that the parent and school
interactions are important warrants inclusion of the expectations of educators and
education professionals.
Longitudinal studies could be conducted to follow up on the original
survey responders and the outcome of the post-secondary experience. A study
could be conducted that followed the young adults and parents several years to
see what impact the original expectations had, if any on the post-secondary
experience and whether the critical program elements perceived to be necessary
were actually relevant.
Further study needs to be performed so that research can be summarized
for those looking to develop and implement successful transition programs at the
post-secondary level for young adults with an ASD and include the critical
program elements that are identified as part of the larger study. Once programs
are implemented, future research needs to be conducted to evaluate program
components and the extent to which the programs are successful and effective in
the post transition of students. If correlations exist among the consensus of
parents/caregivers and the young adults, creating such programs that support the
successful transition of young adults should accommodate the individual and not
the disability (Ivey, 2004).
The world of autism and ASD’s already consists of an overwhelming
myriad of decisions about treatment, interventions, programs and resources
leaving very little information about transition to post-secondary environments.
Further research on the topic of transition planning for young adults with an ASD
83
is critically needed to better assist in a very arduous process. The current study
evoked other topics in need of further exploration to understand the transition
process of the young adult in general.
Further research should explore the opportunity for collaboration between
high schools and post-secondary institutions for offering college level courses to
those students ages 18-21 who are still covered under IDEA. The ability to offer
college level courses to students with an ASD while still covered under IDEA
provides opportunity to minimize costs usually borne by the college and aid in
transitional issues.
Future research should include initiatives to review, create or change
legislation addressing the needs of young adults with an ASD and how it relates to
post-secondary education. If students ages 18-21 are able to attend a college class
with support from the local school system under IDEA, why can’t support last
until they are 25 years old?
The need for educators and professionals to understand the concept of self
advocacy will be imperative for students with an ASD to encounter positive
experiences at the post-secondary level. Further research addressing perceptions
of both faculty at post-secondary institutions inclusive of years of experience and
experience in teaching students with an ASD and staff of post-secondary
disability resource offices would provide additional indications for professional
development for both faculty and staff, inclusion of critical program elements
perceived to be necessary in development of post-secondary transition programs

84
and ability to review services currently offered through the disability resources
offices at post-secondary institutions.
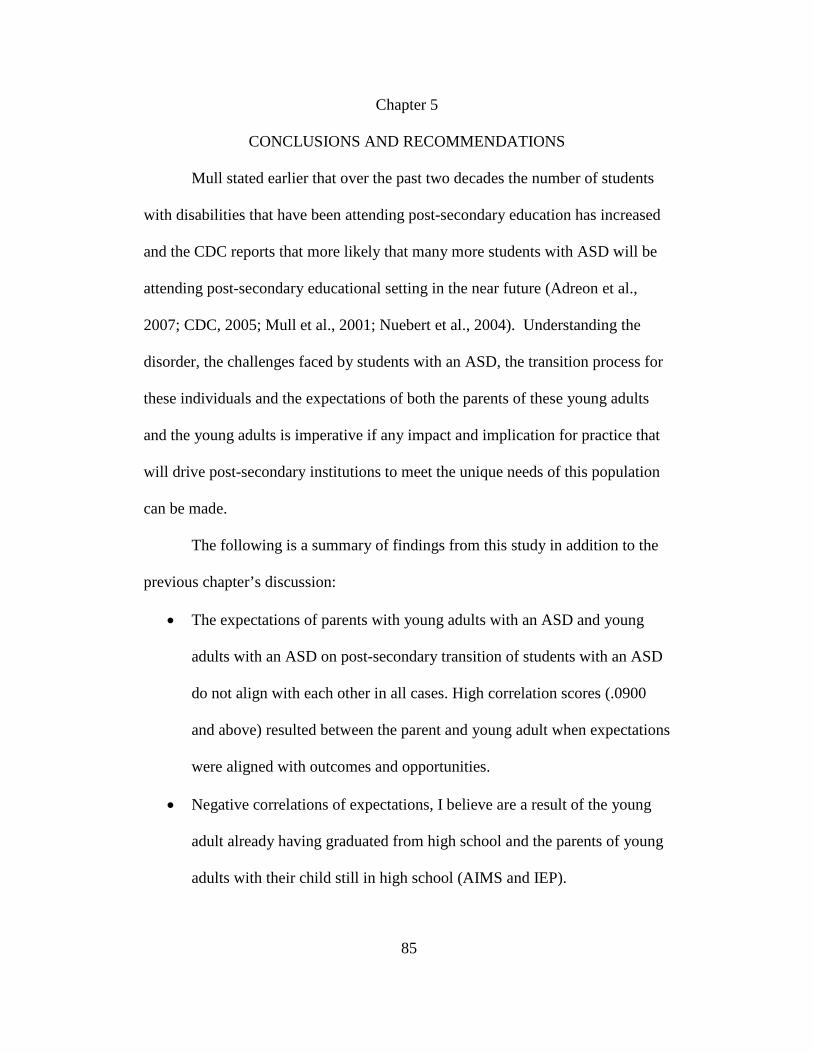
85
Chapter 5
CONCLUSIONS AND RECOMMENDATIONS
Mull stated earlier that over the past two decades the number of students
with disabilities that have been attending post-secondary education has increased
and the CDC reports that more likely that many more students with ASD will be
attending post-secondary educational setting in the near future (Adreon et al.,
2007; CDC, 2005; Mull et al., 2001; Nuebert et al., 2004). Understanding the
disorder, the challenges faced by students with an ASD, the transition process for
these individuals and the expectations of both the parents of these young adults
and the young adults is imperative if any impact and implication for practice that
will drive post-secondary institutions to meet the unique needs of this population
can be made.
The following is a summary of findings from this study in addition to the
previous chapter’s discussion:
• The expectations of parents with young adults with an ASD and young
adults with an ASD on post-secondary transition of students with an ASD
do not align with each other in all cases. High correlation scores (.0900
and above) resulted between the parent and young adult when expectations
were aligned with outcomes and opportunities.
• Negative correlations of expectations, I believe are a result of the young
adult already having graduated from high school and the parents of young
adults with their child still in high school (AIMS and IEP).
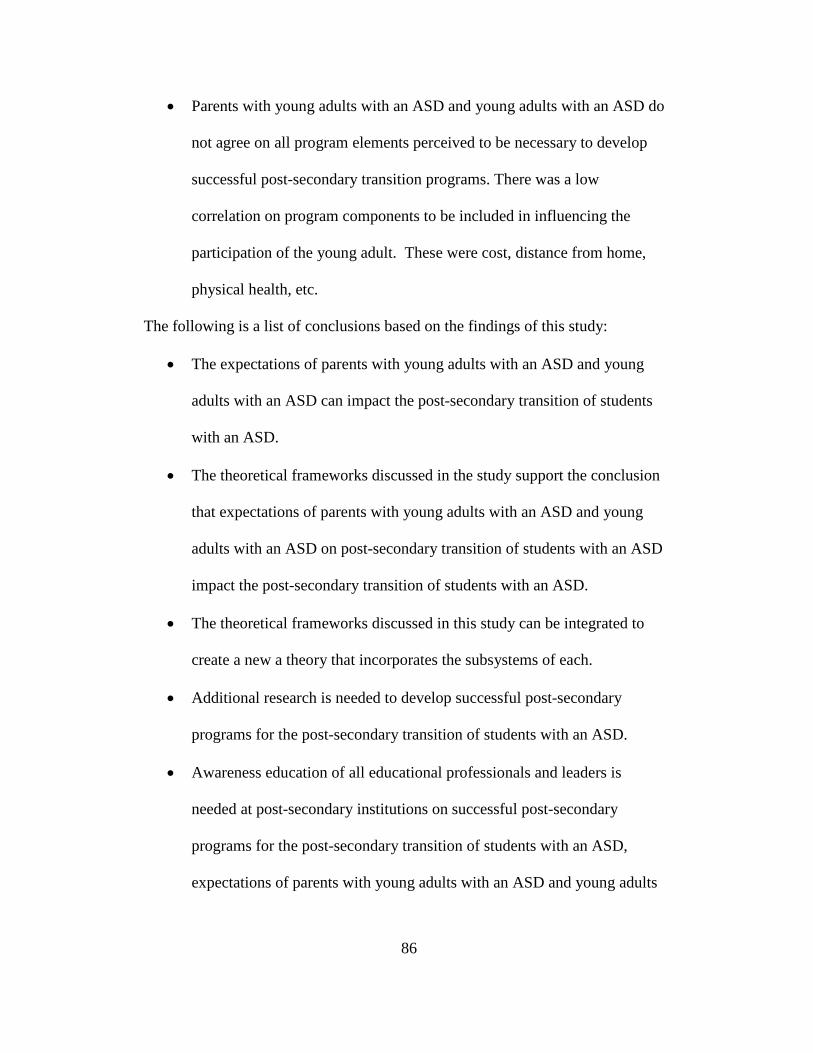
86
• Parents with young adults with an ASD and young adults with an ASD do
not agree on all program elements perceived to be necessary to develop
successful post-secondary transition programs. There was a low
correlation on program components to be included in influencing the
participation of the young adult. These were cost, distance from home,
physical health, etc.
The following is a list of conclusions based on the findings of this study:
• The expectations of parents with young adults with an ASD and young
adults with an ASD can impact the post-secondary transition of students
with an ASD.
• The theoretical frameworks discussed in the study support the conclusion
that expectations of parents with young adults with an ASD and young
adults with an ASD on post-secondary transition of students with an ASD
impact the post-secondary transition of students with an ASD.
• The theoretical frameworks discussed in this study can be integrated to
create a new a theory that incorporates the subsystems of each.
• Additional research is needed to develop successful post-secondary
programs for the post-secondary transition of students with an ASD.
• Awareness education of all educational professionals and leaders is
needed at post-secondary institutions on successful post-secondary
programs for the post-secondary transition of students with an ASD,
expectations of parents with young adults with an ASD and young adults
87
with an ASD on post-secondary transition and on students with an ASD in
general.
• Development and implementation of new programs that will impact policy
and practices is needed to develop successful post-secondary programs for
the post-secondary transition of students with an ASD.
• New legislation is needed to support students with an ASD and the
development, implementation and integration of successful post-secondary
programs at the post-secondary institutions for students with an ASD.
Summary
This study identified critical program elements perceived necessary to
include in developing successful post-secondary transition programs. The study
impacts the education practices for post-secondary transition programs for
students with an ASD by providing suggestions for policy and practice for
educational leaders and adds to the body of research in the area of disability and
post-secondary education.
If students with an ASD are to be successful in their transition to post-
secondary programs, additional research, new legislation, awareness education of
all educational professionals and leaders, and implementation of new programs
that will impact policy and practices is needed. In higher education, the
individual needs of each student must be accommodated, not the disability (Ivey,
2004).
88
REFERENCES
Addison, J. T. (1992). Urie Bronfenbrenner. Human Ecology, 20(2), 16-20. Agnello, B. A. (2010). Coping with autism: The parental journey of adjustment.
ProQuest, UMI Dissertations Publishing. ProQuest Dissertations and Theses, n. a. Retrieved from http://login.ezproxy1.lib.asu.edu/login?url=http://search.proquest.com/docview/807421894?accountid=4485.
Adreon, D., & Durocher, J. S. (2007). Evaluating the college transition needs of
individuals with high-functioning autism spectrum disorders. Intervention in School and Clinic, 42, 271-279.
Agnello, B. (2010). The parental journey of adjustment ProQuest, UMI
Dissertations Publishing ProQuest Dissertations and Theses, n/a. Retrieved from 3427229.
Agran, M., & Hughes, C. (2008). Asking student input: Students’ opinion.
Exceptional Individuals, 31, 69-76. Alpern, C. S., & Zager, D. (2007). Addressing communication needs of young
adults with autism in a college-based inclusion program. Education and Training in Developmental Disabilities, 42 (4), 428-436.
American with Disabilities Act (ADA) of 1990, as amended. (2008). In ADA
Amendments Act of 2008 (P. L. 110-325). Retrieved from http://www.ada.gov/pubs/ada.htm.
Anctil, T., Ishikawa, M. E., & Tao Scott, A. (2008). Academic identity
development through self-determination: Successful college students with learning disabilities. Career Development for Exceptional Individuals, 24, 164-174.
Anderson, J. A., Meyer, L. D., & Somers, J. W. (2006). The impact of system-of-
care participation on school functioning: Exploring caregiver and teacher perspectives. Preventing School Failure, 50(3), 13-20. Retrieved from http://www.taylorandfrancisgroup.com
Baer, R.M., Flexer, R. W., Beck, S., Amsutz, N., Hoffman, L., Brothers, J.,
Stelzer, D., & Zechman, C. (2003). A collaborative follow up study on transition service utilization and post-school outcomes. Career Development for Exceptional Individuals, 26, 7-25.
89
Bandura, A. (1977). Self-efficacy: Toward a Unifying Theory of Behavioral Change, Psychological Review 1977, 84(2), 191-215.
Bandura, A. (1986). Social foundation of thought and actions: A social cognitive
theory. New Jersey: Prentice-Hall. Bandura, A. (1995). Self-efficacy in changing societies. New York: Cambridge
University Press. Bandura, A., (1997). Self-efficacy: The exercise of control. New York: Freeman. Barbazette, J. (2006). What is needs assessment? In Training Needs Assessment.
San Francisco, CA: Pfeiffer, an Imprint of Wiley. Retrieved from www.pfeiffer.com.
Barclift, C. (2010). Parental advocacy for students with autism. ProQuest, UMI
Dissertations Publishing. ProQuest Dissertations and Theses, n/a. Retrieved from http://login.ezproxy1.lib.asu.edu/login?url=http://search.proquest.com/docview/205403807?accountid=4485
Baskin, A. (2008). Empty Nest Envy. More.ca. Retrieved November 10, 2009
from http://www.more.ca/relationships/family-and-friends/empty-nest-envy/a/18861.
Berk, L. E. (2000). Child Development (5th edition). Boston: Allyn and Bacon.
23-38. (Paquette & Ryan, 2001). Betz, N., & Hackett, G. (1981). The relationship of career-related self-efficacy
expectations to perceived career options for college women and men. Journal of Counseling Psychology, 28, 399–410.
Blacher, J., Kraemer, B. R., & Howell, E. J. (2010). Family expectations and
transition experiences for young adults with severe disabilities: Does syndrome matter? Advances in Mental Health and Learning Disabilities, 4(1), 3-16. Retrieved from http://login.ezproxy1.lib.asu.edu/login?url=http://search.proquest.com/docview/742984869?accountid=4485
Blackorby, J., & Wagner, M. (1996). Longitudinal post school outcomes of youth
with disabilities: Findings from the National Longitudinal Transition Study. Exceptional Children, 62, 399-413.
Bronfenbrenner, U. (1979). The ecology of human development: Experiments by
nature and design. Cambridge, MA: Harvard University Press.
90
Bronfenbrenner, U. (1984). The changing family in a changing world: America
first? Peabody Journal of Education, 61(3), 52-70. Bronfenbrenner, U. (1986). Ecology of the family as a context for human
development: Research perspectives. Developmental Psychology, 22(6), 723-742.
Bronfenbrenner, U. (1990). Discovering what families do. In rebuilding the nest:
A New commitment to the American family. Family Service America [web site]. Retrieved from http://www.montana.edu/www4h/process.html.
Bronfenbrenner, U., McClelland, P., Wethington, El., & Moen, P. (1996). The
state of Americans: This generation and the next. New York: The Free Press.
Browning, J., Osborne, L. A., & Reed, P. (2009). A qualitative comparison of
perceived stress and coping in adolescents with and without autistic spectrum disorders as they approach leaving high school. British Journal of Special Education, 36, 36-43.
Camarina, P. M., & Sarigiani, P. A. (2009). Post-secondary educational
aspirations of high-functioning adolescents with autism spectrum disorders and their parents. Focus on Autism and Other Developmental Disabilities, 24, 115-128.
Carter, E.W., Lane, K., Pierson, M. R., & Glaesser, B. (2006). Self-determination
skills and opportunities of transition-age youth with emotional disturbance and learning disabilities. Exceptional Children, 72, 333-349.
Caruso, A., & Crawford, S. (2011). Transition and post-secondary life. In K. M.
McCoy (Ed.): Autism from the teacher’s perspective. (pp. 395 – 427). Denver, CO: Love Publishing.
Causton-Theoharis, J., Ashby, C., & DeClouette, N. (2009). Relentless optimism:
Inclusive post-secondary opportunities for students with significant disabilities. Journal of Post-secondary Education and Disability, 22, 88-105.
Centers for Disease Control [CDC], (2005). How common is autism spectrum
disorder (ASD)? Retrieved November 22, 2005, from http://www.cdc.gov/ncbddd/autism/.
Centers for Disease Control (CDC). (2007). Prevalence of autism spectrum
disorders – Autism and developmental disabilities monitoring network, 14

91
sites, United States, 2002. Surveillance Summaries MMWR 2007, 56 (No. SS-1).
Centers for Disease Control and Prevention (CDC), (2006). Mental health in the
United States: Parental report of diagnosed autism in children aged 4-17 years – United States, 2003-2004. MMWR: Morbidity and Mortality Weekly Report, 55, 481-486.
Centers for Disease Control and Prevention [CDC], (2009). Prevalence of autism
spectrum disorders – autism and developmental disabilities monitoring network, United States, 2006. Morbidity and Mortality Weekly Report, 56, SS-1.
Chadsey-Rusch, J., Rusch, F. R., & O’Reilly, M. F. (1991). Transition from
school to integrated communities. Remedial and Special Education, 12 23-33.
Chambers, C. R., Hughes, C. & Carter, E. W. (2004). Parent and sibling
perspectives on the transition to adulthood. Education and Training in Developmental Disabilities, 39, 79-94.
Clement-Heist, K., Siegel, S., & Gaylord-Ross, R. (1992). Stimulated and in situ
vocational social skills training for youths with disabilities. Exceptional Children, 58, 336-345.
Condrey, S. E. (2005). Expectancy Theory. Wikipedia, the free encyclopedia.
Retrieved from http://en.wikipedia.org/wiki/Expectancy_theory. p. 482. Conscious and Competence (n.d.) Retrieved from
http://changingminds.org/explanations/learning/consciousness_competence.htm.
Crosby, P. H. (2010). Parent perceptions and observations of their children with
autism age 14-to-26 concerning generalization of daily living skills at home and in the community. ProQuest Information & Learning). Dissertation Abstracts International Section A: Humanities and Social Sciences, 71(3) Retrieved from http://login.ezproxy1.lib.asu.edu/login?url=http://search.proquest.com/docview/787017539?accountid=4485
Dean, M. & W. Huitt (August 1999). Neighborhood and community. Educational
Psychology Interactive. Valdosta, GA: Valdosta State University. Disability. (2003). Social trends and indicators USA. In A. J. Arsen (Ed.), Health
and Sickness, 3, 223-245. Retrieved May 01, 2006 from Gale Virtual
92
Reference Library via Thomson gale: http://0.galegroup.com.oasis.oregonstate.edu: 80/gvrl/start.do?prodid=GVRL.
Dombeck, M. (2005). Urie Bronfenbrenner and Child Development. Retrieved
March 10, 2009, from http://www.mentalhelp.net/poc/view_doc.php?type=doc&id7930&cn=28.
Donahue, K., Weinstein, R., Cowan, P., & Cowan, C. (2000). Patterns of
teachers’ whole-class perceptions and predictive relationships between teachers’ and parents’ perception of individual child competence. Early Childhood Research Quarterly, 15, 279-305.
Doran, B., Bulls, M., & Benz, M. R. (1996). Predictors of victimization
experiences of adolescents with disabilities in transition. Exceptional Children, 63, 7-18.
Eccles, J. (1983). Expectancies, values, and academic behaviors. In J. T. Spence
(Ed.), Achievement and achievement motives: Psychological and sociological approaches (pp. 75–146). San Francisco: Freeman.
Ecological Systems Theory. (n.d.). From Wikipedia, the free encyclopedia.
Retrieved from http://www.google.com/imgres?imgurl=http://geopolicraticus.files.wordpress.com/2011/01/ecological-systems-theory.jpg&imgrefurl=http://geopolicraticus.wordpress.com/2011/01/12/integral-ecology/&h=340&w=344&sz=28&tbnid=_D7GKbAtFJCfqM:&tbnh=119&tbnw=120&prev=/images%3Fq%3Dbronfenbrenner%27s%2Becological%2Bsystems%2Btheory&zoom=1&q=bronfenbrenner%27s+ecological+systems+theory&hl=en&usg=__H_z6jYs-MrSqzl0zD1_4DR4lFMY=&sa=X&ei=TilxTenWLI64sQOznZC3Cw&ved=0CDAQ9QEwBA
Edgar, E. (1987). Secondary programs in special education: Are many of them
justifiable? Exceptional Children, 53, 555-561. Edwards, P., & Young, L. (1992). Beyond parents: Family, community, and
school involvement. Phi Delta Kappan, 74, 72-80. Entwisle, D., & Baker, D. (1983). Gender and young children’s expectation for
performance in arithmetic. Developmental Psychology, 19, 200–209.
93
Everson, J., M., Zhang, D., & Gullory, J., D. A statewide investigation of individualized transition plans in Louisiana. Career Development for Exceptional Individuals, 24, 37-49.
Expectancy Theory. (n.d.) From Wikipedia, the free encyclopedia. Retrieved
from http://en.wikipedia.org/wiki/Expectancy theory. Family Systems Theory. (1977). Retrieved from
http://www.csun.edu/~whw2380/542/Family%20Developmental%20Theory.htm
Field, S. S., & Hoffman, A., (1999). The importance of family involvement for
promoting self-determination in adolescents with autism and other developmental disabilities. Focus on Autism and Other Developmental Disabilities, 14, 36-41.
Field, S. S., Martin, J. E., Miller, R. J., Ward, M., & Wehmeyer, M. L. (1998).
Self-determination for persons with disabilities: A position statement of the Division on Career Development and Transition. Career Development for Exceptional Individuals, 21, 113-128.
Fischbach, G. (2011). Is autism an epidemic? Big Think Editors-Breakthroughs:
Autism series. Retrieved from http://bigthink.com/ideas/26705. Fullerton, A., & Coyne, P., (1999). Developing skills and concepts for self-
determination in young adults with autism. Focus and Other Developmental Disabilities, 14 (1), 42- 63.
Galvin, D. M. (2000). Parents of children with autism: Psychosocial functioning,
social cognitions, and perception of services. Ph.D. dissertation, University of Kansas, United States -- Kansas. Retrieved from Dissertations & Theses: Full Text. Publication No. AAT 9985110).
Getzel, E. E. & Thoma, C. A. (2008). Experiences of college students with
disabilities and the importance of self-determination in higher education settings. Career Development for Exceptional Individuals, 31, 77-84.
Goldenberg, I., & Goldenberg, H. (2003). Family therapy: An overview (6th Ed.).
Pacific Grove, CA: Brooks/Cole. Retrieved from http://www.cccfcs.com/uploads//Family%20Studies/FS%2009/Autism.pdf
Graetz, J.E., & Spaminato, K. (2008). Asperger’s syndrome and the voyage
through high school: Not the final frontier. Journal of College Admission, 198, 19-24.
94
Griffin, M., M., McMillan, E. D., & Godapp, R., M. (2009). Family perspectives in post-secondary education for students with intellectual disabilities. Education and Training in Autism and Developmental Disabilities, 45(3), 339-346.
Grigal, M., Moon, M. S., & Neubert, D. A., (2004). Activities of Students with
significant disabilities receiving services in post-secondary settings. Education and Training in Developmental Disabilities, 39(1), 16-25.
Grigal, M., & Neubert, D. A., (2004). Parents’ in school values and post-school
expectations for transition-aged youth with disabilities. Career Development for Exceptional Individual, 27, 65-85.
Grigal, M., Neubert D. A., Moon, S. M., & Graham, S. (2003). Self-
determination for students with disabilities: Views of parents and teachers. Exceptional Children, 70, 97-112.
Grounded Theory. (n.d.). From Wikipedia, the free encyclopedia. Retrieved
from: http://en.wikipedia.org/wiki/Grounded_theory. Guralnick, M.J., & Bennett, F.C. (1987). Early intervention for at-risk and
handicapped children: Current and future perspectives. In M.J. Guralnick & F.C. Bennett (Eds.), The effectiveness of early intervention for at-risk and handicapped children (pp.365-382). Orlando: Academic Press.
Hadre, P. L., & Reeve, J. (2003). A motivational model of rural students’
intentions to persist in, versus drop out of, high school. Journal of Educational Psychology, 95, 347-356. (Pierson, 2008).
Hanish, M. (2010). Post-secondary transition in individuals on the autism
spectrum. (Unpublished master’s thesis). Arizona State University. Tempe, Arizona
Haring, K. A., Lovett, D. L., & Smith, D. D. (1990). A follow-up study of recent
supported employment graduates of learning disabilities programs. Journal of Learning Disabilities, 23, 108-113.
Hart, D., Mele-McCarthy, J., Pasternack, R. H., Parker, R. D., & Zimbrich, K.
Community college: A pathway to success for youth with learning, cognitive, and intellectual disabilities in secondary settings. Education and Training in Developmental Disabilities, 39, 54-66.
Hart, D., Zafft, C., & Zimbrich, K. (2004). College career connection: A study of
youth with intellectual disabilities and the impact of post-secondary
95
education. Education and Training in Developmental Disabilities, 39, 45-53.
Hasazi, S. B., Gordon, L. R., & Roe, C. A. (1985). Factors associated with the
employment status of handicapped youth exiting high school from 1979 to 1983. Exceptional Children, 51, 455-469.
Heat, L. W., Rubin, S. S., & Rush, F. R. (1998). Residential independence of
former special education high school students: A second look. Research in Developmental Disabilities, 19, 1-26.
Henderson, Z. P. (1995). Renewing our social fabric. Human Ecology, 23(1), 16-
19. Hendricks, D. R. & Wehman, P. (2009). Transition from school to adulthood for
youth with autism spectrum disorders. Focus on Autism and Other Developmental Disabilities, 24, 77-88.
Hill, P. D. (2009). Mothers of students with autism: Their experiences with public
education. ProQuest, UMI Dissertations Publishing. ProQuest Dissertations and Theses, n. a. Retrieved from http://login.ezproxy1.lib.asu.edu/login?url=http://search.proquest.com/docview/305136592?accountid=4485.
Howell, W.S. (1982). The empathic communicator. University of Minnesota:
Wadsworth Publishing Company, 29-33. Howlin, P. (2000). Outcome in adult life for more able individuals with autism or
Asperger’s syndrome. Autism: The International Journal of Research and Practice, 4, 63-83.
Hubert, C. (2009, June 28). Rise in autistic adults worries caregivers. The
Sacramento Bee. Retrieved October 1st, 2009 from http://www.sacbee.com/ourregion/story/1983338.html.
Hurbutt, K. S. (2008). Taking on the real world: Helping the teenager with
Asperger’s syndrome prepare for the transition from high school to the adult world. Exceptional Parent, 38, 33-35.
Hurbutt, K., & Chalmers, L. (2004). Employment and adults with Asperger’s
syndrome. Focus on Autism an Other Developmental Disabilities, 19, 215-222.
Individual with Disabilities Act (IDEA) of 1990, 20 U.S.C. § 1414 (d) (1) (A)
(vii) (III).
96
Individuals with Disabilities Act (IDEA). (2004). Building the legacy of IDEA
2004. U.S. Department of Education. Retrieved from http://idea.ed.gov/explore/view/p/%2Croot%2Cstatute%2C.
Ivey, J. K. (2004). What do parents expect? A study of the likelihood and
importance issues for children with autism spectrum disorders. Focus on Autism & Other Developmental Disabilities, 19, 27-33.
Karvonen, M., Test, D. W., Wood, W. M., Browder, D., & Algozzine, B. (2004).
Putting self-determination into practice. Exceptional Children, 71, 23-41. Kerr, S. (1995). "On the folly of rewarding A, while hoping for B." Retrieved
from http://en.wikipedia.org/wiki/Motivation. Klin, A., & Volkmar, F. R. (1995). Asperger’s syndrome: Guidelines for
treatment and intervention. Published b the Learning Disabilities Association of American. Retrieved from http://infor.med.yale.edu/chldstdy/autism/astreatments.html.
LaBahn, J. (1995). Education and parental involvement in secondary schools:
Problems, solution, and effects. Educational Psychology Interactive. Valdosta, GA: Valdosta State University.
Laszloffy, T. A. (2002). Rethinking Family Development Theory: Teaching with
the Systemic Family Development (SFD) Model. Family Relation, 51(3), 206-214. Retrieved from http://www.jstor.org/stable/3700136.
Lounds, J., Seltzer, M.M., Greenberg, J.S., & Shattuck, P.T. (2007). Transition
and change in adolescents and young adults with autism: Longitudinal effects of maternal well-being. American Journal on Mental Retardation, 112, 401-417.
Macintosh, K. E., & Dissanayake, C. (2004). Annotation: The similarities and
differences between autistic disorder and Asperger’s disorder: A review of the empirical evidence. Journal of Child Psychology and Psychiatry and Allied Disciplines, 45. 421-434.
Madaus, J. W., Ruban, L., & Zhao, J. (2008). Employment satisfaction of
university graduates with learning disabilities. Remedial and Special Education, 29, 323-332.
Madriaga, M. (2010). ‘I avoid the pubs and the student union like the plague’:
Students with Asperger’s syndrome and their negotiation of university places. Children’s Geographies, 8, 39-50.
97
Mallers, M. H. (2009). Systems theory: Families and autism. California State
University, Fullerton. Fullerton: CA. Retrieved from http://www.cccfcs.com/uploads//Family%20Studies/FS%2009/Autism.pdf
Margolis, H. & McCabe, P. (2006). Improving self-efficacy and motivation:
What to do, what to say. Intervention in School and Clinic, 41 (4), 218-227. Retrieved from http://serc.carleton.edu/resources/37486.html.
Martin, J. E., Woods, L. L., Sylvester, L., & Gardner, J. E. (2005). A challenge of
self-determination: Disagreement between the vocational choices made by individuals with severe disabilities and their caregivers. Research and Practice for Persons with Severe Disabilities, 30, 147-153.
Matsui, T., Ikeda, H., & Ohnishi, R. (1989). Relations of sex typed socializations
to career self-efficacy expectations of college students. Journal of Vocational Behavior, 35, 1–16.
McDonell, J. J., Wilcox, B., Bowles, S.W., & Bellamy, G. T. (1985). Transition
issues facing youth with severe disabilities: Parents’ perspective. Journal of the Association for Persons with Severe Handicaps, 10, 61-65.
McGoldrick, M., & Carter, E. (1980). The family life cycle: A framework for
family therapy. New York: Gardner. Mcintire, L, Kramer, B. R., Blacher, J., & Simmerman, S. (2004). Quality of life
for young adults with severe intellectual disabilities: Mothers’ thoughts and reflections. Journal of Intellectual & Developmental Disability, 29 (2), 131-145.
McIntyne, L. L., Kraemer, B. R., Blacher, J., & Simmerman, S. (2004). Quality
of life for young adults with severe intellectual disability: mothers' thoughts and reflections. Journal of Intellectual & Developmental Disability, Jun2004, Vol. 29 Issue 2, 131-146.
Minuchin, S. (1974). Families and family therapy. Cambridge, MA: Harvard
University Press. Monhan, M. P. (2003). Social skills and problem behavior assessment of general
and special education career and technical education students. Journal for Vocational Special Needs Education, 25, 3-10.
Morrison, J. Q., Sansosti, F. J., & Hadley, W. M. (2009). Parent perceptions of the
anticipated needs and expectations for support for their college-bound
98
students with Asperger’s Syndrome. Journal of Post-secondary Education and Disability, 22, 78-87.
Mull, C., Sitlington, P. L., & Alper, S. (2001). Post-secondary education for
students with learning disabilities: A synthesis of the literature. Exceptional Children, 68, 97-118.
Nadesan, M. H., (2010). The Biopolitics and Bioeconomics of Autism. Autism
through the Lens of the Social Sciences, 1, 37-48. Retrieved from http://www.easterseals.com/site/PageServer?pagename=ntl_mediakit.
National Center for Education Statistics (NCES). (1996). 1995-96 national post-
secondary student aid study (NPSAS: 96), undergraduate data analysis system. Washington, DC: U.S. Department of Education.
National Center for Education Statistics (NCES). (2000). Students with
Disabilities in post-secondary education: A profile of preparation, participation, and outcomes, 1999. Washington, DC: U.S. Department of Education.
National Center for the Study of Post-secondary Educational Supports (NCSPES).
(2002). Preparation for and support of youth with disabilities in post-secondary education & employment: Implications for policy, priorities and practice: Proceedings and briefing book for the national summit on post-secondary education for people with disabilities. Presented in Washington DC, July 8, 2002. Retrieved March 7, 2006 from http://www.ncset.hawaii.edu/summits/july 2002/default.htm.
National Council on Disability (NCD). (2003). People with disabilities and post-
secondary education: A position paper. Retrieved on March 7, 2006 from http://www.ncd.gov/newsroom/publications/2003/education.htm.
Newschaffer, C.J., Falb, M.D., & Gurney, J.D. (2005). National autism
prevalence trends from United States special education data. Pediatrics, 115(3), 277-282.
Nuehring, M. L., & Sitlington, P. L. (2003). Transition as a vehicle: Moving from
high school to an adult vocational service provider. Journal of Disability Policy Studies, 14, 23-35.
Neubert, D., A., Moon, S., M., & Grigal, M. (2004). Activities of students with
significant disabilities receiving services in post-secondary settings. Education and Training in Developmental Disabilities, 39, 16-25.
99
Palmer, C., & Rossler, R. T. (2000). Requesting classroom accommodations: Self-advocacy and conflict resolution training for college students with disabilities. Journal of Rehabilitation, 66, 38-43.
Paquette, D., & Ryan, J., (2001). Bronfenbrenner’s ecological systems theory.
Retrieved from http://pt3.nl.edu/paquetteryanwebquest.pdf. Pierson, M. R., Carter, E. W., Lane, K. L., & Glaeser, B. C. (2008). Factors
influencing the self-determination of transition-age youth with high-incidence disabilities. Career Development for Exceptional Individuals, 31, 115-125.
Phillips, D. (1987). Socialization of perceived academic competence among
highly competent children. Child Development, 58, 1308–1320. Ponticelli, J. E., Russ-Eft, D. (2009). Community college students with
disabilities transfer to a four-year college. Exceptionality, 17, 164-176. Powers, C., Powers, L., & Greenen, S. (2009). Similarities and differences in the
transition expectation of youth and parents. Career Development for Exceptional Individuals, 32, 132-144.
Prince-Hughes, D. (2003). Understanding college students with autism. Chronicle
of Higher Education, 49, 16-18. Quick, D., Lehmann, J., & Deniston, T. (2003). Opening doors for students with
disabilities on community college campuses: What have we learned? What do we still need to learn? Community College Journal of Research and Practice, 27, 815-827.
Rehabilitation Act of 1973 (2011). Retrieved from Wikipedia, the free
encyclopedia: http://en.wikipedia.org/wiki/Rehabilitation_Act_of_1973 - 3-4-2011.
Retish, P. (1989). Education and transition: Is there a relationship? Career
Development for Exceptional Individuals, 12, 36-69. Reynolds, A., & Gill, S. (1994). The role of parental perspective in the school
adjustment of inner-city black children. Journal of Youth and Adolescence, 23, 671–694.
Roessler, R. T., Brolin, D. E., & Johnson, J. M. (1990). Factors affecting
employment success and quality of life: A one year follow-up of students in supported employment. Career Development for Exceptional Individuals, 13, 95-107.
100
Russo Jamerson, D. (2007). Self-determination and success outcomes of two-year
college students with disabilities. Journal of College Reading and Learning, 37, 26-46.
Sadler, S., Held, M. F., Saddler, S. (2002). Transition assessment practices in
Nevada and Arizona: Are they tied to best practices? Focus on Autism & Other Developmental Disabilities, 17, 242-250.
Scher, J. (2011). Parenting children with autism: Expectations for future
outcomes. Psy.D. dissertation, University of Hartford, United States -- Connecticut. Retrieved February 16, 2011, from Dissertations & Theses: Full Text. (Publication No. AAT 3374206).
Scuccimarra, D., & Speece, D. (1990). Employment outcomes and social
integration of students with mild handicaps: The quality of life two years after high school. Journal of Learning Disabilities, 23, 213-219.
Simpson, R. L. (2008). Children and youth with autism spectrum disorders: The
search for effective methods. Focus on Exceptional Children, 40(7), 1-14. Retrieved from http://www.lovepublishing.com/index/html.
Smith, C. P. (2007). Support services for students with Asperger’s Syndrome in
higher education. College Student Journal, 41, 515-531. Smith, T. E. (2001). Section 504, the ADA, and public schools. Retrieved from
http://www.ldonline.org/article/6108. Steinmetz, E., (2004). Americans with disabilities: 2002. Current Population
Reports, P70-107, U.S. Census Bureau, Washington, DC. 2004. Taylor, M. J. (2005). Teaching students with autistic spectrum disorders in HE.
Education &Training, 47, 484-495. Trainor, A. A. (2005). Self-determination perceptions and behaviors of diverse
students with LD during the transition planning process. Journal of Learning Disabilities, 38, 233-249.
VanBergeijk, E., Klin, A., & Volkmar, F. (2008). Supporting more able students
on the autism spectrum: College and beyond. Journal of Autism and Developmental Disorders, 38, 1359-1370.
Volkmar, F.R., & Weisner, L.A. (2009). Adolescence, adulthood, and the future.
A Practical Guide to Autism: What Every Parent, Family Member, and Teacher Needs to Know (277-323). Hoboken, NJ: John Wiley & Sons, Inc.

101
Wahlberg, T., Rotatori, A. F., & Desinger, J. (2003). Applications for students
with autism spectrum disorders. Advances in Special Education, 15, 195-232.
Wehman, T. (1998). Family-centered early intervention services: Factors
contributing to increased parent involvement and participation. Focus on Autism and Other Developmental Disabilities, 13 (2), 80-86.
Wehmeyer, M. L., Palmer, S.B., Soukup, J. H., Gamer, N. W., & Lawrence, M.
(2007). Self-determination and student transition planning knowledge and skills: Predicting involvement. Exceptionality, 15, 31-44.
Wehmeyer, M. L., & Palmer, S. B. (2003). Adult outcomes for students with
cognitive disabilities three years after high school: The impact of self-determination. Education and Training in Developmental Disabilities, 38, 131-144.
Wehmeyer, M. L., & Schwartz, M. (1997). Self-determination and positive adult
outcomes: A follow-up study of youth with mental retardation or learning disabilities. Exceptional Children, 63, 245-255.
Wehmeyer, M. L., & Schwartz, M. (1998). The relationship between self-
determination and quality of life for adults with mental retardation. Education and Training in Mental Retardation and Developmental Disabilities, 33, 3-12.
Weissbourd, B., & Patrick, M. (1988). In the best interest of the family: The
emergence of family resource programs. Infants and Young Children, 1(2), 46-54.
Whitlow, B. (2001). Archival research. Retrieved from
http://www.camden.rutgers.edu/~bwhitlow/Courses/Experimental/ARCHIVES/index.htm
Whittinghill, E. J. (2010). Children with autism spectrum disorders: A
phenomenological study of parent and professional perceptions. ProQuest Dissertations and Theses, n/a. Retrieved from http://login.ezproxy1.lib.asu.edu/login?url=http://search.proquest.com/docview/848940498?accountid=4485.
Willey, L. H. (2000). Pretending to be normal: Living with Asperger’s syndrome.
Philadelphia: Jessica Kingsley.
102
Williams-Diehm, K. L., & Lynch, P. S. (2007). Student knowledge and perceptions of individual transition planning and its process. Journal for Vocational Special Needs Education, 29, 13-21.
Williams, G., & Palmer, A. (2004). Preparing for college: Tips for students with
HFA/Asperger’s syndrome. TEACCH Web. Retrieved April 22, 2005, from http://www.teacch.com/prep4col2.htm
Wright, K. M. (2008). "Too normal to be different, too different to be normal"
social support needs of parents who have a child with high functioning autism. ProQuest, UMI Dissertations Publishing. ProQuest Dissertations and Theses, n. a. Retrieved from http://login.ezproxy1.lib.asu.edu/login?url=http://search.proquest.com/docview/610078168?accountid=4485 .
Wright, P. (2010). Shaping a future for people living with autism. Autism
through the Lens of the Social Sciences, 1, 71-77. Retrieved from http://www.easterseals.com/site/PageServer?pagename=ntl_mediakit.
Zager, D. (2006). The right place at the right time: The pace campus-based
inclusion program for students with autism and developmental disabilities. The Education Forum, 3(7), 1.

103
APPENDIX A
COPYRIGHT PERMISSION

104
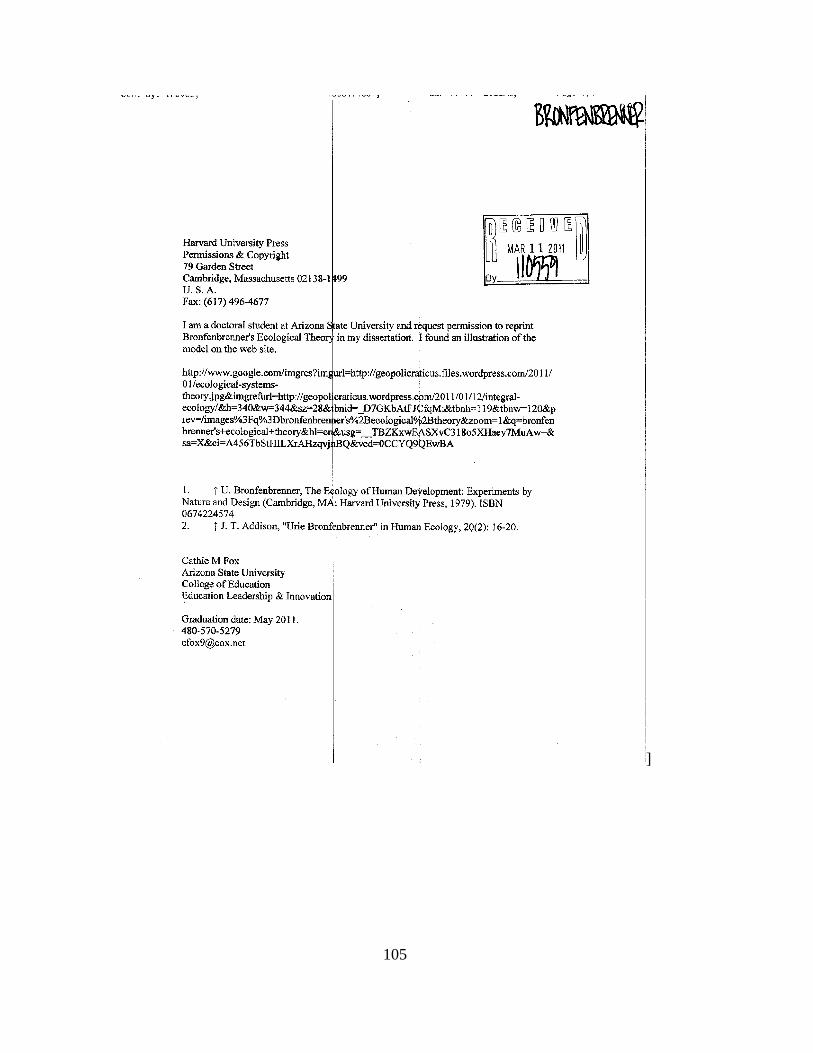
105
]

106
APPENDIX B
DEMOGRAPHICS – YOUNG ADULT DETAIL
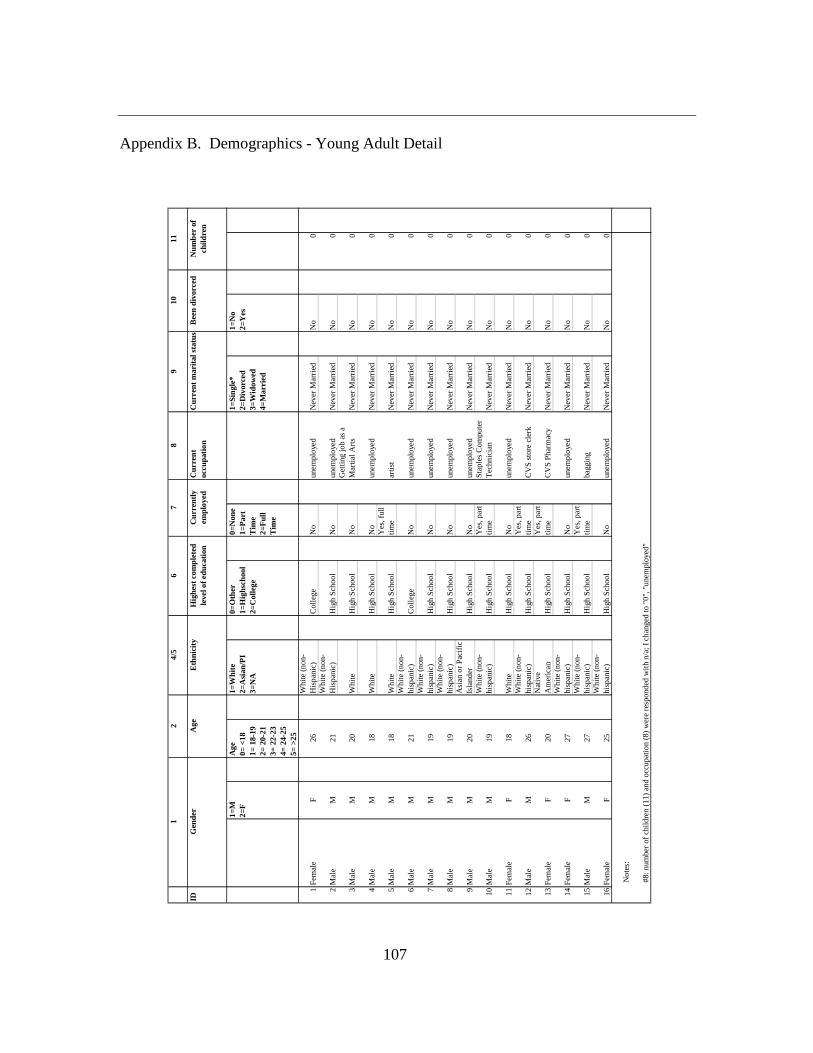
107
Appendix B. Demographics - Young Adult Detail
8
IDC
urre
nt
occu
patio
n
1=M
2=F
Age
0= <
18
1=
18-
19
2=
20-
21
3=
22-
23
4=
24-
25
5=
>25
1=W
hite
2=
Asi
an/P
I
3=
NA
0=O
ther
1=
Hig
hsch
ool
2=C
olle
ge
0=N
one
1=P
art
Tim
e 2=
Ful
l T
ime
1=S
ingl
e*
2=D
ivor
ced
3=W
idow
ed
4=M
arrie
d
1=N
o 2=
Yes
1F
emal
eF
26W
hite
(n
on-
His
pan
ic)
Col
lege
No
une
mpl
oye
dN
ever
Ma
rrie
dN
o0
2M
ale
M21
Wh
ite (
non
-H
isp
anic
)H
igh
Sch
ool
No
une
mpl
oye
dN
ever
Ma
rrie
dN
o0
3M
ale
M20
Wh
iteH
igh
Sch
ool
No
Get
ting
job
as a
M
artia
l Art
s N
ever
Ma
rrie
dN
o0
4M
ale
M18
Wh
iteH
igh
Sch
ool
No
une
mpl
oye
dN
ever
Ma
rrie
dN
o0
5M
ale
M18
Wh
iteH
igh
Sch
ool
Yes
, ful
l tim
ear
tist
Nev
er M
arr
ied
No
0
6M
ale
M21
Wh
ite (
non
-hi
span
ic)
Col
lege
No
une
mpl
oye
dN
ever
Ma
rrie
dN
o0
7M
ale
M19
Wh
ite (
non
-hi
span
ic)
Hig
h S
choo
lN
oun
em
plo
yed
Nev
er M
arr
ied
No
0
8M
ale
M19
Wh
ite (
non
-hi
span
ic)
Hig
h S
choo
lN
oun
em
plo
yed
Nev
er M
arr
ied
No
0
9M
ale
M20
Asi
an
or P
acifi
c Is
land
erH
igh
Sch
ool
No
une
mpl
oye
dN
ever
Ma
rrie
dN
o0
10M
ale
M19
Wh
ite (
non
-hi
span
ic)
Hig
h S
choo
lY
es, p
art
tim
eS
tap
les
Co
mpu
ter
Tec
hnic
ian
Nev
er M
arr
ied
No
0
11F
emal
eF
18W
hite
Hig
h S
choo
lN
oun
em
plo
yed
Nev
er M
arr
ied
No
0
12M
ale
M26
Wh
ite (
non
-hi
span
ic)
Hig
h S
choo
lY
es, p
art
tim
eC
VS
sto
re c
lerk
Nev
er M
arr
ied
No
0
13F
emal
eF
20N
ativ
e
Am
eric
an
Hig
h S
choo
lY
es, p
art
tim
eC
VS
Ph
arm
acy
Nev
er M
arr
ied
No
0
14F
emal
eF
27W
hite
(n
on-
hisp
anic
)H
igh
Sch
ool
No
une
mpl
oye
dN
ever
Ma
rrie
dN
o0
15M
ale
M27
Wh
ite (
non
-hi
span
ic)
Hig
h S
choo
lY
es, p
art
tim
eba
ggin
gN
ever
Ma
rrie
dN
o0
16F
emal
eF
25W
hite
(n
on-
hisp
anic
)H
igh
Sch
ool
No
une
mpl
oye
dN
ever
Ma
rrie
dN
o0
No
tes:
#8:
num
ber
of c
hild
ren
(11)
an
d oc
cupa
tion
(8)
wer
e r
espo
nded
with
n/a
; I c
han
ged
to "
0",
"u
nem
ploy
ed"
Gen
der
Age
Eth
nici
ty
71
24/
56
Num
ber
of
child
ren
11
Hig
hest
com
plet
ed
leve
l of e
duca
tion
Cur
rent
ly
empl
oyed
Cur
rent
mar
ital s
tatu
sB
een
divo
rced
910
108
APPENDIX C
DEMOGRAPHICS – YOUNG ADULT DETAIL SUMMARY
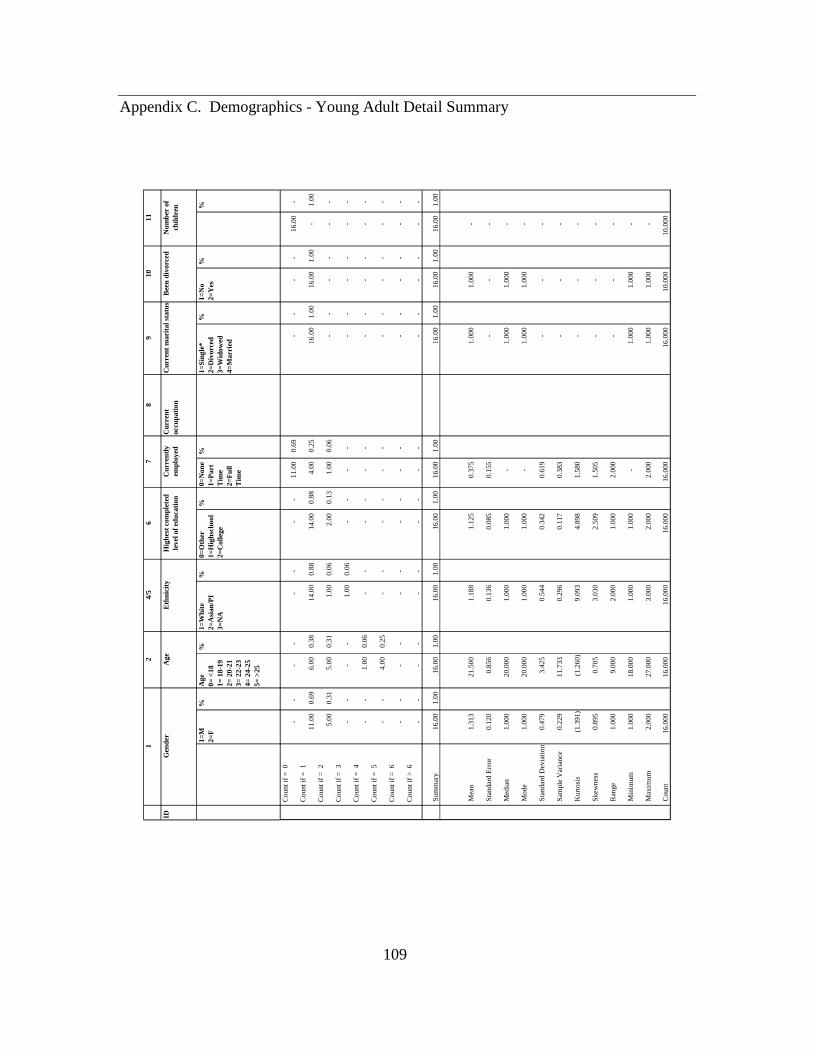
109
Appendix C. Demographics - Young Adult Detail Summary
8
IDC
urre
nt
occu
patio
n
1=M
2=F
%
Age
0= <
18
1=
18-
19
2=
20-
21
3=
22-
23
4=
24-
25
5=
>25
%
1=W
hite
2=
Asi
an/P
I
3=
NA
%
0=O
ther
1=
Hig
hsch
ool
2=C
olle
ge
%
0=N
one
1=P
art
Tim
e 2=
Ful
l T
ime
%
1=S
ingl
e*
2=D
ivor
ced
3=W
idow
ed
4=M
arrie
d
%
1=N
o 2=
Yes
%
%
Cou
nt if
= 0
-
-
-
-
-
-
-
-
11
.00
0.69
-
-
-
-
16.0
0
-
Cou
nt if
= 1
11
.00
0.69
6.
00
0.38
14
.00
0.
88
14.0
0
0.88
4.
00
0.
25
16.0
0
1.00
16
.00
1.00
-
1.00
C
ount
if =
2
5.00
0.
31
5.00
0.
31
1.00
0.06
2.
00
0.
13
1.00
0.06
-
-
-
-
-
-
Cou
nt if
= 3
-
-
-
-
1.
00
0.
06
-
-
-
-
-
-
-
-
-
-
C
ount
if =
4
-
-
1.00
0.
06
-
-
-
-
-
-
-
-
-
-
-
-
Cou
nt if
= 5
-
-
4.
00
0.25
-
-
-
-
-
-
-
-
-
-
-
-
C
ount
if =
6
-
-
-
-
-
-
-
-
-
-
-
-
-
-
-
-
Cou
nt if
> 6
-
-
-
-
-
-
-
-
-
-
-
-
-
-
-
-
Sum
mar
y16
.00
1.00
16
.00
1.
00
16.0
0
1.00
16
.00
1.
00
16.0
0
1.
00
16.0
0
1.00
16
.00
1.00
16
.00
1.00
Mea
n1.
313
21.5
00
1.
188
1.
125
0.
375
1.00
0
1.00
0
-
Sta
nda
rd E
rror
0.12
0
0.
856
0.
136
0.
085
0.
155
-
-
-
Med
ian
1.00
0
20
.000
1.00
0
1.00
0
-
1.00
0
1.00
0
-
Mod
e1.
000
20.0
00
1.
000
1.
000
-
1.
000
1.
000
-
Sta
nda
rd D
evia
tion
0.47
9
3.
425
0.
544
0.
342
0.
619
-
-
-
Sam
ple
Var
ianc
e0.
229
11.7
33
0.
296
0.
117
0.
383
-
-
-
Kur
tosi
s(1
.391
)
(1
.260
)
9.
093
4.
898
1.
580
-
-
-
Ske
wne
ss0.
895
0.70
5
3.03
0
2.50
9
1.50
5
-
-
-
Ran
ge1.
000
9.00
0
2.00
0
1.00
0
2.00
0
-
-
-
Min
imum
1.00
0
18
.000
1.00
0
1.00
0
-
1.00
0
1.00
0
-
Max
imum
2.00
0
27
.000
3.00
0
2.00
0
2.00
0
1.
000
1.
000
-
Cou
nt16
.000
16.0
00
16
.000
16
.000
16
.000
16
.000
10
.000
10.0
00
Cur
rent
ly
empl
oyed
Cur
rent
mar
ital s
tatu
sB
een
divo
rced
Num
ber
of
child
ren
Gen
der
Age
Eth
nici
tyH
ighe
st c
ompl
eted
le
vel o
f edu
catio
n
79
1011
12
4/5
6

110
APPENDIX D
DEMOGRAPHICS – PARENT DETAIL
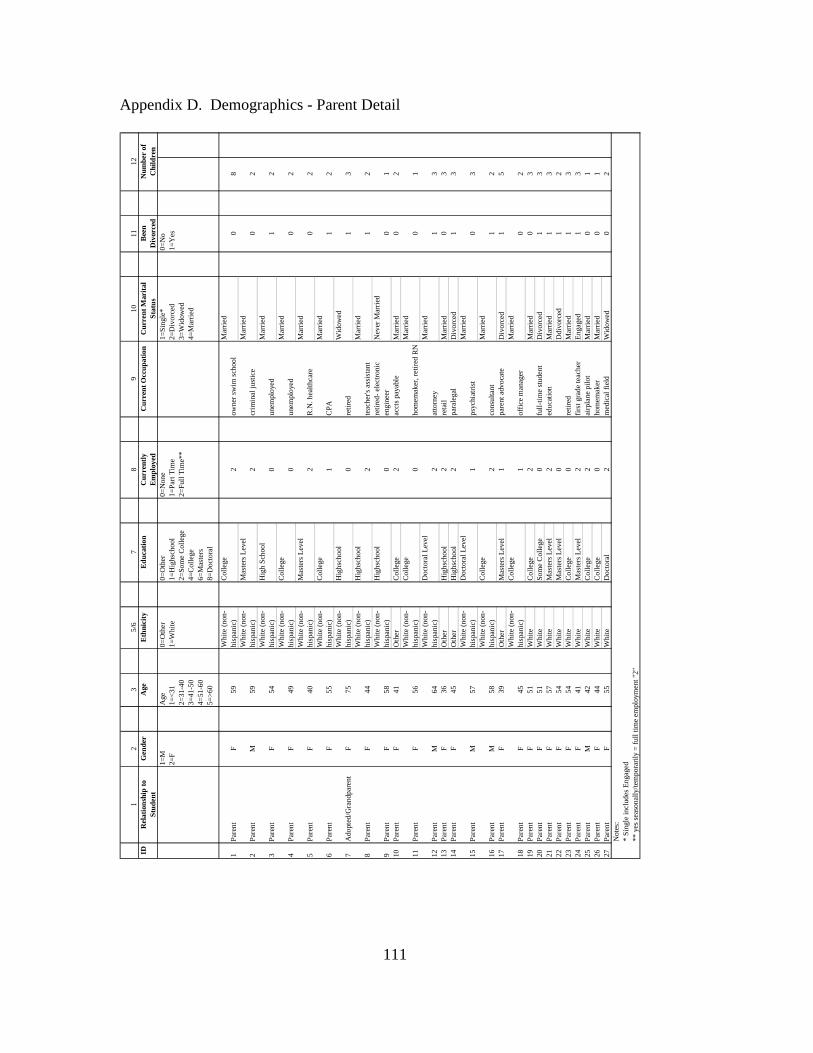
111
Appendix D. Demographics - Parent Detail
12
35
/67
89
1011
IDR
elat
ions
hip
to
Stu
dent
Gen
der
Age
Eth
nici
tyE
duca
tion
Cur
rent
ly
Em
ploy
edC
urre
nt O
ccup
atio
nC
urre
nt M
arita
l S
tatu
sB
een
Div
orce
d1=
M
2=F
Age
1=<
31
2=31
-40
3=
41-5
0
4=51
-60
5=
>6
0
0=
Oth
er
1
=W
hite
0=O
ther
1=
Hig
hsch
ool
2=
So
me
Co
llege
4=
Co
llege
6=
Mas
ters
8=
Doc
tora
l
0=
Non
e
1=
Par
t Tim
e
2
=F
ull T
ime*
*
1=
Sin
gle*
2
=D
ivo
rced
3=
Wid
owed
4=
Mar
ried
0=
No
1=
Yes
1P
aren
tF
59
Wh
ite (
non
-h
ispa
nic)
Co
llege
2o
wne
r sw
im s
choo
lM
arrie
d0
8
2P
aren
tM
59
Wh
ite (
non
-h
ispa
nic)
Mas
ters
Lev
el2
crim
inal
just
ice
Mar
ried
02
3P
aren
tF
54
Wh
ite (
non
-h
ispa
nic)
Hig
h S
choo
l0
une
mpl
oye
dM
arrie
d1
2
4P
aren
tF
49
Wh
ite (
non
-h
ispa
nic)
Co
llege
0u
nem
plo
yed
Mar
ried
02
5P
aren
tF
40
Wh
ite (
non
-h
ispa
nic)
Mas
ters
Lev
el2
R.N
. h
ealth
care
Mar
ried
02
6P
aren
tF
55
Wh
ite (
non
-h
ispa
nic)
Co
llege
1C
PA
Mar
ried
12
7A
dopt
ed/G
ran
dpar
ent
F7
5W
hite
(n
on-
his
pani
c)H
igh
scho
ol0
retir
edW
ido
wed
13
8P
aren
tF
44
Wh
ite (
non
-h
ispa
nic)
Hig
hsc
hool
2te
ache
r's a
ssis
tan
tM
arrie
d1
2
9P
aren
tF
58
Wh
ite (
non
-h
ispa
nic)
Hig
hsc
hool
0re
tired
- el
ectr
oni
c en
gin
eer
Nev
er M
arri
ed0
110
Par
ent
F4
1O
ther
Co
llege
2ac
cts
paya
ble
Mar
ried
02
11P
aren
tF
56
Wh
ite (
non
-h
ispa
nic)
Co
llege
0h
omem
aker
, re
tired
RNM
arrie
d0
1
12P
aren
tM
64
Wh
ite (
non
-h
ispa
nic)
Doc
tora
l Lev
el2
atto
rney
Mar
ried
13
13P
aren
tF
36
Oth
erH
igh
scho
ol2
reta
ilM
arrie
d0
314
Par
ent
F4
5O
ther
Hig
hsc
hool
2p
aral
egal
Div
orc
ed1
3
15P
aren
tM
57
Wh
ite (
non
-h
ispa
nic)
Doc
tora
l Lev
el1
psy
chia
tris
tM
arrie
d0
3
16P
aren
tM
58
Wh
ite (
non
-h
ispa
nic)
Co
llege
2co
nsu
ltan
tM
arrie
d1
217
Par
ent
F3
9O
ther
Mas
ters
Lev
el1
par
ent a
dvo
cate
Div
orc
ed1
5
18P
aren
tF
45
Wh
ite (
non
-h
ispa
nic)
Co
llege
1o
ffice
man
ager
Mar
ried
02
19P
aren
tF
51
Wh
iteC
olle
ge2
Mar
ried
03
20P
aren
tF
51
Wh
iteS
om
e C
olle
ge0
full-
time
stu
den
tD
ivo
rced
13
21P
aren
tF
57
Wh
iteM
aste
rs L
evel
2ed
uca
tion
Mar
ried
13
22P
aren
tF
54
Wh
iteM
aste
rs L
evel
0D
div
orce
d1
223
Par
ent
F5
4W
hite
Co
llege
0re
tired
Mar
ried
13
24P
aren
tF
41
Wh
iteM
aste
rs L
evel
2fir
st g
rad
e te
ache
rE
nga
ged
13
25P
aren
tM
42
Wh
iteC
olle
ge2
airp
lan
e p
ilot
Mar
ried
01
26P
aren
tF
44
Wh
iteC
olle
ge0
hom
emak
erM
arrie
d0
127
Par
ent
F5
5W
hite
Doc
tora
l2
med
ical
fiel
dW
ido
wed
02
Not
es:
* S
ingl
e in
clud
es E
nga
ged
** y
es s
easo
nally
/tem
por
arily
= fu
ll tim
e em
ploy
ment "2
"
Num
ber
of
Chi
ldre
n
12

112
APPENDIX E
DEMOGRAPHICS – PARENT DETAIL SUMMARY
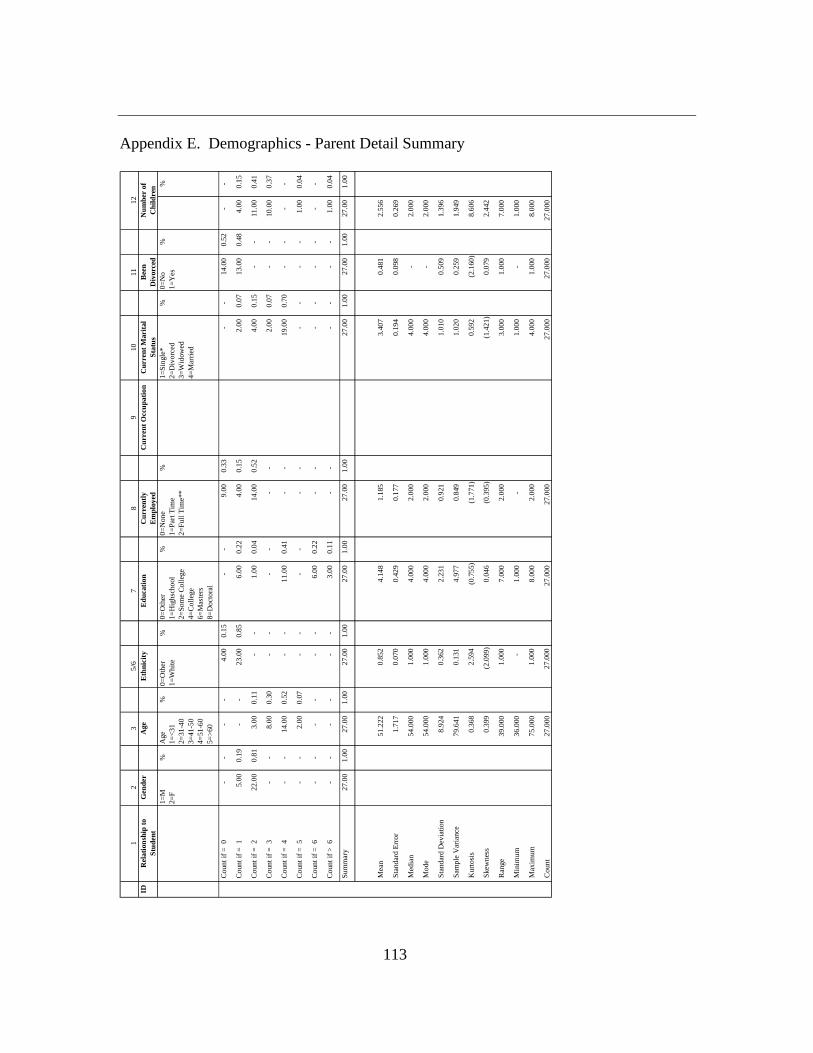
113
Appendix E. Demographics - Parent Detail Summary
12
35
/67
89
1011
IDR
elat
ions
hip
to
Stu
dent
Gen
der
Age
Eth
nici
tyE
duca
tion
Cur
rent
ly
Em
ploy
edC
urre
nt O
ccup
atio
nC
urre
nt M
arita
l S
tatu
sB
een
Div
orce
d1=
M
2=F
%A
ge
1=
<3
1 2=
31-4
0
3=41
-50
4=
51-6
0
5=>
60
%0
=O
ther
1=
Wh
ite%
0=O
ther
1=
Hig
hsch
ool
2=
So
me
Co
llege
4=
Co
llege
6=
Mas
ters
8=
Doc
tora
l
%0
=N
one
1
=P
art
Tim
e
2
=F
ull T
ime*
*
%1
=S
ingl
e*
2=
Div
orc
ed
3
=W
idow
ed
4
=M
arrie
d
%0
=N
o
1
=Y
es
%%
Co
unt i
f = 0
-
-
-
-
4
.00
0.
15
-
-
9
.00
0.3
3
-
-
14.
00
0.52
-
-
Co
unt
if =
1
5.0
0
0.
19
-
-
23.
00
0.8
5
6
.00
0
.22
4
.00
0.1
5
2.0
0
0
.07
1
3.00
0.
48
4
.00
0.1
5
Co
unt
if =
2
22.
00
0.
81
3.00
0.1
1
-
-
1
.00
0
.04
14
.00
0
.52
4
.00
0.1
5
-
-
11.0
0
0.4
1
Co
unt
if =
3
-
-
8.
00
0
.30
-
-
-
-
-
-
2.0
0
0
.07
-
-
10
.00
0
.37
Co
unt
if =
4
-
-
1
4.00
0
.52
-
-
11
.00
0.4
1
-
-
19
.00
0
.70
-
-
-
-
Co
unt i
f = 5
-
-
2.00
0.0
7
-
-
-
-
-
-
-
-
-
-
1
.00
0.0
4
Co
unt i
f = 6
-
-
-
-
-
-
6.0
0
0.2
2
-
-
-
-
-
-
-
-
Co
unt i
f > 6
-
-
-
-
-
-
3.0
0
0.1
1
-
-
-
-
-
-
1
.00
0.0
4
Su
mm
ary
27.
00
1.
00
27.
00
1.0
0
2
7.00
1.
00
27
.00
1.0
0
27.0
0
1.0
0
27.0
0
1.0
0
27.
00
1.00
27.0
0
1.0
0
Mea
n5
1.2
22
0
.852
4
.14
8
1.
185
3.
407
0
.481
2.
556
Sta
ndar
d E
rro
r1
.717
0
.070
0
.42
9
0.
177
0.
194
0
.098
0.
269
Med
ian
54
.000
1.0
00
4.0
00
2.0
00
4.00
0
-
2.
000
Mo
de5
4.0
00
1
.000
4
.00
0
2.
000
4.
000
-
2.0
00
Sta
ndar
d D
evia
tion
8.9
24
0.3
62
2.2
31
0.9
21
1.01
0
0.5
09
1.3
96
Sam
ple
Var
ianc
e7
9.6
41
0
.131
4
.97
7
0.
849
1.
020
0
.259
1.
949
Ku
rtos
is0
.368
2
.594
(0
.75
5)
(1
.771
)
0.59
2
(2.1
60)
8.6
06
Ske
wn
ess
0.3
99
(
2.0
99)
0.0
46
(0.3
95)
(1
.42
1)
0
.079
2.
442
Ran
ge3
9.0
00
1
.000
7
.00
0
2.
000
3.
000
1
.000
7.
000
Min
imu
m3
6.0
00
-
1.0
00
-
1.00
0
-
1.
000
Max
imu
m7
5.0
00
1
.000
8
.00
0
2.
000
4.
000
1
.000
8.
000
Co
unt
27
.000
2
7.0
00
27.
000
2
7.0
00
2
7.00
0
2
7.0
00
2
7.0
00
12N
umbe
r of
C
hild
ren

114
APPENDIX F
YOUNG ADULT DEMOGRAPHICS – DESCRIPTIVE STATISTICS – SUMMARY
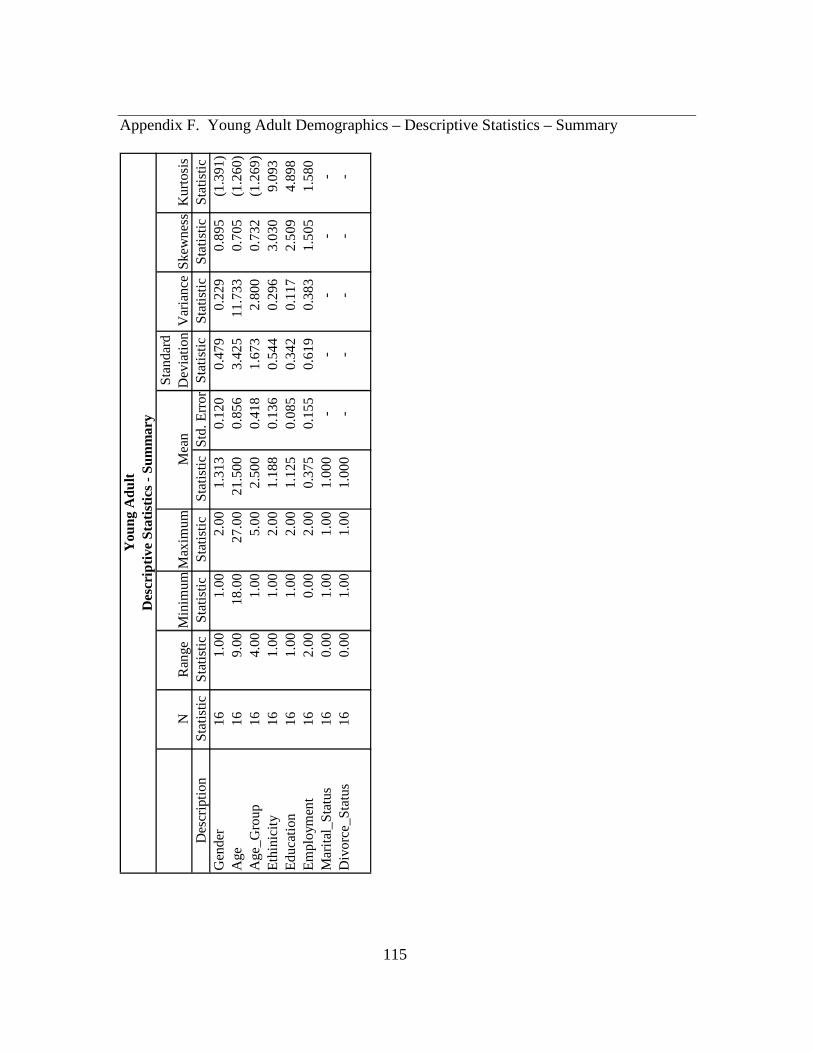
115
Appendix F. Young Adult Demographics – Descriptive Statistics – Summary
NR
ange
Min
imum
Max
imum
Sta
ndar
d D
evia
tion
Var
ianc
eS
kew
ness
Kur
tosi
sD
escr
iptio
nS
tatis
ticS
tatis
ticS
tatis
ticS
tatis
ticS
tat
istic
Std
. Err
orS
tatis
ticS
tatis
ticS
tatis
ticS
tatis
ticG
ende
r16
1.00
1.00
2.00
1.31
3
0.
120
0.47
9
0.
229
0.8
95
(1
.391
)
Age
169.
0018
.00
27.0
021
.500
0.
856
3.42
5
11
.733
0.
705
(1.2
60)
A
ge_G
roup
164.
001.
005.
002.
500
0.41
8
1.
673
2.80
0
0.
732
(1.2
69)
E
thin
icity
161.
001.
002.
001.
188
0.13
6
0.
544
0.29
6
3.
030
9.09
3
E
duc
atio
n16
1.00
1.00
2.00
1.12
5
0.
085
0.34
2
0.
117
2.5
09
4.
898
Em
ploy
men
t16
2.00
0.00
2.00
0.37
5
0.
155
0.61
9
0.
383
1.5
05
1.
580
Mar
ital_
Sta
tus
160.
001.
001.
001.
000
-
-
-
-
-
Div
orce
_Sta
tus
160.
001.
001.
001.
000
-
-
-
-
-
You
ng A
dult
Des
crip
tive
Sta
tistic
s -
Sum
mar
y
Mea
n
116
APPENDIX G
PARENT DEMOGRAPHICS – DESCRIPTIVE STATISTICS – SUMMARY

117
Appendix G. Parent Demographics – Descriptive Statistics – Summary
N
Ra
nge
M
inim
um
M
axi
mu
m
Std
. D
evi
atio
n V
aria
nce
S
kew
ness
Kur
tosi
s D
esc
riptiv
e S
tatis
tics
Sta
tistic
Sta
tistic
Sta
tistic
St
atis
ticS
tatis
ticS
td. E
rror
Sta
tistic
Sta
tistic
Sta
tist
icS
tatis
ticG
end
er27
1.00
1.
00
2.00
1.
815
0.07
6
0.
396
0.15
7
(1
.718
)
1.02
1
A
ge27
39.0
0
36
.00
75.0
0
51
.222
1.
717
8.92
4
79
.641
0.
399
0.36
8
A
ge C
ount
273.
00
2.00
5.
00
3.55
6
0.
154
0.80
1
0.
641
(0.4
38)
(0
.127
)
Eth
nici
ty27
1.00
0.
001.
00
0.85
2
0.
070
0.36
2
0.
131
(2.0
99)
2.
594
Edu
catio
n27
7.00
1.
00
8.00
4.
148
0.42
9
2.
231
4.97
7
0.
046
(0.7
55)
E
mpl
oym
ent
272.
00
0.00
2.00
1.
185
0.17
7
0.
921
0.84
9
(0
.395
)
(1.7
71)
M
arit
al S
tatu
s27
3.00
1.
00
4.00
3.
407
0.19
4
1.
010
1.02
0
(1
.421
)
0.59
2
D
ivor
ce S
tatu
s27
1.00
0.
001.
00
0.48
2
0.
098
0.50
9
0.
259
0.07
9
(2
.160
)
Num
ber
of C
hild
ren
277.
00
1.00
8.
00
2.55
6
0.
269
1.39
6
1.
949
2.44
2
8.
606
Par
ent D
emog
raph
ics
Des
crip
tive
Sta
tistic
s -
Sum
mar
y
Mea
n

118
APPENDIX H
SURVEY QUESTIONS – RESPONSES/CORRELATION
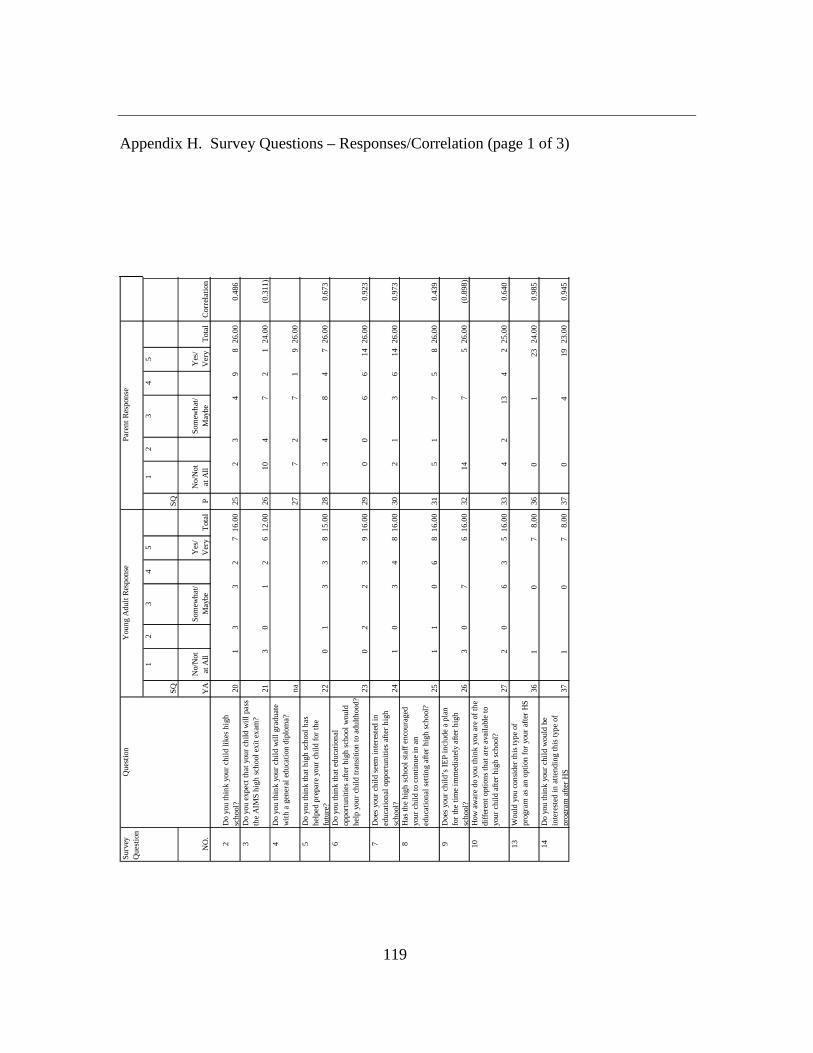
119
Appendix H. Survey Questions – Responses/Correlation (page 1 of 3)
Sur
vey
Que
stio
nQ
uest
ion
SQ
12
34
5
SQ
12
34
5 Y
oun
g A
dult
Pa
ren
t
NO
.Y
AN
o/N
ot
at
All
Som
ewh
at/
Ma
ybe
Yes
/ V
ery
Tot
al
PN
o/N
ot
at
All
Som
ewh
at/
May
beY
es/
Ver
yT
ota
lC
orre
latio
nT
test
(2,
1)P
ears
onP
ears
on
2D
o yo
u th
ink
your
ch
ild li
kes
hig
h
sch
ool?
201
33
27
16.
00
252
34
98
26.0
0
0.48
6
0.
189
0.70
9
0
.498
3D
o yo
u ex
pect
th
at
you
r ch
ild w
ill p
ass
th
e A
IMS
hig
h s
choo
l exi
t ex
am?
213
01
26
12.
00
261
04
72
124
.00
(0
.311
)
0.
338
0.73
5
(0
.560
)
4D
o yo
u th
ink
your
ch
ild w
ill g
radu
ate
w
ith a
gen
eral
ed
uca
tion
dip
lom
a?
na
277
27
19
26.0
0
0.6
24
5
Do
you
thin
k th
at h
igh
sch
ool h
as
hel
ped
pre
pare
you
r ch
ild fo
r th
e fu
ture
?22
01
33
81
5.00
28
34
84
726
.00
0.
673
0.09
7
0.
915
0.8
11
6
Do
you
thin
k th
at e
duca
tion
al
oppo
rtun
ities
afte
r h
igh
sch
ool w
ould
h
elp
you
r ch
ild t
ran
sitio
n t
o a
dulth
ood? 23
02
23
91
6.00
29
00
66
1426
.00
0.
923
0.20
0
0.
810
0.9
23
7
Doe
s yo
ur c
hild
see
m in
tere
sted
in
educ
atio
na
l opp
ortu
niti
es a
fter
hig
h
sch
ool?
241
03
48
16.
00
302
13
614
26.0
0
0.97
3
0.
129
0.97
2
0
.852
8H
as
the
hig
h s
choo
l sta
ff en
cou
rage
d yo
ur c
hild
to
con
tinue
in a
n
educ
atio
na
l set
ting
afte
r h
igh
sch
ool?
251
10
68
16.
00
315
17
58
26.0
0
0.43
9
0.
258
0.74
1
0
.695
9D
oes
your
ch
ild’s
IE
P in
clud
e a
pla
n
for
the
time
imm
edia
tely
afte
r h
igh
sc
hoo
l?26
30
76
16.
00
321
47
526
.00
(0
.898
)
0.
477
0.85
6
(0
.952
)
10H
ow a
wa
re d
o yo
u th
ink
you
are
of t
he
diffe
ren
t op
tion
s th
at
are
ava
ilabl
e to
yo
ur c
hild
afte
r h
igh
sch
ool?
272
06
35
16.
00
334
213
42
25.0
0
0.64
0
0.
322
0.83
8
0
.046
13W
ould
you
con
side
r th
is t
ype
of
prog
ram
as
an
opt
ion
for
your
afte
r H
S 361
07
8.00
360
123
24.0
0
0.98
5
0.
425
0.79
2
0
.885
14D
o yo
u th
ink
your
ch
ild w
ould
be
inte
rest
ed in
att
endi
ng
this
typ
e of
pr
ogra
m a
fter
HS
371
07
8.00
370
419
23.0
0
0.94
5
0.
317
0.79
2
0
.948
Par
ent
Res
pon
seY
oun
g A
dult
Res
pon
se
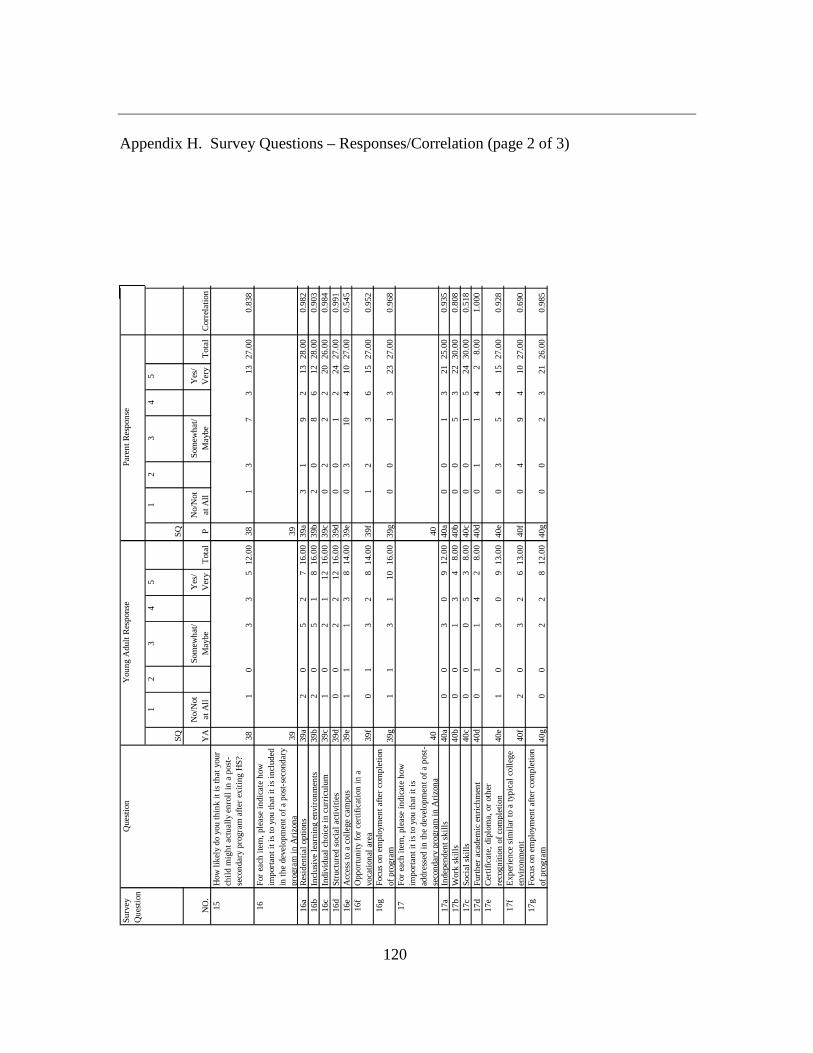
120
Appendix H. Survey Questions – Responses/Correlation (page 2 of 3)
Su
rvey
Q
ues
tion
Que
stio
n
SQ
12
34
5
SQ
12
34
5 Y
oun
g A
dul
t P
aren
t
NO
.Y
AN
o/N
ot
at
All
Som
ewh
at/
Ma
ybe
Yes
/ V
ery
Tot
alP
No/
Not
a
t A
llS
omew
ha
t/M
ayb
eY
es/
Ver
yT
ota
lC
orre
latio
nT
test
(2,
1)P
ears
onP
ears
on15
How
like
ly d
o yo
u t
hin
k it
is t
ha
t yo
ur
child
mig
ht
act
ua
lly e
nro
ll in
a p
ost-
seco
nda
ry p
rogr
am
afte
r ex
itin
g H
S?
38
10
33
51
2.0
0
38
13
73
1327
.00
0
.838
0.1
13
1.00
0
1
.000
16F
or e
ach
item
, pl
ease
indi
cate
how
im
por
tan
t it
is t
o yo
u t
ha
t it
is in
clud
ed
in t
he
deve
lop
men
t of
a p
ost-
seco
nda
ry
prog
ram
in A
rizo
na
39
39
16a
Res
iden
tial o
ptio
ns
39a
20
52
71
6.0
0
39a
31
92
1328
.00
0
.982
0.0
99
0.90
6
0
.939
16b
Incl
usiv
e le
arn
ing
envi
ron
men
ts3
9b2
05
18
16.
00
3
9b2
08
612
28.0
0
0.9
03
0
.08
0
0.
847
0.8
86
1
6cIn
divi
dual
ch
oice
in c
urri
culu
m39
c1
02
11
21
6.0
0
39c
02
22
2026
.00
0
.984
0.2
75
0.81
5
0
.916
16d
Str
uctu
red
soc
ial a
ctiv
ities
39d
00
22
12
16.
00
3
9d0
01
224
27.0
0
0.9
91
0
.42
1
0.
858
0.8
99
1
6eA
cces
s to
a c
olle
ge c
am
pus
39e
11
13
81
4.0
0
39e
03
104
1027
.00
0
.545
0.1
99
0.82
0
0
.885
16f
Opp
ortu
nity
for
cert
ifica
tion
in a
vo
catio
nal
are
a39
f0
13
28
14.
00
3
9f1
23
615
27.0
0
0.9
52
0
.11
4
0.
881
0.8
77
16
gF
ocu
s on
em
plo
ymen
t a
fter
com
plet
ion
of
pro
gra
m3
9g1
13
11
01
6.0
0
39g
00
13
2327
.00
0
.968
0.4
73
0.80
9
0
.894
17F
or e
ach
item
, pl
ease
indi
cate
how
im
por
tan
t it
is t
o yo
u t
ha
t it
is
addr
esse
d in
th
e de
velo
pmen
t of
a p
ost-
seco
nda
ry p
rogr
am
in A
rizo
na
40
40
17a
Inde
pen
den
t sk
ills
40a
00
30
91
2.0
0
40a
00
13
2125
.00
0
.935
0.3
54
0.82
6
0
.893
17b
Wor
k sk
ills
40b
00
13
48.
00
40b
00
53
2230
.00
0
.808
0.2
76
0.90
4
0
.957
17c
Soc
ial s
kills
40c
00
05
38.
00
40c
00
15
2430
.00
0
.518
0.3
49
0.60
2
0
.877
17d
Fur
ther
aca
dem
ic e
nri
chm
ent
40d
01
14
28.
00
40d
01
14
28
.00
1.0
00
#
DIV
/0!
0.49
0
0
.166
17e
Cer
tific
ate
, di
plom
a,
or o
ther
re
cog
niti
on o
f com
ple
tion
40e
10
30
91
3.0
0
40e
03
54
1527
.00
0
.928
0.0
73
0.80
7
0
.969
17f
Exp
erie
nce
sim
ilar
to a
typ
ica
l col
leg
e en
viro
nm
ent
40f
20
32
61
3.0
0
40f
04
94
1027
.00
0
.690
0.1
08
0.92
5
0
.909
17g
Foc
us
on e
mp
loym
ent
afte
r co
mpl
etio
n
of p
rog
ram
40g
00
22
81
2.0
0
40g
00
23
2126
.00
0
.985
0.3
35
0.90
5
0
.913
You
ng
Adu
lt R
esp
onse
Pa
ren
t R
esp
onse

121
Appendix H. Survey Questions – Responses/Correlation (page 3 of 3)
Sur
vey
Que
stio
nQ
uest
ion
SQ
12
34
5
SQ
12
34
5 Y
oun
g A
dult
Pa
ren
t
NO
.Y
AN
o/N
ot
at A
llS
omew
hat
/M
aybe
Yes
/ V
ery
Tot
al
PN
o/N
ot
at
All
Som
ewh
at/
Ma
ybe
Yes
/ V
ery
Tot
alC
orre
latio
nT
test
(2,
1)P
ears
onP
ears
onB
elow
are
fact
ors
tha
t pa
ren
ts c
onsi
der
wh
en d
eter
min
ing
wh
eth
er a
pos
t-se
con
dary
pro
gra
m w
ould
sui
t th
e n
eeds
of t
hei
r ch
ild a
nd
fam
ily
18a
Dis
tan
ce o
f cam
pus
from
hom
e41
a2
03
08
13.0
0
41a
22
95
725
.00
0.
543
0.15
3
0.
773
0.71
3
18
bC
ost
of p
rogr
am41
b3
11
26
13.0
0
41b
22
64
1226
.00
0.
767
0.11
4
0.
668
0.98
0
18
cY
our
child
's p
hys
ical
hea
lth41
c4
11
34
13.0
0
41c
54
32
1125
.00
0.
560
0.14
5
0.
406
0.77
0
18
dY
our
child
's s
afe
ty41
d3
11
26
13.0
0
41d
10
44
1726
.00
0.
872
0.32
0
0.
668
0.93
2
18
eY
our
child
's a
bilit
y to
fun
ctio
n w
ithou
t yo
u41
e2
11
26
12.0
0
41e
13
83
1126
.00
0.
657
0.12
1
0.
755
0.98
0
18
fE
xper
ien
ce s
imila
r to
a t
ypic
al c
olle
ge
envi
ron
men
t41
f2
11
45
13.0
0
41f
25
56
725
.00
0.
588
0.03
3
0.
762
0.72
8
18
gF
ocus
on
em
ploy
men
t af
ter
com
plet
ion
of
pro
gram
41g
21
12
915
.00
41
g0
04
120
25.0
0
0.95
8
0.
453
0.75
6
0.
956
You
ng
Adu
lt R
espo
nse
Par
ent
Res
pon
se

122
APPENDIX I
SURVEY QUESTIONS – RESPONSES/STATISTICAL SUMMARY
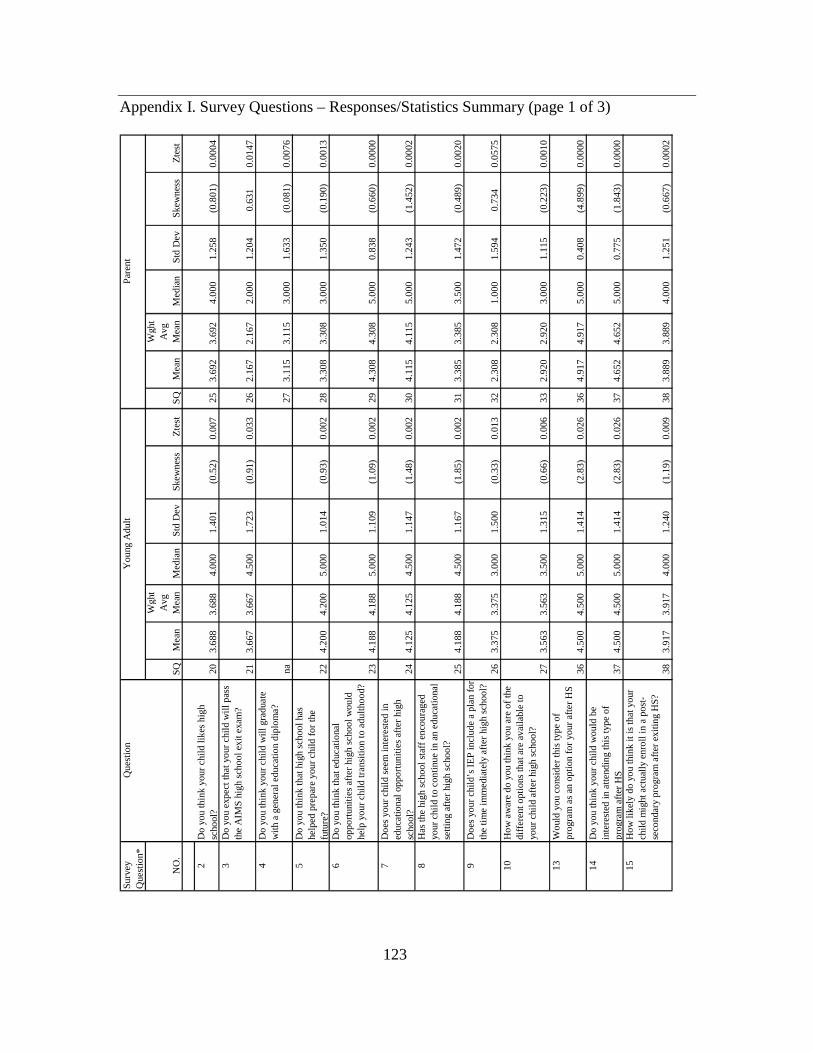
123
Appendix I. Survey Questions – Responses/Statistics Summary (page 1 of 3)
Sur
vey
Que
stio
n*Q
uest
ion
NO
.S
QM
ean
Wgh
t A
vg
Me
anM
edi
an
Std
De
vS
kew
ness
Zte
stS
QM
eanW
ght
Avg
M
ean
Me
dian
Std
De
vS
kew
ness
Zte
st
2D
o y
ou t
hink
you
r ch
ild li
kes
high
sc
hool
?20
3.6
883.
688
4.0
001.
401
(0.5
2)0.
007
253.
692
3.69
24.
000
1.2
58(0
.801
)0
.00
04
3D
o y
ou e
xpe
ct t
hat
your
chi
ld w
ill p
ass
the
AIM
S h
igh
scho
ol e
xit e
xam
?21
3.6
673.
667
4.5
001.
723
(0.9
1)0.
033
262.
167
2.16
72.
000
1.2
040.
631
0.0
147
4
Do
you
thi
nk y
our
child
will
gra
dua
te
with
a g
ener
al e
duca
tion
dipl
oma
?na
273.
115
3.11
53.
000
1.63
3(0
.081
)0
.00
76
5D
o y
ou t
hink
that
hig
h sc
hool
ha
s he
lped
pre
pare
you
r ch
ild fo
r th
e
futu
re?
224.
200
4.20
05.
000
1.0
14(0
.93)
0.00
228
3.30
83.
308
3.0
001
.350
(0.1
90)
0.0
013
6
Do
you
thi
nk th
at e
duc
atio
nal
oppo
rtun
ities
afte
r hi
gh s
choo
l wou
ld
help
you
r ch
ild tr
ans
ition
to
adu
lthoo
d?23
4.1
884.
188
5.0
001.
109
(1.0
9)0.
002
294.
308
4.30
85.
000
0.8
38(0
.660
)0
.00
00
7D
oes
you
r ch
ild s
eem
inte
rest
ed in
ed
uca
tiona
l opp
ort
uniti
es a
fter
high
sc
hool
?24
4.1
254.
125
4.5
001.
147
(1.4
8)0.
002
304.
115
4.11
55.
000
1.2
43(1
.452
)0
.00
02
8H
as
the
high
sch
ool s
taff
enco
urag
ed
your
chi
ld t
o co
ntin
ue in
an
edu
catio
nal
setti
ng a
fter
high
sch
ool?
254.
188
4.18
84.
500
1.1
67(1
.85)
0.00
231
3.38
53.
385
3.5
001
.472
(0.4
89)
0.0
020
9
Do
es y
our
child
’s I
EP
incl
ude
a p
lan
for
the
tim
e im
me
diat
ely
afte
r hi
gh s
choo
l? 263.
375
3.37
53.
000
1.5
00(0
.33)
0.01
332
2.30
82.
308
1.0
001
.594
0.73
40
.05
75
10H
ow
aw
are
do
you
thin
k yo
u a
re o
f the
di
ffere
nt o
ptio
ns t
hat a
re a
vaila
ble
to
your
chi
ld a
fter
high
sch
ool?
273.
563
3.56
33.
500
1.3
15(0
.66)
0.00
633
2.92
02.
920
3.0
001
.115
(0.2
23)
0.0
010
13
Wo
uld
you
cons
ide
r th
is ty
pe o
f pr
ogra
m a
s an
opt
ion
for
your
afte
r H
S 364.
500
4.50
05.
000
1.4
14(2
.83)
0.02
636
4.91
74.
917
5.0
000
.408
(4.8
99)
0.0
000
14
Do
you
thi
nk y
our
child
wou
ld b
e in
tere
sted
in a
ttend
ing
this
typ
e of
pr
ogra
m a
fter
HS
374.
500
4.50
05.
000
1.4
14(2
.83)
0.02
637
4.65
24.
652
5.0
000
.775
(1.8
43)
0.0
000
15
Ho
w li
kely
do
you
thin
k it
is th
at y
our
child
mig
ht a
ctua
lly e
nro
ll in
a p
ost-
seco
nda
ry p
rogr
am
afte
r ex
iting
HS
?38
3.9
173.
917
4.0
001.
240
(1.1
9)0.
009
383.
889
3.88
94.
000
1.2
51(0
.667
)0
.00
02
Par
ent
You
ng A
dult
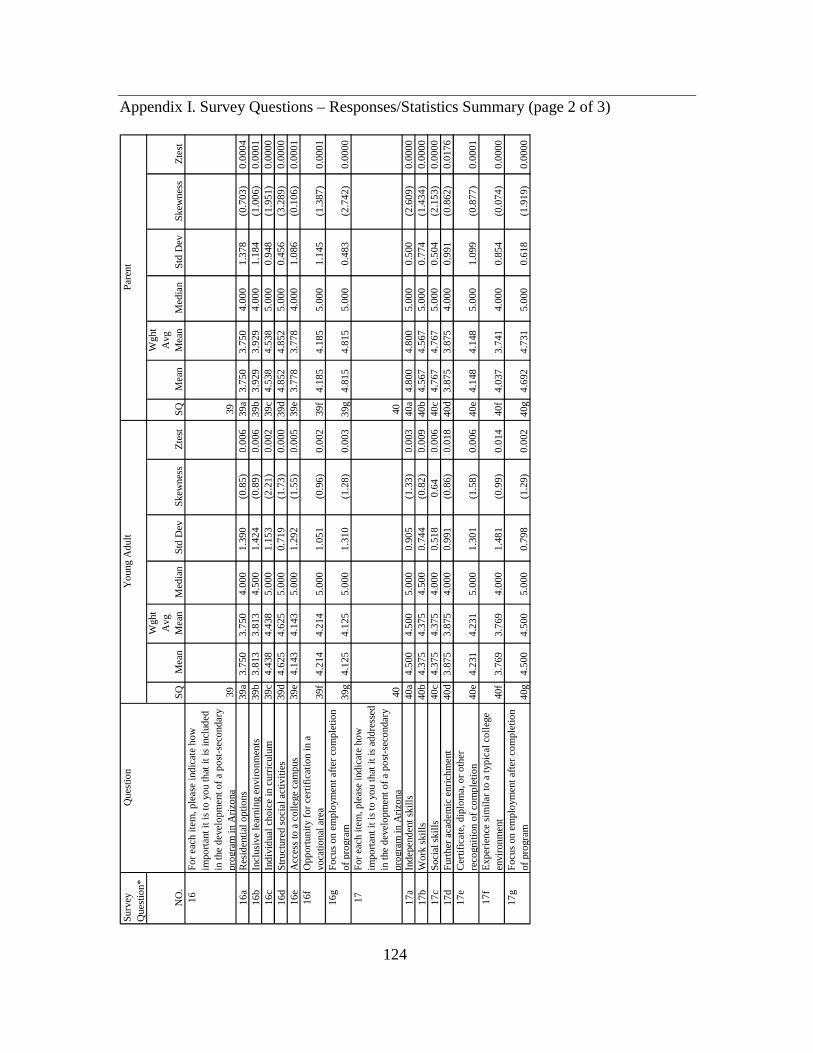
124
Appendix I. Survey Questions – Responses/Statistics Summary (page 2 of 3)
Sur
vey
Que
stio
n*Q
uest
ion
NO
.S
QM
ea
n
Wgh
t A
vg
Me
anM
edia
nS
td D
ev
Ske
wne
ssZ
test
SQ
Me
an
Wgh
t A
vg
Me
anM
ed
ian
Std
De
vS
kew
ness
Zte
st1
6F
or e
ach
item
, ple
ase
ind
ica
te h
ow
impo
rta
nt it
is t
o yo
u th
at it
is in
clud
ed
in t
he d
eve
lopm
ent
of a
po
st-s
eco
nda
ry
pro
gra
m in
Ariz
ona
3939
16
aR
esid
ent
ial o
ptio
ns39
a3
.750
3.7
504
.000
1.39
0(0
.85
)0
.006
39a
3.7
503
.750
4.00
01
.378
(0.7
03
)0
.000
4
16b
Incl
usiv
e le
arni
ng e
nviro
nmen
ts39
b3
.813
3.8
134
.500
1.42
4(0
.89
)0
.006
39b
3.9
293
.929
4.00
01
.184
(1.0
06
)0
.000
1
16
cIn
div
idua
l cho
ice
in c
urri
culu
m39
c4
.438
4.4
385
.000
1.15
3(2
.21
)0
.002
39c
4.5
384
.538
5.00
00
.948
(1.9
51
)0
.000
0
16d
Str
uctu
red
soci
al a
ctiv
ities
39d
4.6
254
.625
5.0
000.
719
(1.7
3)
0.0
0039
d4
.852
4.8
525.
000
0.4
56(3
.28
9)
0.0
000
1
6e
Acc
ess
to a
co
llege
ca
mp
us39
e4
.143
4.1
435
.000
1.29
2(1
.55
)0
.005
39e
3.7
783
.778
4.00
01
.086
(0.1
06
)0
.000
1
16f
Op
por
tuni
ty fo
r ce
rtifi
catio
n in
a
voca
tiona
l are
a39
f4
.214
4.2
145
.000
1.05
1(0
.96
)0
.002
39f
4.1
854
.185
5.00
01
.145
(1.3
87
)0
.000
1
16g
Foc
us o
n e
mpl
oym
ent a
fter
com
ple
tion
of p
rogr
am
39g
4.1
254
.125
5.0
001.
310
(1.2
8)
0.0
033
9g4
.815
4.8
155.
000
0.4
83(2
.74
2)
0.0
000
1
7F
or e
ach
item
, ple
ase
ind
ica
te h
ow
impo
rta
nt it
is t
o yo
u th
at it
is a
ddr
ess
ed
in
the
de
velo
pme
nt o
f a p
ost
-se
cond
ary
pr
ogr
am
in A
rizo
na40
401
7a
Ind
epe
nde
nt s
kills
40a
4.5
004
.500
5.0
000.
905
(1.3
3)
0.0
0340
a4
.800
4.8
005.
000
0.5
00(2
.60
9)
0.0
000
17
bW
ork
ski
lls40
b4
.375
4.3
754
.500
0.74
4(0
.82
)0
.009
40b
4.5
674
.567
5.00
00
.774
(1.4
34
)0
.000
0
17
cS
ocia
l ski
lls40
c4
.375
4.3
754
.000
0.51
80
.64
0.0
0640
c4
.767
4.7
675.
000
0.5
04(2
.15
3)
0.0
000
17
dF
urth
er a
cad
em
ic e
nric
hme
nt40
d3
.875
3.8
754
.000
0.99
1(0
.86
)0
.018
40d
3.8
753
.875
4.00
00
.991
(0.8
62
)0
.017
6
17
eC
ertif
ica
te,
dip
lom
a, o
r o
the
r re
cogn
ition
of c
omp
letio
n40
e4
.231
4.2
315
.000
1.30
1(1
.58
)0
.006
40e
4.1
484
.148
5.00
01
.099
(0.8
77
)0
.000
1
17f
Exp
erie
nce
sim
ilar
to a
typ
ical
co
llege
e
nvir
onm
ent
40f
3.7
693
.769
4.0
001.
481
(0.9
9)
0.0
1440
f4
.037
3.7
414.
000
0.8
54(0
.07
4)
0.0
000
17
gF
ocus
on
em
plo
ymen
t afte
r co
mpl
etio
n of
pro
gra
m4
0g4
.500
4.5
005
.000
0.79
8(1
.29
)0
.002
40g
4.6
924
.731
5.00
00
.618
(1.9
19
)0
.000
0
Yo
ung
Ad
ult
Pa
rent
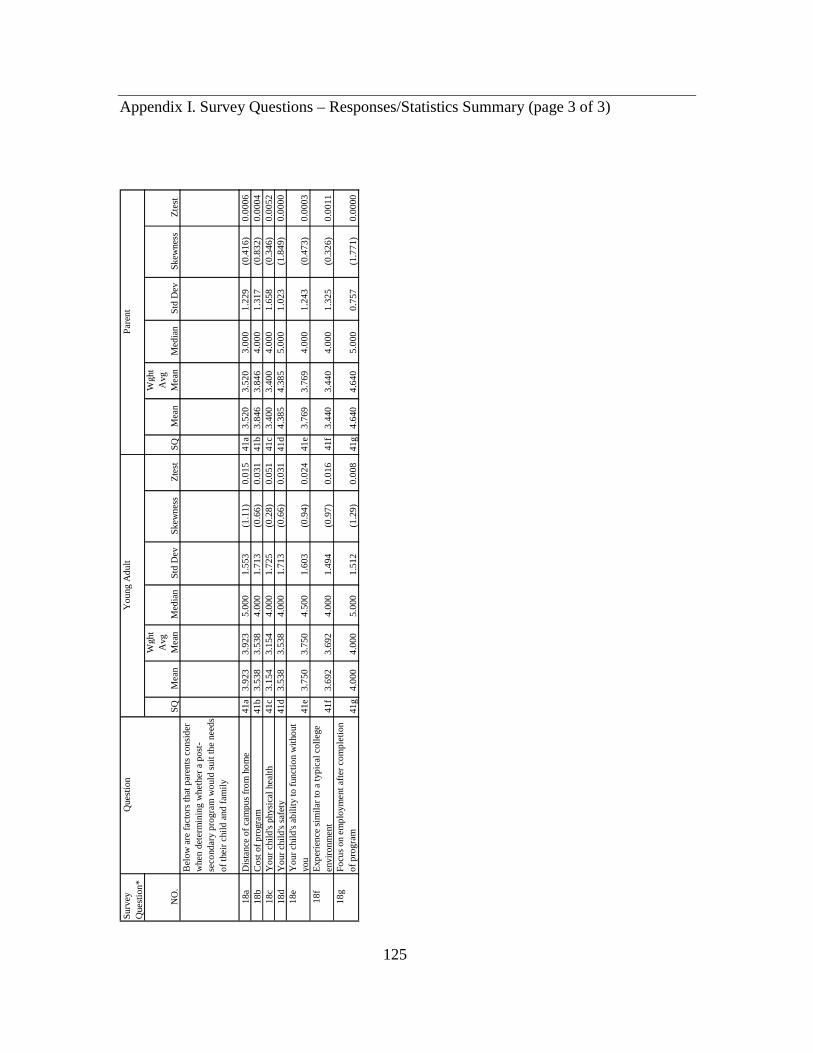
125
Appendix I. Survey Questions – Responses/Statistics Summary (page 3 of 3)
Sur
vey
Que
stio
n*
Que
stio
n
NO
.S
QM
ea
n
Wgh
t A
vg
Me
anM
edia
nS
td D
ev
Ske
wn
ess
Zte
stS
QM
ean
Wg
ht
Avg
M
ea
nM
ed
ian
Std
De
vS
kew
ness
Zte
stB
elo
w a
re fa
cto
rs th
at p
are
nts
co
nsi
de
r w
hen
det
erm
inin
g w
het
her
a p
ost
-se
cond
ary
pro
gra
m w
oul
d s
uit
the
need
s o
f th
eir
child
an
d f
amily
18
aD
ista
nce
of
cam
pu
s fr
om
ho
me
41
a3
.92
33
.92
35
.00
01
.55
3(1
.11
)0
.01
54
1a
3.5
20
3.5
20
3.0
00
1.2
29
(0.4
16
)0
.00
06
1
8b
Co
st o
f pro
gra
m4
1b
3.5
38
3.5
38
4.0
00
1.7
13
(0.6
6)
0.0
31
41
b3
.84
63
.84
64
.00
01
.31
7(0
.83
2)
0.0
00
4
18
cY
our
chi
ld's
phy
sica
l he
alth
41
c3
.15
43
.15
44
.00
01
.72
5(0
.28
)0
.05
14
1c
3.4
00
3.4
00
4.0
00
1.6
58
(0.3
46
)0
.00
52
1
8d
Yo
ur c
hild
's s
afet
y4
1d
3.5
38
3.5
38
4.0
00
1.7
13
(0.6
6)
0.0
31
41
d4
.38
54
.38
55
.00
01
.02
3(1
.84
9)
0.0
00
0
18
eY
our
chi
ld's
ab
ility
to
fun
ctio
n w
itho
ut
you
41
e3
.75
03
.75
04
.50
01
.60
3(0
.94
)0
.02
44
1e
3.7
69
3.7
69
4.0
00
1.2
43
(0.4
73
)0
.00
03
1
8f
Exp
erie
nce
sim
ilar
to a
typ
ica
l co
llege
e
nviro
nme
nt
41
f3
.69
23
.69
24
.00
01
.49
4(0
.97
)0
.01
64
1f
3.4
40
3.4
40
4.0
00
1.3
25
(0.3
26
)0
.00
11
1
8g
Fo
cus
on
em
plo
yme
nt a
fter
com
ple
tion
of
pro
gra
m4
1g
4.0
00
4.0
00
5.0
00
1.5
12
(1.2
9)
0.0
08
41
g4
.64
04
.64
05
.00
00
.75
7(1
.77
1)
0.0
00
0
Yo
ung
Ad
ult
Pa
ren
t

126
APPENDIX J
SURVEY QUESTIONS – RESPONSES/CONFIDENCE INTERVAL
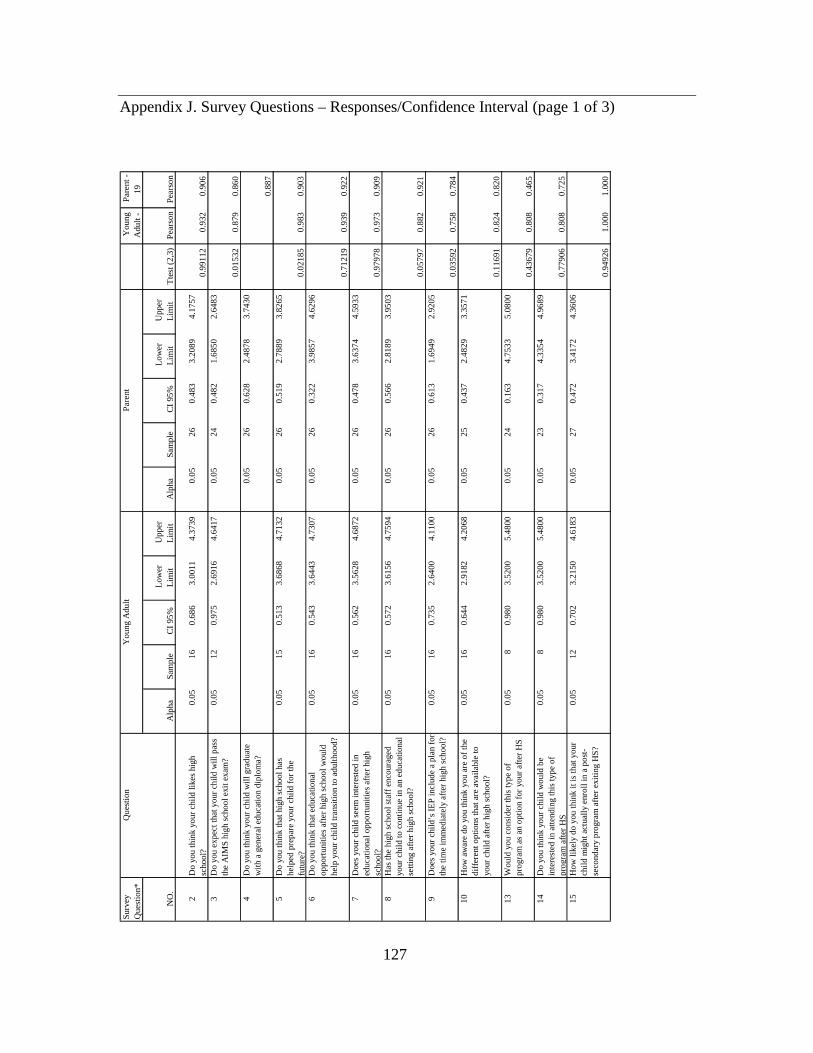
127
Appendix J. Survey Questions – Responses/Confidence Interval (page 1 of 3)
Sur
vey
Que
stio
n*Q
ues
tion
You
ng
Adu
lt -
Pa
rent
-19
NO
.A
lpha
Sam
ple
CI 9
5%
L
ower
Li
mit
Up
per
Li
mit
Alp
haS
am
ple
CI
95%
L
ow
er
Lim
it U
ppe
r Li
mit
Tte
st (
2,3
)P
ears
onP
ears
on
2D
o yo
u th
ink
your
chi
ld li
kes
high
sc
hoo
l?0
.05
1
6
0
.68
6
3.0
011
4.3
739
0
.05
26
0
.48
3
3
.2
08
9
4
.17
57
0
.99
112
0.9
32
0
.90
6
3
Do
you
exp
ect t
hat y
our
ch
ild w
ill p
ass
the
AIM
S h
igh
scho
ol e
xit
exam
?0
.05
1
2
0
.97
5
2.6
916
4.6
417
0
.05
24
0
.48
2
1
.6
85
0
2
.64
83
0.0
15
32
0
.879
0.8
60
4D
o yo
u th
ink
your
chi
ld w
ill g
rad
uate
w
ith a
ge
nera
l ed
ucat
ion
dip
lom
a?
0.0
5
2
6
0.6
28
2.4
87
8
3.7
43
0
0.8
87
5D
o yo
u th
ink
tha
t hig
h sc
hoo
l ha
s he
lpe
d p
rep
are
your
chi
ld fo
r th
e fu
ture
?
0.0
5
15
0.5
13
3
.68
68
4.
71
32
0.0
5
2
6
0.5
19
2.
78
89
3.8
26
5
0.0
21
85
0
.983
0.9
03
6D
o yo
u th
ink
tha
t ed
uca
tiona
l o
ppo
rtun
itie
s af
ter
high
sch
oo
l wo
uld
he
lp y
our
chi
ld tr
ans
itio
n to
ad
ulth
ood
?
0.0
5
16
0.5
43
3
.64
43
4.
73
07
0.0
5
2
6
0.3
22
3.
98
57
4.6
29
6
0.7
12
19
0
.939
0.9
22
7D
oes
your
chi
ld s
eem
inte
rest
ed in
ed
ucat
iona
l opp
ort
uniti
es
afte
r hi
gh
scho
ol?
0.0
5
16
0.5
62
3
.56
28
4.
68
72
0.0
5
2
6
0.4
78
3.
63
74
4.5
93
3
0.9
79
78
0
.973
0.9
09
8H
as th
e h
igh
scho
ol s
taff
enco
urag
ed
your
chi
ld to
co
ntin
ue in
an
educ
atio
nal
setti
ng a
fter
hig
h sc
hoo
l?
0.0
5
16
0.5
72
3
.61
56
4.
75
94
0.0
5
2
6
0.5
66
2.
81
89
3.9
50
3
0.0
57
97
0
.882
0.9
21
9D
oes
your
chi
ld’s
IEP
incl
ude
a p
lan
for
the
tim
e im
me
dia
tely
afte
r hi
gh s
choo
l?0
.05
1
6
0
.73
5
2.6
400
4.1
100
0
.05
26
0
.61
3
1
.6
94
9
2
.92
05
0.0
35
92
0
.758
0.7
84
10
How
aw
are
do
yo
u th
ink
you
are
of t
he
diff
eren
t op
tions
tha
t are
ava
ilabl
e to
yo
ur c
hild
afte
r h
igh
scho
ol?
0.0
5
16
0.6
44
2
.91
82
4.
20
68
0.0
5
2
5
0.4
37
2.
48
29
3.3
57
1
0.1
16
91
0
.824
0.8
20
13
Wo
uld
yo
u co
nsid
er
this
typ
e o
f p
rogr
am a
s an
op
tion
for
your
afte
r H
S0
.05
8
0
.98
0
3.5
200
5.4
800
0
.05
24
0
.16
3
4
.75
33
5.0
80
0
0.4
36
79
0
.808
0.4
65
14
Do
you
thin
k yo
ur c
hild
wo
uld
be
inte
rest
ed
in a
ttend
ing
this
typ
e o
f p
rogr
am a
fter
HS
0.0
5
8
0.9
80
3
.52
00
5
.48
00
0.0
5
2
3
0.3
17
4.3
35
4
4
.96
89
0.7
79
06
0
.808
0.7
25
15
How
like
ly d
o yo
u th
ink
it is
that
you
r ch
ild m
igh
t act
ually
enr
oll
in a
po
st-
seco
ndar
y p
rogr
am
afte
r ex
iting
HS
?
0.0
5
12
0.7
02
3
.21
50
4.
61
83
0.0
5
2
7
0.4
72
3.
41
72
4.3
60
6
0.9
49
26
1
.000
1.0
00
Pa
rent
Yo
ung
Adu
lt
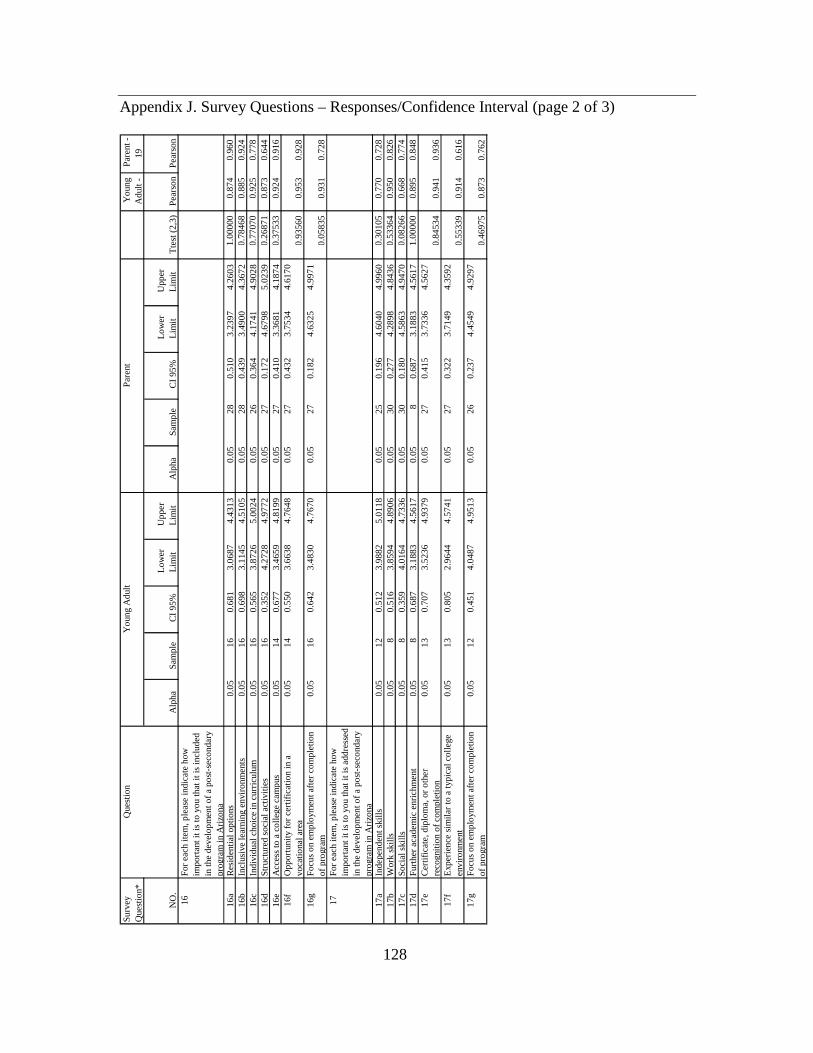
128
Appendix J. Survey Questions – Responses/Confidence Interval (page 2 of 3)
Su
rvey
Q
uest
ion*
Que
stio
n Y
oun
g A
dul
t -
Par
ent
-1
9
NO
.A
lph
aS
amp
le C
I 9
5%
L
ow
er
Lim
it U
pp
er
Lim
it A
lpha
Sa
mp
le C
I 9
5%
L
ow
er
Lim
it U
pp
er
Lim
it T
test
(2
,3)
Pe
ars
on
Pe
arso
n1
6F
or
ea
ch it
em,
ple
ase
ind
ica
te h
ow
im
po
rta
nt it
is to
yo
u th
at it
is in
clud
ed
in
the
de
velo
pm
en
t of a
po
st-s
eco
nda
ry
pro
gra
m in
Ari
zona
16
aR
esi
den
tial o
ptio
ns0
.05
16
0.6
81
3
.06
87
4
.43
13
0
.05
28
0.5
10
3
.23
97
4
.26
03
1
.00
00
0
0
.87
4
0
.96
0
1
6b
Incl
usiv
e le
arn
ing
en
viro
nme
nts
0.0
5
1
6
0
.69
8
3.1
14
5
4.5
10
5
0.0
5
2
8
0
.43
9
3.4
90
0
4.3
67
2
0.7
84
68
0.8
85
0.9
24
16
cIn
div
idu
al c
hoic
e in
cu
rric
ulu
m0
.05
16
0.5
65
3
.87
26
5
.00
24
0
.05
26
0.3
64
4
.17
41
4
.90
28
0
.77
07
0
0
.92
5
0
.77
8
1
6d
Str
uctu
red
so
cial
act
iviti
es
0.0
5
1
6
0
.35
2
4.2
72
8
4.9
77
2
0.0
5
2
7
0
.17
2
4.6
79
8
5.0
23
9
0.2
68
71
0.8
73
0.6
44
16
eA
cces
s to
a c
olle
ge
cam
pus
0.0
5
1
4
0
.67
7
3.4
65
9
4.8
19
9
0.0
5
2
7
0
.41
0
3.3
68
1
4.1
87
4
0.3
75
33
0.9
24
0.9
16
16
fO
pp
ort
unity
for
cert
ifica
tion
in a
vo
catio
nal a
rea
0.0
5
1
4
0.5
50
3.6
63
8
4
.76
48
0
.05
27
0
.43
2
3
.7
53
4
4
.61
70
0
.93
56
0
0
.95
3
0
.92
8
1
6g
Fo
cus
on
emp
loym
en
t afte
r co
mp
letio
n
of
pro
gram
0.0
5
1
6
0.6
42
3.4
83
0
4
.76
70
0
.05
27
0
.18
2
4
.6
32
5
4
.99
71
0
.05
83
5
0
.93
1
0
.72
8
1
7F
or
ea
ch it
em,
ple
ase
ind
ica
te h
ow
im
po
rta
nt it
is to
yo
u th
at it
is a
dd
ress
ed
in
the
de
velo
pm
en
t of a
po
st-s
eco
nda
ry
pro
gra
m in
Ari
zona
17
aIn
de
pe
nd
ent
skill
s0
.05
12
0.5
12
3
.98
82
5
.01
18
0
.05
25
0.1
96
4
.60
40
4
.99
60
0
.30
10
5
0
.77
0
0
.72
8
1
7b
Wo
rk s
kills
0.0
5
8
0
.51
6
3.8
59
4
4.8
90
6
0.0
5
3
0
0
.27
7
4.2
89
8
4.8
43
6
0.5
33
64
0.9
50
0.8
26
17
cS
oci
al s
kills
0.0
5
8
0
.35
9
4.0
16
4
4.7
33
6
0.0
5
3
0
0
.18
0
4.5
86
3
4.9
47
0
0.0
82
66
0.6
68
0.7
74
17
dF
urt
her
aca
de
mic
en
rich
me
nt
0.0
5
8
0
.68
7
3.1
88
3
4.5
61
7
0.0
5
8
0
.68
7
3.1
88
3
4.5
61
7
1.0
00
00
0.8
95
0.8
48
17
eC
ert
ifica
te,
dip
lom
a,
or
oth
er
reco
gni
tion
of c
om
ple
tion
0.0
5
1
3
0.7
07
3.5
23
6
4
.93
79
0
.05
27
0
.41
5
3
.7
33
6
4
.56
27
0
.84
53
4
0
.94
1
0
.93
6
1
7f
Exp
eri
ence
sim
ilar
to a
typ
ical
co
llege
e
nviro
nme
nt0
.05
13
0
.80
5
2
.96
44
4.5
74
1
0.0
5
2
7
0.3
22
3.
71
49
4.3
59
2
0.5
53
39
0.9
14
0.6
16
17
gF
ocu
s o
n em
plo
yme
nt a
fter
com
ple
tion
o
f p
rogr
am0
.05
12
0
.45
1
4
.04
87
4.9
51
3
0.0
5
2
6
0.2
37
4.
45
49
4.9
29
7
0.4
69
75
0.8
73
0.7
62
Yo
ung
Ad
ult
Par
ent
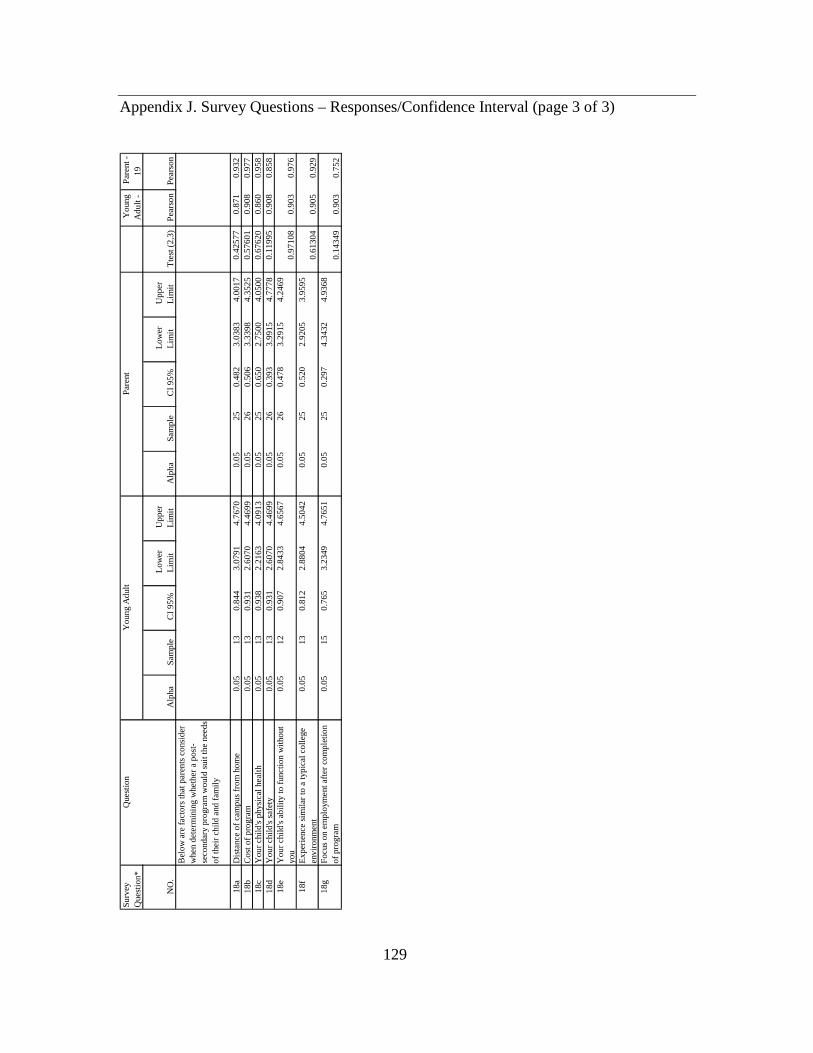
129
Appendix J. Survey Questions – Responses/Confidence Interval (page 3 of 3)
Su
rvey
Q
uest
ion*
Que
stio
n Y
oun
g
Ad
ult
- P
are
nt -
19
NO
.A
lpha
Sa
mp
le C
I 95
%
Lo
we
r L
imit
Up
per
Li
mit
Alp
ha
Sa
mp
le C
I 95
%
Lo
wer
Li
mit
Up
pe
r Li
mit
Tte
st (
2,3
)P
ears
on
Pe
ars
on
Bel
ow
are
fact
ors
tha
t pa
ren
ts c
ons
ider
w
hen
de
term
inin
g w
heth
er
a p
ost
-se
cond
ary
pro
gra
m w
oul
d s
uit t
he
nee
ds
of t
heir
ch
ild a
nd fa
mily
18
aD
ista
nce
of c
am
pus
fro
m h
om
e0
.05
13
0.8
44
3
.07
91
4
.76
70
0
.05
25
0.4
82
3
.03
83
4.0
01
7
0.4
25
77
0.8
71
0.9
32
18
bC
ost
of p
rog
ram
0.0
5
1
3
0
.93
1
2.6
07
0
4.4
69
9
0.0
5
2
6
0
.50
6
3.3
398
4
.35
25
0
.57
60
1
0
.90
8
0
.97
7
1
8c
Yo
ur
child
's p
hysi
cal h
eal
th0
.05
13
0.9
38
2
.21
63
4
.09
13
0
.05
25
0.6
50
2
.75
00
4.0
50
0
0.6
76
20
0.8
60
0.9
58
18
dY
ou
r ch
ild's
sa
fety
0.0
5
1
3
0
.93
1
2.6
07
0
4.4
69
9
0.0
5
2
6
0
.39
3
3.9
915
4
.77
78
0
.11
99
5
0
.90
8
0
.85
8
1
8e
Yo
ur
child
's a
bili
ty to
func
tion
with
out
yo
u0
.05
12
0
.90
7
2
.84
33
4.6
56
7
0.0
5
2
6
0.4
78
3.
29
15
4
.24
69
0
.97
10
8
0
.90
3
0
.97
6
1
8f
Exp
erie
nce
sim
ilar
to a
typ
ica
l co
llege
e
nvir
onm
ent
0.0
5
1
3
0.8
12
2.8
80
4
4
.50
42
0
.05
25
0
.52
0
2
.9
205
3.9
59
5
0.6
13
04
0.9
05
0.9
29
18
gF
ocu
s o
n e
mp
loym
ent
afte
r co
mp
letio
n o
f pro
gra
m0
.05
15
0
.76
5
3
.23
49
4.7
65
1
0.0
5
2
5
0.2
97
4.
34
32
4
.93
68
0
.14
34
9
0
.90
3
0
.75
2
Yo
ung
Ad
ult
Par
ent

130
APPENDIX K
SURVEY QUESTIONS

131
Appendix K. Survey Questions (page 1 of 3).
Survey Question Question Current Study
Young Adult
Parent
1 19 24 Which one of the following best describes your child’s most recent school setting?
2 20 25 Do you think your child likes high school?
3 21 26 Do you expect that your child will pass the AIMS high school exit exam?
4 n/a 27 Do you think your child will graduate with a general education diploma?
5 22 28 Do you think that high school has helped prepare your child for the future?
6 23 29 Do you think that educational opportunities after high school would help your child transition to adulthood?
7 24 30 Does your child seem interested in educational opportunities after high school?
8 25 31 Has the high school staff encouraged your child to continue in an educational setting after high school?
9 26 32 Does your child’s IEP include a plan for the time immediately after high school?
10 27 33 How aware do you think you are of the different options that are available to your child after high school?
11 28 34 How do you learn about the available options? Choose all that apply.
12 35 35 What barriers, if any, have you encountered in trying to understand all of the options available to your child? Choose all that apply.
13 36 36 Would you consider this type of program as an option for your after HS
14 37 37 Do you think your child would be interested in attending this type of program after HS?
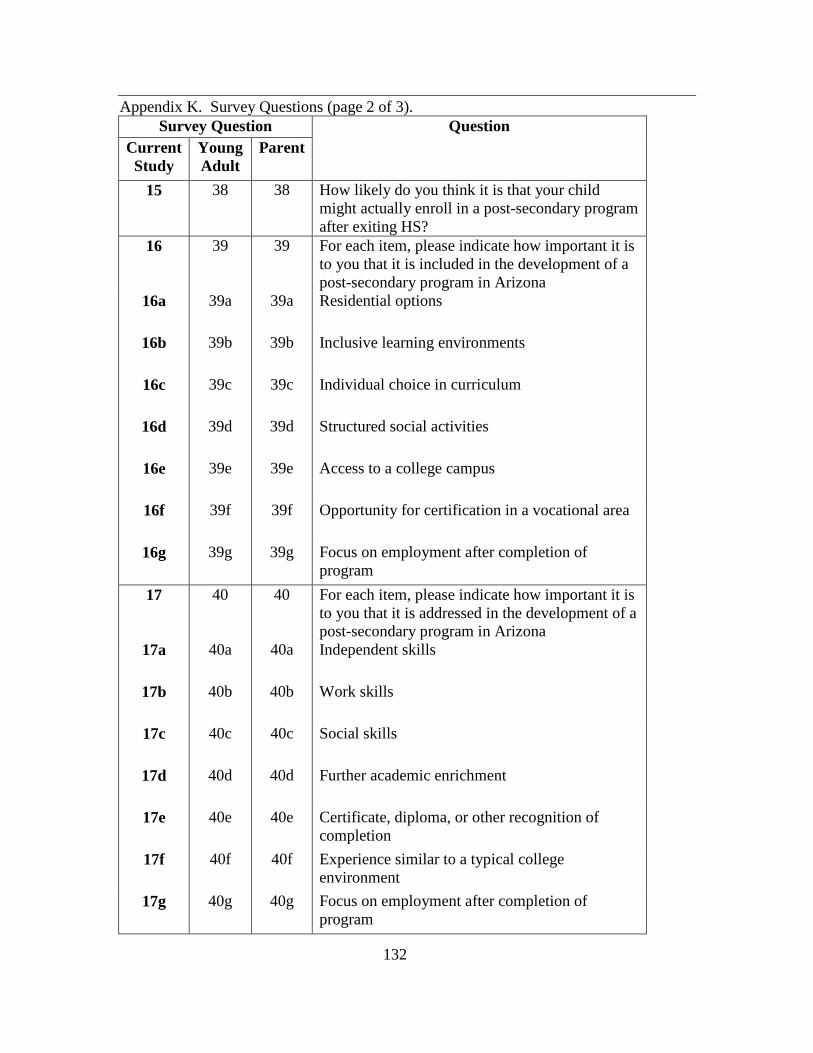
132
Appendix K. Survey Questions (page 2 of 3). Survey Question Question
Current Study
Young Adult
Parent
15 38 38 How likely do you think it is that your child might actually enroll in a post-secondary program after exiting HS?
16 39 39 For each item, please indicate how important it is to you that it is included in the development of a post-secondary program in Arizona
16a 39a 39a Residential options
16b 39b 39b Inclusive learning environments
16c 39c 39c Individual choice in curriculum
16d 39d 39d Structured social activities
16e 39e 39e Access to a college campus
16f 39f 39f Opportunity for certification in a vocational area
16g 39g 39g Focus on employment after completion of program
17 40 40 For each item, please indicate how important it is to you that it is addressed in the development of a post-secondary program in Arizona
17a 40a 40a Independent skills
17b 40b 40b Work skills
17c 40c 40c Social skills
17d 40d 40d Further academic enrichment
17e 40e 40e Certificate, diploma, or other recognition of completion
17f 40f 40f Experience similar to a typical college environment
17g 40g 40g Focus on employment after completion of program
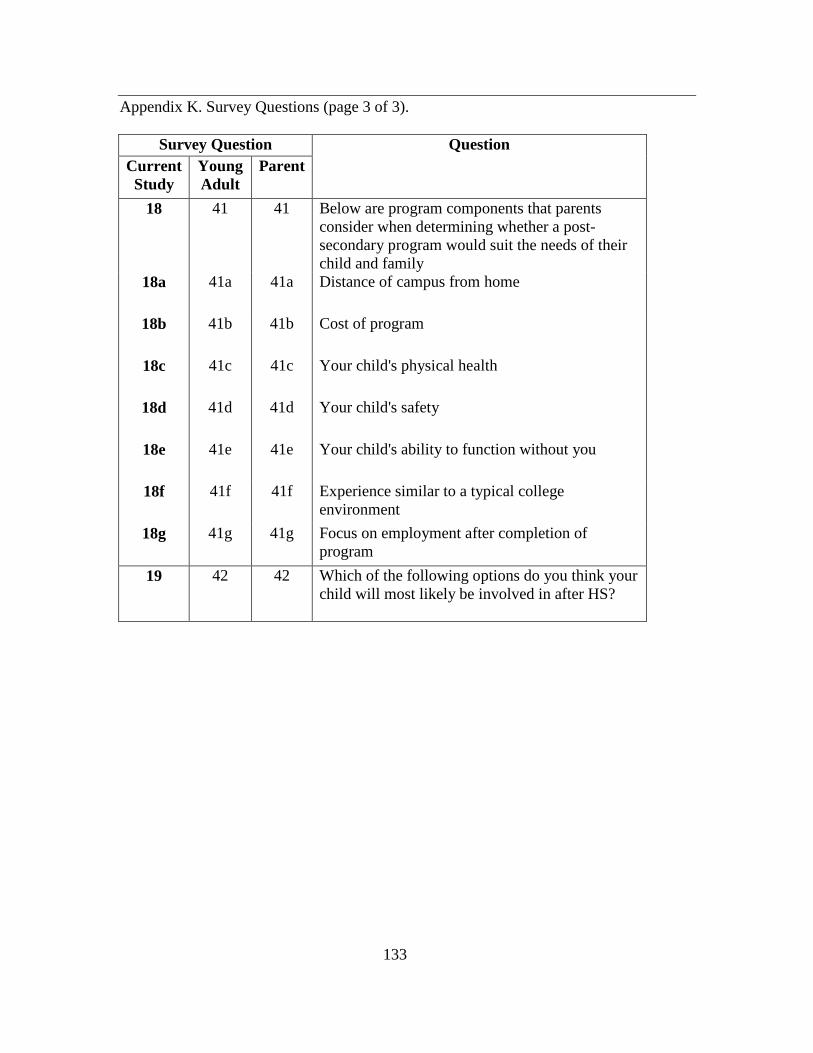
133
Appendix K. Survey Questions (page 3 of 3).
Survey Question Question Current Study
Young Adult
Parent
18 41 41 Below are program components that parents consider when determining whether a post-secondary program would suit the needs of their child and family
18a 41a 41a Distance of campus from home
18b 41b 41b Cost of program
18c 41c 41c Your child's physical health
18d 41d 41d Your child's safety
18e 41e 41e Your child's ability to function without you
18f 41f 41f Experience similar to a typical college environment
18g 41g 41g Focus on employment after completion of program
19 42 42 Which of the following options do you think your child will most likely be involved in after HS?

134
APPENDIX L
PROGRAMMATIC NEEDS ASSESSMENT – CORRELATION STATISTICS

135
Appendix L. Programmatic Needs Assessment – Correlation Statistics (page 1 of 2)
Sur
vey
Que
stio
nY
A/P
AR
EA
Que
stio
n C
orre
latio
n 1
23
45
12
34
5N
o/N
ot a
t A
llS
omew
hat/
May
beY
es/V
ery
Tot
alN
o/N
ot
at A
llS
omew
hat/
May
beY
es/V
ery
Tot
alS
tud
v P
aren
t16
.39
For
eac
h ite
m, p
leas
e in
dica
te h
ow im
port
ant i
t is
to
you
that
it is
incl
uded
in th
e de
velo
pmen
t of a
pos
t-se
cond
ary
prog
ram
in A
rizon
a16
a.E
Res
iden
tial o
ptio
ns2
05
27
16.0
0
3
19
213
28.0
0
0.98
15
0.1
3
-
0
.31
0
.13
0.
44
1.0
0
0.1
1
0.0
4
0
.32
0
.07
0
.46
1
.00
16b.
EIn
clus
ive
lear
ning
env
ironm
ents
20
51
816
.00
20
86
1228
.00
0.
9027
0
.13
-
0.3
1
0.0
6
0.50
1
.00
0
.07
-
0
.29
0
.21
0
.43
1
.00
16c.
EIn
divi
dual
cho
ice
in c
urric
ulum
10
21
1216
.00
02
22
2026
.00
0.
9844
0
.06
-
0.1
3
0.0
6
0.75
1
.00
-
0.0
8
0
.08
0
.08
0
.77
1
.00
16d.
ES
truc
ture
d so
cial
act
iviti
es0
02
212
16.0
0
0
01
224
27.0
0
0.99
12
-
-
0.1
3
0.1
3
0.75
1
.00
-
-
0.0
4
0.0
7
0.8
9
1.0
0
16e.
EA
cces
s to
a c
olle
ge c
ampu
s1
11
38
14.0
0
0
310
410
27.0
0
0.54
46
0.0
7
0.0
7
0.0
7
0.2
1
0.57
1
.00
-
0.1
1
0
.37
0
.15
0
.37
1
.00
16f.
OC
/OP
Opp
ortu
nity
for
cert
ifica
tion
in a
voc
atio
nal a
rea
01
32
814
.00
12
36
1527
.00
0.
9519
-
0.0
7
0.2
1
0.1
4
0.57
1
.00
0
.04
0
.07
0.1
1
0.2
2
0.5
6
1.0
0
16g.
OC
/OP
Foc
us o
n em
ploy
men
t afte
r co
mpl
etio
n of
pro
gram
11
31
1016
.00
00
13
2327
.00
0.
9675
0
.06
0
.06
0
.19
0
.06
0.
63
1.0
0
-
-
0
.04
0
.11
0
.85
1
.00
17.
40F
or e
ach
item
, ple
ase
indi
cate
how
impo
rtan
t it i
s to
yo
u th
at it
is a
ddre
ssed
in th
e de
velo
pmen
t of a
pos
t-se
cond
ary
prog
ram
in A
rizon
a17
a.O
PIn
depe
nden
t ski
lls0
03
09
12.0
0
0
01
321
25.0
0
0.93
45
-
-
0.2
5
-
0.7
5
1
.00
-
-
0.0
4
0.1
2
0.8
4
1.0
0
17b.
OP
Wor
k sk
ills
00
13
48.
00
00
53
2230
.00
0.
8084
-
-
0
.13
0
.38
0.
50
1.0
0
-
-
0
.17
0
.10
0
.73
1
.00
17c.
OP
Soc
ial s
kills
00
05
38.
00
00
15
2430
.00
0.
5181
-
-
-
0.6
3
0.38
1
.00
-
-
0.0
3
0.1
7
0.8
0
1.0
0
17d.
OP
Fur
ther
aca
dem
ic e
nric
hmen
t0
11
42
8.00
0
11
42
8.00
1.00
00
-
0
.13
0
.13
0
.50
0.
25
1.0
0
-
0
.13
0.1
3
0.5
0
0.2
5
1.0
0
17e.
OC
/OP
Cer
tific
ate,
dip
lom
a, o
r ot
her
reco
gniti
on o
f co
mpl
etio
n1
03
09
13.0
0
0
35
415
27.0
0
0.92
83
0.0
8
-
0
.23
-
0
.69
1.0
0
-
0
.11
0.1
9
0.1
5
0.5
6
1.0
0
ST
UD
EN
T R
ES
PO
NS
EP
AR
EN
T R
ES
PO
NS
E
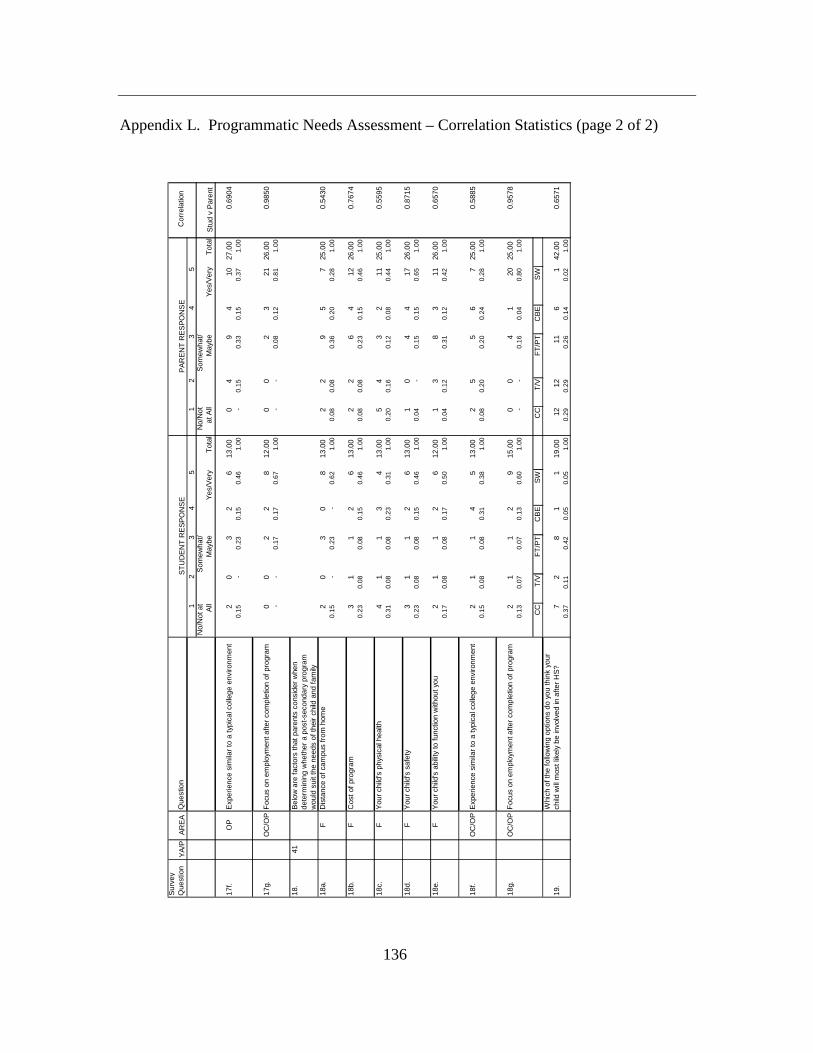
136
Appendix L. Programmatic Needs Assessment – Correlation Statistics (page 2 of 2)
Sur
vey
Que
stio
nY
A/P
AR
EA
Que
stio
n C
orre
latio
n 1
23
45
12
34
5N
o/N
ot a
t A
llS
omew
hat/
May
beY
es/V
ery
Tot
alN
o/N
ot
at A
llS
omew
hat/
May
beY
es/V
ery
Tot
alS
tud
v P
aren
t
17f.
OP
Exp
erie
nce
sim
ilar
to a
typi
cal c
olle
ge e
nviro
nmen
t2
03
26
13.0
0
0
49
410
27.0
0
0.69
04
0.1
5
-
0
.23
0
.15
0.
46
1.0
0
-
0
.15
0.3
3
0.1
5
0.3
7
1.0
0
17g.
OC
/OP
Foc
us o
n em
ploy
men
t afte
r co
mpl
etio
n of
pro
gram
00
22
812
.00
00
23
2126
.00
0.
9850
-
-
0
.17
0
.17
0.
67
1.0
0
-
-
0
.08
0
.12
0
.81
1
.00
18.
41B
elow
are
fac
tors
that
par
ents
con
side
r w
hen
dete
rmin
ing
whe
ther
a p
ost-
seco
ndar
y pr
ogra
m
wou
ld s
uit t
he n
eeds
of t
heir
child
and
fam
ily18
a.F
Dis
tanc
e of
cam
pus
from
hom
e2
03
08
13.0
0
2
29
57
25.0
0
0.54
30
0.1
5
-
0
.23
-
0
.62
1.0
0
0.0
8
0.0
8
0
.36
0
.20
0
.28
1
.00
18b.
FC
ost o
f pr
ogra
m3
11
26
13.0
0
2
26
412
26.0
0
0.76
74
0.2
3
0.0
8
0.0
8
0.1
5
0.46
1
.00
0
.08
0
.08
0.2
3
0.1
5
0.4
6
1.0
0
18c.
FY
our
child
's p
hysi
cal h
ealth
41
13
413
.00
54
32
1125
.00
0.
5595
0
.31
0
.08
0
.08
0
.23
0.
31
1.0
0
0.2
0
0.1
6
0
.12
0
.08
0
.44
1
.00
18d.
FY
our
child
's s
afet
y3
11
26
13.0
0
1
04
417
26.0
0
0.87
15
0.2
3
0.0
8
0.0
8
0.1
5
0.46
1
.00
0
.04
-
0
.15
0
.15
0
.65
1
.00
18e.
FY
our
child
's a
bilit
y to
func
tion
with
out y
ou2
11
26
12.0
0
1
38
311
26.0
0
0.65
70
0.1
7
0.0
8
0.0
8
0.1
7
0.50
1
.00
0
.04
0
.12
0.3
1
0.1
2
0.4
2
1.0
0
18f.
OC
/OP
Exp
erie
nce
sim
ilar
to a
typi
cal c
olle
ge e
nviro
nmen
t2
11
45
13.0
0
2
55
67
25.0
0
0.58
85
0.1
5
0.0
8
0.0
8
0.3
1
0.38
1
.00
0
.08
0
.20
0.2
0
0.2
4
0.2
8
1.0
0
18g.
OC
/OP
Foc
us o
n em
ploy
men
t afte
r co
mpl
etio
n of
pro
gram
21
12
915
.00
00
41
2025
.00
0.
9578
0
.13
0
.07
0
.07
0
.13
0.
60
1.0
0
-
-
0
.16
0
.04
0
.80
1
.00
CC
T/V
FT
/PT
CB
ES
WC
CT
/VF
T/P
TC
BE
SW
19.
Whi
ch o
f the
follo
win
g op
tions
do
you
thin
k yo
ur
child
will
mos
t lik
ely
be in
volv
ed in
afte
r H
S?
72
81
119
.00
1212
116
142
.00
0.
6571
0
.37
0
.11
0
.42
0
.05
0.
05
1.0
0
0.2
9
0.2
9
0
.26
0
.14
0
.02
1
.00
ST
UD
EN
T R
ES
PO
NS
EP
AR
EN
T R
ES
PO
NS
E

137
APPENDIX M
PROGRAMMATIC NEEDS ASSESSMENT – PEARSON’S ANALYSIS

138
Appendix M. Programmatic Needs Assessment – Pearson’s Analysis (page 1 of 2) Survey Question YA/P AREA Question
YA20 YA21 YA22 YA23 YA24 YA38
16. 39 For each item, please indicate how important it is to you that it is included in the development of a post-secondary program in Arizona
16a. E Residential options 0.8136 0.7279 0.7933 0.7322 0.7714 0.9059
16b. E Inclusive learning environments 0.8599 0.7503 0.8094 0.7552 0.7317 0.8469 0.8599 0.7503 0.8094 0.7552 0.7317 0.8469
16c. E Individual choice in curriculum 0.9197 0.8871 0.9368 0.9383 0.8546 0.8154 0.9197 0.8871 0.9368 0.9383 0.8546 0.8154
16d. E Structured social activities 0.9290 0.8566 0.9719 0.9726 0.9133 0.8584 0.9290 0.8566 0.9719 0.9726 0.9133 0.8584
16e. E Access to a college campus 0.8420 0.8736 0.9415 0.9687 0.9336 0.8203 0.8420 0.8736 0.9415 0.9687 0.9336 0.8203
16f. OC/OP Opportunity for certification in a vocational area 0.9685 0.7462 0.9886 0.9668 0.9092 0.8812 0.9685 0.7462 0.9886 0.9668 0.9092 0.8812
16g. OC/OP Focus on employment after completion of program 0.9588 0.8245 0.9462 0.9336 0.8301 0.8092 0.9588 0.8245 0.9462 0.9336 0.8301 0.8092
17. 40 For each item, please indicate how important it is to you that it is addressed in the development of a post-secondary program in Arizona
17a. OP Independent skills 0.9651 0.7829 0.9354 0.9081 0.8144 0.8262 0.9651 0.7829 0.9354 0.9081 0.8144 0.8262
17b. OP Work skills 0.6724 0.7054 0.8515 0.8610 0.9835 0.9037 0.6724 0.7054 0.8515 0.8610 0.9835 0.9037
17c. OP Social skills 0.2090 0.4151 0.4781 0.5207 0.7395 0.6016 0.2090 0.4151 0.4781 0.5207 0.7395 0.6016
17d. OP Further academic enrichment 0.1342 0.1289 0.3825 0.4048 0.6224 0.4905 0.1342 0.1289 0.3825 0.4048 0.6224 0.4905
17e. OC/OPCertificate, diploma, or other recognition of completion 0.9347 0.8270 0.9007 0.8775 0.7845 0.8072
0.9347 0.8270 0.9007 0.8775 0.7845 0.8072
YOUNG ADULTPearsonT
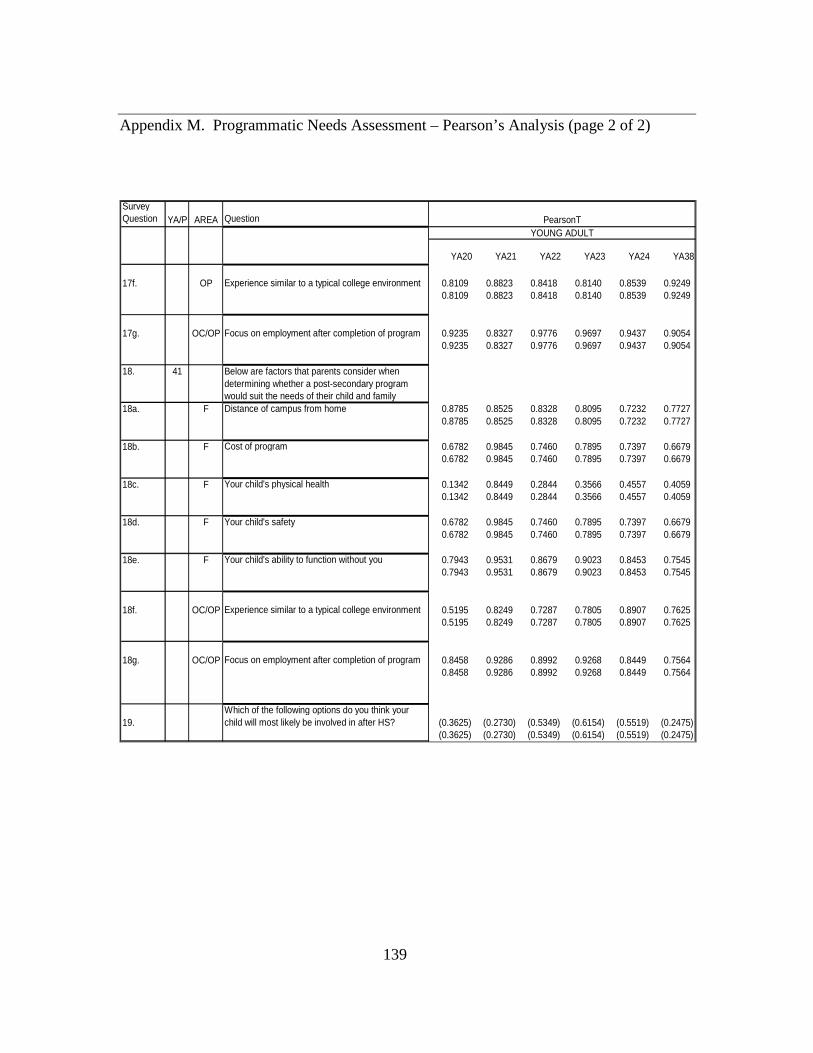
139
Appendix M. Programmatic Needs Assessment – Pearson’s Analysis (page 2 of 2)
Survey Question YA/P AREA Question
YA20 YA21 YA22 YA23 YA24 YA38
17f. OP Experience similar to a typical college environment 0.8109 0.8823 0.8418 0.8140 0.8539 0.9249 0.8109 0.8823 0.8418 0.8140 0.8539 0.9249
17g. OC/OP Focus on employment after completion of program 0.9235 0.8327 0.9776 0.9697 0.9437 0.9054 0.9235 0.8327 0.9776 0.9697 0.9437 0.9054
18. 41 Below are factors that parents consider when determining whether a post-secondary program would suit the needs of their child and family
18a. F Distance of campus from home 0.8785 0.8525 0.8328 0.8095 0.7232 0.7727 0.8785 0.8525 0.8328 0.8095 0.7232 0.7727
18b. F Cost of program 0.6782 0.9845 0.7460 0.7895 0.7397 0.6679 0.6782 0.9845 0.7460 0.7895 0.7397 0.6679
18c. F Your child's physical health 0.1342 0.8449 0.2844 0.3566 0.4557 0.4059 0.1342 0.8449 0.2844 0.3566 0.4557 0.4059
18d. F Your child's safety 0.6782 0.9845 0.7460 0.7895 0.7397 0.6679 0.6782 0.9845 0.7460 0.7895 0.7397 0.6679
18e. F Your child's ability to function without you 0.7943 0.9531 0.8679 0.9023 0.8453 0.7545 0.7943 0.9531 0.8679 0.9023 0.8453 0.7545
18f. OC/OP Experience similar to a typical college environment 0.5195 0.8249 0.7287 0.7805 0.8907 0.7625 0.5195 0.8249 0.7287 0.7805 0.8907 0.7625
18g. OC/OP Focus on employment after completion of program 0.8458 0.9286 0.8992 0.9268 0.8449 0.7564 0.8458 0.9286 0.8992 0.9268 0.8449 0.7564
19.Which of the following options do you think your child will most likely be involved in after HS? (0.3625) (0.2730) (0.5349) (0.6154) (0.5519) (0.2475)
(0.3625) (0.2730) (0.5349) (0.6154) (0.5519) (0.2475)
PearsonTYOUNG ADULT